1. Introduction
One of the main environmental problems in large urban centers is the deterioration of air quality [
1], related to industrialization and urbanization. The Metropolitan Area of São Paulo (MASP), composed of 39 cities, with a population of approximately 21 million people, and concentrating 48% of the vehicle fleet of the State of São Paulo, is an example of a region that experiences this environmental problem on a daily basis [
2].
Episodes of lapses in air-quality standards may be caused by the intensification of emission sources and the occurrence of weather conditions unfavorable to the dispersion of air pollutants. Thus, the weather conditions affect air quality, influencing the dispersion of pollutants, because they are responsible for the transport of, and provide the conditions for chemical reactions of, pollutants. Some seasons are more susceptible to the accumulation of concentrations of certain pollutants. In the MASP, high concentrations of particulate matter (PM) are more frequent in the austral winter, a season characterized by thermal inversions, atmospheric stability, and weather conditions unfavorable to pollution dispersion [
3]. This season in the MASP is also characterized by the influence of a semi-stationary system of high surface pressure, the South Atlantic Subtropical High (SASH), that contributes to the occurrence of periods of drought [
4]. Thus, this study aims to identify and characterize persistent exceedance episodes (PEE) due to inhalable particulate matter (PM
10) in the MASP between 2005 and 2017, relating them to synoptic situations.
2. Data and Method
For the present study, hourly data of concentrations of the atmospheric pollutants CO, PM10, PM2.5 (fine-mode particle matter), NO2, O3, and SO2, monitored by Companhia Ambiental do Estado de São Paulo(CETESB) between 2005 and 2017 were used. Depending on their location and data availability,10 CETESB automatic monitoring stations were selected in the MASP: Diadema, Ibirapuera, Mauá, Osasco, Parque Dom Pedro II, Pinheiros, Santana, Santo Amaro, São Caetano do Sul, andTaboão da Serra. Data from the following surface weather variables were used: daily maximum temperature (T), relative humidity (RH), pressure (P), wind speed (WS), wind direction (WD), and solar radiation (SR), from the meteorological station of the Instituto de Astronomia, Geofísica e Ciências Atmosféricas of University of São Paulo (IAG/USP).
The hourly pollutant concentration database was reduced to a daily database, by calculating the maximum moving average value for each day. The period used to calculate the moving average varies from one pollutant to another, according to procedures established by the WHO (World Health Organization) (
Table 1). The time series of meteorological variables were also reduced, calculating daily averages and maximums of T, P, and WS.
The following criteria have been used to define and identify PEE: (i) events that occurred at least in 50% of the air-quality monitoring stations chosen for this study (being 10 stations in total) and, (ii) among the events that met the first criterion, those with a duration equal to or greater than five days, which correspond to the 80% percentile of the event duration distribution. A total 71 PEE were selected.
3. Results
Considering the daily database between 2005 and 2017, using the WHO air-quality standard and the previously mentioned criteria for the identification of PEE, 71 events were identified. It was observed that the maximum concentration of PM10 during the episodes occurred in the final days of such persistent events, suggesting a progressive increase of pollution. Thus, such days of maximum concentration were defined in this study as peak days.
To determine the average behavior of pollutants and surface weather variables during the temporal evolution of persistent episodes, days before the beginning of the events, peak days (days of maximum concentration of PM
10) and days after the end of the events were considered.
Figure 1 shows the average behavior of pollutants associated with persistent events. For peak days, there was an increase in the concentrations of all pollutants, but with variable intensity. In the previous days, PM
10 already reached some concentration records above the standard recommended by the WHO (50 μg m
−3). On peak days this situation worsened, so that its median increased by 60%, and was above the WHO standard.
PM2.5 showed a behavior similar to PM10.In the previous days, concentrations above the WHO standard were already observed, worsening the situation on peak days, with an increase of PM2.5median by approximately 66%, above the WHO standard. The concentrations of the pollutants SO2, NO2, and CO increased during the selected events but remained within the WHO standard in most cases. Among these pollutants, it can be observed that SO2 was the least altered, since its median concentration increased by only 30% during the events. For the O3 concentrations there was an increase of its median on peak days, but in the three periods analyzed, most of its observations remained below the WHO standard.
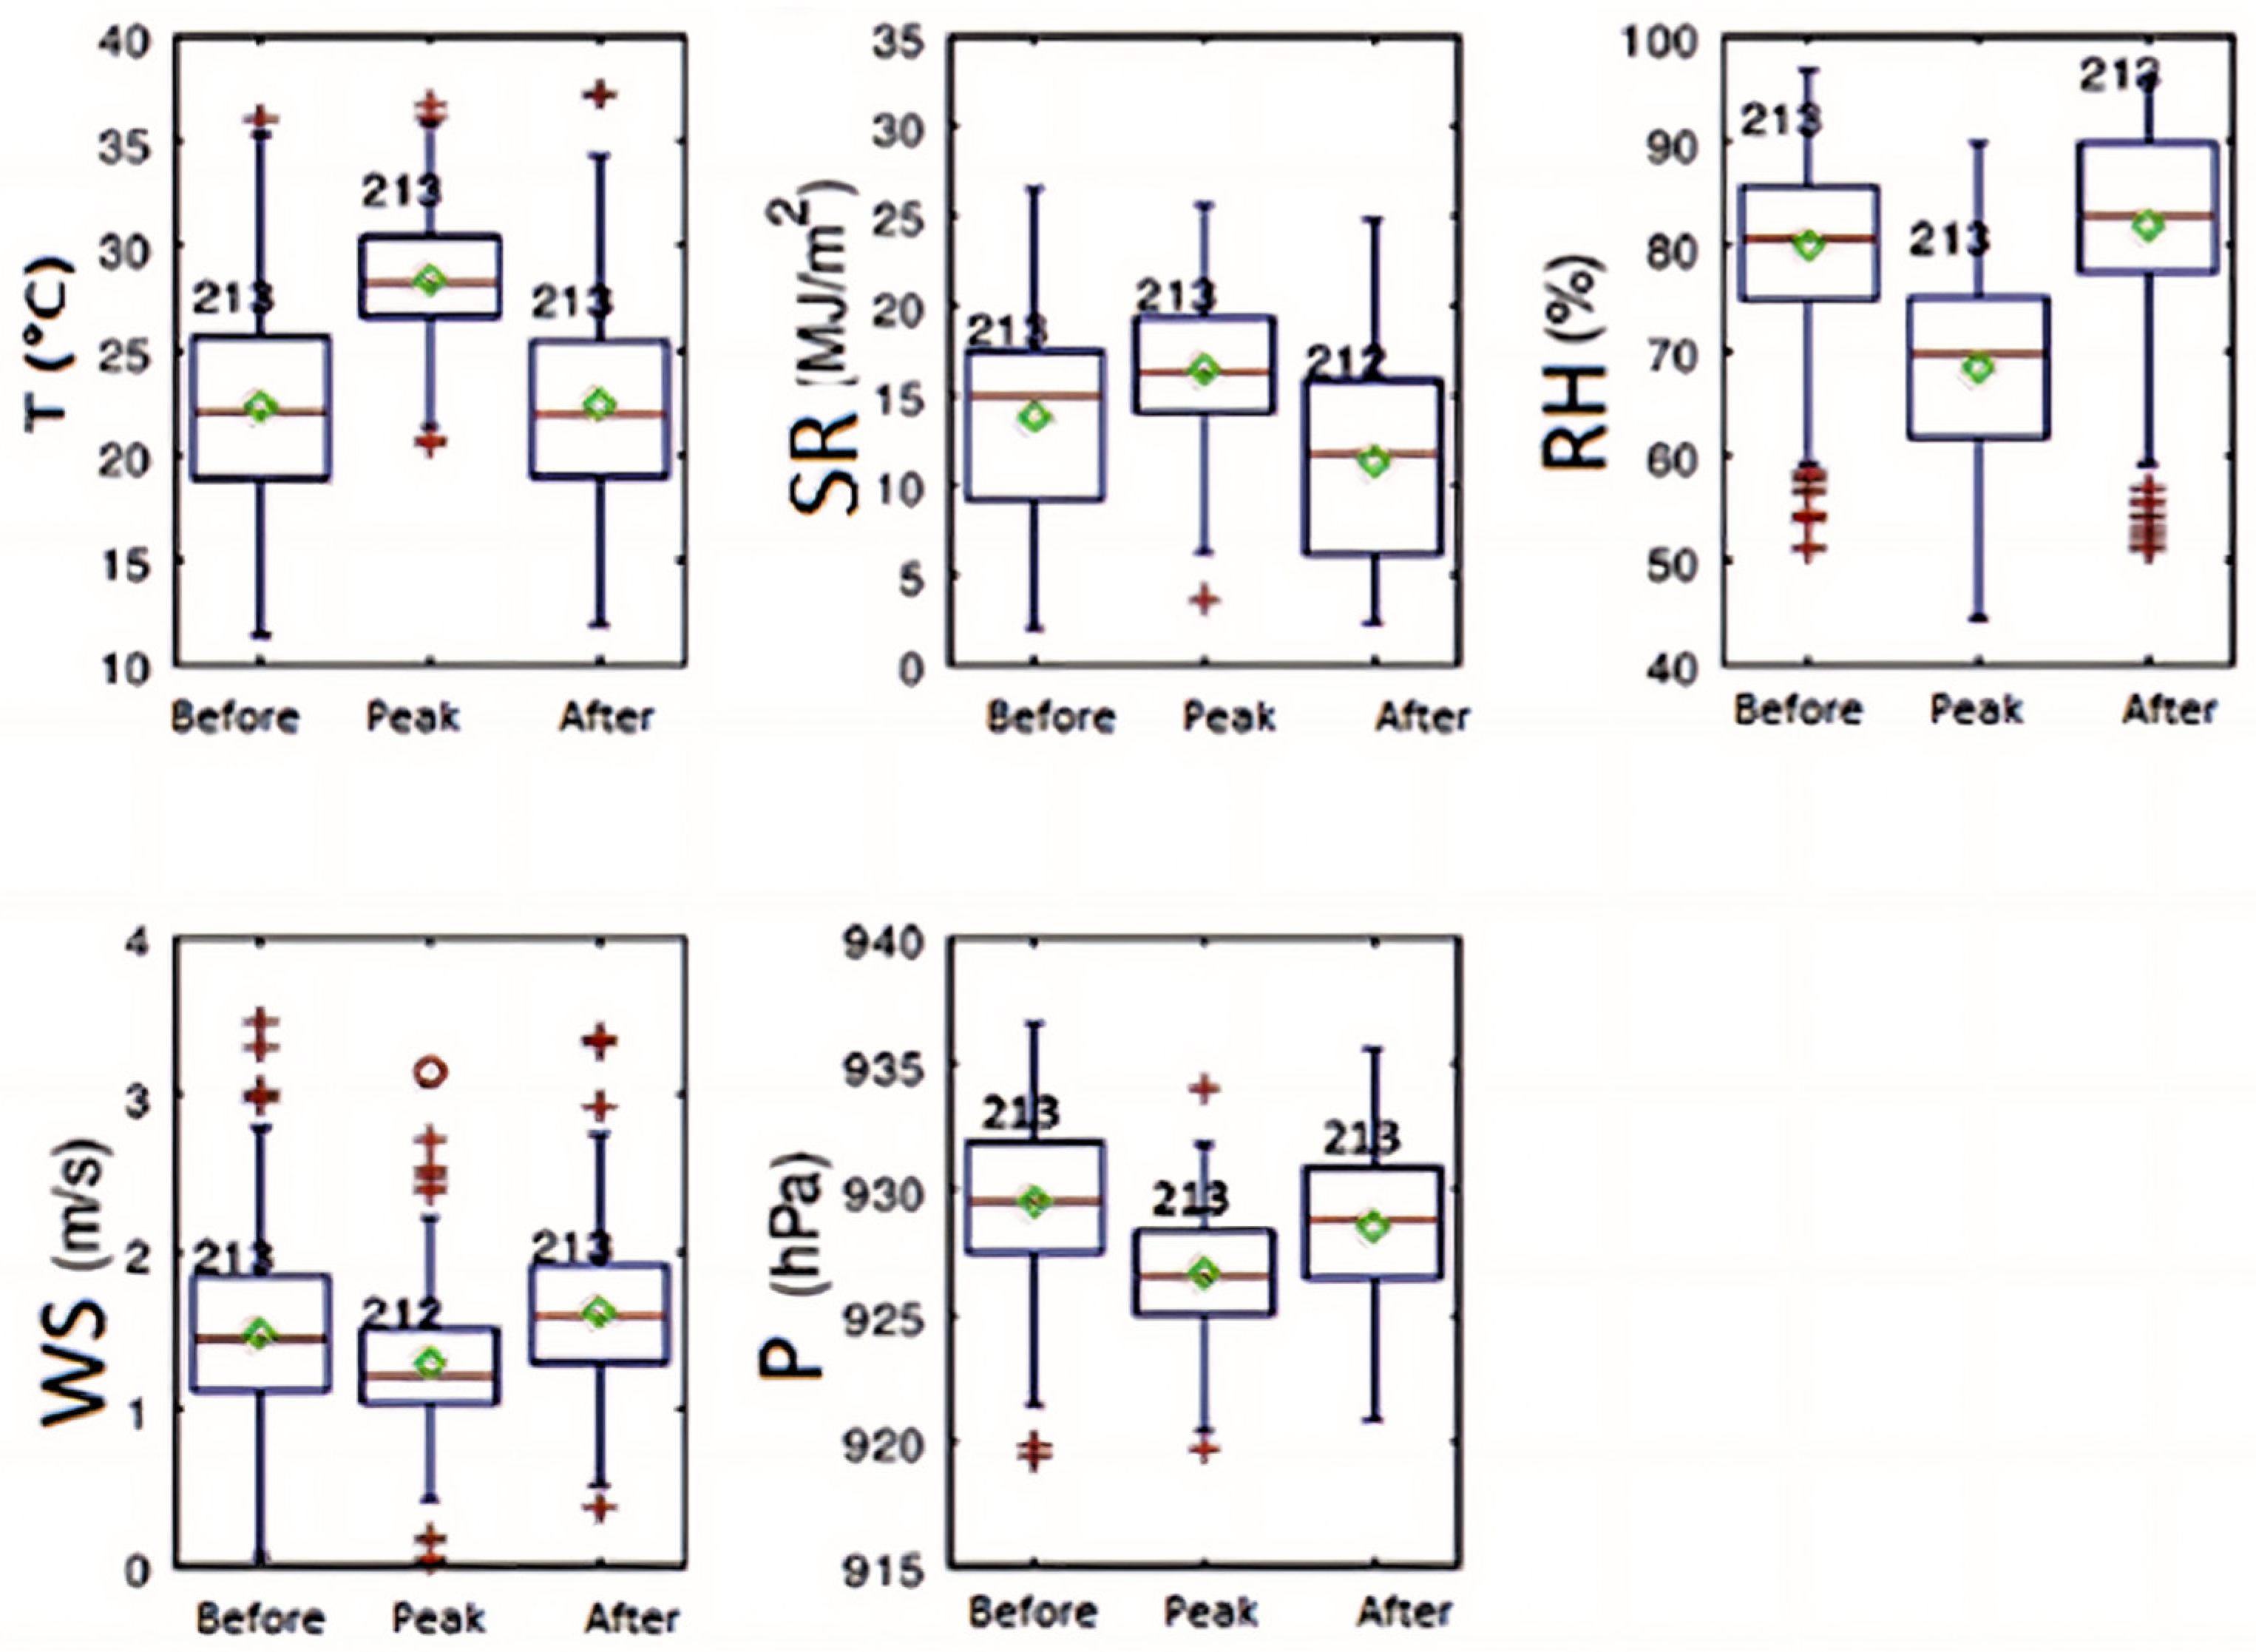
Figure 2 shows the average behavior of the following surface weather variables: T, SR, RH, WS, and P. With the beginning of the events, there was an increase in the surface T, which reached its median of 28°C during the peak. The same behavior occurred for SR, but with less intensity. However, it is observed that for RH, WS, and P there was a decreasing behavior on peak days. For peak days a predominance of northwest surface winds was observed.
For the days after the events, T and SR decreased, while RH increased, with its median reaching 83%. The same occurred for WS, with an increase in its median of 0.4 m/s.
4. Discussion
It was observed that the beginning of PEE coincides with changes in surface weather variables that suggest unfavorable conditions for dispersion, possibly explained by favorable weather conditions for its accumulation, associated with atmospheric stability. This weather scenario contributed to the gradual increase in concentrations of PM10 and thus to the beginning of the persistent events. With the gradual increase of PM10 concentrations, it was observed that its maximum concentration occurred in the final days of the persistent events, defined in this study as peak days. On these peak days, behaviors such as increased T, decreased RH and WS, and winds with the predominantly northwest direction were observed, thus indicating a prefrontal scenario for such peak days. Winds from the northwest may also suggest transporting PM10 from the interior of São Paulo State. During the peak, there was also an increase in concentrations of pollutants such as PM2.5, O3, CO, NO2, and CO compared to the days before the start of the persistent events. Thus, it was observed that the meteorological scenario influences and shapes the air quality, which can influence both the accumulation and the emission of pollutants in the atmosphere.
5. Conclusions
This study analyzed the average behavior of surface meteorological variables and pollutant concentrations in the evolution of 71 persistent events of PM10 exceedance between the years 2005 and 2017 in the MASP. Thus, the definition and identification of PEE by analyzing data from 13 years of surface weather variables, bring greater consistency in the observed behavior and can relate such events to synoptic situations and weather patterns, reducing the influence of local conditions and effects. It was observed that on days of maximum concentration of PM10 during the temporal evolution of persistent events, a prefrontal scenario occurred with changes in meteorological variables, such as an increase in maximum temperature, a decrease in wind speed and relative humidity, and predominant northwest wind direction. This scenario also contributed to the increase of concentrations of other pollutants in greater or lesser intensity, such as PM2,5, CO, O3, NO2, and SO2.


