Proceeding Paper

Study of Black Carbon (BC) Mass Concentration Variation at a Coastal Region (Surat) †

by
Ranjitkumar Solanki
and
Kamlesh N. Pathak
*
Department of Physics, Sardar Vallabhbhai National Institute of Technology, Surat 395007, India
*
Author to whom correspondence should be addressed.
Presented at the 3rd International Electronic Conference on Atmospheric Sciences, 16–30 November 2020; Available online: https://ecas2020.sciforum.net/.
Environ. Sci. Proc. 2021, 4(1), 16; https://doi.org/10.3390/ecas2020-08146
Published: 13 November 2020
(This article belongs to the Proceedings of The 3rd International Electronic Conference on Atmospheric Sciences)

Abstract

:
Black Carbon (BC) aerosols mass concentration was studied at Surat, Gujarat (India), a coastal region near the Tapi River at the Gulf of Khambhat. Using satellite data for solar extinction due to Black Carbon (BC) mass concentration, data were collected from the Giovanni platform developed by NASA. Results of the data for the 5-year period (January to December 2001–2005) are discussed here. Annual and Seasonal variations of Black Carbon (BC) in relation to changes in the regional meteorological conditions are discussed here. The data collected during January to December 2001–2005 indicated the annual average BC concentration. The mean annual variations of BC aerosols mass concentration saw its maximum in the month of December while minimum was seen in the month of July. The seasonal mean BC mass concentration observed to be at its lowest in monsoon season while its highest was in winter at the study region. Variation of the BC trend observed was higher in the month December and lower in the month of July which is mostly related to the changes in the local boundary layer.

1. Introduction

Black Carbon (BC), the main component of soot, is produced by the incomplete combustion of carbon-rich fuels. While the climate impacts of BC and other aerosols have been recognized for over 30 years, scientific understanding of BC as a climate-warming agent has evolved substantially over the last decade based on the results of field and satellite observations and modeling studies [1,2]. Yet, to date, BC has not been explicitly targeted through any global, regional, or national climate change policies or regulations. Instead, BC has been considered as a component of particulate matter (PM) and addressed as such in the policy and regulatory arena to control its public health and air quality (AQ) impacts.
Atmospheric heating by BC causes a strong positive radiative forcing at the top of the global atmosphere, offsetting a large fraction of the cooling by other aerosol components [3,4,5]. Deposited BC reduces the reflectance of snow [6], which might significantly influence the local and regional climate [7]. It was recently estimated that BC may have contributed to more than a half of the observed Arctic warming since 1890, most of this occurring during the last three decades [8].
During recent years, BC has attracted special attention mainly because of its contribution to radiative warming of the atmosphere [9,10,11]. The Intergovernmental Panel on Climate Change (IPCC, 2007) has estimated that the global mean clear-sky radiative forcing of BC is (0.23 ± 0.25) Wm−2, which is approximately half the value of methane, the second most important greenhouse gas after carbon dioxide. The developing world, especially the Asian region with its large population, rapidly growing industrialization, and diverse living habitats, is believed to be one of the hotspots of carbonaceous aerosols [12,13,14].

2. Data and Study Region

2.1. Study Region

The Present study area Surat (Coastal City) 21.17° N, 72.83° E is the southeastern part of the Gujarat state of the west–central part of India (see Figure 1). It lies near the mouth of the “Tapti River” at the Gulf of Khambhat, close to the Arabian Sea. It also has a larger coastal area and is now the commercial and economic center in South Gujarat (India), which is very famous for its diamonds and textile industries. It is the eighth largest city and ninth largest urban agglomeration in India.

2.2. Data

In this study, we made use of the MERRA-II Model data at 0.5° × 0.625° spatial resolution, processed as the collected data set. In this study, Modern-Era Retrospective analysis for Research and Applications (MERRA-2) Black Carbon Surface Mass Concentration ( μ g / m 3), with monthly temporal resolution, was downloaded from the Goddard Earth Sciences Data and Information Services Centre “GIOVANNI” platform [15]. Giovanni is short form for the Goddard Earth Sciences Data and Information Services Center (GES-DISC) Interactive Online Visualization and Analysis Infrastructure [16]. It is a web-based application developed by the NASA GES-DISC, and it is easy to use [16]. We will obtain customized data analyses and visualizations with ease [16].

3. Results and Discussion

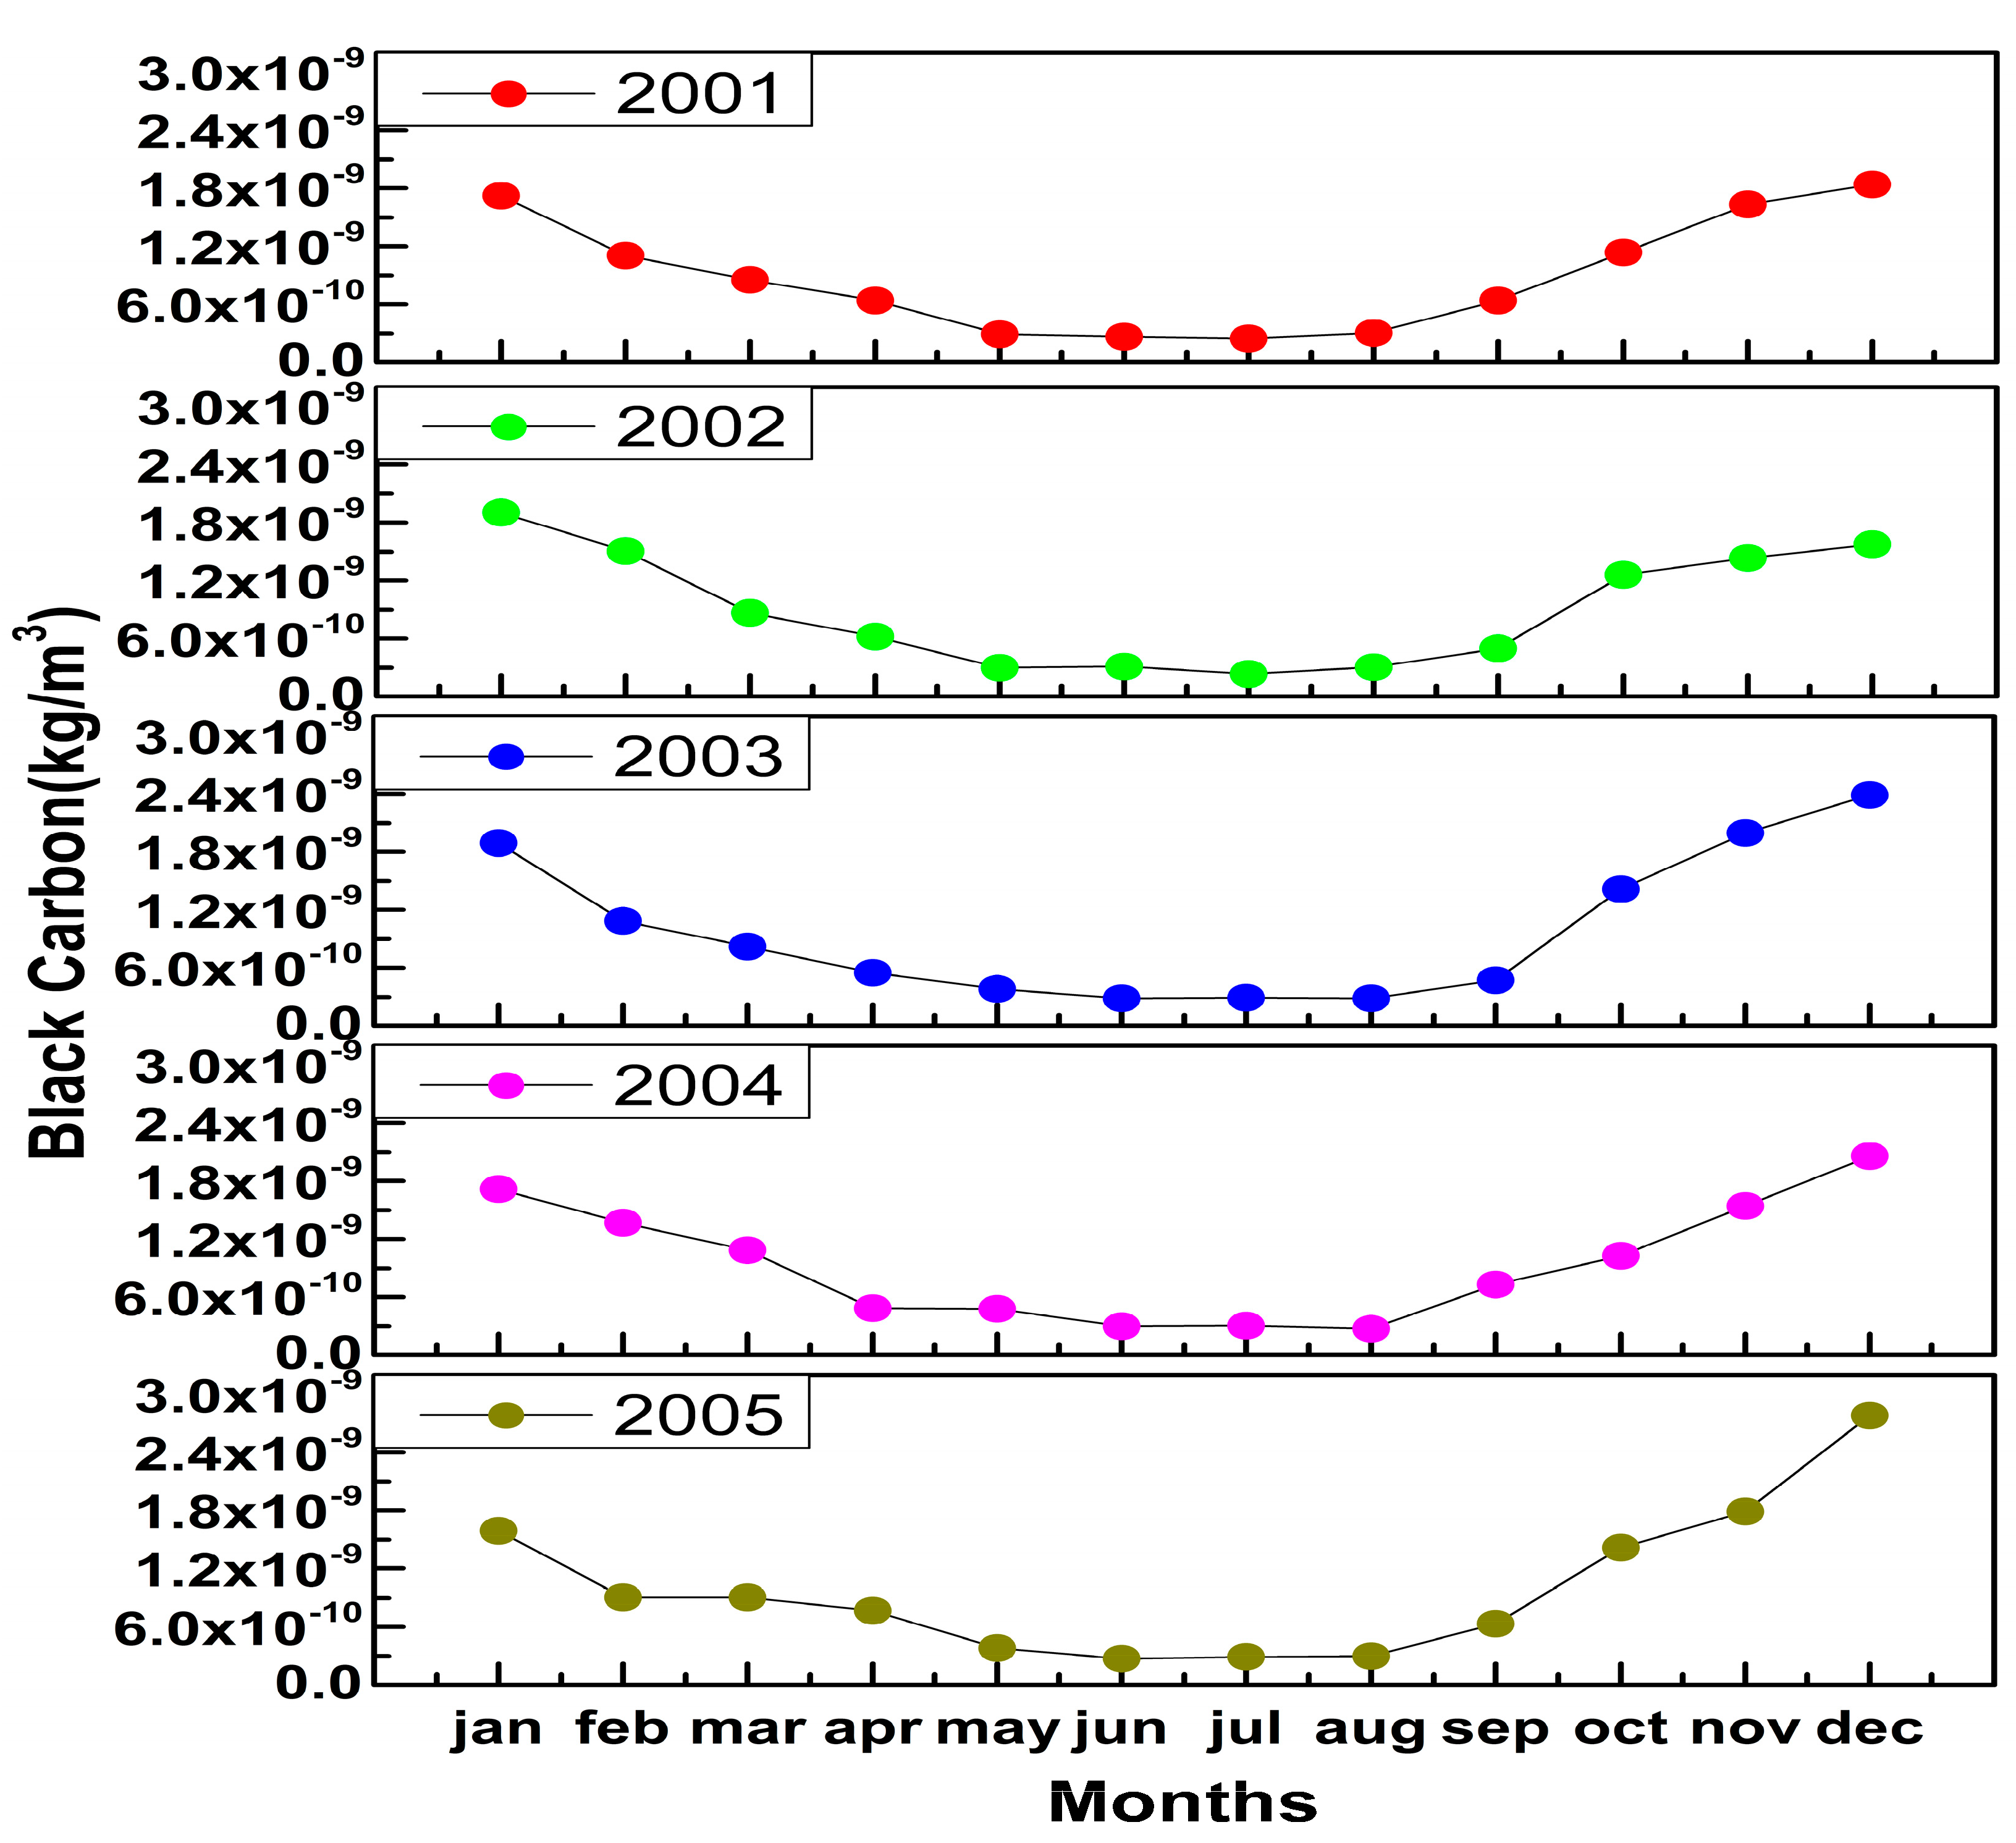
3.1. Annual Variations of Aerosol Black Carbon Mass Concentration

From Figure 2, It can be clearly seen that higher mass concentrations of BC are observed during October to March when cold weather conditions prevail during any year.
The Black Carbon mass concentration shows decreasing trends in June to September, with the monthly mean BC concentration falling to more than half the value that prevailed in cold months. This lower value is maintained until September. During this period, no influence of residential heating was observed at the site. The mean BC concentration during this period is in contrast to the value of kg/m3 during cold months.

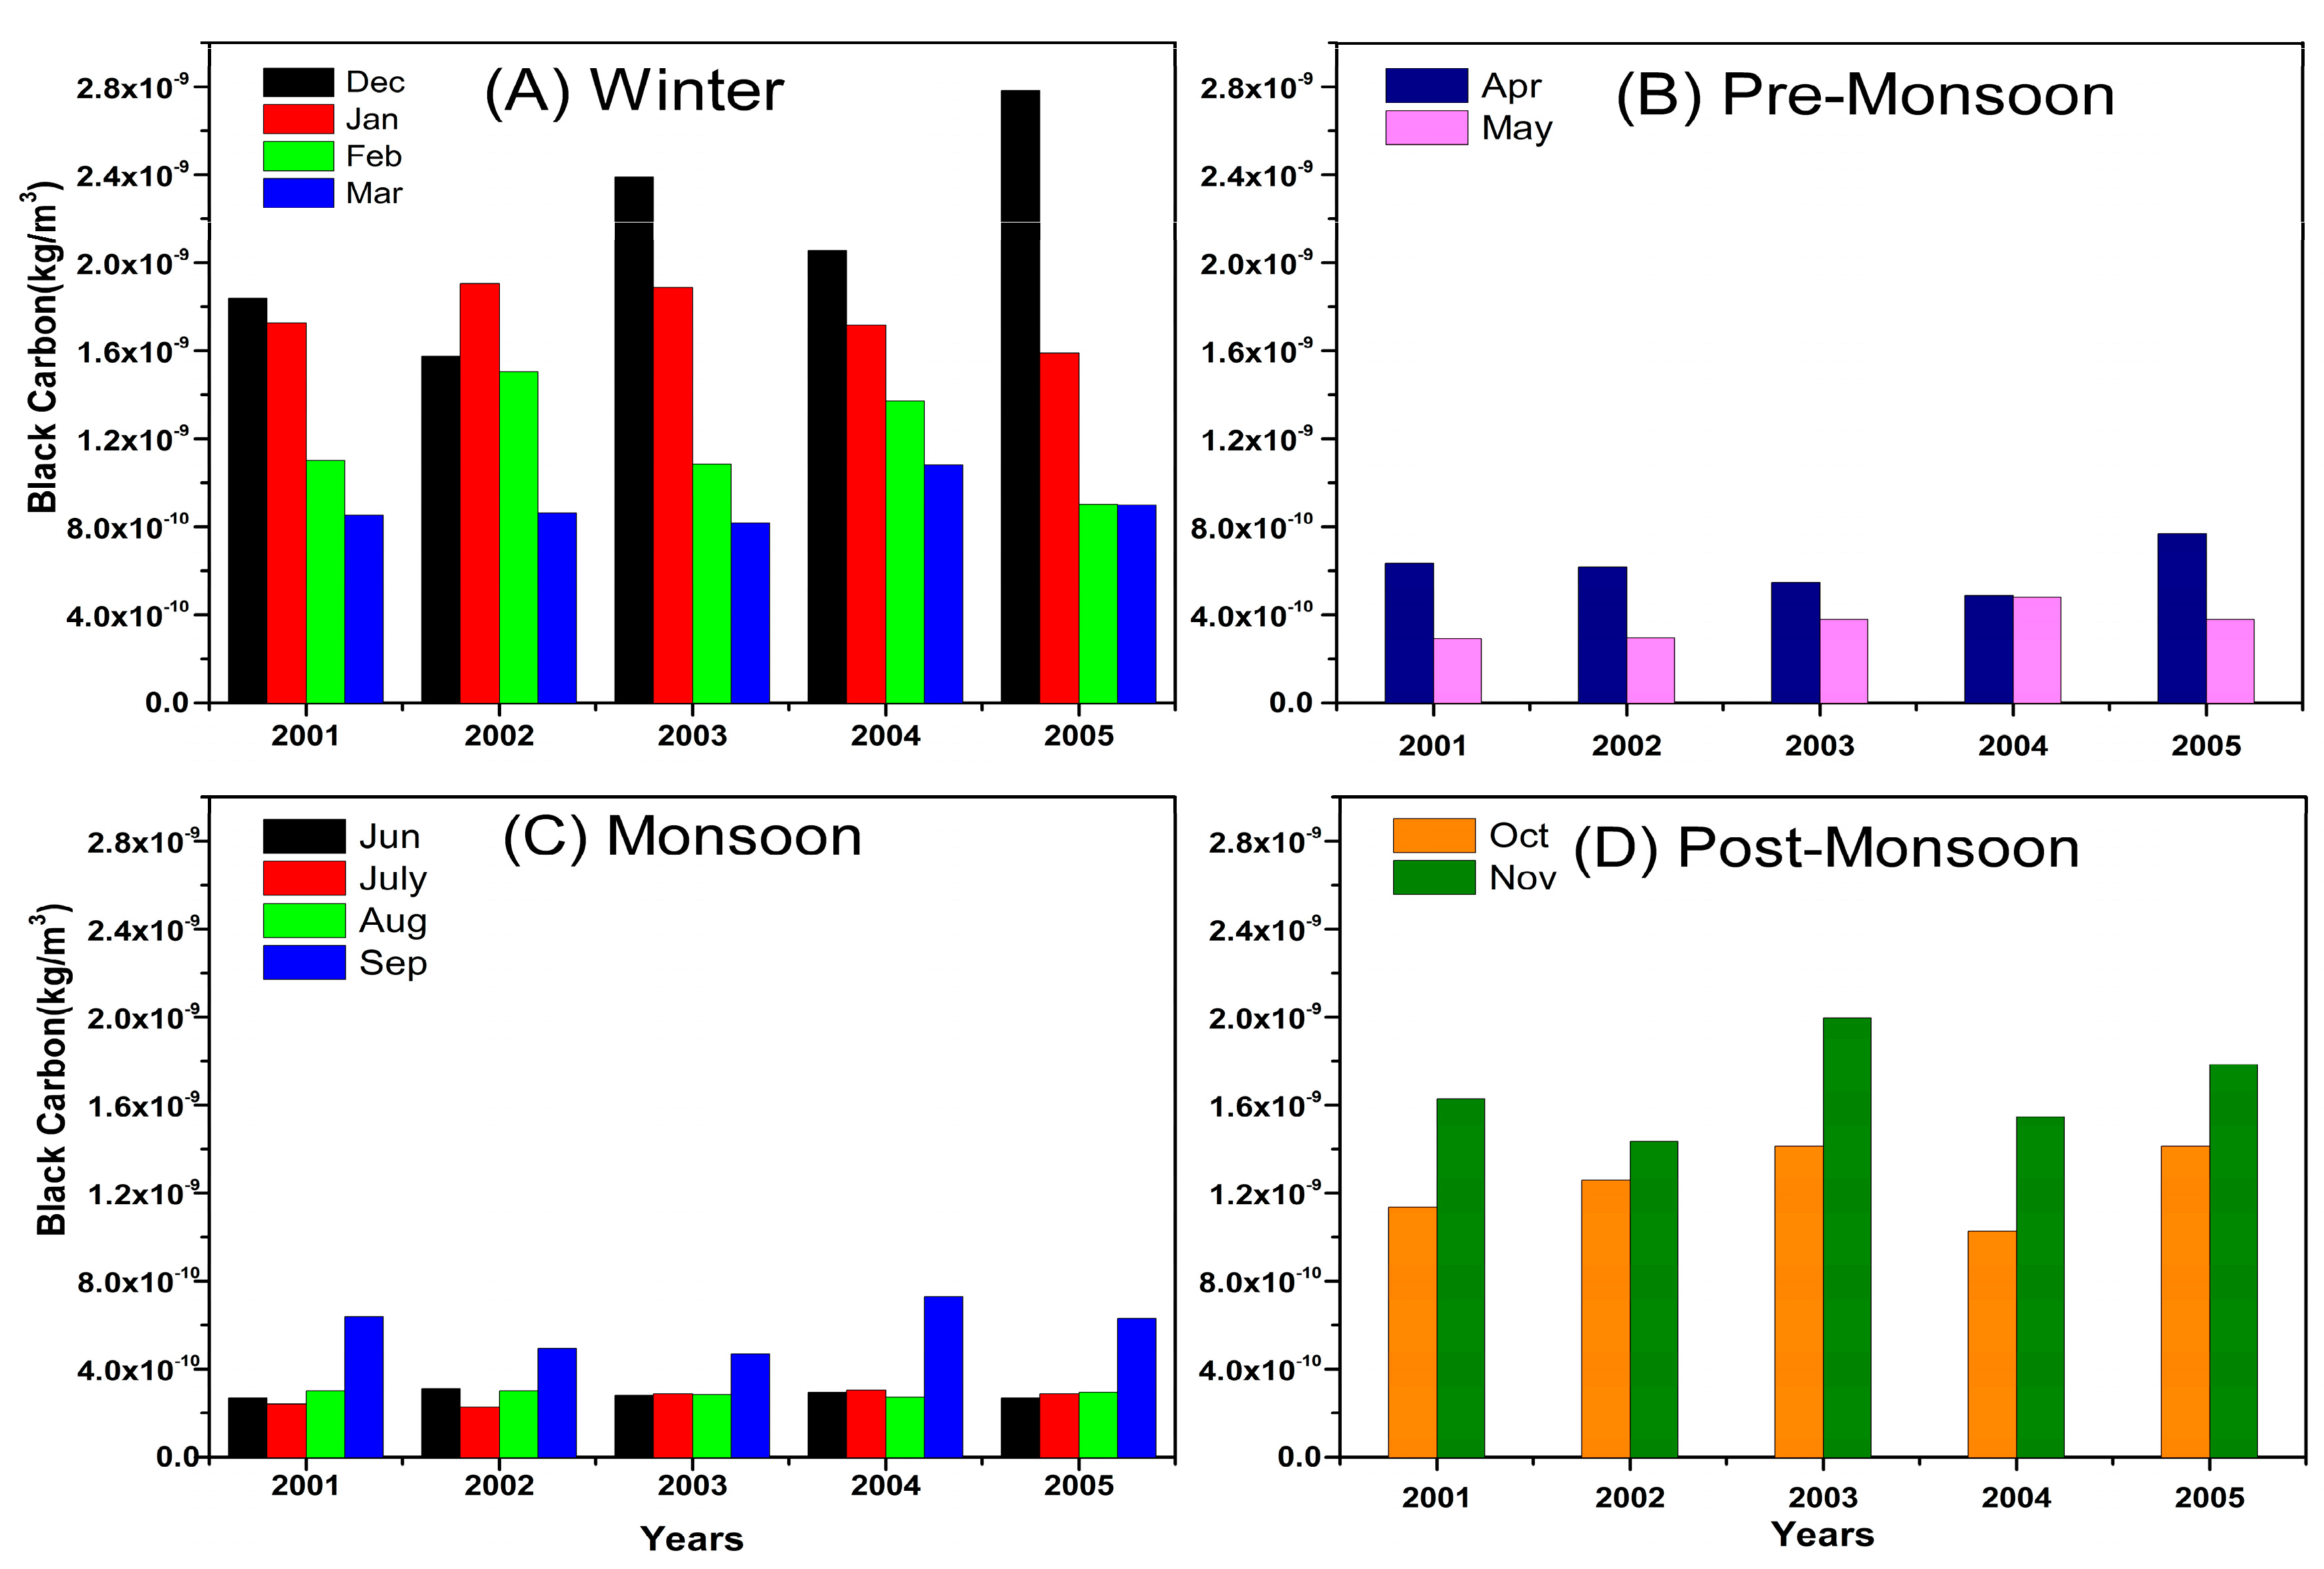
3.2. Seasonal Variation of Black Carbon

Summarizing the results on a seasonal basis, the main four seasons are (I) Winter (December–March), (II) Pre-Monsoon (April–May), (III) Monsoon (June–September) and (IV) Post-Monsoon (October–November). Figure 3 shows that the seasonal mean BC mass concentration over the study region is lowest in Monsoon and highest in Post Monsoon as well as in the Winter season. Figure 3A shows higher values in December 2005 among all the years, while lower values are reported in March, respectively for all the years. In Figure 3B, it is also shown that the values periodically decrease in the Pre-Monsoon season for all the subsequent years. During monsoon season, the rainfall and the dilution of pollutants near the ground result in lower BC mass concentrations, as shown in Figure 3C. During Post-Monsoon, BC mass concentration gradually increases, as shown in Figure 3D for all the years, respectively.
As is expected, urbanization and increased anthropogenic activities have contributed particulate load into the atmosphere over Surat. For most of the years, the trend in the variation of Black Carbon (BC) is the same.

4. Conclusions

In this study, we discussed five years of data. BC mass concentrations observed at Surat sites were carried out using Modern-Era Retrospective analysis for Research and Applications (MEERA-II) Model Data over January to December 2001–2005. The result shows annual and seasonal variation of Aerosol Black Carbon mass concentration over the study region. The mean monthly and seasonal variations of Black Carbon aerosol mass concentration show a higher value in January and December and then gradually decrease until July. The seasonal mean BC mass concentration is lowest in Monsoon—2003 and highest in Winter—2005 as well as in Post-Monsoon—2003. It shows the lower values during the Monsoon season for all the years.

Author Contributions

Conceptualization, R.S., and K.N.P.; methodology, R.S.; validation, R.S., and K.N.P.; formal analysis, R.S.; investigation, R.S.; resources, R.S.; data curation, R.S.; writing—original draft preparation, R.S.; writing—review and editing, R.S.; visualization, R.S., and K.N.P.; supervision, K.N.P. All authors have read and agreed to the published version of the manuscript.

Funding

Authors are thankful to UGC New Delhi for providing the RGNF fellowship (No. F1-17.1/2015-16/RGNF-2015-2017-SC-GUJ-26508(SA-III/Website) JANUARY 2016.

Institutional Review Board Statement

Not applicable.

Informed Consent Statement

Not applicable.

Data Availability Statement

Publicly available datasets were analyzed in this study. This data can be found here: [https://giovanni.gsfc.nasa.gov/giovanni/].

Acknowledgments

The authors wish to thank those that provided the data sets used in this paper, which were produced with the Giovanni online data system, developed and maintained by the NASA GES DISC.

Conflicts of Interest

The authors declare no conflict of interest.

References

  1. Bond, T.C.; Sun, H. Can reducing black carbon emissions counteract global warming? Environ. Sci. Technol. 2005, 39, 5921–5926. [Google Scholar] [CrossRef] [PubMed]
  2. Ramanathan, V.; Feng, Y. Air pollution, greenhouse gases and climate change: Global and regional perspectives. Atmos. Environ. 2009, 43, 37–50. [Google Scholar] [CrossRef]
  3. Haywood, J.M.; Shine, K.P. Multi-spectral Calculations of the Radiative Forcing of Tropospheric Sulphate and Soot Aerosols Using a Column Model. Q.J. Roy. Meteorol. Soc. 1997, 123, 1907–1930. [Google Scholar] [CrossRef]
  4. Jacobson, M.Z. Climate response of fossil fuel and biofuel soot, accounting for soot’s feedback to snow and sea ice albedo and emissivity. J. Geophys. Res. 2004, 109, D21201. [Google Scholar] [CrossRef]
  5. Ramanathan, V.; Carmichael, G. Global and regional climate changes due to black carbon. Nat. Geosci. 2008, 1, 221–227. [Google Scholar] [CrossRef]
  6. Warren, S.; Wiscombe, W. A model for the spectral albedo of Snow. II: Snow containing atmospheric aerosols. J. Atmos. Sci. 1980, 37, 2734–2745. [Google Scholar] [CrossRef]
  7. Flanner, M.G.; Zender, C.S.; Hess, P.G.; Mahowald, N.M.; Painter, T.H.; Ramanathan, V.; Rasch, P.J. Springtime warming and reduced snow cover from carbonaceous particles. Atmos. Chem. Phys. 2009, 9, 2481–2497. [Google Scholar] [CrossRef]
  8. Shindell, D.; Faluvegi, G. Climate response to regional radiative forcing during the twentieth century. Nature Geosci. 2009, 2, 294–300. [Google Scholar] [CrossRef]
  9. Haywood, J.M.; Roberts, D.L.; Slingo, A.; Edwards, J.M.; Shine, K.P. General circulation model calculations of the direct radiative forcing by anthropogenic sulphate and fossil-fuel soot aerosol. J. Clim. 1997, 10, 1562–1577. [Google Scholar] [CrossRef]
  10. Jacobson, M.Z. Control of fossil-fuel particulate black carbon and organic matter, possibly the most effective method of slowing global warming. J. Geophys. Res. Atmos. 2002, 107, 4401. [Google Scholar] [CrossRef]
  11. Myhre, G.; Stordal, F.; Restad, K.; Isaksen, I.S.A. Estimation of the Direct Radiative Forcing Due to Sulfate and Soot Aerosols. Tellus 1998, 50, 463–477. [Google Scholar] [CrossRef]
  12. IPCC (Intergovernmental Panel on Climate Change). The Scientific Basis, in: Contribution of Working Group I to the Fourth Assessment Report of the Intergovernmental Panel on Climate Change; Solomon, S., Qin, D., Manning, M., Chen, Z., Marquir, M., Averyt, K.B., Tignor, M., Miller, H.L., Eds.; Cambridge Univ. Press: New York, NY, USA, 2007. [Google Scholar]
  13. Jacobson, M.Z. Strong radiative heating due to the mixing state of black carbon in atmospheric aerosols. Nature 2001, 409, 695–697. [Google Scholar] [CrossRef] [PubMed]
  14. Oshima, N.; Kondo, Y.; Moteki, N.; Takegawa, N.; Koike, M.; Kita, K.; Matsui, H.; Kajino, M.; Nakamura, H.; Jung, J.S.; et al. Wet removal of black carbon in Asian outflow: Aerosol Radiative Forcing in East Asia (A-FORCE) aircraft campaign. J. Geophys. Res. 2012, 117, D03204. [Google Scholar] [CrossRef]
  15. NASAEarth Data Giovanni Webpage. Available online: https://giovanni.gsfc.nasa.gov/giovanni/ (accessed on 14 November 2020).
  16. Ganesh, K.E.; Dhanya, G.; Shivkumar, M.; Pranesha, T.S. A study on long term variation in particulate matter and black carbon aerosol optical thickness over mysuru, india: A satellite data approach. Mausam 2018, 69, 331–334. [Google Scholar] [CrossRef]
Figure 1. Geographical location of the study area.
Environsciproc 04 00016 g001
Figure 2. Annual variation of black carbon (BC) over the study region (2001 to 2005).
Environsciproc 04 00016 g002
Figure 3. Seasonal Variation of black carbon (BC) for the (A) Winter, (B) Pre-Monsoon, (C) Monsoon, and (D) Post-Monsoon seasons over the study region (2001 to 2005).
Environsciproc 04 00016 g003
Publisher’s Note: MDPI stays neutral with regard to jurisdictional claims in published maps and institutional affiliations.

