1. Introduction
Understanding Land Surface Temperature (LST) dynamics and its input on the Urban Heat Island (UHI) effect is pivotal for urban planning, neighbourhood design, engineering, construction, and environmental management. LST measures the temperature of the surface’s skin, and its rapid ascent due to urbanization leads to the UHI effect, a phenomenon that arises from human activities and land use alterations, resulting in cities being warmer than their surrounding peripheral and rural areas [
1,
2]. The repercussions of the UHI effect encompass health hazards, ecological disruptions, increased energy consumption, and alterations to local microclimates, thus producing human discomfort and impacting the urban quality of life [
3,
4,
5,
6,
7]. Despite understanding UHI effects, there is a vital need to explore deeper into the spatiotemporal variations in urban LST. The time series analysis of LST helps to discern these patterns, identify hotspots, and detect Land Use and Land Cover (LULC) changes [
8,
9].
The present study investigates the LST dynamics and their urban planning implications in the municipal region of Phnom Penh, the capital of the Kingdom of Cambodia in Southeast Asia. It deciphers urban LST spatiotemporal patterns over 22 years and evaluates the correlation between LULC changes and LST. The research hypothesized that significant LULC changes, especially in the growth of built-up environments, the sealing and compacting of surfaces, and thus a decline in vegetation causes noticeable LST variability, creating thermal hotspots and influencing local climates.
2. Materials and Methods
The study focused on the Chbar Ampov District in the southeast part of Phnom Penh, Cambodia, a rapidly developing urban area characterized by a tropical wet and dry climate and susceptible to seasonal flooding from the neighbouring rivers Tonle Mekong and Tonle Bassac [
10]. Remote sensing data primarily included Collection-1: Tier 1 data from Landsat 5, 7, and 8. Due to the region’s susceptibility to cloud presence, a maximum 60% cloud filter was applied, resulting in 462 images from 2000 to 2021 being selected for the study. Google Earth images were used to compare LST and LULC changes at the local level visually. LST was retrieved using the Single-Channel (SC) algorithm based on equations from Jiménez-Muñoz et al. [
11,
12]. The statistical analyses of LST included a descriptive statistics analysis, calendar heat map, trend analysis, and correlation test between LSTs and different spectral indices values at 400 random points. The trend analysis was conducted using simple line charts generated from the minimum, mean, and maximum LSTs of the selected 462 images. Visual observation identified consistently warmer areas as hotspots. Below is a general overview of the methodological workflow (
Figure 1).
3. Results
3.1. LST Ranges, Trend, and Distribution
Annual LST ranges revealed a relationship between the minimum, mean, and maximum LSTs; when the minimum rises, the mean and maximum typically rise too (
Figure 2). Unusually high maximum LSTs were observed in 2002, 2015, 2016, 2017, and 2021, while 2014, 2017, and 2021 had high mean LSTs. Conversely, 2005 had an unusually low maximum LST, and 2006 saw a low mean LST. Unusually high maximum LSTs were observed in 2002, 2015, 2016, 2017, and 2021, while 2014, 2017, and 2021 had high mean LSTs. Conversely, 2005 had an unusually low maximum LST, and 2006 saw a low mean LST. Overall, there is an oscillatory fluctuation with highs and lows in LST values.
No long-term trends were visible regarding the minimum, mean, and maximum LSTs (
Figure 3). The 20 °C flatline at the bottom is due to the minimum LST temperature filter used on the data. The maximum LST temperature is usually below 60 °C apart from a few years, such as 2008, 2015, 2016, and 2017. The noticeable temperature spikes in each category seem symmetrical.
The calendar heatmap displays the LST’s yearly and monthly trends (
Figure 4). Mean LST is generally higher from November to April, marking the area’s dry season, with February to April showing a consistently elevated LST. Occasionally, May also experiences higher LSTs. Notably, high LST values were recorded in March 2003, 2010, and 2016, with LST values of 43.10 °C, 44.43 °C, and 44.58 °C, respectively. Another peak was in May 2015 at 43.86 °C. These LST value spikes occur roughly every six to seven years during the dry season, though more data is needed for a definite conclusion.
3.2. Seasonal Variations in LST
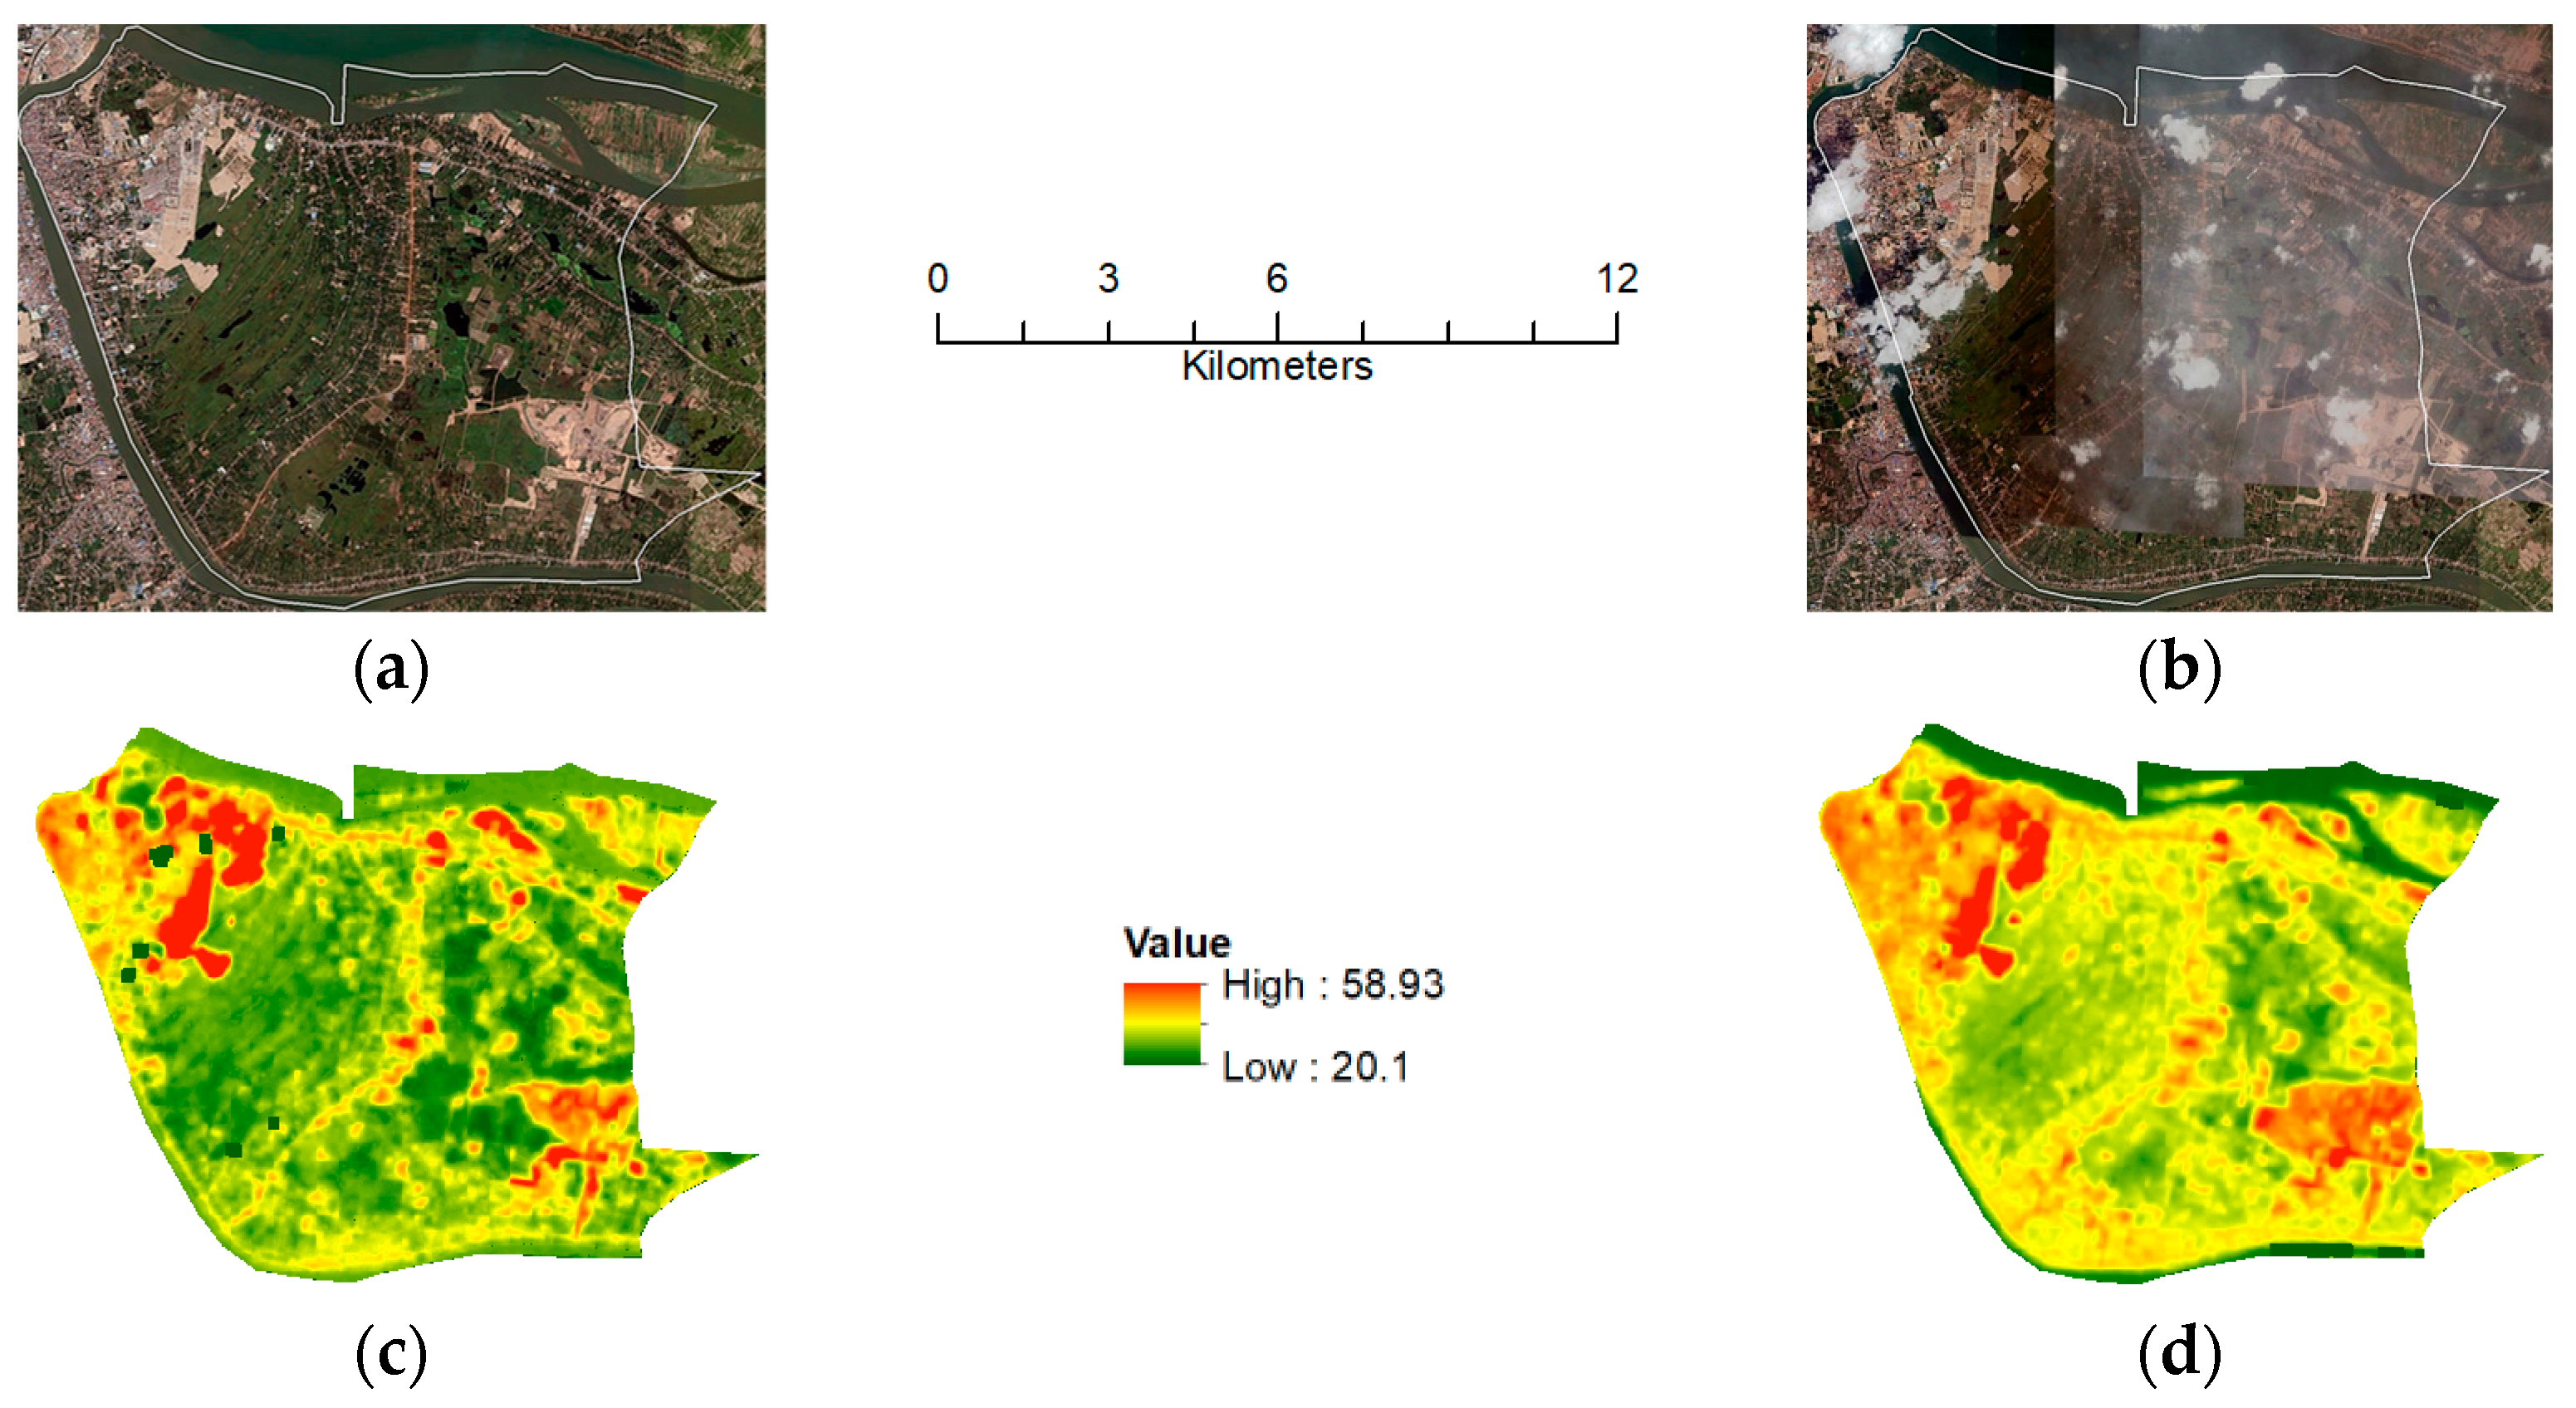
Despite no apparent changes in the LULC changes visible in the Google Earth images (
Figure 5a,b), noticeable changes in LST appear between January and April 2015 (
Figure 5c,d). The maximum LST difference between January and April 2015 is 16.34 °C.
3.3. LST Hotspots and Correlations with LULC Changes
Five points that contained consistently higher LST over the years were identified as hotspots based on visual observation (
Figure 6a).
Hotspot 4 is used as an example here to inspect the relationship between LULC changes and LST at the local level (
Figure 6b). The area was land seasonally used for peri-urban agriculture, covered with some dry vegetation and a small waterbody in February 2003. By July 2008, the area had become lush green with several trees and dense vegetation spots, reflected by the downward spike in LST. However, by 2010, the area lost all the trees and vegetation, thus showing an upward spike in LST. The area showed the highest LST in 2016 when the area contained a large building and mostly exposed bare soil. Overall, the area shows an upward trend in LST. This correlation between LST and LULC changes is expressed through a correlation matrix (
Figure 6c). The correlation matrix consists of the LST and three different spectral indices (NDVI, IBI, and MNDWI), representing vegetation, built-up area, and water, respectively.
4. Discussion
Seasonal LST variation in a tropical peri-urban area was consistent with that found in earlier studies [
13,
14]. While the absence of long-term trends was unexpected, localized hotspots showed a clear link between LST and LULC changes. Urbanization, mainly built-up areas, has a strong positive correlation with LST, reflected in the correlation matrix and a previous study [
13]. Conversely, water and vegetation showed negative correlations, in line with the cooling effects of these features reflected also in previous studies [
15,
16]. Reaffirming theories on the connection between urbanization and LST variation, the study underscores the need for a context-sensitive approach that considers specific local contexts [
13,
17]. Such insights into the physical response of LST originating from LULC changes can guide urban planning, emphasizing the importance of regional LST monitoring, increasing green spaces, and constructing sustainable buildings to promote urban sustainability, thus increasing the quality of life.
The study’s limitations include challenges with consistent image acquisition due to cloud cover and potential oversights on other factors influencing LST beyond LULC changes. The limited timeframe may also obscure long-term trends, and while correlations between LST and LULC classes were evident, causation remains to be determined. Future investigations could delve deeper into the LST–LULC relationship through high-resolution thermal UAV imaging, offering very high spatial resolution data and a means for long-term empirical monitoring. Comparing findings across various urban contexts could reveal universal patterns and local distinctions. Evaluating urban planning strategies’ effectiveness when reducing or lowering regional LST maxima over time, studying climate change’s and LULC changes’ combined impacts, and integrating socio-economic factors could further enrich our understanding of LST dynamics in urban settings.
5. Conclusions
This study offers insights into the spatiotemporal patterns of LST in the specified area and its observed empirical relationship with LULC changes using remote sensing. It underscores the importance of considering seasonal variability, LST trends, and how LST responds to LULC variations in particular areas. These findings enhance our understanding of the LST–LULC dynamic and its implications for urban planning. Despite a few limitations, the study’s methodology can be adapted to other contexts and paves the way for future inquiries into LST dynamics in different environments.
Author Contributions
Conceptualization, G.M.; methodology, G.M.; software, G.M.; formal analysis, G.M.; data curation, G.M.; writing—original draft preparation, G.M.; writing—review and editing, G.M. and J.-P.M.; visualization, G.M. and J.-P.M.; supervision, J.-P.M. All authors have read and agreed to the published version of the manuscript.
Funding
This research was funded by the Build4People Project under the funding priority SURE, Sustainable Development of Urban Regions, of the German Federal Ministry of Education and Research (BMBF), funding support code (FKZ): 01LE1908D1.
Institutional Review Board Statement
Not applicable.
Informed Consent Statement
Not applicable.
Data Availability Statement
The data and code are available upon request to the corresponding author.
Conflicts of Interest
The authors declare no conflicts of interest.
References
- Oke, T.R.; Cleugh, H.A. Urban Heat Storage Derived as Energy Balance Residuals. Bound. -Layer Meteorol 1987, 39, 233–245. [Google Scholar] [CrossRef]
- Weng, Q. Thermal Infrared Remote Sensing for Urban Climate and Environmental Studies: Methods, Applications, and Trends. ISPRS J. Photogramm. Remote Sens. 2009, 64, 335–344. [Google Scholar] [CrossRef]
- Kovats, R.S.; Hajat, S. Heat Stress and Public Health: A Critical Review. Annu. Rev. Public Health 2008, 29, 41–55. [Google Scholar] [CrossRef] [PubMed]
- Santamouris, M. On the Energy Impact of Urban Heat Island and Global Warming on Buildings. Energy Build. 2014, 82, 100–113. [Google Scholar] [CrossRef]
- Zhang, P.; Imhoff, M.L.; Wolfe, R.E.; Bounoua, L. Characterizing Urban Heat Islands of Global Settlements Using MODIS and Nighttime Lights Products. Can. J. Remote Sens. 2010, 36, 185–196. [Google Scholar] [CrossRef]
- Grimm, N.B.; Faeth, S.H.; Golubiewski, N.E.; Redman, C.L.; Wu, J.; Bai, X.; Briggs, J.M. Global Change and the Ecology of Cities. Science 2008, 319, 756–760. [Google Scholar] [CrossRef] [PubMed]
- Pickett, S.T.A.; Cadenasso, M.L.; Grove, J.M. Resilient Cities: Meaning, Models, and Metaphor for Integrating the Ecological, Socio-Economic, and Planning Realms. Landsc. Urban Plan. 2004, 69, 369–384. [Google Scholar] [CrossRef]
- Nagler, P.; Glenn, E.; Nguyen, U.; Scott, R.; Doody, T. Estimating Riparian and Agricultural Actual Evapotranspiration by Reference Evapotranspiration and MODIS Enhanced Vegetation Index. Remote Sens. 2013, 5, 3849–3871. [Google Scholar] [CrossRef]
- Metz, M.; Andreo, V.; Neteler, M. A New Fully Gap-Free Time Series of Land Surface Temperature from MODIS LST Data. Remote Sens. 2017, 9, 1333. [Google Scholar] [CrossRef]
- National Institute of Statistics. Available online: http://www.nis.gov.kh/index.php/km/ (accessed on 7 July 2023).
- Jimenez-Munoz, J.C.; Cristobal, J.; Sobrino, J.A.; Soria, G.; Ninyerola, M.; Pons, X.; Pons, X. Revision of the Single-Channel Algorithm for Land Surface Temperature Retrieval from Landsat Thermal-Infrared Data. IEEE Trans. Geosci. Remote Sens. 2009, 47, 339–349. [Google Scholar] [CrossRef]
- Jimenez-Munoz, J.C.; Sobrino, J.A.; Skokovic, D.; Mattar, C.; Cristobal, J. Land Surface Temperature Retrieval Methods from Landsat-8 Thermal Infrared Sensor Data. IEEE Geosci. Remote Sens. Lett. 2014, 11, 1840–1843. [Google Scholar] [CrossRef]
- Weng, Q. A Remote Sensing?GIS Evaluation of Urban Expansion and Its Impact on Surface Temperature in the Zhujiang Delta, China. Int. J. Remote Sens. 2001, 22, 1999–2014. [Google Scholar]
- Zhou, Y.; Yang, G.; Wang, S.; Wang, L.; Wang, F.; Liu, X. A New Index for Mapping Built-up and Bare Land Areas from Landsat-8 OLI Data. Remote Sens. Lett. 2014, 5, 862–871. [Google Scholar] [CrossRef]
- Xu, H. Modification of Normalised Difference Water Index (NDWI) to Enhance Open Water Features in Remotely Sensed Imagery. Int. J. Remote Sens. 2006, 27, 3025–3033. [Google Scholar] [CrossRef]
- Zomer, R.J.; Trabucco, A.; Bossio, D.A.; Verchot, L.V. Climate Change Mitigation: A Spatial Analysis of Global Land Suitability for Clean Development Mechanism Afforestation and Reforestation. Agric. Ecosyst. Environ. 2008, 126, 67–80. [Google Scholar] [CrossRef]
- Oke, T.R. The Energetic Basis of the Urban Heat Island. Quart. J. Royal. Meteoro. Soc. 1982, 108, 1–24. [Google Scholar] [CrossRef]
| Disclaimer/Publisher’s Note: The statements, opinions and data contained in all publications are solely those of the individual author(s) and contributor(s) and not of MDPI and/or the editor(s). MDPI and/or the editor(s) disclaim responsibility for any injury to people or property resulting from any ideas, methods, instructions or products referred to in the content. |
© 2023 by the authors. Licensee MDPI, Basel, Switzerland. This article is an open access article distributed under the terms and conditions of the Creative Commons Attribution (CC BY) license (https://creativecommons.org/licenses/by/4.0/).


