Proceeding Paper

How Accurate Climate Information Can Help the Climate Adaptation in Regional Scale: The Case Study of Sitia †

by
Alesia Margarita Golemi
1,*,
Effrosyni Karakitsou
1,
Stelios Karozis
1,
Iason Markantonis
1,
Nadia Politi
1,
Athanasios Sfetsos
1,
Diamando Vlachogiannis
1 and
Pavlos Kapetanakis
2
1
Environmental Research Laboratory, INRaSTES, NSCR Demokritos, 15341 Agia-Paraskevi, Greece
2
Municipality of Sitia, 72300 Crete, Greece
*
Author to whom correspondence should be addressed.
Presented at the 16th International Conference on Meteorology, Climatology and Atmospheric Physics—COMECAP 2023, Athens, Greece, 25–29 September 2023.
Environ. Sci. Proc. 2023, 26(1), 170; https://doi.org/10.3390/environsciproc2023026170
Published: 5 September 2023

Abstract

:
According to the recent IPCC report, the Mediterranean, and consequently the region of Sitia, is one of the European “climate hotspots”. Its complex geomorphology and multiple locations with very distinct microclimate characteristics make high-resolution climate projections critical for the appropriate determination of effective local adaptation policies. The paper demonstrates the significance of the dynamical downscaling of climate information from 20 km × 20 km to a 5 km × 5 km scale of temperature, precipitation, drought, and fire risk for the region of Sitia and present, near-, and far-future climate projections using RCP4.5 and RCP8.5 scenarios.

1. Introduction

In some regions and communities, climate adaptation based on low resolution data will not be enough to mitigate the impacts of climate change on community systems due to the lack of addressing the local microclimate. This could lead to increased risk of failure of economic, financial, and industrial policies to sufficiently mitigate and adapt to climate change, which is a primary concern for societies worldwide [1]. Within the framework of the European-funded project New Enabling Visions and Tools for End-useRs and stakeholders thanks to a common MOdeling approach towards a ClimatE neutral and resilient society (NEVERMORE), the case study of the Municipality of Sitia, in Crete, Greece is accordingly examined. Sitia, due to its complex geomorphological characteristics and unique landscapes, calls for a better understanding of high-resolution climate features that would lead to science-based adaptation decisions and support policy making at all scales with high degree of confidence.
The Municipality of Sitia covers the Eastern part of the island of Crete (between 34°90′ N to 35°40′ N and 25°85′ E to 26°35′ E) with an area of 633.22 km2 and a population of 20,268 inhabitants. It has considerable climate variability, with changes in mean temperature and amounts of rainfall, mainly due to the influence of topography (great mountain chains along the central part and other mountainous bodies) on the humid air masses coming over the central Mediterranean Sea, as well as due to its extended coastal zones and numerous islands (Figure 1). The Natural Park of Sitia is located in this region (Sitia UNESCO Global Geopark), which is mainly a mountainous area, with the Zakros Mountains dominating the landscape [2] and the lace-like coastline all along the shores, and many Natura2000 spots [3].
Sitia is one of the regions of the EU most exposed to climate pressures, mainly heat, droughts, and wildfires [4], during summer periods due to its strong dependence on the climate–agriculture–water–biodiversity–tourism nexus. Furthermore, the projected sea level rise is over 1 m (by 2100) [5], and storm surges will induce unexpected changes in the coastline due to coastal erosion [6]. Intense local scale weather patterns due to highly complex topography and air–sea interaction are making a sound response very challenging. The area experiences sustained high winds at the eastern part, and almost 300 sunshine days/year, with few but increasingly intensive rain events [7] and coastal erosion (especially southern coasts) that has been accelerated in recent years [6].
This work is linked to a previous study [8] which derived fine resolution datasets for Greece by downscaling EC-EARTH GCM data to 5 km, being unique in this so far. The focus of this paper is the development of high-resolution climate data based on climate change projections of temperature, precipitation, and the indices of SPI and FWI, using RCPs scenarios [9] and the selection of suitable indicators for these parameters that were further used in stakeholder engagement activities. These were co-produced with the local community, allowing them to gain a better understanding of the spatiotemporal characteristics of the local climate. The geomorphological complexity (e.g., extreme variation of elevation) and vulnerability of the Municipality enhances the need for updated and reliable information on climate change and higher resolution climate data.

2. Methodology

The following methodology was based on previous recent studies [10,11,12,13] and especially on [8], which successfully established confidence in the use of dynamically downscaled simulations. High-resolution climate historical and future validated datasets of temperature and precipitation at 5 km of horizontal resolution [8,10,11,12,13] were derived from the application of the non-hydrostatic weather research and forecasting model (WRF/ARW, v3.6.1) [14] driven by EC-EARTH [15] global model’s simulations for near (2025–2049) and far (2075–2099) future periods under RCP 4.5 and RCP8.5 scenarios, which specified the boundary conditions for the assessment of climate change for the area of Greece. For the need of climate risk assessment study for the area of Sitia, climate indices were estimated related to extreme events, drought, and fire danger. The description and methodology of the calculation of these indices is extensively described in Politi et al., 2022a, 2022b, 2023 [8,16,17].
The spatial distribution of elevation in two different grid resolutions is presented in Figure 2. In the lower resolution grid of 20 km × 20 km (Figure 2A), the landscape of the area appears mainly as a plain of lower altitudes, almost at sea level, with mountainous areas grouped at the southern part of the region. However, in the higher resolution grid (Figure 2B), the geomorphological complexity is revealed, showing how higher altitudes and heterogeneous terrain cover a more extensive part of Sitia. In Figure 2C, the Corine Land Cover, a land monitoring service by Copernicus, is demonstrated. The land use of the area is mainly dedicated to permanent crops, agricultural areas, and shrub/vegetation. Thus, since the geomorphological complexity and biodiversity are well established, the necessity of finer resolution data in cases such as Sitia’s becomes evident.

3. Results

3.1. Temperature’s & Precipitation’s Dynamical Downscaling

The spatial distribution of mean temperature and mean annual precipitation in two different grid resolutions are presented in Figure 3 based on the result of [13]. In the case of temperature, in the lower resolution (Figure 3A), in some regions there is a bigger gradient over mountainous areas and more detailed assessment of the eastern coast, as seen in Figure 3B. Respectively, in the case of precipitation, the mean annual amount appears to change in a similar and horizontal pattern across the region (Figure 3C), whereas in (Figure 3D), it can be observed that high precipitation amounts are located at the western and central parts of the region.

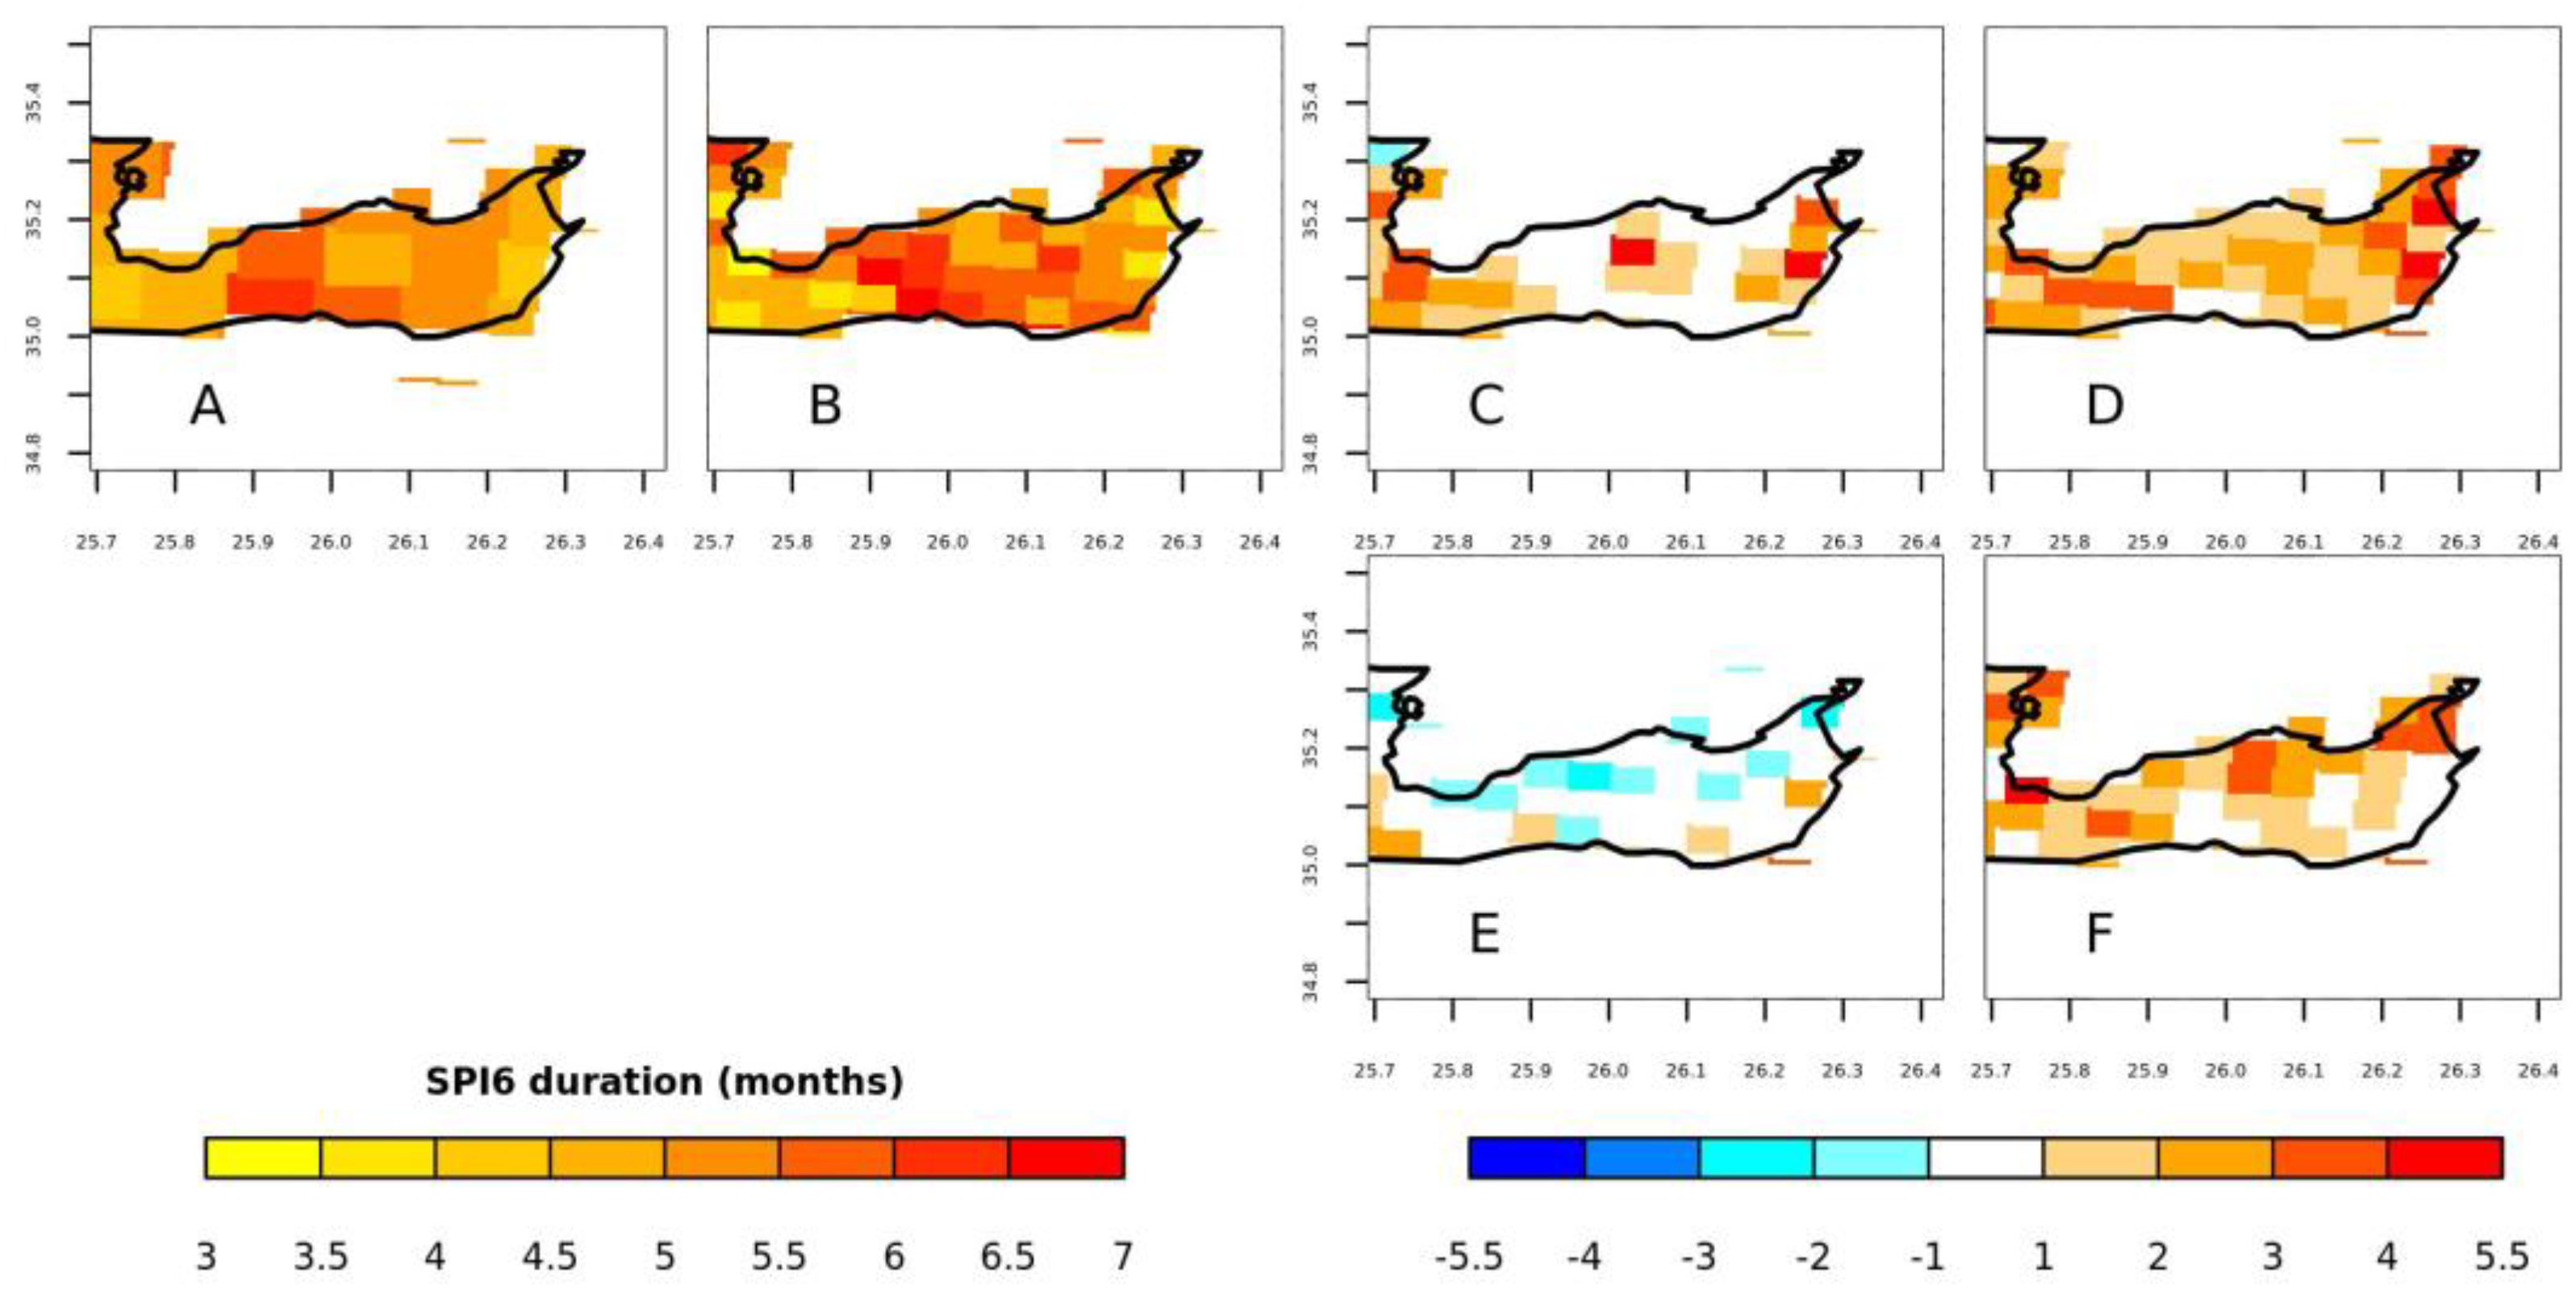
3.2. Drought Index: Standardized Precipitation Index (SPI)

The future SPI’s projections, that were calculated as in [16], show in the RCP4.5 scenario of near-future projection (Figure 4C) that the inland demonstrates a near-zero increase in duration of drought, reaching the highest peak both in the center and the eastern coast of Sitia’s Municipality (5.5 months) of the prefecture. It is pointed out that in many areas no change is noticeable. In the same RCP scenario for far-future projection (Figure 4D) the Municipality in overall showcases an increment with the minimum duration being 1 month up to 5.5 months of drought. In the inland are gathered the smallest increases (1–2 months), as well as the greatest are located in the eastern coast again. On the other hand, the RCP8.5 scenario of near-future projection (Figure 4E) oddly, no change or a decrease of up to 3 months is presented in overall. The only appearance of increment is at the south coast, and it remains limited (1–2 months). In the last RCP8.5 scenario for far-future projection (Figure 4F) can be characterized as the projection with the greatest variations of increases spatially. The discrepancies seem to be more intense, especially between the south and the north of the prefecture, where in the former no changes coexist with limited increment up to 2 months in drought’s duration, and in the latter the peak of the drought’s span appears to be up to 4~5.5 months. According to the analysis, in future drought projection (Figure 4C–F) in the near-future projections (Figure 4C,E,F), an increase in SPI is observed in the eastern coast, where the capital of the Municipality is located. The RCP4.5 scenario (Figure 4C,D), in which the increment of SPI covers the most of the region, seems to be against expectations more ominous than the RCP8.5 scenario (Figure 4E,F), in which not only is the increase in SPI spatially limited, but a decrease is noticed in the near-future projection. The decrease in the SPI can be related to highly localized assessment of the precipitation, made possible with high resolution modelling unearthing features not available in coarser modelling simulations. Considering the historic spatial distribution of SPI (Figure 4B), it can be suggested that regions with a historically high SPI duration will show no change, or even a decrease (max ~3 months), in the RCP8.5 scenario (Figure 4E,F). Furthermore, Figure 4C,D (RCP4.5 scenario) present an overall increment, with a focus on the eastern coast, where the duration reaches ~5.5 extra months of drought.

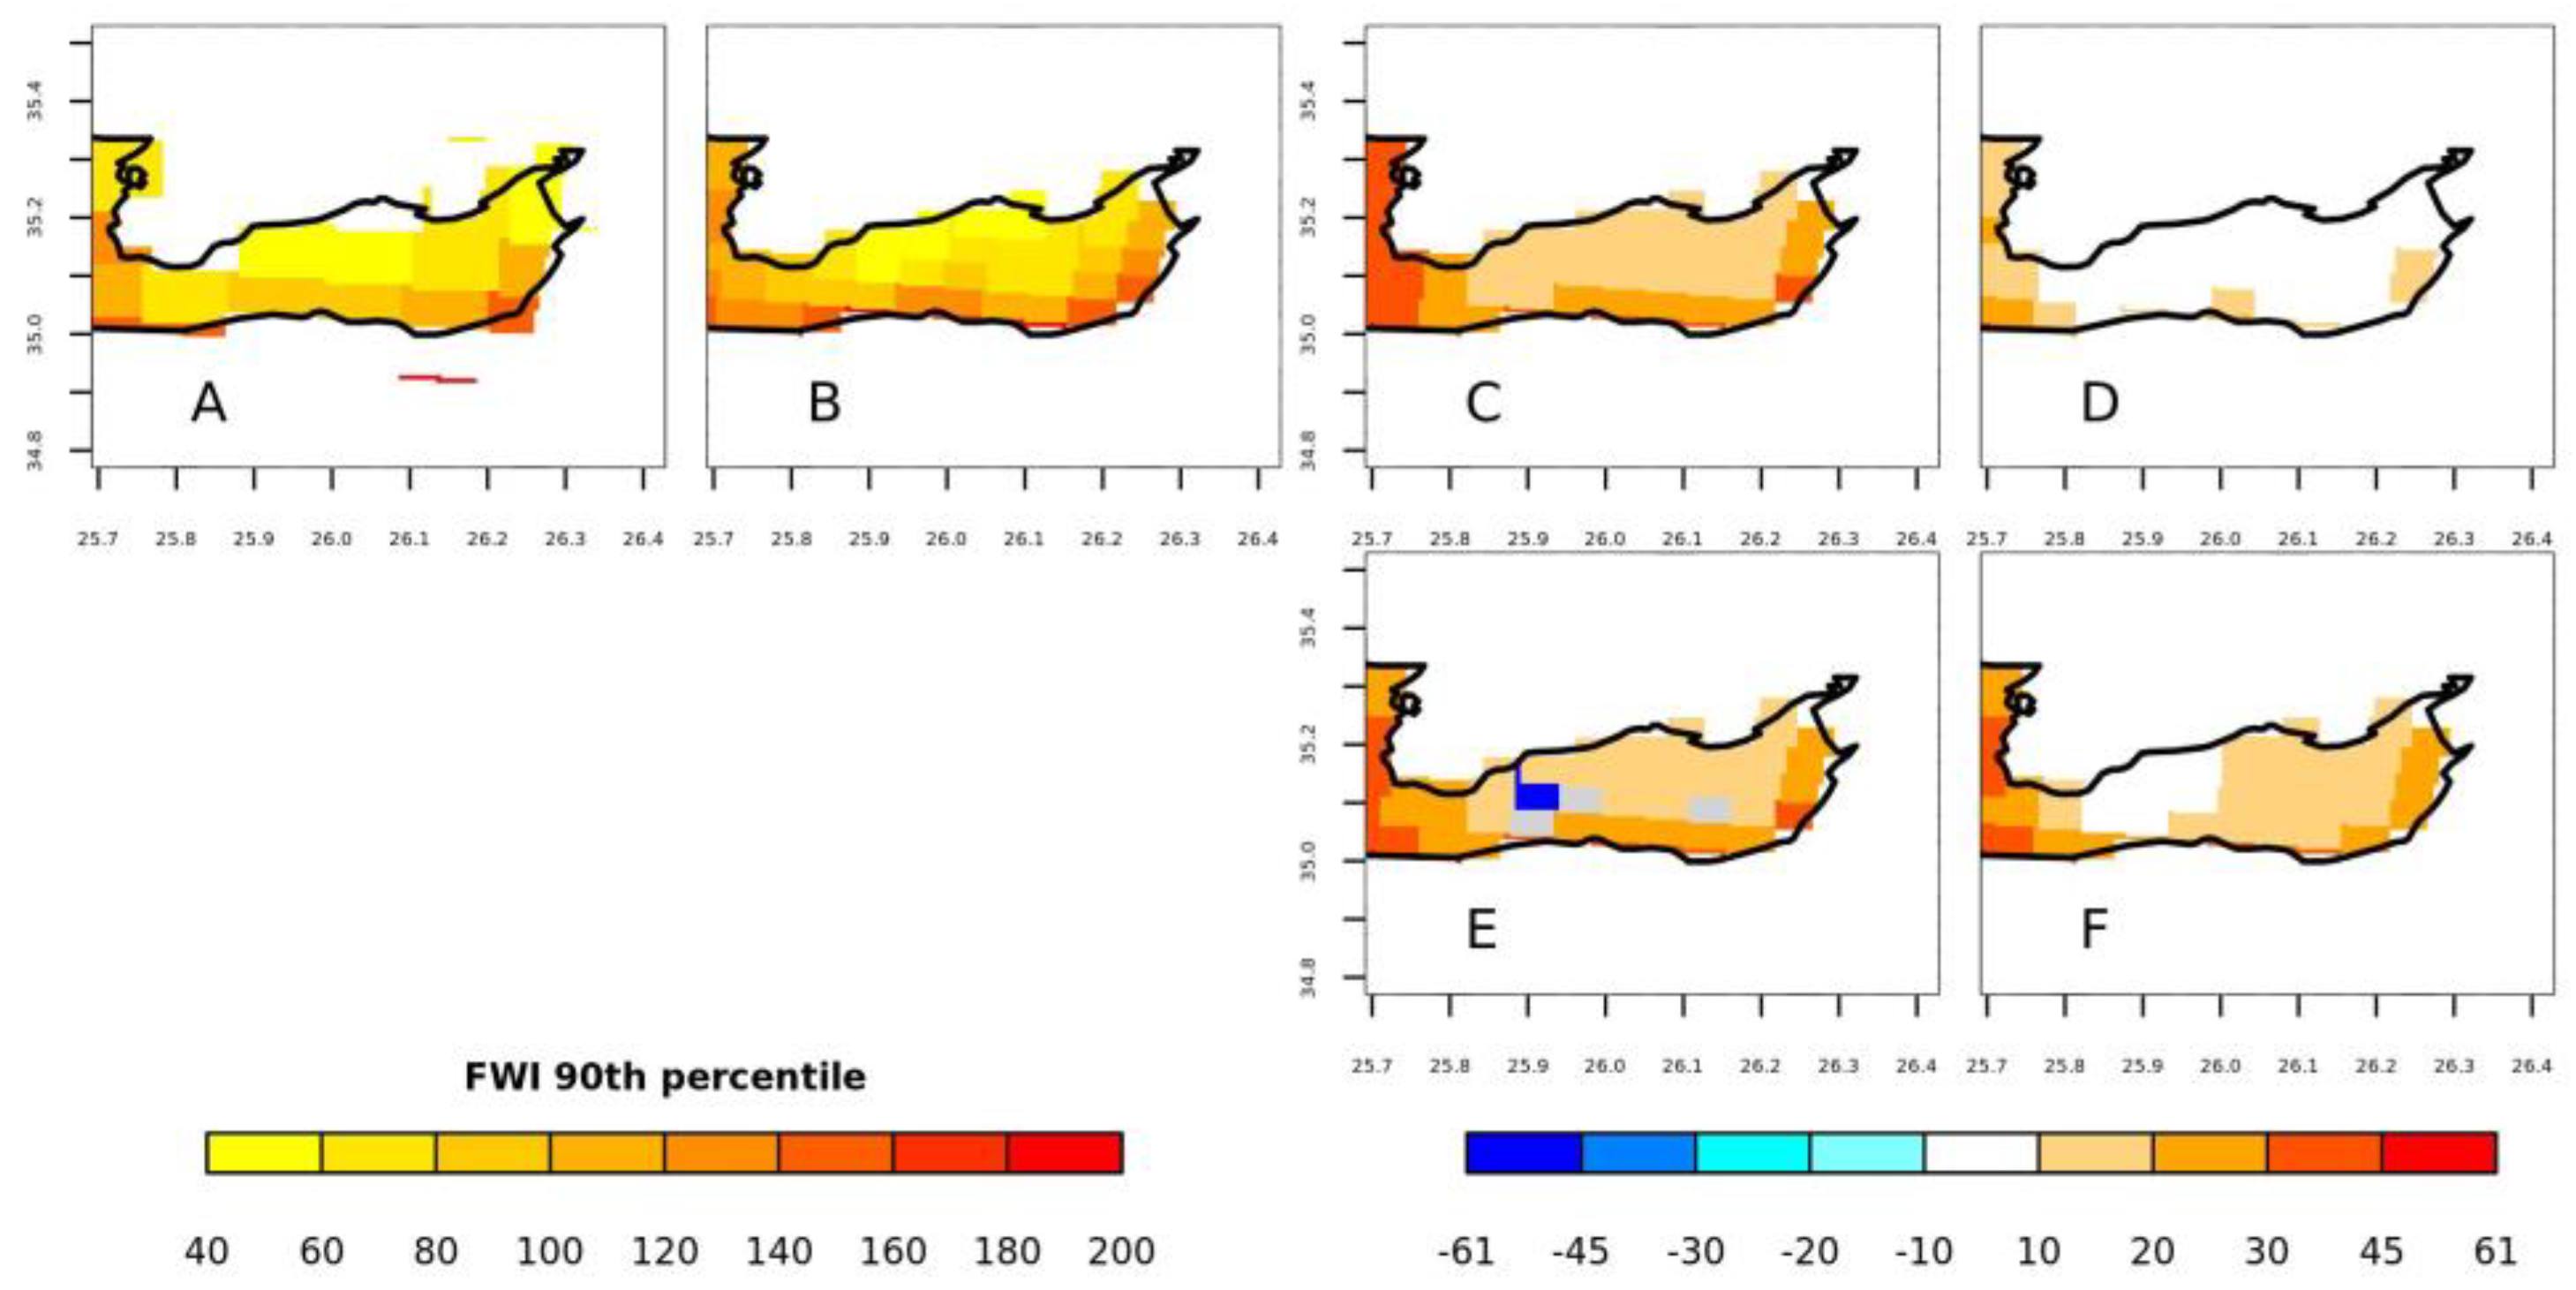
3.3. Fire Index: Fire Weather Index (FWI)

The FWI indices (Figure 5) (calculated as [17]) show (Figure 5A,B) that the southern coastline is more exposed to wildfire than the inland and northern coastline, in both resolutions. The future FWI projections (Figure 5C,F) are proven to be incremental for each emission scenario (RCP4.5 & RCP8.5) in the near- and far-future periods. It is noteworthy that in Figure 5E, a high contrast of the FWI threshold value of the 90th percentile is depicted, where, in some areas, the FWI is decreasing. There is an increase in FWI at the southeast of the region in all the projections. This time, the near-future projections (Figure 5C,E) suggest an increase in the FWI, with the RCP8.5 scenario showing an odd contrast of decrease (~61 days), where the neighboring grey grid cells appear to show no data. The mildest change seems to be the far-future projection in the RCP4.5 scenario (Figure 5D), in which areas of insignificant change in the FWI’s duration is shown. Considering the historic spatial distribution of FWI (Figure 5B), it can be suggested that at the southern coast of the region, where a high FWI preexisted, the increment will be ~30 more days of FWI. Accordingly, on the areas such as the north of Sitia, where the FWI was historically low, future projections remain low (0~10 days)

4. Conclusions

The aim of this study was to highlight the insufficiency of a coarse grid resolution (in this case, 20 × 20 km2) over small and highly complex geomorphology areas like the Municipality of Sitia. It was demonstrated that using a finer resolution of 5 × 5 km2 of dynamical downscaling is more revealing of and accurate to the actual situation concerning temperature and precipitation. These variables can provide a highly detailed assessment of the microclimate characteristics of the region, as demonstrated from the SPI and FWI climate indices.
The more detailed spatial climate information about precipitation and temperature can help distinguishing areas of tourism and agricultural interest that will potentially face more extreme events such as flooding phenomena [18], severe droughts, and wildfires more often, therefore having a greater impact in the future. One of the uses of such information is the preparation of consultation meetings demonstrating data regarding Sitia’s special climate conditions, as well as to cumulate useful opinions and technical and policy recommendations on behalf of the local stakeholders group. The aim is to gain better knowledge on the projected impacts and set the basis for participatory, risk-based policy making.

Author Contributions

Conceptualization, A.S., A.M.G. and P.K.; methodology, N.P.; data curation, N.P.; formal analysis, I.M. and N.P.; writing—original draft preparation, A.M.G.; writing—review and editing, E.K., S.K., D.V. and A.S.; visualization, I.M. and A.M.G.; supervision, A.S.; project administration, D.V. and A.S.; funding acquisition, S.K., A.S. and P.K. All authors have read and agreed to the published version of the manuscript.

Funding

This research was funded by the New Enabling Visions and Tools for End-useRs and stakeholders thanks to a common MOdeling approach towards a ClimatE neutral and resilient society (NEVERMORE) project, Grant agreement ID: 101056858.

Institutional Review Board Statement

Not applicable.

Informed Consent Statement

Not applicable.

Data Availability Statement

The data presented in this study are available on request from the corresponding author.

Acknowledgments

We kindly acknowledge Rita M. Cardoso and Pedro M. M. Soares from the Instituto Dom Luiz of University of Lisbon (Portugal) for providing EC-EARTH model input data and their guidance. This work was supported by computational time granted from the Greek Research and Technology Network (GRNET) in the National HPC facility, ARIS, under projects ID HRCOG (pr004020) and HRPOG (pr006028).

Conflicts of Interest

The authors declare no conflict of interest.

References

  1. Pörtner, H.-O.; Roberts, D.C.; Tignor, M.; Poloczanska, E.S.; Mintenbeck, K.; Alegría, A.; Craig, M.; Langsdorf, S.; Löschke, S.; Möller, V.; et al. IPCC, 2022: Climate Change 2022: Impacts, Adaptation and Vulnerability. Contribution of Working Group II to the Sixth Assessment Report of the Intergovernmental Panel on Climate Change; Cambridge University Press: Cambridge, UK; New York, NY, USA, 2022; 3056p. [Google Scholar]
  2. Theodosiou, E.; Staridas, S. Engine for the local economy growth and the alternative tourism. Examples from other Greek & Global Geoparks. In Proceedings of the Sitia Geopark Conference 2016, Sitia Geopark, Crete, Greece, 26 February 2016. [Google Scholar]
  3. Pediaditi, K.; Moquay, P. Landscape injustices in polarised communities: Unearthing perceptions at Sitia UNESCO Geopark, Greece. Landsc. Res. 2022, 47, 767–782. [Google Scholar] [CrossRef]
  4. Ali, E.; Cramer, W.; Carnicer, J.; Georgopoulou, E.; Hilmi, N.J.M.; Le Cozannet, G.; Lionello, P. Cross-Chapter Paper 4: Mediterranean Region. Clim. Chang. 2022, 2233–2272. [Google Scholar] [CrossRef]
  5. Probst, P.; Annunziato, A. JRC Sea Level Database: Coastal Hazards; JRC Technical Reports; Joint Research Centre (JRC), European Union: Brussels, Belgium, 2017; p. 64. [Google Scholar]
  6. Karathanasi, F.E.; Belibassakis, K.A. A cost-effective method for estimating long-term effects of waves on beach erosion with application to Sitia Bay, Crete. Oceanologia 2019, 61, 276–290. [Google Scholar] [CrossRef]
  7. Agou, V.D.; Varouchakis, E.A.; Hristopulos, D.T. Geostatistical analysis of precipitation in the island of Crete (Greece) based on a sparse monitoring network. Environ. Monit. Assess. 2019, 191, 353. [Google Scholar] [CrossRef] [PubMed]
  8. Politi, N.; Vlachogiannis, D.; Sfetsos, A.; Nastos, P.T. High resolution projections for extreme temperatures and precipitation over Greece. Clim. Dyn. 2022, 61, 633–667. [Google Scholar] [CrossRef]
  9. Pachauri, R.K.; Allen, M.R.; Barros, V.R.; Broome, J.; Cramer, W.; Christ, R.; Church, J.A.; Clarke, L.; Dahe, Q.; Dasgupta, P.; et al. Climate Change 2014: Synthesis Report. Contribution of Working Groups I, II and III to the Fifth Assessment Report of the Intergovernmental Panel on Climate Change; IPCC: Geneva, Switzerland, 2014; p. 151. [Google Scholar]
  10. Politi, N.; Nastos, P.T.; Sfetsos, A.; Vlachogiannis, D.; Dalezios, N.R. Evaluation of the AWR-WRF model configuration at high resolution over the domain of Greece. Atmos. Res. 2018, 208, 229–245. [Google Scholar] [CrossRef]
  11. Politi, N.; Sfetsos, A.; Vlachogiannis, D.; Nastos, P.T.; Karozis, S. A Sensitivity Study of High-Resolution Climate Simulations for Greece. Climate 2020, 8, 44. [Google Scholar] [CrossRef]
  12. Katopodis, T.; Markantonis, I.; Vlachogiannis, D.; Politi, N.; Sfetsos, A. Assessing climate change impacts on wind characteristics in Greece through high resolution regional climate modelling. Renew. Energy 2021, 179, 427–444. [Google Scholar] [CrossRef]
  13. Politi, N.; Vlachogiannis, D.; Sfetsos, A.; Nastos, P.T. High-resolution dynamical downscaling of ERA-Interim temperature and precipitation using WRF model for Greece. Clim. Dyn. 2021, 57, 799–825. [Google Scholar] [CrossRef]
  14. Skamarock, W.C.; Klemp, J.; Dudhia, J.; Gill, D.O.; Barker, D.; Wang, W.; Powers, J.G. A Description of the Advanced Research WRF Version 3; NCAR technical note; National Center for Atmospheric Research: Boulder, CO, USA, 2008. [Google Scholar]
  15. Hazeleger, W.; Severijns, C.; Semmler, T.; Briceag, S.; Yang, S.; Wang, X.; Wyser, K.; Dutra, E.; Baldasano, J.; Bintanja, R.; et al. EC-Earth A Seamless Earth-System Prediction Approach in Action. Bull. Am. Meteorol. Soc. 2010, 91, 1357–1363. [Google Scholar] [CrossRef]
  16. Politi, N.; Vlachogiannis, D.; Sfetsos, A.; Nastos, P.T.; Dalezios, N.R. High Resolution Future Projections of Drought Characteristics in Greece Based on SPI and SPEI Indices. Atmosphere 2022, 13, 1468. [Google Scholar] [CrossRef]
  17. Politi, N.; Vlachogiannis, D.; Sfetsos, A.; Gounaris, N.; Varela, V. Investigation of Fire Weather Danger under a Changing Climate at High Resolution in Greece. Sustainability 2023, 15, 2498. [Google Scholar] [CrossRef]
  18. Lekkas, E.; Diakakis, M.; Mavroulis, S.D.; Katsetsiadou, K.-N.; Gogou, M.E.; Spyrou, N.I.; Mavrouli, M.; Antoniadis, K.; Stamati, E. The October 15, 2022 Flash Flood of Agia Pelagia (Crete, Southern Greece). Newsletter of Environmental, Disaster, and Crises Management Strategies. Available online: https://edcm.edu.gr/images/docs/newsletters/Newsletter_28_2022_Agia-Pelagia_FlashFlood.pdf (accessed on 23 August 2023).
Figure 1. Greek case study: Municipality of Sitia, Crete (green territory).
Environsciproc 26 00170 g001
Figure 2. Left: elevation (m). (A) 20 km × 20 km resolution. (B) 5 km × 5 km resolution. Right: (C) Municipality of Sitia’s land use.
Environsciproc 26 00170 g002
Figure 3. Left: mean temperature (°C), (A) 20 km × 20 km resolution, (B) 5 km × 5 km resolution. Right: mean annual precipitation (mm/year), (C) 20 km × 20 km resolution, (D) 5 km × 5 km resolution. For the historic period of 1980–2004.
Environsciproc 26 00170 g003
Figure 4. Left: SPI, duration in months, historic period of 1980–2004. (A) 20 km × 20 km resolution, (B) 5 km × 5 km resolution. Right: SPI’s duration differences between (C) near-future (2025–2049) and historic (1980–2004), RCP4.5 scenario, (D) far-future (2075–2099) and historic, RCP4.5 scenario, (E) near-future (2025–2049) and historic (1980–2004), RCP8.5 scenario, (F) far-future (2075–2099) and historic (1980–2004), RCP8.5 scenario.
Environsciproc 26 00170 g004
Figure 5. Left: FWI threshold value of the 90th percentile, historic period of 1980–2004, in (A) 20 × 20 km2, (B) 5 × 5 km2. Right: FWI’s duration (days) differences between (C) near-future (2025–2049) and historic (1980–2004), RCP4.5 scenario, (D) far-future (2075–2099) and historic (1980–2004), RCP4.5 scenario, (E) near-future (2025–2049) and historic (1980–2004), RCP8.5 scenario, (F) far-future (2075–2099) and historic (1980–2004), RCP8.5 scenario.
Environsciproc 26 00170 g005
Disclaimer/Publisher’s Note: The statements, opinions and data contained in all publications are solely those of the individual author(s) and contributor(s) and not of MDPI and/or the editor(s). MDPI and/or the editor(s) disclaim responsibility for any injury to people or property resulting from any ideas, methods, instructions or products referred to in the content.

