Proceeding Paper

Assessing the Environmental Impact of Combined Sewer Overflows through a Parametric Study †

1
Department of Engineering, University Luigi Vanvitelli, 81031 Aversa, Italy
2
Department of Civil and Mechanical Engineering, University of Cassino and Southern Lazio, 03043 Cassino, Italy
*
Author to whom correspondence should be addressed.
Presented at the International Conference EWaS5, Naples, Italy, 12–15 July 2022.
Environ. Sci. Proc. 2022, 21(1), 8; https://doi.org/10.3390/environsciproc2022021008
Published: 18 October 2022

Abstract

:
Design and management of combined sewer overflows (CSOs) have been, so far, mainly based only on complying a fixed dilution rate of wastewater in stormwater during rain events. This poses serious environmental issues, since the definition of the acceptable dilution does not consider the characteristics of the upstream urban catchment, nor the climatic features, nor those of the receiving water body. Overflows are usually designed for activation when the mixed discharge reaches about five-times the mean wastewater discharge (though it may vary, depending on country regulations), the latter being the mean dry weather wastewater discharge. Accordingly, recent regulations started enforcing limits also on the frequency of overflows. Overflow activation frequency and discharged volumes of pollutants may depend on the upstream catchment features as well as on the precipitation regime. The great variability in these factors could make the impact on the receiving water body of similarly designed overflows quite different. In this study, the behavior of a CSO placed at the outlet of urban catchments with the same size but different characteristics was simulated with SWMM. The considered hydrological parameters were catchment imperviousness, width and slope, Manning coefficient and depression storage. Served population characteristics affecting the combined sewer hydraulic regime were studied by changing the population density and the mean wastewater discharge per capita. After defining realistic ranges for each parameter, the time series of discharged overflows were calculated for all the combinations of the variable catchment parameters, corresponding to 20-year-long precipitation series from a single rain gauge. The obtained results, although preliminary, indicate that CSOs’ impact on the receiving water body strongly depends on the characteristics of the upstream urban catchment. Therefore, such characteristics should be considered in CSO design and management.

1. Introduction

Environmental and health issues arising from the combined sewer overflows (CSOs) are of great concern in urban drainage, as most of the sewer systems in cities are combined [1]. Combined sewer systems (CSSs) are designed to convey both wastewater and stormwater during rain events. Especially during the latter, the combined water flow can increase to the extent that the operation of the downstream wastewater treatment plant (WTP) can be affected [2] or floods may occur along the drainage system [1]. To remedy to this, it is common to place one or more overflow discharge structures at convenient locations along the drainage system, so that they are activated at a certain flow rate or water level. The exceeding water is then diverted to a receiving water body with the assumption that an acceptable dilution rate is achieved by the mixing of the foul water with the storm water [3]. However, it is well known that CSOs may determine uncontrolled amounts of pollutants to be discharged into the water body, so have a strong negative impact on the environment [4]. Moreover, emerging pollutants (e.g., microplastics [5,6,7,8,9]) can find their way in water bodies through CSOs.
The assumption about wastewater dilution in stormwater results in the common practice of using a fixed dilution rate C between the generic wet weather flow Q at the overflow location and the mean wastewater discharge Q m w in dry weather conditions, to assess whether the free discharge in the water body can take place or not through CSOs:
C = Q Q m w
Different values for C can be found in the literature, e.g., in the UK, C = 6 was used until 1970 [1] or an Italian law in 1996 [10] set C 3 . In Italian technical literature, the dilution rate is often assumed equal to 5, where this value is obtained as the ratio of the plausible biochemical oxygen demand after five days (BOD5) concentration of the wastewater by the threshold imposed by an old Italian law [11] for treated water to be freely discharged into water bodies:
C = 200 m g L 40 m g L = 5
For instance, the same coefficient C = 5 was also adopted by Lazio regional government (Italy) in 2018 [12].
Although regulations have changed over the years, it was clear in 1970 [13], as well as today, that a fixed CSO setting does not seem to be sufficient to prevent environmental pollution. For this reason, some regulators are trying to enforce enhanced rules to prevent pollution from CSOs [14] (e.g., maximum frequency of spills).
More realistically, the rainfall regime and its modification over decades [15] and the hydrological and water consumption characteristics of urban catchments, also changing in many cases, may have an influence on CSO behavior, namely the frequency of activation of the overflow and the discharged volumes. The latter, when coupled with knowledge on the characteristics of pollutants, give the amount of pollutants disposed into water bodies.
Hydrological simulation at urban catchment scale is a useful tool to study urban drainage phenomena and a rich literature exists on different hydrological models to suit different simulation needs [16]. So far, many works have approached the problem of the behavior of CSOs through software modelling, experimental setups or hybrid approaches [4,17], but few have extensively tackled the great uncertainty in modelling CSOs resulting from different parametrization of catchment models.
To give a contribution on this aspect, in this study, a method to assess CSOs variability, based on these latter characteristics, was developed through hydrological simulations in SWMM within a Python 3 software framework.

2. Methods

A simplified method to assess CSOs’ uncertainty was developed, taking advantage of a software framework written for the purpose.

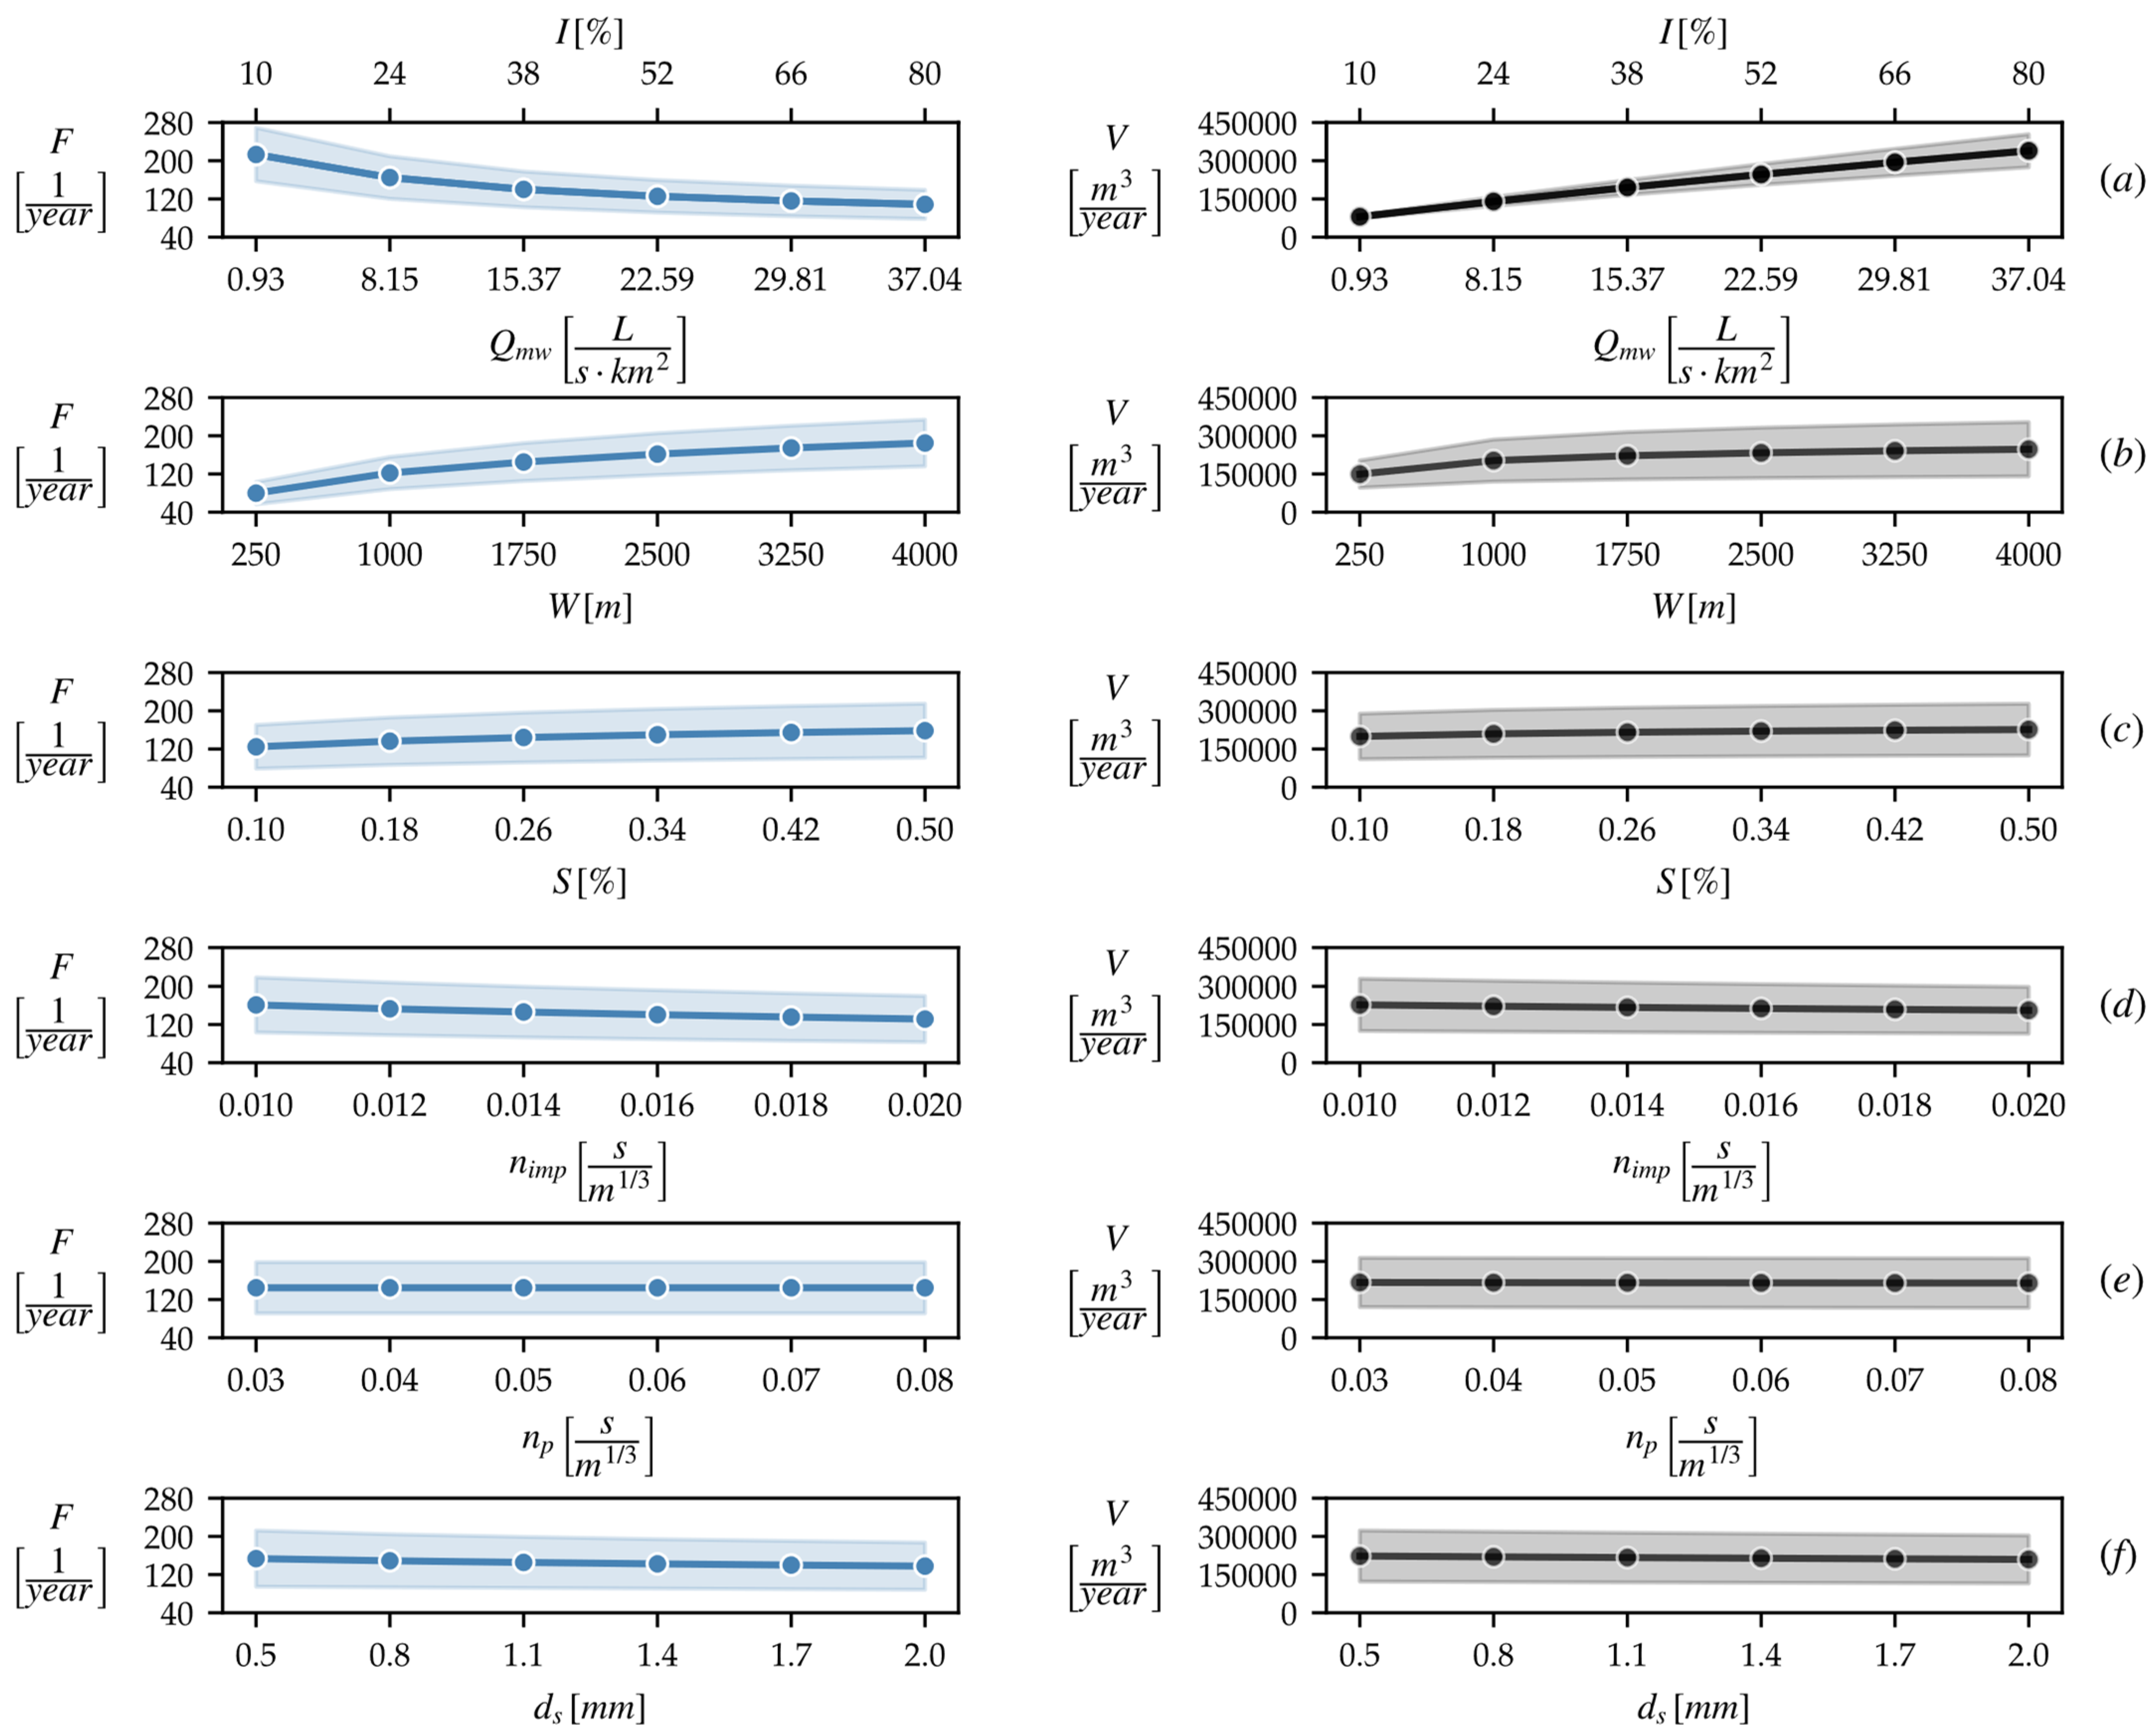
2.1. Model Input Parameters

A lumped urban catchment with an area A = 1   k m 2 was considered (Figure 1). For the sake of focusing on how different hydrological and urban characteristics affect CSOs, the drainage network was here neglected.
In order to characterize the impact of the CSOs on receiving water bodies, it is important to assess some key variables, such as:
  • The number of activations of overflows, namely the spills in a year;
  • The volume of polluted water discharged in a year.
Aiming at a better understanding of CSO events, this work dealt with these two variables, defined as follows:
F y = i = 1 N f i y
V y = i = 1 N D i y Δ t
being:
  • F y the number of overflow events expressed in [ y e a r 1 ] relevant to the y t h year;
  • V y the volume of water discharged expressed in [ m m y e a r ] relevant to the y t h year;
where:
f i y = { 1 , D i y > 0 D i + t Δ t y = 0 0 , D i y = 0
and:
D i y = Q i y + Q m w C Q m w 0
  • N = Δ T Δ t is the number of Δ t time steps in the interval Δ T = 1   y e a r ;
  • Δ t = 10   m i n is the time step resolution of the results of the simulations;
Where t is the inter-event time, that is the interval of time defining two different events of overflow, considered equal to t = 10   m i n u t e s in this study and where D i y is the discharged flow at the i t h time step relevant to the y t h year, calculated as the difference between the resulting runoff Q i y plus the mean wastewater discharge Q m w and C Q m w , the latter being the setting threshold of overflow activation.
In this study we investigated the case corresponding to C = 5. To identify the ranges of hydrological and urban characteristics to be investigated (Table 1), the 50 most densely populated Italian cities were considered. The daily water use per capita ( D W C ) [18] and the population density ( P D ) were made available from ISTAT. The percentage of the impervious surfaces ( I ) was implied from Di Fabbio et al. [19], the ISPRA [20] and the SWMM user manual [21,22]. The width ( W ) parameter was calculated assuming different shapes for the catchment. Slope ( S ) is subject to specific site orography: as per the current study, flat urban environments were considered. For the Manning roughness coefficients ( n i m p ,   n p ) and the depression storage ( d s ), references were made to SWMM user manual [21] and to Yen (2001) [23].
Under the assumption that densely populated cities are also highly urbanized, the parameters D W C ,   D P and I were considered as linearly dependent from each other: the first two were integrated into the Q m w expression:
Q m w = ( φ P D D W C )   ~   I
where φ = 0.8 was assumed as the ratio of the water being conveyed to the CSS after use by the water distributed in the water distribution network (WDN). Equation (6) expresses the production of sewage per unit surface. This assumption led to a significant reduction in the computational time required to run all the simulations, since the eight parameters investigated would have resulted in 6 8 scenarios, while aggregating D W C , P D and I resulted in the number of simulations being reduced to 6 6 , with a 36-times reduction.

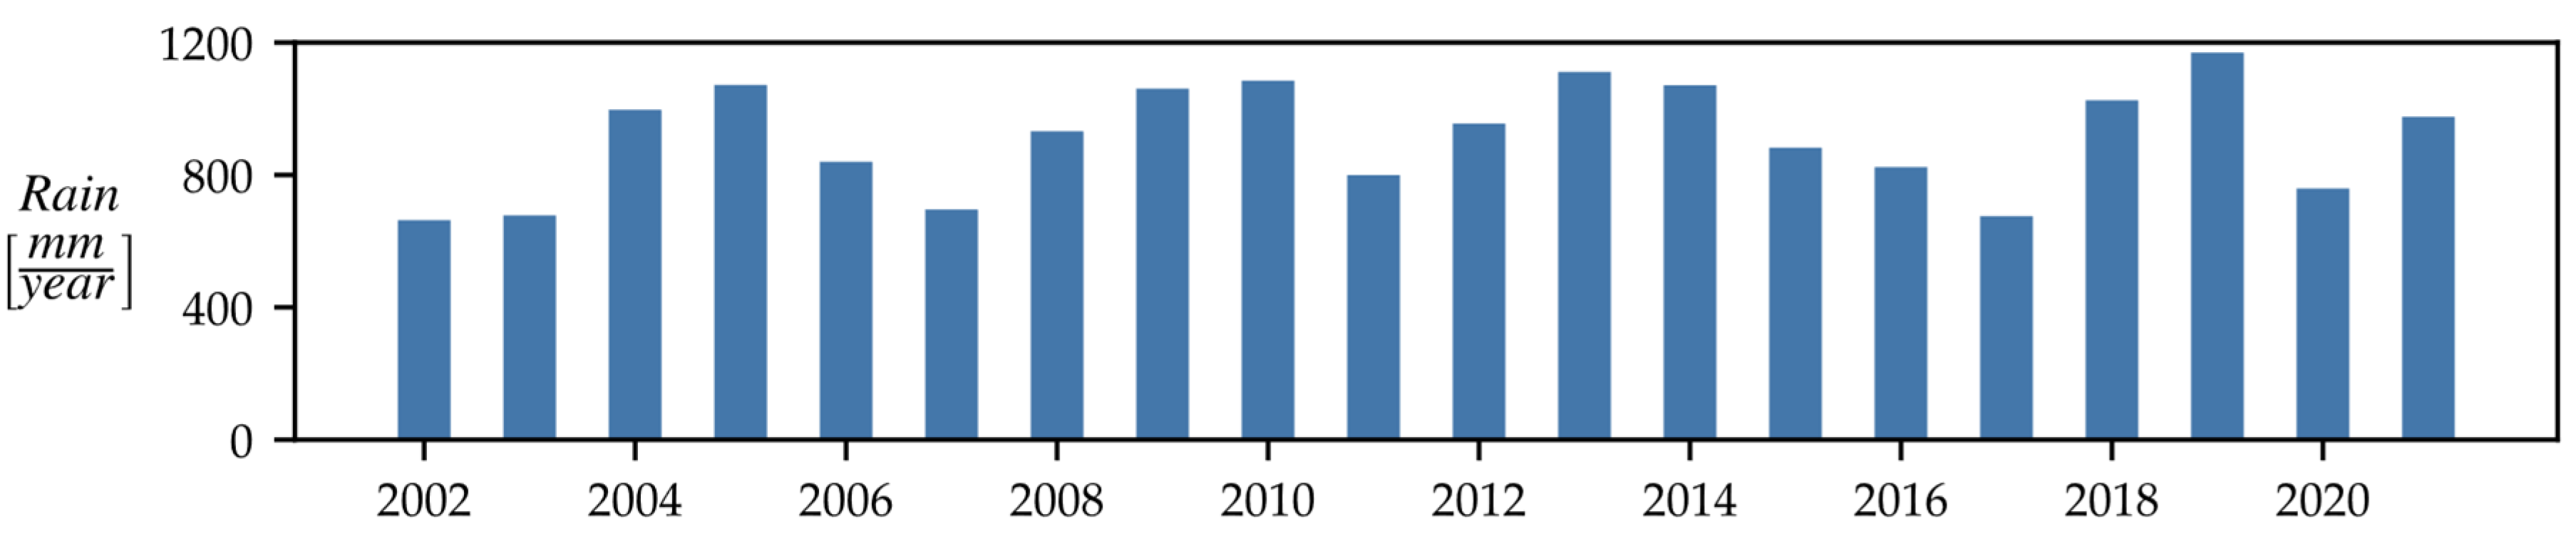
2.2. Rainfall Input Data

The rainfall time series registered by a rain gauge in Ercolano, an Italian city near the coast in the province of Naples, were used as input (Figure 2): they had a resolution of 10 min and covered the period from 2002 to 2021 (included). A simple pre-processing of the data was carried out to remove outliers.

2.3. Software Framework

From Equation (6) and Table 1, it follows that the total number of parameter combinations to be simulated was:
n = 6 6
To evaluate F y and V y corresponding to all the combinations of the parameters, a software framework for the hydrological simulations was set up and it consisted of:
(a)
SWMM 5.1 [24] as the core simulation software for each single run that covered 20 years of rainfall events;
(b)
A Python 3 program written for the purpose, also taking advantage of multiprocessing to substantially reduce the remarkable amount of time needed for the simulations.
Since SWMM itself does not allow one to run multiple models simultaneously, the Python program embedded two packages:
  • “pyswmm 1.1.1” [25]: it has been employed to run the engine of SWMM;
  • “swmm-api 0.2.0.16” [26]: it has been employed to generate the 6 6 scenarios as different input files to be run, as well as to read the output files.

3. Results

After running the simulations, the total number of results for F y and V y was, respectively, 20 6 6 , corresponding to the case of C = 5 . Histogram plots (Figure 3) highlight the high variability in the variables with respect to all the investigated scenarios.
F y may vary between 26   y e a r 1 and 553   y e a r 1 with a variability of 21.27 times, while V y may vary between 38.98 m m y e a r and 645.75 m m y e a r with a variability of 16.57 times. Average values, standard deviations and interquartile ranges for F y and V y are given in Table 2.
To evaluate the influence of the yearly rainfall in Ercolano on CSOs, the average values of F y and V y were plotted against the yearly rainfall in Ercolano. Figure 4 shows how CSOs are directly proportional to yearly rainfall.
Correlations between the output data from the 6 6 simulated models for a period of 20 years and the input parameters were searched for, giving the trends shown in Figure 5. In particular, the charts represent the influence of each parameter on the average of F y and on the average of V y , defined as follows:
F = y = 2002 2021 F y 20 ;                             V = y = 2002 2021 V y 20
The most influential parameters on F and V are summarized in Table 3.
It is worth noting that with the same assumed dilution coefficient C = 5 for the activation of the CSO, greater sewage production leads to less frequent activations, but to greater discharged volume. The sewage production is, in turn, due to D W C and P D , as expressed by Equation (6).

4. Conclusions

The results, although preliminary, show that the average frequency of activation of CSOs and the average discharged volume of polluted water into receiving water bodies depend on hydrological and population characteristics of urban catchments, as well as on the rainfall regime. The parameters mostly affecting the two variables seem to be the average wastewater discharge per unit area; imperviousness and shape of catchments (through the width parameter); rainfall regime. The results also suggest that a deterministic statement of the dilution coefficient does not bind the behavior of CSOs to simply predictable ranges of the frequency of activation and the discharged volume and, indeed, it may not be sufficient to assess the environmental impact of CSOs nor to assure an acceptable level of protection of receiving water bodies from pollution. Instead, multi-scenario simulations could serve as an important tool to assess overflow variability with more accuracy, thus, to design site-specific CSO structures with more detail. Future studies will delve more deeply into the parameter sensitivity analysis and will involve the use of different rainfall regimes, along with different dilution coefficients.

Author Contributions

Conceptualization, A.F., A.D.N., R.G. (Rudy Gargano) and R.G. (Roberto Greco); Methodology, A.F., A.D.N., R.G. (Rudy Gargano) and R.G. (Roberto Greco); Software, A.F.; Data curation, A.F.; Writing, A.F.; Editing, A.D.N., R.G. (Rudy Gargano) and R.G. (Roberto Greco); Supervision, A.D.N., R.G. (Rudy Gargano) and R.G (Roberto Greco). All authors have read and agreed to the published version of the manuscript.

Funding

This research was funded by INPS (https://www.inps.it/news/dottorati-di-ricerca-2019-20-pubblicato-il-bando) as part of the Ph.D. project “Sustainability of the integrated water cycle with reference to the impact of overflow discharges on the environment” within the Doctoral Course “A.D.I.” of Università degli Studi della Campania “L. Vanvitelli” in partnership with GORI S.p.A.

Conflicts of Interest

The authors declare no conflict of interest.

List of Acronyms

BOD5Biochemical oxygen demand after 5 days
CSOCombined sewer overflow
CSSCombined sewer system
ISTAT Istituto Nazionale di Statistica
SWMMStorm water management model
WDNWater distribution network
WTPWastewater treatment plant

References

  1. Butler, D.; Digman, C.J.; Makropoulos, C.; Davies, J.W. Urban Drainage, 4th ed.; CRC Press: Boca Raton, FL, USA, 2018; ISBN 9781498750585. [Google Scholar] [CrossRef]
  2. Banik, B.K.; Di Cristo, C.; Leopardi, A.; de Marinis, G. Illicit Intrusion Characterization in Sewer Systems. Urban Water J. 2017, 14, 416–426. [Google Scholar] [CrossRef]
  3. Papiri, S. Gli Scaricatori Di Piena Nelle Fognature Miste Alla Luce Dei Risultati Di Una Simulazione Continua Quali-Quantitativa Delle Acque Meteoriche Nel Bacino Urbano Sperimentale Di Cascina Scala (Pavia). In Atti della II Conferenza Nazionale sul Drenaggio Urbano; Università degli Studi di Pavia: Pavia, Italy, 2000; pp. 10–12. [Google Scholar]
  4. Owolabi, T.A.; Mohandes, S.R.; Zayed, T. Investigating the Impact of Sewer Overflow on the Environment: A Comprehensive Literature Review Paper. J. Environ. Manag. 2022, 301, 113810. [Google Scholar] [CrossRef] [PubMed]
  5. Di Nunno, F.; Granata, F.; Parrino, F.; Gargano, R.; de Marinis, G. Microplastics in Combined Sewer Overflows: An Experimental Study. J. Mar. Sci. Eng. 2021, 9, 1415. [Google Scholar] [CrossRef]
  6. The European Parliament and the Council of the European Union Directive (EU) 2020/2184, EU (Revised) Drinking Water Directive. Off. J. Eur. Communities 2020, 2019, 1–62.
  7. Koelmans, A.A.; Mohamed Nor, N.H.; Hermsen, E.; Kooi, M.; Mintenig, S.M.; De France, J. Microplastics in Freshwaters and Drinking Water: Critical Review and Assessment of Data Quality. Water Res. 2019, 155, 410–422. [Google Scholar] [CrossRef]
  8. Yang, Y.; Liu, W.; Zhang, Z.; Grossart, H.P.; Gadd, G.M. Microplastics Provide New Microbial Niches in Aquatic Environments. Appl. Microbiol. Biotechnol. 2020, 104, 6501–6511. [Google Scholar] [CrossRef]
  9. World Health Organization. Microplastics in Drinking-Water; World Health Organization: Geneva, Switzerland, 2019; ISBN 9789241516198. [Google Scholar]
  10. Decreto del Presidente del Consiglio dei Ministri (D.P.C.M.). 4 Marzo 1996 Disposizioni in Materia Di Risorse Idriche. 1996, pp. 571–617. Available online: https://www.gazzettaufficiale.it/eli/id/1996/03/14/096A1670/sg (accessed on 1 April 2022).
  11. Merli, L.; Pro, F. Norme per La Tutela Delle Acque Dall’inquinamento. Available online: https://www.reteambiente.it/repository/normativa/761_legge_merli.pdf (accessed on 1 April 2022).
  12. Lazio, R. Deliberazione Giunta Regionale n.18-Piano Di Tutela Delle Acque-Norme Tecniche Di Attuazione. Available online: https://static.comune.aprilia.lt.it/uploads/2019/03/NA_PTAR_2018.pdf (accessed on 1 April 2022).
  13. Ministry of Housing and Local Government. Technical Committee on Storm Overflows and the Disposal of Storm Sewage—Final Report; Ministry of Housing and Local Government: London, UK, 1970; ISBN 011750209X.
  14. ARERA Regolazione Della Qualità Tecnica Del Servizio Iddrico Integrato Ovvero Di Ciascuno Dei Singoli Servizi Che Lo Compongono (RQTI). Available online: https://www.arera.it/it/docs/17/917-17.htm# (accessed on 1 April 2022).
  15. Caporali, E.; Lompi, M.; Pacetti, T.; Chiarello, V.; Fatichi, S. A Review of Studies on Observed Precipitation Trends in Italy. Int. J. Climatol. 2020, 41, E1–E25. [Google Scholar] [CrossRef]
  16. Salvadore, E.; Bronders, J.; Batelaan, O. Hydrological Modelling of Urbanized Catchments: A Review and Future Directions. J. Hydrol. 2015, 529, 62–81. [Google Scholar] [CrossRef]
  17. Botturi, A.; Ozbayram, E.G.; Tondera, K.; Gilbert, N.I.; Rouault, P.; Caradot, N.; Gutierrez, O.; Daneshgar, S.; Frison, N.; Akyol, Ç.; et al. Combined Sewer Overflows: A Critical Review on Best Practice and Innovative Solutions to Mitigate Impacts on Environment and Human Health. Crit. Rev. Environ. Sci. Technol. 2021, 51, 1585–1618. [Google Scholar] [CrossRef]
  18. ISTAT Utilizzo E Qualità Della Risorsa Idrica In Italia; Istituto Nazionale di Statistica: Roma, Italia, 2019; ISBN 9788845819766.
  19. Di Fabbio, A.; Di Leginio, M.; Giordano, F.; Guerrieri, L.; Leoni, I.; Munafò, M.; Viti, S. Impermeabilizzazione e Consumo Dei Suoli Nelle Aree Urbane. Ecol. Urbana 2007, XIX, 3–12. [Google Scholar]
  20. SNPA. Consumo Di Suolo, Dinamiche Territoriali e Servizi Ecosistemici. Edizione 2021; Sistema Nazionale per la Protezione dell’Ambiente (SNPA): Roma, Italy, 2021; ISBN 9788844810597. [Google Scholar]
  21. Rossman, L.A.; Huber, W.C. Storm Water Management Model Reference Manual Volume I–Hydrology; U.S. EPA Office of Research and Development: Washington, DC, USA, 2016.
  22. United States Environmental Protection Agency(USEPA). Estimating Change in Impervious Area (IA) and Directly Connected Impervious Areas (DCIA) for Massachusetts Small MS4 Permit. U.S. Environ. Prot. Agency 2011, 2014, 1–5. [Google Scholar]
  23. Yen, B.C. Hydraulics of Sewer Systems. In Stormwater Collection Systems Design Handbook; McGraw-Hill Education: New York, NY, USA, 2001; ISBN 9780071354714. [Google Scholar]
  24. U.S. Environmental Protection Agency (EPA) Storm Water Management Model (SWMM) User’ s Manual; U.S. Environmental Protection Agency: Washington, DC, USA, 2015; pp. 1–353.
  25. McDonnell, B.; Ratliff, K.; Tryby, M.; Wu, J.; Mullapudi, A. PySWMM: The Python Interface to Stormwater Management Model (SWMM). J. Open Source Softw. 2020, 5, 2292. [Google Scholar] [CrossRef]
  26. Pichler, M. Swmm-api: API for Reading, Manipulating and Running SWMM-Projects with Python (0.2.0.16). Zenodo. 2022. Available online: https://doi.org/10.5281/zenodo.5862141 (accessed on 1 April 2022).
Figure 1. Scheme of the urban catchment simulated in SWMM 5.1.
Environsciproc 21 00008 g001
Figure 2. Yearly rain in Ercolano. http://centrofunzionale.regione.campania.it/#/pages/sensori/archivio-pluviometrici (accessed in 1 April 2022).
Environsciproc 21 00008 g002
Figure 3. Histogram plots for F y (a) and V y (b): each variable, respectively, covers 20 6 6 values from the output results while 50 bins are shown.
Environsciproc 21 00008 g003
Figure 4. Influence of annual rainfall on F y (a) and V y (b).
Environsciproc 21 00008 g004
Figure 5. Influence of investigated parameters on frequency F and volume V . (a) mean wastewater discharge and imperviousness; (b) width; (c) slope; (d) impervious Manning; (e) pervious Manning; (f) depression storage. Markers stand for the average of F and V relevant to each parameter’s value; bands stand for the standard deviation relevant to the remaining 6 5 scenarios.
Environsciproc 21 00008 g005
Table 1. Ranges of investigated hydrological and population parameters: 6 values are attributed to each parameter, linearly sampling them between a minimum and a maximum value.
ParameterValues
Daily Water use per Capita D W C [ L p d a y ] [ 100 ,   180 ,   260 ,   340 ,   420 ,   500 ]
Population Density P D [ p k m 2 ] [ 1000 ,   2400 ,   3800 ,   5200 ,   6600 ,   8000 ]
Impervious surface I [ % ] [ 10 ,   24 ,   38 ,   52 ,   66 ,   80 ]
Width W [ m ] [ 250 ,   1000 ,   1750 ,   2500 ,   3250 ,   4000 ]
Average Slope S [ % ] [ 0.1 ,   0.18 ,   0.26 ,   0.34 ,   0.42 ,   0.5 ]
n Manning of impervious surfaces n i m p [ s m 1 3 ] [ 0.01 ,   0.012 ,   0.014 ,   0.016 ,   0.018 ,   0.02 ]
n Manning of pervious surfaces n p [ s m 1 3 ] [ 0.03 ,   0.04 ,   0.05 ,   0.06 ,   0.07 ,   0.08 ]
Depression Storage of impervious surfaces d s [ m m ] [ 0.5 ,   0.8 ,   1.1 ,   1.4 ,   1.7 ,   2 ]
Table 2. Average values, standard deviations and interquartile ranges for F y and V y .
Mean μ Standard
Deviation σ
Interquartile Range I Q R
F y   [ y e a r 1 ] 145 64 [ 98 ; 178 ]
V y   [ m m y e a r ] 215.80 108.45 [ 126.85 ; 290.51 ]
Table 3. Most influential parameters on F and V : the ranges are intended with respect to the mean values of F and V as in Table 2.
F   [ y e a r 1 ] V   [ m m y e a r ]
Increase W   : [ 45 % ÷ + 28 % ] Q m w ~ I   : [ 63 % ÷ + 57 % ]
Decrease Q m w ~ I   : [ + 47 % ÷ 25 % ] n i m p   : [ + 5 % ÷ 5 % ]
Publisher’s Note: MDPI stays neutral with regard to jurisdictional claims in published maps and institutional affiliations.

