Proceeding Paper

Design and Experimental Performance Characterization of a Three-Blade Horizontal-Axis Hydrokinetic Water Turbine in a Low-Velocity Channel †

by
Roberta Ferraiuolo
1,*,
Ahmed Gharib-Yosry
2,
Aitor Fernández-Jiménez
3,
Rodolfo Espina-Valdés
3,
Eduardo Álvarez-Álvarez
4,
Giuseppe Del Giudice
1 and
Maurizio Giugni
1
1
Department of Civil, Architectural and Environmental Engineering, University of Naples Federico II, 80125 Naples, Italy
2
Mechanical Power Department, Faculty of Engineering, Port Said University, Port-Said 42526, Egypt
3
GIFD Group—EP Mieres, University of Oviedo, 33600 Mieres, Spain
4
Energy Department, University of Oviedo, Wifredo Ricart s/n, 33204 Gijón, Spain
*
Author to whom correspondence should be addressed.
Presented at the International Conference EWaS5, Naples, Italy, 12–15 July 2022.
Environ. Sci. Proc. 2022, 21(1), 62; https://doi.org/10.3390/environsciproc2022021062
Published: 1 November 2022

Abstract

:
The present work describes the design process of a 3D-printed prototype of a three-blade horizontal-axis hydrokinetic water turbine (HAHWT). The employed blade profile is an EPPLER818, which was previously studied through the Q-Blade software according to the velocity range presumed (v < 1 m/s) in the experiments. The prototype performance was studied in a recirculating water channel at the Polytechnic Engineering School of Mieres (Oviedo University), with a gate of variable height at the channel end, which allows for performing different hydrodynamic scenarios upon varying the considered flow rate. The results show that the extracted power increases due to the equally increased blockage ratio, which represents the ratio between the turbine area and the channel area. However, an excessive increase in the blockage ratio corresponds to a power reduction effect due to the reduction in the effective area and the generation of a two-phase air-water condition.

1. Introduction

Traditional hydroelectric plants are vastly used worldwide to provide electricity to densely populated areas. In 2020, global net hydropower additions reached 21 GW (+40% from 2019), reversing the five-year trend of growth decline. Almost 60% of the new capacity was commissioned through several large-scale projects in China, the country that has led global hydropower growth since 1996 [1]. Furthermore, the impacts of the COVID-19 outbreak and the actual energy crises trigged by the current conflict between Russia and Ukraine have demonstrated the resilience of renewable sources and their fundamental role in the future of ecological transition. In such a context, the global electricity demand is expected to grow by approximately 5% in 2021 and 4% in 2022, driven by global economic recovery [2]. This is why, currently, several researchers are investigating micro-hydrokinetic turbines to perform an alternative for renewable energy production, especially at locations where conventional hydropower cannot provide a feasible solution [3,4,5,6,7,8]. Hydrokinetic turbines are devices that transform the kinetic energy of water flow into mechanical energy in a shaft and, finally, into electrical energy in a generator. These kinds of turbines usually are classified into horizontal and vertical axes according to the mutual position of the rotation axis and flow direction. Namely, in the horizontal one, the axis of rotation is parallel to the flow direction, whereas, in the vertical one, the axis is orthogonal to the flow direction [9,10]. The design of axial flow micro-turbines is similar to the wind flow and tidal turbines; specifically, these kinds of rotors are more efficient than drag devices with a vertical axis because they harness energy from the lift force, for this reason, they are defined as lifting devices [11].

1.1. Rotor Performance
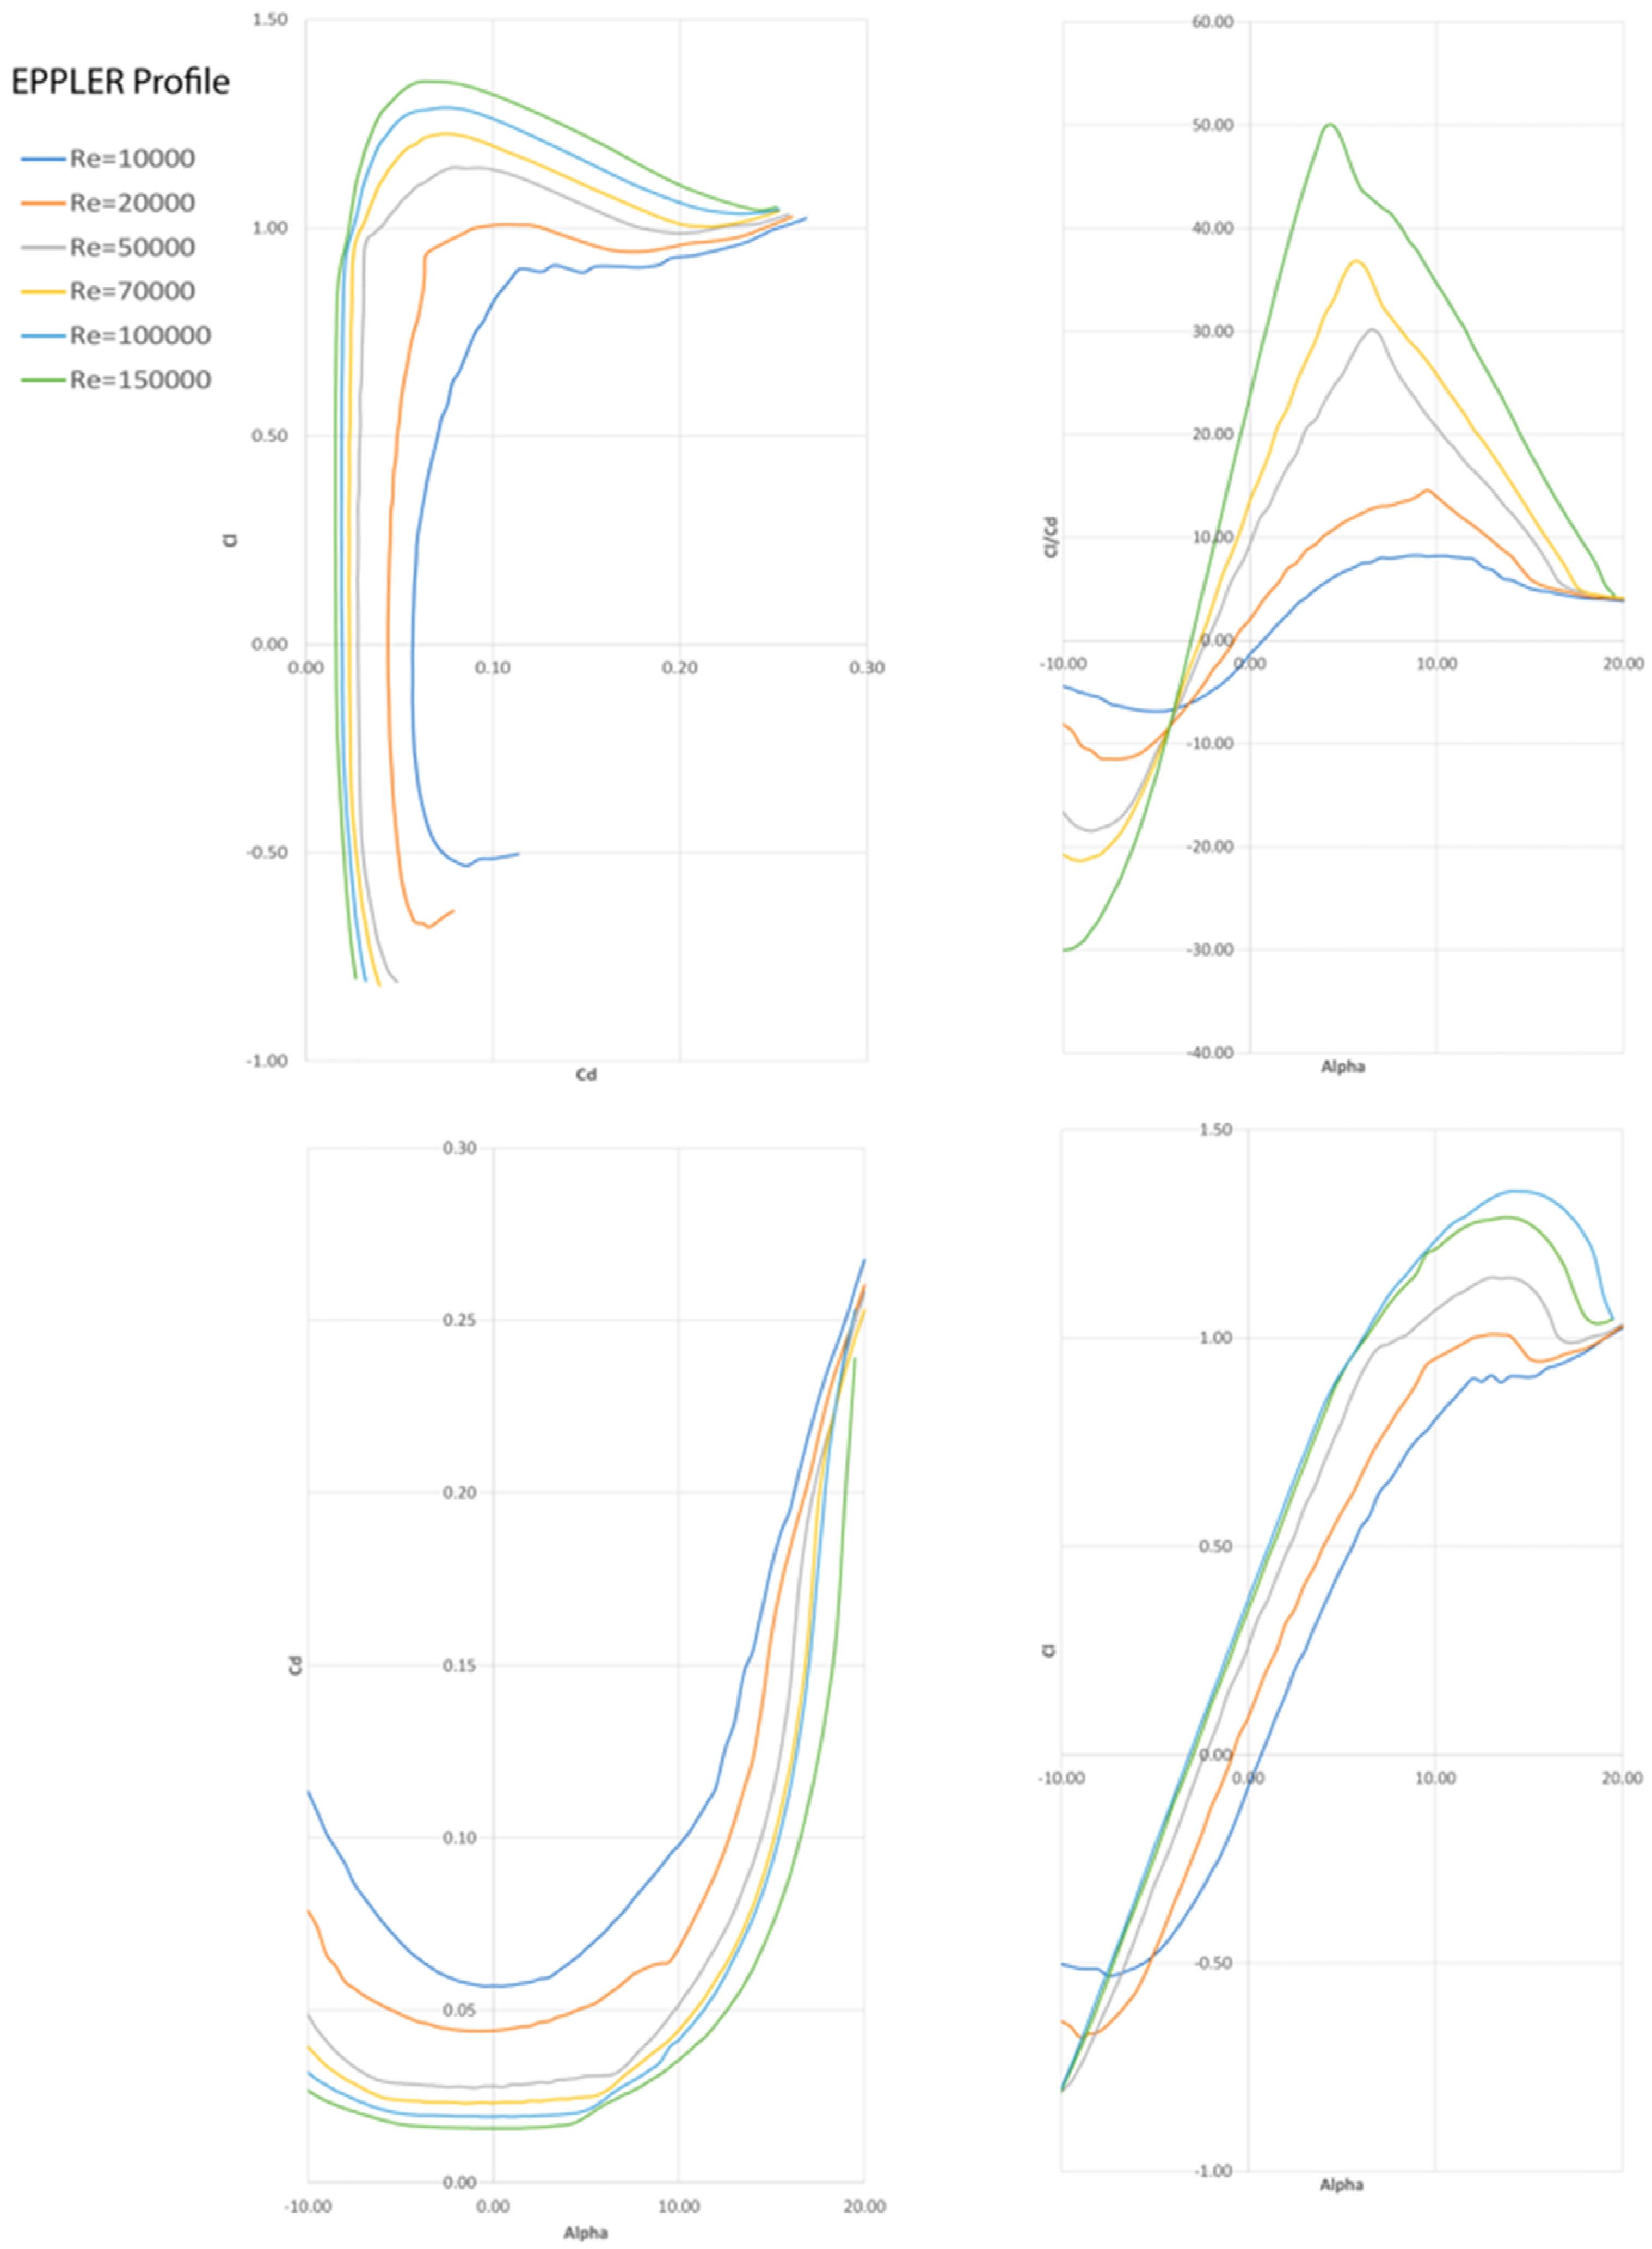
Lift and drag are the components of the force perpendicular and parallel to the direction of relative water speed, respectively. In order to quantify the entity of lift and drag force, it is useful to take into account two important coefficients: CL and CD, which can be defined as:
C L = L 1 / 2 ρ V 2 c
C D = D 1 / 2 ρ V 2 c
where ρ is the water density ≅ 1000 kg/m3 and c is the airfoil length, often denoted by the chord, which can be defined as the line that connects the leading edge with the trailing edge of the airfoil. The unit for the lift and the drag in Equations (1) and (2) is a force per length N/m. To offer a complete description of the forces, it is also necessary to define the moment M regarding a point in the airfoil. This point is conventionally located on the chord line at c/4 from the leading edge, and it is assumed that, in this specific point, the resultant of the aerodynamic forces are applied. The CL and CD are functions of α and Reynolds number. α is the angle of attack defined as the angle between the chord line and the velocity of the oncoming flow. The Reynolds number is proportional to the ratio between inertia and viscous forces. Itis responsible for the boundary layer transition from laminar to turbulent flow, provoking the airfoil stall condition, which completely depends on geometry [12,13,14]. In the case of an airfoil, the Reynolds number is usually defined as:
R e = c V ν  
where ν is the kinematic viscosity, which for water at 20 °C is approximately equal to ≅1.00 × 10−0.6 m2/s; c is the chord, and V is the relative velocity. For a given airfoil, the behaviors of CL and CD are computed and plotted in so-called polars: CL, α; CD, α, and CL/CD, α; the latter represents profile’s performance according to the variation of the angle of attack. Q-Blade is open-source software that allows us to understand the performance of wind/water turbines and the blade design. It is also useful for plotting the airfoil polar according to the Reynolds number variation that each blade section has. For the specific case presented, the Reynolds number varies in the range of 1.00 × 10⁻⁴ ÷ 1.00 × 10⁻⁵. As visible from Figure 1, the best angle that maximizes the efficiency of the overall profile is equal to 6°.
Another important concept is the available energy P m a x that is obtained if, theoretically, the water speed could be reduced to zero, as in Equation (4):
P m a x = 1 2 m ˙ V 0 2 = 1 2 ρ A V 0 3
where m ˙ is the mass flow, V0 is the water speed, ρ is the water density, and A is the area where the water speed was reduced. The equation for the maximum available power is very important since it shows that power increases with the cube of the water speed and only linearly with density and area. To evaluate the power production performance of the system, the non-dimensional power coefficient is defined as:
C p = P 1 2 ρ V 3 A
where P is the output mechanical power, V is the current velocity m/s upstream to the turbine, A is the reference surface (the turbine area), and ρ is the water density. The power coefficient is the ratio between the power produced by the rotor in Watts and the power produced from the fluid flow. The power coefficient is usually reported as a function of the Tip Speed Ratio (TSR), another non-dimensional quantity representing the speed at the blade tip normalized to the upstream flow velocity.
T S R = ω R V  
where R is the turbine radius and ω is the rotational speed. Each turbine generates a force perpendicular to the rotor plane, e.g., the thrust, which can be non-dimensionalized as:
C T = T 1 2 ρ V 3 A
where T is the trust acting on the rotor. Once the relation of mechanical power and the thrust coefficient with TSR is found, the turbine hydrodynamic performance is known.

1.2. Blade Design

The airfoil profile chosen for the present study was an EPPLER818, as shown in Figure 2.
The first necessary assumptions to define the blade design are the definition of a velocity range, the blade radius, and the number of blades. The velocity range must be compatible with the experimental limitation regarding acceptable velocity in the water channel in which the turbine was tested. Furthermore, for this study, the representative chord was assumed to be equal to R/4, corresponding to a fixed value of solidity of 0.10 at 75% of the blade span. Solidity is the ratio between the overall area of the blades and the swept area of the turbine (function of rotor radius) and the number of blades, chosen equal to N = 3, and it is often identified by the Greek letter σ:
σ = c N 2 π R
To design the blade, it is common practice to divide it into different sections along the blade span and, for each one, the size of the chord and twist angle are defined. The twist angle is between the zero-lift angle and the zero-lift angle of the root airfoil. The methodology applied for designing the present blade has the objective of optimizing the profile to have a quite linear distribution of the chord from the root to the tip of the blade, keeping in mind the hub size. The turbine’s hub is the component that connects the blades to the main shaft and ultimately to the rest of the drive train. The geometrical characteristics of the studied turbine are summarized in Table 1 below:
It is worth noting that fixing a range of possible TSR (Equation (6)), which in this specific case are considered to vary in the range from 2 to 8, and knowing both the velocity range and the turbine radius, it is easy to obtain the angular velocity ω rad/s. Furthermore, the relative velocity that each section has along the blade span is the vectorial composition of an axial velocity (strictly dependent on the inlet velocity) and the rotational velocity component, which depends on the angular velocity and the distance from the blade root (r/R), is at its maximum value at the blade tip. To impose that each section of the blade span have the same angle, an assumption that maximizes the efficiency of the profile, approximately being equal to 6°, it is possible to obtain the distribution of twist by the tangent of the angle of inflow ϕ. Moreover, the tangent of the angle of inflow is the ratio between the axial and rotational velocity components. Therefore, the twist angle is the difference between the inflow attack angle. Table 2 summarizes the twist and chord angle distribution, chosen for the blade design.

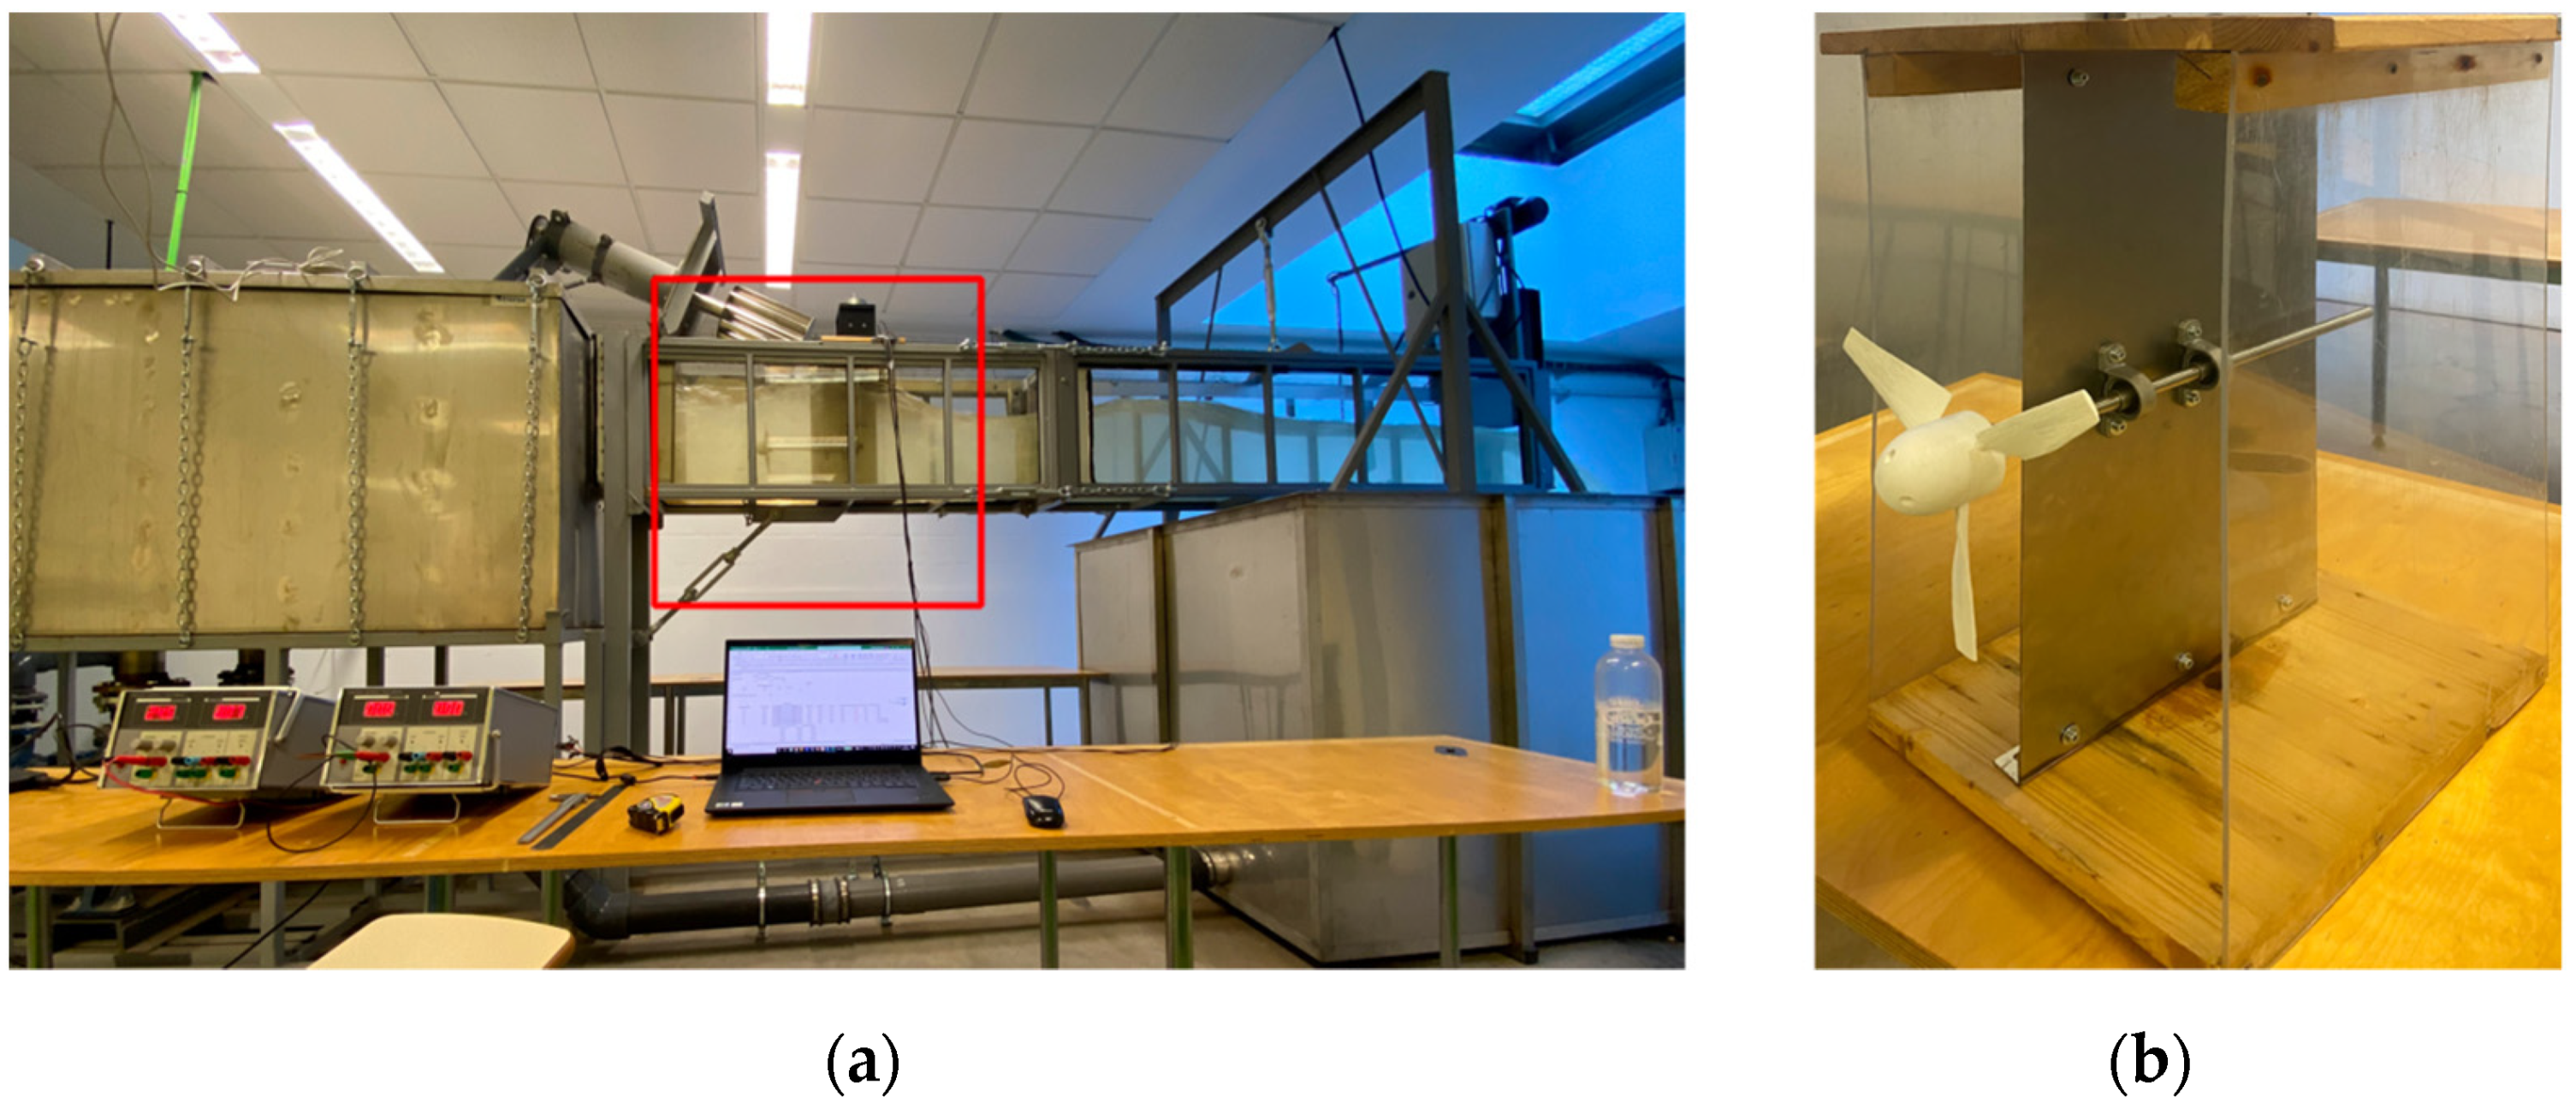
2. Rotor Design and Experimental Set-Up

The whole prototype was drawn in the SOLIDWORKS 2019 software with the purpose of realizing a flexible prototype able to be modified potentially, creating a special squared lock system for the blade into the hub. The adaptation draws inspiration from similar research [15] with a different scope, which is equally applicable to the present study. Figure 3a shows the geometric characteristic of the studied joint, which was graphically realized by a revolution solid that follows the airfoil. The total dimension of the rotor is the sum of the blade radius of 0.084 m, the hub radius 0.025 m, and the height of the joint of 0.009 m, making the turbine radius equal to 0.118 m. A sort of pillar with a squared ending acts as a joint between the extremities of the two plates. The designed turbine was printed with a 3D printer in polylactic acid, also known as PLA, and was composed of six pieces attached to each other by three M3 screws. Figure 3b is the CAD project showing each rotor part in detail.
The HAHWT was tested under low water velocity conditions in a recirculating water channel of 0.30 m in width, 0.5 m in height and 3.5 m in length with a transparent glass wall located at the Polytechnic Engineering School of Mieres (Oviedo University in Spain). As shown in Figure 4, water recirculation was provided by two centrifugal pumps (1) of 15 KW each, with a nominal flow rate of 300 m3/h, controlled by two inverters. The water flows through the channel and falls in the recirculating tank downstream (2), where a variable height gate (3) allows for performing different operating conditions, varying the velocity from 0.14 to 0.9 m/s at the maximum flow rate. The turbine was inserted into a wooden box (4) with transparent walls and a cutting steel foil in the middle, allowing the horizontal axis rotation. On the top of the box, there was a high precision torque and rotational speed meter (5) Magtrol TS103 (0.5 Nm of rated torque, accuracy < 0.1% and 1.5 rpm max. speed, accuracy < 0.015%) with an electrical brake (6) Magtrol HB-140M-2 controlled by DC (7). Moreover, a vertical axis connected to the horizontal one through a bevel gear allows transmitting the rotation to the torque meter and, due to the software provided by the manufacturer TORQUE V10, recording the mechanical parameters (torque, rotation speed, angle, mechanical power, and test time) necessary for the characterization of the curves along the power stage. Due to the fluctuation of the water surface, the height of water was measured upstream of the turbine at the x-coordinate of 0.54 m from the beginning of the channel and downstream of the turbine at the x-coordinate of 0.65 m.

2.1. Methodology

The experimental tests were organized considering three different values of flow rates, knowing the calibration law that links the frequency engine of the pump system and the corresponding flow rate. The three values of flow rates considered were Q1 = 0.052 m3/s (23 Hz), Q2 = 0.059 m3/s (27 Hz), and Q3 = 0.065 m3/s (31 Hz), respectively; for each one, 5 different downstream heights of the gate were tested, starting from the nearly closed to the nearly open condition. In this regard, 5 velocity points were analyzed, starting from the minimum to the maximum possible velocity (critical flow condition at which the channel outlet is achieved), to assess the turbine behavior in the same velocity points, increasing the flow rate value. Furthermore, due to the fluctuation of the free surface, the measurement of the water height upstream H1 and downstream H2 of the rotor allows calculating of the correspondent average velocity, v = Q/(b × h1), at the cross-section. Due to the presence of HAHWT, which harnesses the kinetic part of the energy contained in the water flow, the velocity upstream of the rotor slows down, producing an increase in pressure gradient at the turbine inlet, whereas, at the outlet, a rising in velocity and turbulence corresponds to a decreasing in pressure gradient. In that regard, the blockage ratio, namely the ratio between the turbine area (At) and the channel area (Ac) B = At/Ac, tends to increase the power produced due to the reduction in water height caused by the consequent raising in the height gate and inflow velocity. This blockage ratio produces an effect on the power extracted through the turbine, better explained in the Results section. The methodology was applied to obtain the curve along the power stage, starting from the so-called “zero loads” condition, where no braking torque is applied to the turbine, i.e., the voltage of the electric brake is equal to 0 V. Under this condition, the power extracted is zero, but the rotation velocity is equal to the maximum value (nmax). Successively, the turbine is gradually loaded, increasing the voltage by 0.5 V step up to the value of resistive torque able to arrest the turbine, immediately. This point coincides with the maximum power point (MPP) as in Equation (4), which corresponds to the minimum value of rotational velocity (nmin). Table 3 summarizes the experimental tests conducted in this paper.

2.2. Results and Conclusions

For each upstream velocity V1, the maximum rotational speed corresponds to the zero-load condition (0V in the brake). On the other hand, with the increase in the turbine load, the rotational speed decreases, which also produces an increase in the angle between the flow and the blades so that an increase in power and in the lift is produced up to a certain value, after which the airfoil reaches the stall condition and the drag forces increase more rapidly than the lift one. This phenomenon produces a decrease in power and rotational speed up to the complete turbine arresting. Therefore, the experimental points are located in the unstable part of the curve (on the left side), which is not visible in Figure 5 because they are beyond the recording experimental data point. The comparison between Test 1 and 3 shown in the P-n charts (a) and (b) of Figure 5 reveals how the power output variation increases with the upstream flow velocity and blockage ratio. However, it is evident how, in correspondence with the highest value of blockage ratio produced in the channel, 0.46 in Test 1 and 0.54 in Test 3, it determines a decrease in power extracted. Moreover, Figure 5 (c) and (d) show the start with the lowest flow rate Q1, which corresponds to an upstream velocity equal to 0.62 m/s and a Cp maximum equal to 0.52 for a TSR of 5.16; this coincides with the fully filled channel condition where the blockage ratio (At/AC) is minimal, B = 0.52. The peak of the power coefficient reaches its maximum value of 0.62 at a TSR of 5.91 with a corresponding velocity of 0.63 m/s and B = 0.47 in the Q2 flow rate condition. On the contrary, with the Q3 and an upstream velocity of 0.66 m/s, it produces a reduction in Cp, equal to 0.56 because, in this case, the channel gate is fully opened with a critical outlet flow condition. Therefore, the blockage ratio positively affects the turbine performance, because it compresses the flow and produces an increase in the power coefficient. Still, it could also determine a decrease in Cp due to the interference between water and air when the gate is nearly open. What happens is that the water level on the upstream side is nearly at the same elevation as the turbine, and, due to the surface drop on the downstream side, the backside of the rotor is exposed to the air. The drop in the power coefficient depends on two factors: the turbine is not completely covered with water, reducing the effective area, and the partial flow separation occurs as the air enters the suction side of the blade, as reported by [16]. A future objective of the present study is to validate the experimental results with a Computational Fluid Dynamics (CFD) model in order to investigate air–water interferences with the Volume of Fluid (VOF) model, which could better interpret the water–air interference and the flow around the HAWT [17,18].

Author Contributions

R.F.: Investigation, Methodology, Validation, Formal analysis, and Writing—original draft. A.G.-Y.: Methodology, Validation, and Formal analysis. A.F.-J.: Investigation and Methodology. E.Á.-Á.: Conceptualization, Writing—review and editing, Formal analysis, and Supervision. R.E.-V.: Methodology. G.D.G.: Formal analysis and Supervision. M.G.: Supervision. All authors have read and agreed to the published version of the manuscript.

Funding

This research received no external funding.

Institutional Review Board Statement

Not applicable.

Informed Consent Statement

Not applicable.

Data Availability Statement

Not applicable.

Conflicts of Interest

The authors declare no conflict of interest.

References

  1. IEA. Renewables 2019—Analysis-IEA; International Energy Agency: Paris, France, 2019. [Google Scholar]
  2. IEA. Electricity Market Report-July 2021; International Energy Agency: Paris, France, 2021. [Google Scholar]
  3. Elbatran, A.H.; Yaakob, O.B.; Ahmed, Y.M.; Shabara, H.M. Operation, performance and economic analysis of low head micro-hydropower turbines for rural and remote areas: A review. Renew. Sustain. Energy Rev. 2015, 43, 40–50. [Google Scholar] [CrossRef]
  4. dos Santos, I.F.S.; Camacho, R.G.R.; Tiago Filho, G.L.; Botan, A.C.B.; Vinent, B.A. Energy potential and economic analysis of hydrokinetic turbines implementation in rivers: An approach using numerical predictions (CFD) and experimental data. Renew. Energy 2019, 143, 648–662. [Google Scholar] [CrossRef]
  5. Lago, L.I.; Ponta, F.L.; Chen, L. Advances and trends in hydrokinetic turbine systems. Energy Sustain. Dev. 2010, 14, 287–296. [Google Scholar] [CrossRef]
  6. Loots, I.; Van Dijk, M.; Barta, B.; Van Vuuren, S.J.; Bhagwan, J.N. A review of low head hydropower technologies and applications in a South African context. Renew. Sustain. Energy Rev. 2015, 50, 1254–1268. [Google Scholar] [CrossRef] [Green Version]
  7. Tian, W.; Mao, Z.; Ding, H. Design, test and numerical simulation of a low-speed horizontal axis hydrokinetic turbine. Int. J. Nav. Archit. Ocean Eng. 2018, 10, 782–793. [Google Scholar] [CrossRef]
  8. Gasnier, P.; Saoutieff, E.; Soriano, O.; Alessandri, B.; Ojer-Aranguren, J.; Boisseau, S. Cm-scale axial flow water turbines for autonomous flowmeters: An experimental study. Smart Mater. Struct. 2018, 27, 115035. [Google Scholar] [CrossRef] [Green Version]
  9. Khan, M.J.; Bhuyan, G.; Iqbal, M.T.; Quaicoe, J.E. Hydrokinetic energy conversion systems and assessment of horizontal and vertical axis turbines for river and tidal applications: A technology status review. Appl. Energy 2009, 86, 1823–1835. [Google Scholar] [CrossRef]
  10. Cardona-Mancilla, C.; Del Río, J.S.; Chica-Arrieta, E.; Hincapié-Zuluaga, D. Horizontal axis hydrokinetic turbines: A literature review. Tecnol. Ciencias Agua 2018, 9, 180–197. [Google Scholar] [CrossRef]
  11. Castelli, M.R.; Benini, E. Comparison between Lift and Drag-Driven VAWT Concepts on Low-Wind Site AEO. Int. J. Environ. Ecol. Eng. 2011, 5, 1677–1682. [Google Scholar] [CrossRef]
  12. Barbarić, M.; Guzović, Z. Investigation of the possibilities to improve hydrodynamic performances of micro-hydrokinetic turbines. Energies 2020, 13, 4560. [Google Scholar] [CrossRef]
  13. Kolekar, N.; Banerjee, A. Performance characterization and placement of a marine hydrokinetic turbine in a tidal channel under boundary proximity and blockage effects. Appl. Energy 2015, 148, 121–133. [Google Scholar] [CrossRef]
  14. Grasso, F.; Coiro, D.; Bizzarrini, N.; Calise, G. Design of advanced airfoil for stall-regulated wind turbines. Wind Energy Sci. 2017, 2, 403–413. [Google Scholar] [CrossRef] [Green Version]
  15. Bahaj, A.S.; Molland, A.F.; Chaplin, J.R.; Batten, W.M.J. Power and thrust measurements of marine current turbines under various hydrodynamic flow conditions in a cavitation tunnel and a towing tank. Renew. Energy 2007, 32, 407–426. [Google Scholar] [CrossRef]
  16. Birjandi, A.H.; Bibeau, E.L.; Chatoorgoon, V.; Kumar, A. Power measurement of hydrokinetic turbines with free-surface and blockage effect. Ocean Eng. 2013, 69, 9–17. [Google Scholar] [CrossRef]
  17. Benavides-Morán, A.; Rodríguez-Jaime, L.; Laín, S. Numerical Investigation of the Performance, Hydrodynamics, and Free-Surface Effects in Unsteady Flow of a Horizontal Axis Hydrokinetic Turbine. Processes 2022, 10, 69. [Google Scholar] [CrossRef]
  18. Gharib Yosry, A.; Fernández-Jiménez, A.; Álvarez-Álvarez, E.; Blanco Marigorta, E. Design and characterization of a vertical-axis micro tidal turbine for low velocity scenarios. Energy Convers. Manag. 2021, 237, 114144. [Google Scholar] [CrossRef]
Figure 1. Polar of the EPPLER profile extracted from Q-Blade.
Environsciproc 21 00062 g001
Figure 2. Chosen airfoil profile.
Environsciproc 21 00062 g002
Figure 3. The designed squared lock system (a). The turbine axonometric projection (b).
Environsciproc 21 00062 g003
Figure 4. Experimental set-up (a). Wooden box where the Turbine is located (b).
Environsciproc 21 00062 g004
Figure 5. P-n Q1 (a). P-n Q3 (b). P-n comparison (c). Cp-TSR comparison (d).
Environsciproc 21 00062 g005
Table 1. Turbine geometry characteristics.
Velocity
Range
(m/s)
Blade
Radius
(m)
Chord
R/4
(m)
Hub
Radius
(m)
Number of Blades
(−)
0.43 ÷ 0.680.0840.030.0253
Table 2. Blade discretization with chord and twist angle assumed.
Number of SectionLocal Solidity σ = cN/2πRr/RChord (m)Twist (°)
10.14000.00000.0300045.7500
20.12000.00800.0290041.2500
30.12000.01680.0280036.2175
40.11000.02520.0270030.2750
50.11000.03360.0260023.9550
60.11000.04200.0250018.5950
70.10000.05040.0237514.7925
80.10000.05880.0220011.9775
90.09000.06700.021009.0000
100.08000.07550.019508.5000
110.08000.08400.018008.0000
Table 3. Experimental tests.
Test 1 Q1 = 0.052 m3/s
H gate (m) 0.120.130.14 0.150.16
H1 upstream (x 0.54 m)0.400.380.370.280.27
V1 upstream (m/s)0.430.450.470.620.64
B = At/Ac0.360.380.390.520.54
Test 2 Q2 = 0.059 m3/s
H gate (m) 0.150.160.170.180.19
H1 upstream (x 0.54 m)0.450.420.390.310.30
V1 upstream (m/s)0.430.470.500.630.65
B = At/Ac0.360.350.370.470.49
Test 3 Q3 = 0.065 m3/s
H gate (m) 0.160.170.180.190.20
H1 upstream (x 0.54 m)0.500.440.430.330.32
V1 upstream (m/s)0.440.500.510.660.68
B = At/Ac0.290.330.340.440.46
Publisher’s Note: MDPI stays neutral with regard to jurisdictional claims in published maps and institutional affiliations.

