1. Introduction
Wastewater generated by any population requires adequate treatment for its reincorporation into the natural environment. This requires a complex sewerage infrastructure to transport this water to treatment points. The current situation of sanitation networks in Spain is far from the objectives set by the European guidelines reformulated for the national territory in the Royal Decree 1290/2012 on the Regulation of the Public Hydraulic Domain. This legislation and its successive modifications include the need to incorporate in sanitation systems intelligent monitoring systems [
1]. Therefore, it is necessary to address this problem at both a theoretical and practical level, in search of solutions applicable on a large scale, to systematize the implementation of technologies to be developed.
Currently in Spain, most of the wastewater networks are unitary systems (the network collects wastewater and rainwater). In periods of heavy rainfall, the flows collected by the network may exceed the maximum inflow to wastewater treatment plants (WWTP). The excess water flow is discharged into watercourses before reaching the WWTP to avoid alterations in the treatment processes of the station.
Correct compliance with the current regulations on sewage networks requires knowledge of the characteristics of discharge events resulting from heavy rainfalls. Such events are characterized by the volume and quality of the water discharged, as well as the time of the beginning and end of the event. It is therefore necessary to monitor in real time the overflow episodes in the spillways of unitary sanitation networks. This information is key for the establishment of the necessary measures to prevent these waters, which can have high pollutant loads, from damaging the ecosystem of the receiving watercourse, especially in sensitive areas, such as protected environments or coasts [
2,
3].
The advance of low-cost electronics and the need to increase the degree of digitalization of hydraulic infrastructures are favoring the development of concepts that a few years ago were technically unviable. These include the rapid development of smart cities [
4,
5], the Internet of Things (IoT) [
6], and real-time monitoring [
7]. All of this is supported by a significant advance in telecommunication systems. Currently, there are communication networks suitable for any type of need: GPRS/GSM, LPWAN, satellite, short-range networks, and so on.
The current technological development allows the availability of sensors, software, platforms, and tools that facilitate the monitoring and management of sewage networks. As examples of spillway monitoring systems, Ref. [
8] shows a temperature sensor used to detect spill events. The above results were improved in [
9] by adding a second temperature sensor. In [
10], a radar-type sensor was used to determine the discharged flow obtaining acceptable results. There are also techniques that determine discharge from the analysis of rainfall records [
11,
12].
From the techno-economic point of view, there are several conditioning factors that make difficult the implementation of these monitoring systems in sewage networks. This is because these infrastructures are subterranean and very dispersed, which makes access to them difficult. Other limitations are the lack of both standardization in the construction of discharge structures and communication coverage. In addition, the nature of wastewater, due to its corrosive characteristics, the emission of gases, and the dragging of solids, requires the use of special equipment.
The main objective of this work is to develop an IoT monitoring device to detect and quantify discharges from the sewage network to watercourses. Its design, based on open-source technology, aims to optimize efficiency, robustness, and economic cost, as well as energy autonomy and versatility to adapt to different communication systems. These characteristics are ideal for its installation in sewage systems. Due to the collaboration agreement between the University of Cordoba and the Provincial Water Company of Cordoba (EMPROACSA), the proposed technology has been implemented in several spillways to evaluate its operation in sewage networks under real conditions.
2. IoT Architecture
The IoT architecture that best suits the characteristics of a sanitation network is the architecture of a low-power wide-area network (LPWAN). These networks are characterized by using little energy to transmit data. On the other hand, they do not allow large amounts of information to be sent. This makes them well suited for spillway monitoring, as the communication nodes have a high energy autonomy with batteries due to low power consumption during sending periods. The low information transmission rate is sufficient to monitor sporadic discharge events.
LPWANs are composed of a set of nodes that collect data generated by sensors and transmit information to base stations, and finally, it is stored in a database in the cloud (
Figure 1). Data can be analyzed in real time or delayed by algorithms to identify discharge periods and quantify the amount of water discharged. This information will be displayed to the end user in an easy and intuitive way.
2.1. Data Collection Level
This is the basic level of the system. This level contains the sensors that transform the measured variables during discharge episodes into electrical signals. Occurrence, duration, and water level will be measured.
Data collection requires two sensors, a capacitive probe and an ultrasonic level sensor. On the one hand, the ultrasonic sensor measures the water level in the channel, the variable required to calculate the discharge flow, and the volume of discharged water during the spillage episode. On the other hand, the capacitive probe, sensitive to the water flow, is placed on the discharge lip. This measurement is used for recording the occurrence and duration of discharges. These sensors have been chosen for spill monitoring mainly because their use is quite widespread, and their prices are reasonable.
The capacitive probe identifies the beginning and end of overflow episodes. In the market, there are probes with shapes and functions adapted to the adverse conditions of these spillways. The capacitive probe used is the model f100N from the brand Microcom (Guipuzcua, Spain). This sensor is suitable to the nature of the wastewater. It is characterized by a self-calibration procedure of the discharge detection threshold, thus eliminating false-positive warnings. This self-calibration is essential to avoid the effects of sedimentation of suspended solids and the degradation of the system over time.
The probe’s operation is based on the marked difference between the dielectric constants of water and air. The sensing element consists of two electrodes forming a capacitor that oscillates with a constant excitation current. Thus, the oscillation frequency is directly proportional to the dielectric constant of the medium. A microcontroller manages probe operation by comparing the current measurement with the set detection threshold and activating the output accordingly. The repeatability and stability of the detection threshold are guaranteed, thanks to the standard capacitor integrated in the probe that serves as a reference, making it practically insensitive to temperature changes.
The ultrasonic level sensor used is the model MB7589 from the brand MaxBotix (Brainerd, MN, USA), which has a range between 0.3 and 5 m and a resolution of 1 mm. This sensor is designed for measurement in confined spaces, as it includes a self-cleaning system designed to reduce the impact of condensation in damp environments. The purpose of this sensor is to measure the water level before the spill lip above the bottom of the channel on which the spillway is built. The difference between the water level and the height of the spillway is the variable needed to estimate the discharge flow rate using the spillway discharge equation.
2.2. Communication Level
The most used LPWAN communication networks are Sigfox, LoRaWAN, and NB-IoT. The Sigfox network is the most widespread of the three. It operates in the Sub-GHz ISM band and has a narrowband technology, and the company that markets its services is responsible for deploying the infrastructure. This network connects the devices with a base station and different base stations with the Sigfox server, which makes the data available to the client for transmission to any database. The LoRaWAN network, unlike the Sigfox network, has a spread spectrum technology, and the network needs to be developed for further use. The LoRaWAN network is the open-source proposal of the LoRa alliance that can be used freely. Finally, the NB-Iot (Narrow Band Internet of Things) network uses frequency bands of mobile operators. Like the Sigfox network, users do not need to deploy their own infrastructure. The main disadvantage for its use is its limited territorial deployment, so it would be very likely to have problems of poor or no coverage in rural areas.
The Sigfox communication network has be chosen for its suitability for infrastructures that are dispersed throughout the territory, as in the case of weirs of sewage networks of the municipalities of a region. As it is not necessary to deploy users’ communication infrastructure, the initial investment is lower, facilitating access to this type of technology. On the other hand, this network has limitations in terms of the number of messages (140 per day) and the amount of information to be transmitted (maximum of 12 bytes per message). In addition, this network allows a greater number of devices to be added in an easy and scalable way, since all the information collected by them is managed from a backend.
A microcontroller is needed to control and manage the sensors remotely. In recent years, the use of free resources (open source) in sensorization projects is advancing, mainly motivated by two reasons: low cost of components and ease of use of these technologies. Therefore, the board chosen for the data acquisition device is a MKRFOX1200 board from the brand Arduino (Monza, Italy), which incorporates a 32-bit Atmel SAMD21 microcontroller. This board can communicate with Sigfox (data transmission network), being a model specially developed for this purpose. It also incorporates a Sigfox ATA8520 radio frequency module, also from Atmel. In addition, the use of open-source technology does not imply premature obsolescence since its versatility allows improvements to be incorporated into the prototype by updating libraries or improving the initial code.
The electronics of the device include a data storage module. For this purpose, a nonvolatile memory has been provided to keep the data safe even without power supply. The SD module will allow the storage of data every 3 min. These data will be sent every 12 min. Thus, data acquisition cycles will be performed every 3 min, and data sending cycles every 12 min (
Figure 2).
Besides the microcontroller, the data acquisition node will be equipped with lithium-ion batteries (18,650), which give it a long service life without connection to the conventional power grid. The device is also equipped with a battery management system for connecting a small photovoltaic panel. This would extend the device’s autonomy indefinitely. The antenna of the communication node is located on the outside of the enclosure to improve the quality of the transmission signal. The sensor cables enter the data communication node through cable glands to keep the enclosure waterproof and isolate it from external factors.
2.3. Cloud Database and Analysis Level
The information sent by the communication node will be minimal due to the low information transmission rate allowed by the Sigfox communication system. The variables to be measured are battery level, spillage occurrence (capacitive probe), and water level (ultrasonic sensor). Thus, the maximum 12 bytes will be completed for each data transmission.
The data collected by the microprocessor from the sensor readings are sent through Sigfox to an IoT storage and analysis platform that prepares them for visualization and consultation. The platform chosen to perform this function is ThingSpeak. The free version of this platform allows for connecting up to four devices with a maximum of 8200 messages per day. In addition, it offers several tools to facilitate data analysis and visualization:
- -
Matlab Analysis: it allows for analyzing the information received using Matlab tools.
- -
TimeControl: it is a plugin used to schedule periodic actions.
- -
React: it continuously analyzes incoming data to perform actions conditioned to events or predefined parameters.
- -
ThingHTTP: it uses the HTTP communication protocol to transmit messages to other devices or web services.
This platform allows the implementation of algorithms for analyzing data received in real time. Thus, the information generated by the sensors is interpreted, and the variables that characterize the spillway operation will be calculated in real time: spillage occurrence, duration, and discharge flow using weir discharge equations. The variability in the typology of existing spillways makes it difficult to develop a single flow measurement device for all of them. Likewise, it will not be possible to apply a unique equation for all spillways. It will be necessary to adapt the general equation for the calculation of discharge for rectangular spillways (Equation (1)) according to the existence of lateral contractions, spill lip arrangement, spill lip thickness, and so on:
where
Q is the discharge flow,
b is the width of the spillway,
Cd is the discharge coefficient,
g is the gravity, and
h is the height of the sheet of water in relation to the height of the spillway.
2.4. Visualization Level
Using a cloud database, all information can be accessed from any device with an Internet connection. This allows users (field workers and office staff) to view the data from either a smartphone or a computer. In addition, the ThingSpeak platform has a powerful API to access the data from an external platform, which is very useful when management companies have their own platform for the telemetry of their infrastructures.
3. Case Study
Due to the collaboration agreement between the University of Cordoba and the Provincial Water Company of Cordoba (EMPROACSA), it has been possible to test the devices in a real sewage network. The sewage networks managed by EMPROACSA are located in the south of Spain. This company is responsible for the management of the sewerage network of a total of XX municipalities distributed throughout the province of Cordoba, occupying an area of approximately 13,000 km2.
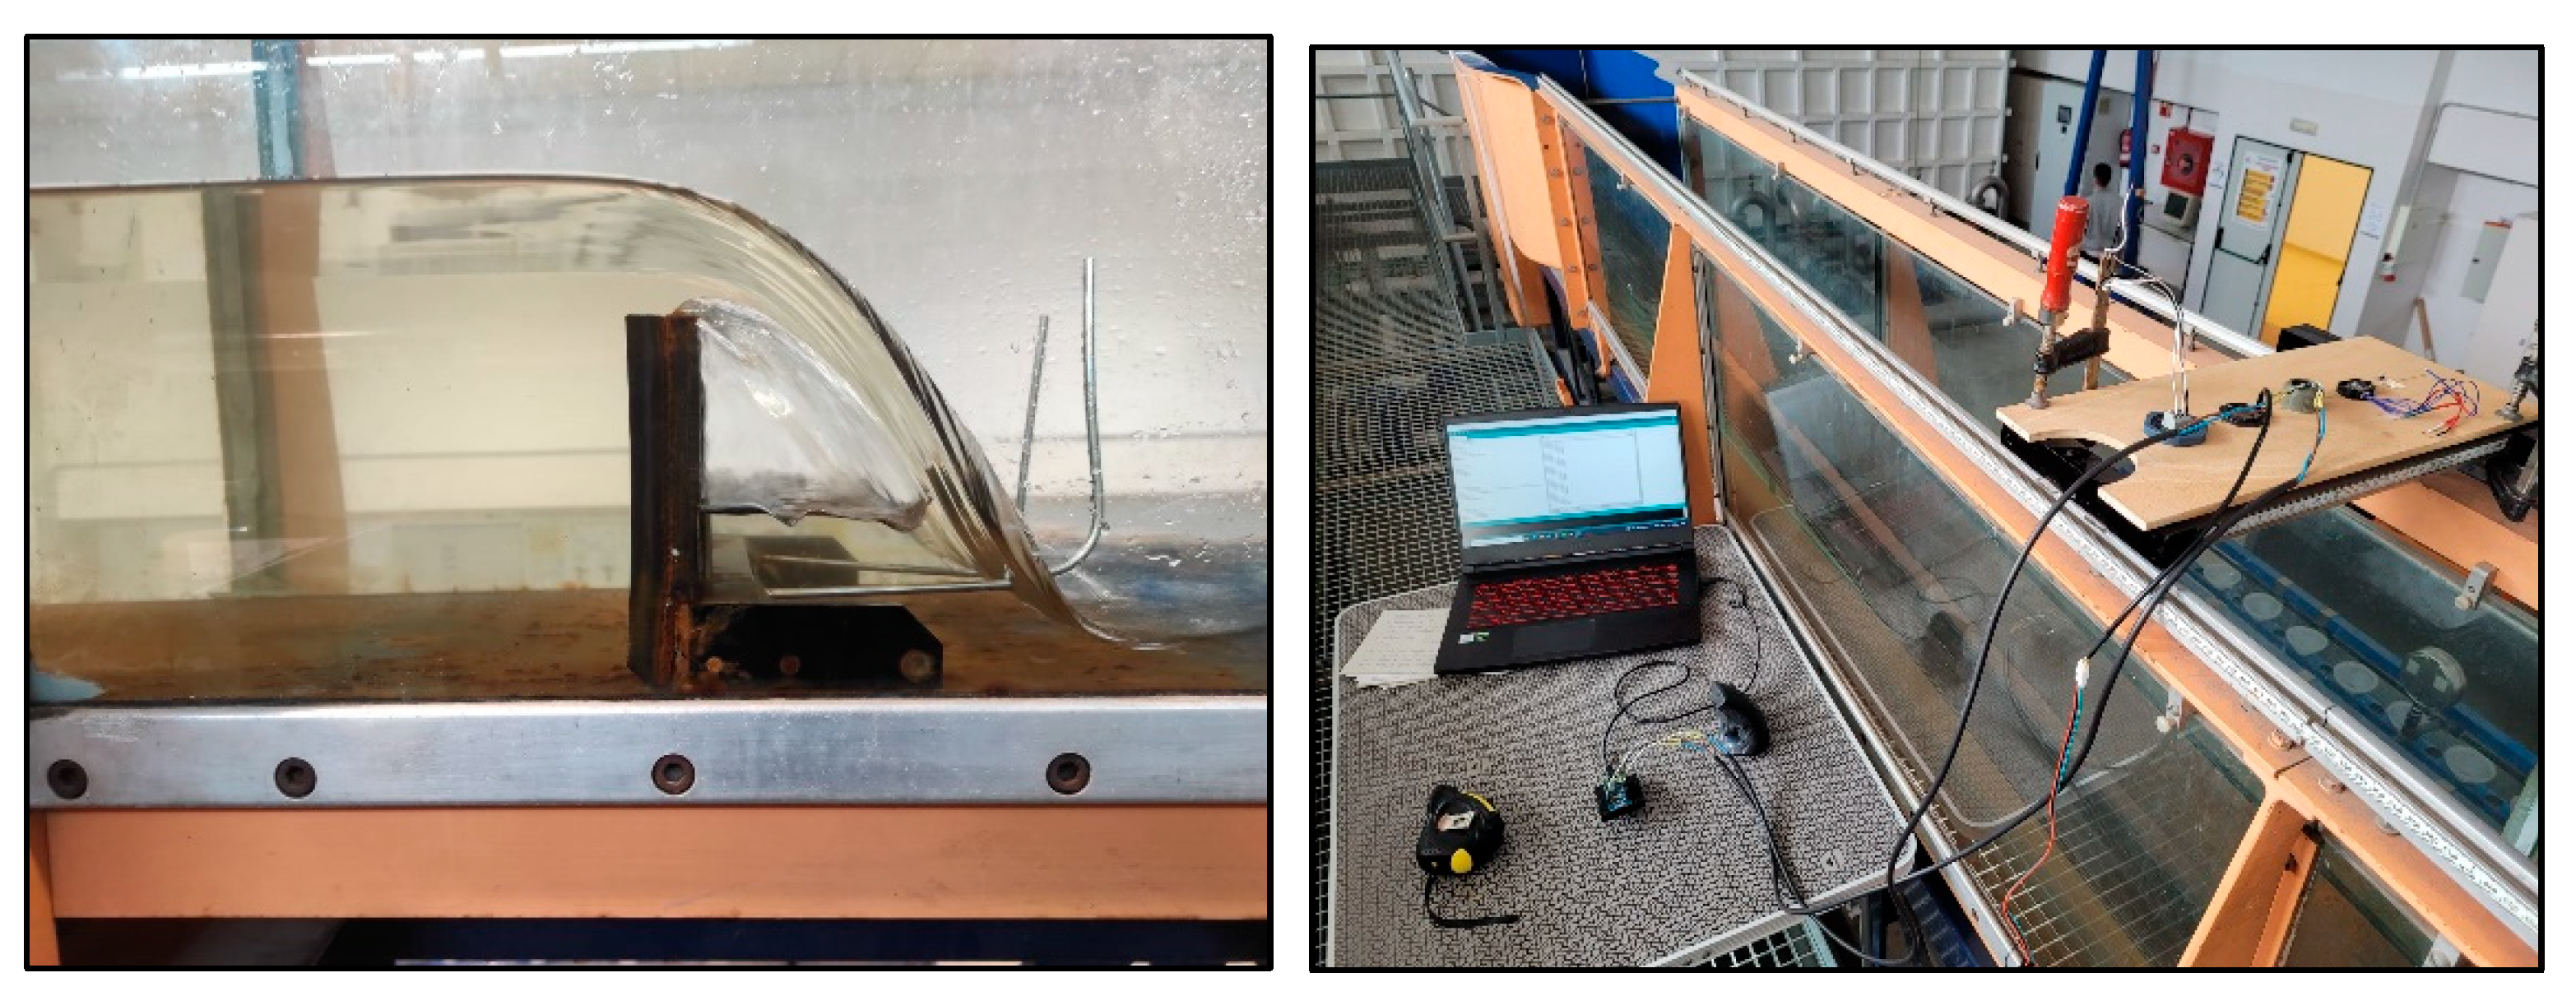
The developed device has been tested at the university’s hydraulic lab to check its robustness and reliability (
Figure 3). The behavior of a spillway has been simulated by a thin-walled rectangular weir in a rectangular cross-section channel (0.3 m × 50 m) using Equation (1). The device’s measurement error was 0.476% with respect to the flow rate measured with a high-performance electromagnetic flowmeter (Siemens MAG5100).
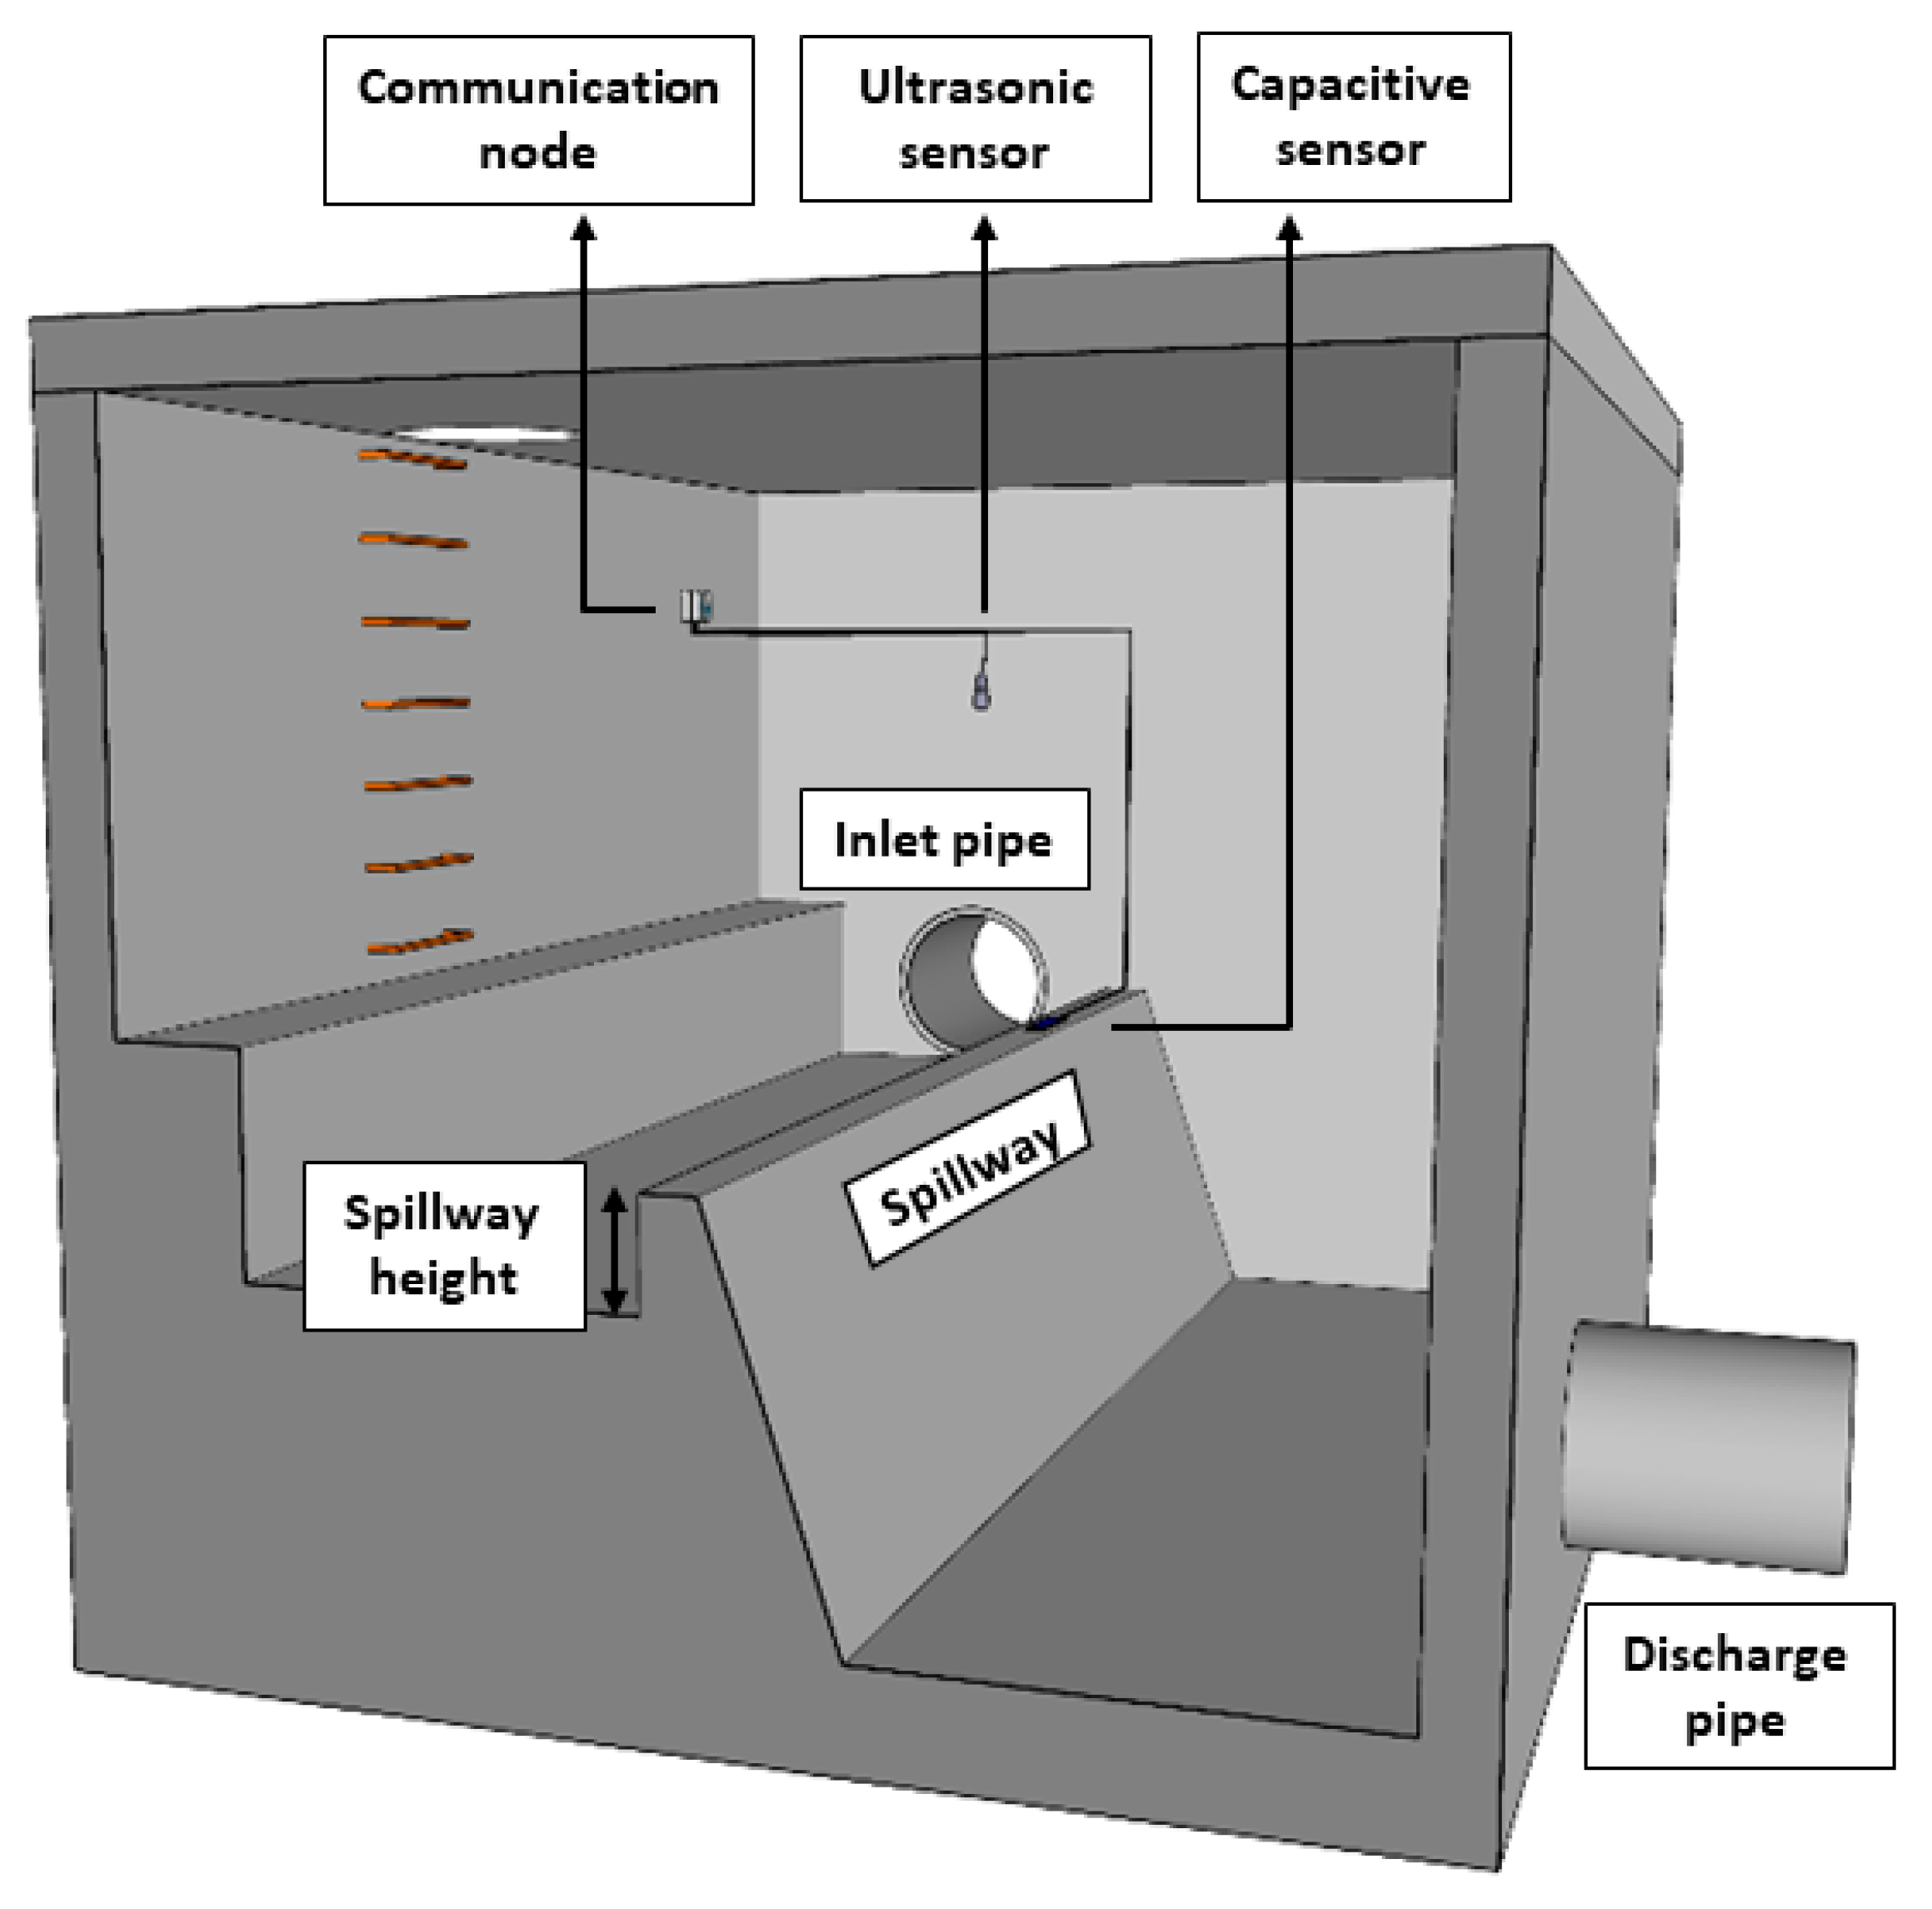
The installation of the proposed device will be adapted to each situation.
Figure 4 shows a typical spillway as an example. Regarding the technology used, three elements can be distinguished: the communication node, the ultrasonic sensor, and the capacitive probe. The capacitive probe is located on the spill lip. It detects when water flows over it, indicating the beginning and end of each discharge period. The ultrasonic sensor is located at the top of the manhole to measure the water level over the channel bottom. Finally, the communication node collects the signal from the two sensors by wires and sends the information to the cloud. It is installed in the upper part of the manhole to avoid the risk of being dragged away in case of flooding. The antenna needed to transmit the information can be connected to the communication node, or it can be located outside the manhole to obtain better coverage.
4. Discussion
The costs of the proposed monitoring system are reduced. The three elements that represent the total cost of the system are the ultrasound sensor (EUR 151), the capacitive probe (EUR 114), and the communication node (EUR 125). The price of the cloud database and the visualization platform has not been taken into account as it allows the use of four devices free of charge (estimated price of EUR 10 per year and device). The cost related to Sigfox communication has also not been considered because the first year of use is free of charge (estimated price if EUR 18 per year and device).
This monitoring system is ideal for the optimal management of sewage networks for water companies whose infrastructures are widely dispersed throughout the territory, as is the case of EMPROACSA. This system reduces operational cost, avoiding unnecessary staff travels and increasing as well as having a more efficient use of the available personnel.
The operation of the proposed system could be improved by including rain gauges in the catchment of the monitored spillways to relate rainfall and discharge events, where rainfall intensity and duration are key factors. Thus, the threshold of rainfall causing discharges could be estimated.
Spillways are complex structures of diverse geometry and difficult to monitor. The discharge flow is estimated indirectly from the water level over the spill lip. In these circumstances, we intend to improve the system by developing accurate models of each spillway to reproduce their behavior under different scenarios. Computational fluid dynamics (CFD) techniques could be suitable to create a 3D model to simulate the behavior of these structures and to estimate the flow versus the discharge equation.
Finally, the proposed research is aligned with the Sustainable Development Goals (SDGs) proposed by the UN in 2015 in the 2030 Agenda. This work is framed within Goal 6: Ensure availability and sustainable management of water and sanitation for all.
5. Conclusions
The proposed architecture for an IoT device to monitor sewage network spillways, as well as the communication, processing, and information visualization system, demonstrated its applicability as a warning system for the occurrence and quantification of discharges from sanitation networks into natural watercourses. In addition, the combination of the low-cost and open-source technologies implemented minimizes the initial investment and monitoring maintenance costs. It is important to highlight that the user has full control of all the elements of the monitoring system (information collection, data sending, storage, and visualization). This implies no dependence on any commercial company. Thus, any element can be replaced by another of similar characteristics, also allowing the incorporation of technological improvements or the integration of the developed device into the existing telemetry system of the water service.


 ,
, 


