1. Introduction
Nowadays, the containment of energy use represents an issue of paramount importance in the management of water systems [
1,
2,
3]. In recent years, many strategies have been proposed in the literature in order to increase the energy efficiency [
4,
5] of water supply systems, such as: pressure management by means of pressure reducing valves (PRVs) [
6], design of small power plants for energy recovery [
7,
8], and replacement of old pumps with newly designed more efficient pumps [
9,
10]. In the last few years, the hydropower plants [
11] equipped with energy production devices (EPDs) [
11,
12] have been replacing the PRVs [
13] in order to guarantee pressure control, thus leakage reduction [
14,
15], and energy recovery simultaneously [
16,
17].
Among the existing EPDs, pumps as turbines (PATs) [
18] are generally preferred for their lower cost. In the literature, a procedure for PAT selection—called Variable Operating Strategy (VOS) [
19,
20] was proposed to equip the hydropower plants with PATs, ensuring quite high energy efficiency values, given a flow-head distribution pattern and a minimum backpressure to guarantee. However, the efficiency of the PATs can reach a maximum of 0.6–0.7 [
21], which is lower than the maximum values attained by traditional turbines.
In order to ensure a given head drop within the installed PATs under variable conditions, PATs are installed within systems equipped with hydraulic (HR) or electrical (ER) regulation [
22,
23], which requires quite high installation costs for piping, valves, and, in the case of ER, also for variable speed drive.
In hydropower plants, a significant cost is represented by civil works, which can be significantly high and, thus, compromise the feasibility of the plant itself [
24,
25,
26]. In fact, in the most peripherical parts of hydraulic networks, where the flow rates and the pressure are small, the energy recovery could not reward such high costs, and the time to pay back the investment could be dramatically long [
27]. With regard to the PRVs installed in hydropower plants, these are generally installed in small manholes located under the street pavement, where high costs are required to host the device and properly protect the electric components from the rain and external agents. A reduction in the costs could result from a simplification of the plant, either renouncing the regulation or realizing HR systems with multiple PATs and more common ON/OFF valves [
28].
In this study, a new power plant is proposed with the aim of containing the high costs of the traditional small hydropower plants. It is called the Energy Booster (EB) and is characterized by an innovative design based on two submersible PATs located in a booster, which can be placed under existing manholes. A prototype of the plant has been realized and preliminary experimental tests have been carried out with the aim of testing the behavior of the selected pumps operating in inverse mode within the newly proposed plant.
2. Energy Booster Design and Experimental Setup
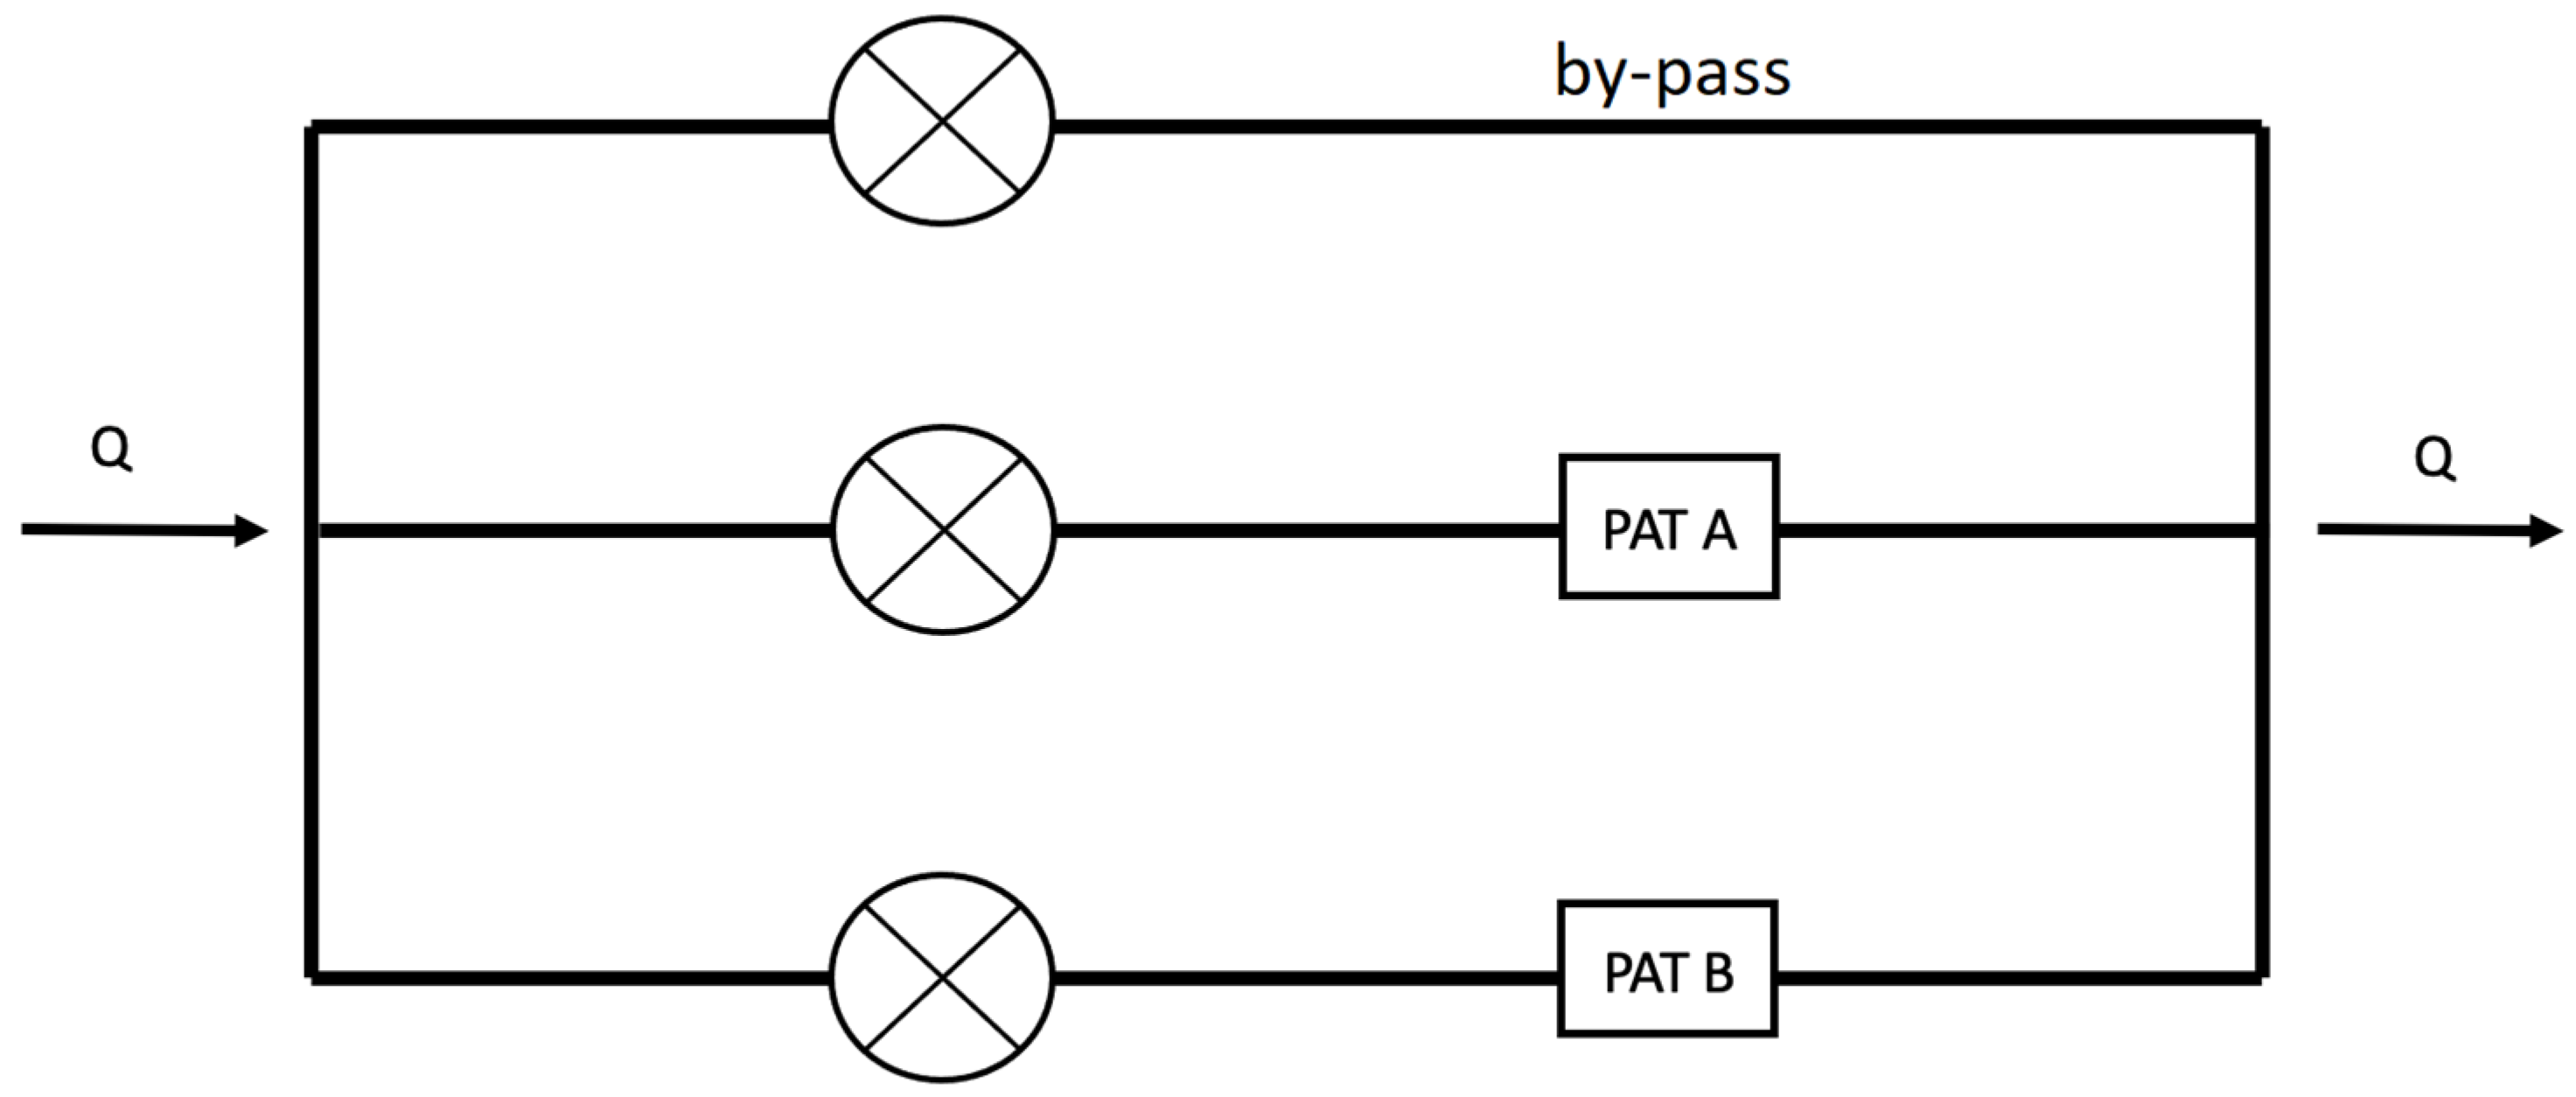
The Energy Booster layout is presented in
Figure 1.
According to
Figure 1, the EB consists of three pipe branches in parallel. Within two branches, two submersible pumps operating as turbines are installed, and these are disconnected by means of ON/OFF valves, whereas the third branch operates as a by-pass. All three valves are electrically actuated. The velocity of the maneuvers of the three valves is kept low in order to avoid undesirable unsteady flow conditions, such as a high pressure surge due to water hammer. According to
Figure 1, three operating conditions are possible: (i) one PAT operation by closing the remaining two branches; (ii) two PATs operating in parallel by closing the by-pass; and (iii) operation with a portion of the total flow rate by only opening the by-pass branch.
The hydraulic configuration presented in
Figure 1 allows us to overcome several issues. The presence of two submersible multistage pumps, centered on two different flow rates, allows us to deal with the too wide operation range as well as to operate with high flow rates and high head drop values. Moreover, the booster configuration ensures the reduction of the acoustic noise of the pumps.
The booster has been realized in a hydraulic closed circuit in the Hydro Energy Lab (HELab) of the University of Naples “Federico II” (
Figure 2). A scheme of the experimental setup is shown in
Figure 3.
There exist seven possible operating conditions, as follows enumerated:
- (I)
PAT A OFF, PAT B OFF, by-pass ON;
- (II)
PAT A ON, PAT B OFF, by-pass OFF;
- (III)
PAT A ON, PAT B OFF, bypass ON;
- (IV)
PAT A OFF, PAT B ON, by-pass OFF;
- (V)
PAT A OFF, PAT B ON, by-pass ON;
- (VI)
PAT A ON, PAT B ON, by-pass OFF;
- (VII)
PAT A ON, PAT B ON, by-pass ON.
The selected models of PATs are Caprari E4XED30/5 + MC405-8 and Caprari E4XED50/6 + MCK44-8 (for PAT A and PAT B, respectively, in
Figure 3). These PATs exhibit very low efficiency, with values at the best efficiency point (BEP) equal to 0.31 and 0.32 for PAT A and PAT B, respectively. However, it is worth specifying that, in this study, two 4″ centrifugal multistage submersible pumps used for groundwater extraction have been selected, but for larger size plants, semiaxial multistage submersible pumps [
29,
30] are recommended for their higher efficiency.
As shown in
Figure 3, the laboratory is equipped with a centrifugal pump, which is used to pump water from a submersed reservoir towards the PAT booster. At the outlet of the booster, the water is then recirculated within the reservoir. A variable frequency drive is used to regulate the flow rate within the pump, whereas a magnetic flow meter is used to measure the flowing discharge. Moreover, five pressure transducers have been installed within the system: with reference to
Figure 3, one pressure transducer is located downstream of the pump (TA); the other three transducers are located within each branch of the booster (i.e., TB, TC, and TD), whereas the fifth is installed at the outlet (TE). Finally, the power produced by the PATs is measured by means of a digital power meter.
The system is also equipped with a control unit, consisting of a computer (Raspberry Pi™), which acquires the power data from the power meter. A specific board is used to remotely control the valves as well as to acquire and convert the analog signals from the pressure transducers to digital data.
3. Experimental Tests
The experimental tests have been carried out reproducing the following system configurations:
PAT A ON, PAT B OFF, by-pass OFF;
PAT A OFF, PAT B ON, by-pass OFF;
PAT A ON, PAT B ON, by-pass OFF.
With reference to
Figure 3, according to configuration 1, valve 2 is open, whereas valves 1 and 3 are closed; in configuration 2, instead, consists of both valves 1 and 2 being closed and valve 3 being opened; finally, in configuration 3, valves 2 and 3 are opened and only valve 1 is closed. It is worth highlighting that transient conditions have not been considered, since the valve maneuvers are slow, taking around 20 s, which is definitely greater than the time required for a pressure wave to travel two times such a short pipe length.
Figure 4 shows the results of the experiments on the energy booster. In
Figure 4, the magenta and red curves refer to configurations 1 and 2, respectively, which are based on the single operation of the PATs, whereas the green curves refer to configuration 3 (parallel operation). With reference to
Figure 4, the values of head drop (H) are computed as the difference between the points at the inlet and outlet of the booster (i.e., TA and TE in
Figure 3). It is worth clarifying that such curves account for both the head drop produced by the device and the head loss within the pipe from point A up to the inlet of the booster, as well as the head loss within the booster itself.
With reference to the middle plot in
Figure 4, both the PATs start producing power after a certain flow rate, whereas for lower values of flow rate, the devices absorb power (i.e., the power is negative), dissipating energy. With reference to the bottom plot of
Figure 4, as expected, the efficiency values are very low and close to 0.3.
Figure 5 shows the comparison between the curves of the booster system and the characteristics curves of both the PATs provided by the manufacturer.
According to the top plot of
Figure 5 the booster curves (i.e., the magenta and red curves for PAT A and PAT B, respectively) are above the bare PAT curves (i.e., the blue and black curves for PAT A and PAT B, respectively). This proves the fact that the measures of head drop take into account the head loss within the system, thus, for a given flow rate (Q), the measured values are greater than the head drop values, resulting from the curves provided by the PAT manufacturers. Moreover, the difference in terms of head drop can also be due to measurement errors. With reference to the middle and bottom plots of
Figure 5, the slight disagreement between the bare PAT curves and booster curves is still related to measurement errors, as well as to slightly different fluid dynamics affecting the pump within the booster.
4. Conclusions
This study presents a new design of hydropower plant, which consists of three pipe branches in parallel. Within two branches, two submersible pumps work in inverse mode, and these can be isolated by means of ON/OFF valves. A further valve is located within the third branch in order to by-pass a portion of the discharge flowing through the system. The parallel circuit is installed within a booster, which can be located under existing manholes. The aim behind such a newly proposed plant is to reduce the total costs affecting traditional small hydropower plants, where the realization, installation, and regulation costs can be so high that they are not rewarded by the energy revenue, thus compromising the feasibility of the plants themselves. Indeed, electrical regulation within small hydropower plants is significantly expensive due to the employment of variable speed drives to modify the machine’s working conditions, as well as the use of electronic filters to protect the motor and electrical parts in the case of submersible machines. However, in the presence of limited hydropower potential, even a traditional hydraulic regulation, consisting of a series-parallel circuit with two PRVs and a single PAT, could not be affordable. The new plant consists of a more simplified hydraulic regulation where the PRVs are replaced by two more common ON/OFF valves, and two multistage submersible pumps working as turbines are employed to deal with the wide flow rate distribution as well as the high available head drops. Finally, the booster configuration also allows us to overcome the issue represented by the acoustic noise in close urbanized areas.
The prototype of the new plant has been realized and tested within the Hydro Energy Lab of the University of Naples “Federico II”. Preliminary experimental tests have been carried out in order to investigate the behavior of the newly designed plant. According to the comparison of the performance booster curves with the bare curves provided by the manufacturer, a slight difference can be observed, which is due to measurement errors as well as to the presence of head loss within the booster system. However, the energy efficiency of the plant is well preserved, making this design a very promising and viable technology for hydropower plants.
Future investigations will be focused on the optimal regulation of the plant, determining the most efficient operating conditions. A flow-based power plant control will be properly defined and an economic analysis will be performed for both the prototype and for a larger-sized hydropower plant.
Author Contributions
Conceptualization, O.F. and A.C.; methodology, O.F. and A.C.; software, O.F. and M.C.M.; validation, O.F. and M.C.M.; formal analysis, O.F., A.C. and M.C.M.; investigation, O.F. and A.C.; resources, O.F. and A.C.; data curation, O.F.; writing—original draft preparation, O.F., A.C. and M.C.M.; writing—review and editing, O.F., A.C. and M.C.M.; visualization, O.F., A.C. and M.C.M.; supervision, O.F. and A.C.; project administration, A.C.; funding acquisition, A.C. All authors have read and agreed to the published version of the manuscript.
Funding
This research is supported by the project REDAWN (Reducing Energy Dependency in Atlantic Area Water Networks) EAPA_198/2016 from INTERREG ATLANTIC AREA PROGRAMME 2014–2020.
Institutional Review Board Statement
Not applicable.
Informed Consent Statement
Not applicable.
Conflicts of Interest
The authors declare no conflict of interest.
References
- Fecarotta, O.; Carravetta, A.; Morani, M.C.; Padulano, R. Optimal Pump Scheduling for Urban Drainage under Variable Flow Conditions. Resources 2018, 7, 73. [Google Scholar] [CrossRef] [Green Version]
- Morani, M.C.; Carravetta, A.; Del Giudice, G.; McNabola, A.; Fecarotta, O. A Comparison of Energy Recovery by PATs against Direct Variable Speed Pumping in Water Distribution Networks. Fluids 2018, 3, 41. [Google Scholar] [CrossRef] [Green Version]
- Carravetta, A.; Del Giudice, G.; Fecarotta, O.; Gallagher, J.; Morani, M.C.; Ramos, H.M. The Potential Energy, Economic & Environmental Impacts of Hydro Power Pressure Reduction on the Water-Energy-Food Nexus. J. Water Resour. Plan. Manag. 2022, 148, 04022012. [Google Scholar]
- Gómez, E.; Cabrera, E.; Balaguer, M.; Soriano, J. Direct and Indirect Water Supply: An Energy Assessment. Procedia Eng. 2015, 119, 1088–1097. [Google Scholar] [CrossRef] [Green Version]
- Coelho, B.; Andrade-Campos, A. Efficiency achievement in water supply systems—A review. Renew. Sustain. Energy Rev. 2014, 30, 59–84. [Google Scholar] [CrossRef]
- Jafari, R.; Khanjani, M.J.; Esmaeilian, H.R. Pressure Management and Electric Power Production Using Pumps as Turbines. J. Am. Water Work. Assoc. 2015, 107, E351–E363. [Google Scholar] [CrossRef]
- Cabrera, E.; Gomez, E.; Cabrera, E., Jr.; Soriano, J.; Espert, V. Energy Assessment of Pressurized Water Systems. J. Water Resour. Plan. Manag. 2015, 141, 04014095. [Google Scholar] [CrossRef]
- Morani, M.C.; Carravetta, A.; Fecarotta, O.; McNabola, A. Energy Transfer from the Freshwater to the Wastewater Network Using a PAT-Equipped Turbopump. Water 2019, 12, 38. [Google Scholar] [CrossRef] [Green Version]
- Carravetta, A.; Fecarotta, O.; Conte, M.C. Minimum Efficiency Index: Testing its performance. World Pumps 2017, 2017, 34–37. [Google Scholar] [CrossRef]
- Lamaddalena, N.; Khila, S. Efficiency-driven pumping station regulation in on-demand irrigation systems. Irrig. Sci. 2011, 31, 395–410. [Google Scholar] [CrossRef]
- Pérez-Sánchez, M.; Sánchez-Romero, F.J.; Ramos, H.M.; López-Jiménez, P.A. Energy Recovery in Existing Water Networks: Towards Greater Sustainability. Water 2017, 9, 97. [Google Scholar] [CrossRef]
- Morani, M.C.; Simão, M.; Gazur, I.; Santos, R.S.; Carravetta, A.; Fecarotta, O.; Ramos, H.M. Pressure Drop and Energy Recovery with a New Centrifugal Micro-Turbine: Fundamentals and Application in a Real WDN. Energies 2022, 15, 1528. [Google Scholar] [CrossRef]
- Ramos, H.M.; Vieira, F.; Covas, D.I.C. Energy efficiency in a water supply system: Energy consumption and CO2 emission. Water Sci. Eng. 2010, 3, 331–340. [Google Scholar]
- Schwaller, J.; Zyl, J.E. van Modeling the Pressure-Leakage Response of Water Distribution Systems Based on Individual Leak Behavior. J. Hydraul. Eng. 2014, 141, 04014089. [Google Scholar] [CrossRef]
- Khulief, Y.A.; Khalifa, A.; Ben Mansour, R.; Habib, M.A. Acoustic Detection of Leaks in Water Pipelines Using Measurements inside Pipe. J. Pipeline Syst. Eng. Pr. 2012, 3, 47–54. [Google Scholar] [CrossRef]
- Morillo, J.G.; McNabola, A.; Camacho, E.; Montesinos, P.; Díaz, J.A.R. Hydro-power energy recovery in pressurized irrigation networks: A case study of an Irrigation District in the South of Spain. Agric. Water Manag. 2018, 204, 17–27. [Google Scholar] [CrossRef]
- Sinagra, M.; Sammartano, V.; Morreale, G.; Tucciarelli, T. A New Device for Pressure Control and Energy Recovery in Water Distribution Networks. Water 2017, 9, 309. [Google Scholar] [CrossRef] [Green Version]
- Carravetta, A.; Derakhshan, S.H.; Ramos, H.M. Pumps as Turbines: Fundamentals and Applications; Springer: Cham, Switzerland, 2018; pp. 97–116. ISBN 978-3-319-67506-0. [Google Scholar]
- Carravetta, A.; Del Giudice, G.; Fecarotta, O.; Ramos, H.M. Energy Production in Water Distribution Networks: A PAT Design Strategy. Water Resour. Manag. 2012, 26, 3947–3959. [Google Scholar] [CrossRef]
- Fecarotta, O.; Ramos, H.M.; Derakhshan, S.; Del Giudice, G.; Carravetta, A. Fine Tuning a PAT Hydropower Plant in a Water Supply Network to Improve System Effectiveness. J. Water Resour. Plan. Manag. 2018, 144. [Google Scholar] [CrossRef]
- Pugliese, F.; De Paola, F.; Fontana, N.; Giugni, M.; Marini, G. Experimental characterization of two Pumps as Turbines for hydropower generation. Renew. Energy 2016, 99, 180–187. [Google Scholar] [CrossRef]
- Carravetta, A.; Del Giudice, G.; Fecarotta, O.; Ramos, H.M. Pump as Turbine (PAT) Design in Water Distribution Network by System Effectiveness. Water 2013, 5, 1211–1225. [Google Scholar] [CrossRef] [Green Version]
- Carravetta, A.; Del Giudice, G.; Fecarotta, O.; Ramos, H.M. PAT Design Strategy for Energy Recovery in Water Distribution Networks by Electrical Regulation. Energies 2013, 6, 411–424. [Google Scholar] [CrossRef]
- Punys, P.; Dumbrauskas, A.; Kvaraciejus, A.; Vyciene, G. Tools for Small Hydropower Plant Resource Planning and Development: A Review of Technology and Applications. Energies 2011, 4, 1258–1277. [Google Scholar] [CrossRef] [Green Version]
- Gallagher, J.; Harris, I.M.; Packwood, A.J.; McNabola, A.; Williams, A.P. A strategic assessment of micro-hydropower in the UK and Irish water industry: Identifying technical and economic constraints. Renew. Energy 2015, 81, 808–815. [Google Scholar] [CrossRef]
- Motwani, K.; Jain, S.; Patel, R. Cost Analysis of Pump as Turbine for Pico Hydropower Plants—A Case Study. Procedia Eng. 2013, 51, 721–726. [Google Scholar] [CrossRef] [Green Version]
- Morani, M.C.; Carravetta, A.; D’Ambrosio, C.; Fecarotta, O. A new mixed integer non-linear programming model for optimal PAT and PRV location in water distribution networks. Urban Water J. 2021, 18, 394–409. [Google Scholar] [CrossRef]
- Carravetta, A.; Fecarotta, O.; Ramos, H. A new low-cost installation scheme of PATs for pico-hydropower to recover energy in residential areas. Renew. Energy 2018, 125, 1003–1014. [Google Scholar] [CrossRef]
- Stel, H.; Sirino, T.; Prohmann, P.R.; Ponce, F.; Chiva, S.; Morales, R.E.M. CFD Investigation of the Effect of Viscosity on a Three-Stage Electric Submersible Pump. In Proceedings of the ASME 2014 4th Joint US-European Fluids Engineering Division Summer Meeting Collocated with the ASME 2014 12th International Conference on Nanochannels, Microchannels, and Minichannels, Chicago, IL, USA, 3–7 August 2014. [Google Scholar]
- Beck, M.; Sperlich, A.; Blank, R.; Meyer, E.; Binz, R.; Ernst, M. Increasing Energy Efficiency in Water Collection Systems by Submersible PMSM Well Pumps. Water 2018, 10, 1310. [Google Scholar] [CrossRef]
| Publisher’s Note: MDPI stays neutral with regard to jurisdictional claims in published maps and institutional affiliations. |
© 2022 by the authors. Licensee MDPI, Basel, Switzerland. This article is an open access article distributed under the terms and conditions of the Creative Commons Attribution (CC BY) license (https://creativecommons.org/licenses/by/4.0/).


