1. Introduction
Bioclimatic extremes, specifically those related to heat and cold, are rare events. The difference with respect to extreme climatic phenomena lies in the fact that they are expressed in terms of indicators of comfort, thermal stress, epidemiological, economic, etc., all related to bioclimatology [
1]. These events are of great importance, because their occurrence implies that living beings will be affected.
In countries located at medium and high latitudes, bioclimatic extremes cause high mortality figures, mainly in older people and those with pre-existing diseases [
2]. In tropical countries, research has been directed mainly to the study of heat extremes, which is related to the climates of these countries. However, this does not mean that, under certain circumstances and during a certain period of the year—known in Cuba as the dry season, extreme cold conditions will not occur in the country, which sometimes cause extreme thermal sensations associated with the intense cold perceived by the population. Therefore, Velázquez et al. [
3], following the methodology of Guevara [
4], which analyzed the bioclimatic extremes due to heat, studied the bioclimatic extremes due to cold in Havana, through the use of a new indicator: the Intense Cold Condition (CFI, by its acronym in Spanish), based on the effective temperature (TE, by its acronym in Spanish) and equivalent effective temperature (TEE, by its acronym in Spanish). This research shows the low frequency registered by this indicator, presenting on only 8% of the total days analyzed, and confirms that it is typical of the dry season in Cuba, including October as the transition month, since these months are in the 99.8% of the cases studied.
Despite this, there is still a need for greater knowledge of the impact of these conditions in the country, especially in the analysis of other aspects of the indicator, such as the persistence of the phenomenon, because its influence for several days can cause a greater discomfort in the population, as it prevails for a longer period of time, and may increase risk, conditioned by less adaptation to these conditions. Therefore, this article intends to broaden the knowledge about the CFI in the territory, based on the determination and analysis of certain statistical characteristics such as gusts, persistence and the conditioned probabilities of days with the presence of the indicator.
2. Materials and Methods
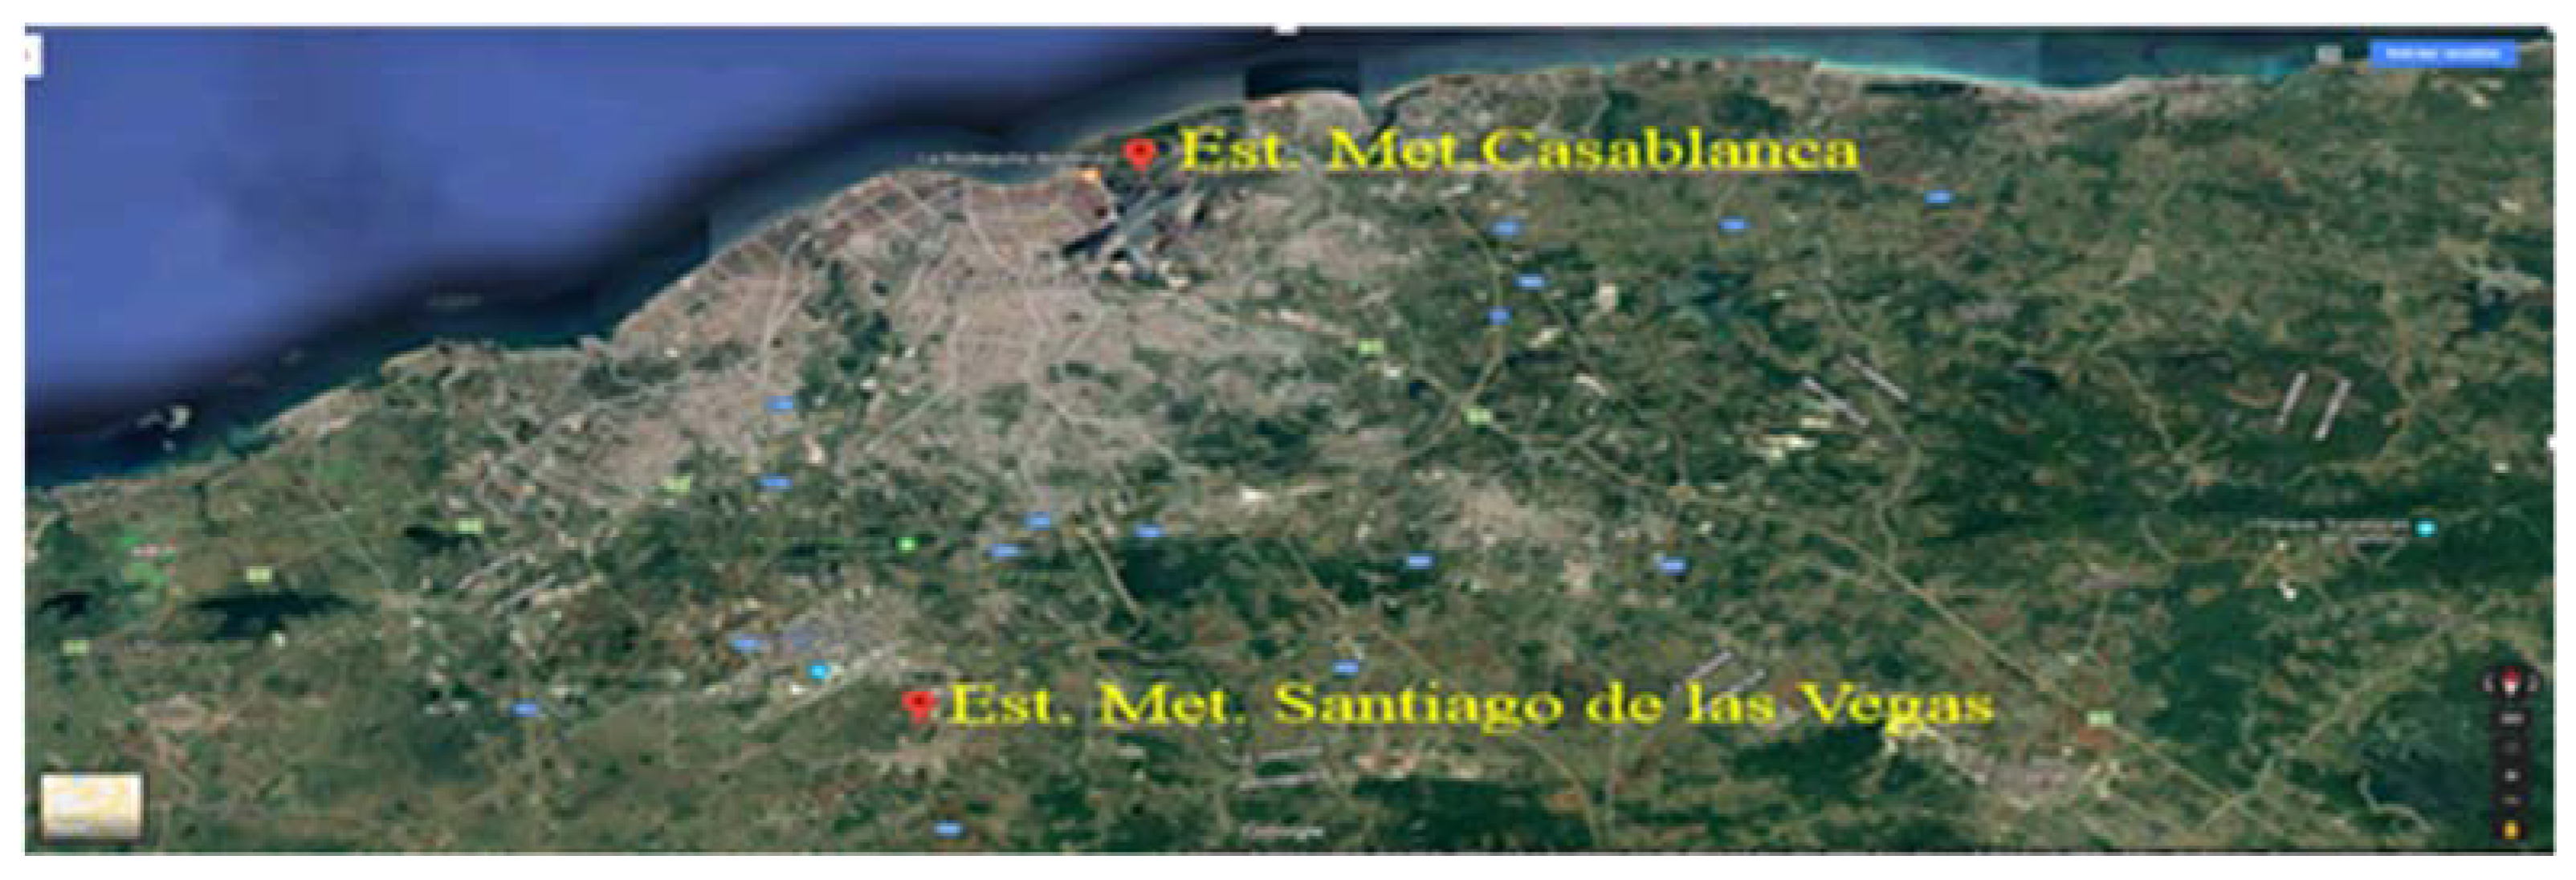
The study period comprised a series of 38 years, from 1980 to 2018. The climatological data used included the following parameters: air temperature, relative humidity and wind speed, measured at 07:00 and 13:00 h of the 75° W meridian in the months of the winter period in Cuba. In general, it is considered that the first schedule characterizes the coldest period with a good approximation, and the second, the hottest within the day, in Cuba. These data were extracted from two meteorological stations: Casablanca and Santiago de las Vegas (
Figure 1), belonging to the network of meteorological stations of the Institute of Meteorology (INSMET). Both stations are located in the province of Havana: located in western Cuba, a region in which there is a marked drop in temperatures during the winter period [
5].
The Intense Cold Condition (CFI, by its acronym in Spanish) was enunciated by Velázquez [
3], who defined it as “that condition where, subjectively, thermal sensations due to excessive cold prevail throughout the day or in a considerable part of it, either due to its intensity, duration or by a combination of both characteristics”.
The CFI without wind (CFIsv, by its acronym in Spanish) illustrates the presence of thermal sensations from Very Cold to Comfortable, based on the TE values at 7 and 13 h, which take into account only the combined effect of the relative humidity and air temperature.
The CFI with wind (CFIcv, by its acronym in Spanish) represents the occurrence of Very Cold to Comfortable sensations, starting from the TEE values at 7 and 13 h, based on air temperature, relative humidity and wind intensity.
The indicator has 5 categories that go from the least intense to the most intense, in ascending order, as shown in
Table 1.
For each weather station, the frequency of days with CFI in its two variants was determined, also counting the number of events of consecutive days with these conditions (gusts). The intensity of the gusts was also determined by taking into account the number of consecutive days that made it up.
As a final step, a series of days with CFIsv/cv without wind/with wind was formed for each meteorological station, with which the desired statistical characteristics were determined. Persistence was selected, which shows how repetitive a phenomenon is from the point of view of its occurrence [
2]. The absolute and empirical probabilities of the occurrence of days with CFI were also calculated for the two study stations in order to obtain the coefficient of persistence of days with CFI in its two modalities, without wind and with wind.
3. Results and Discussion
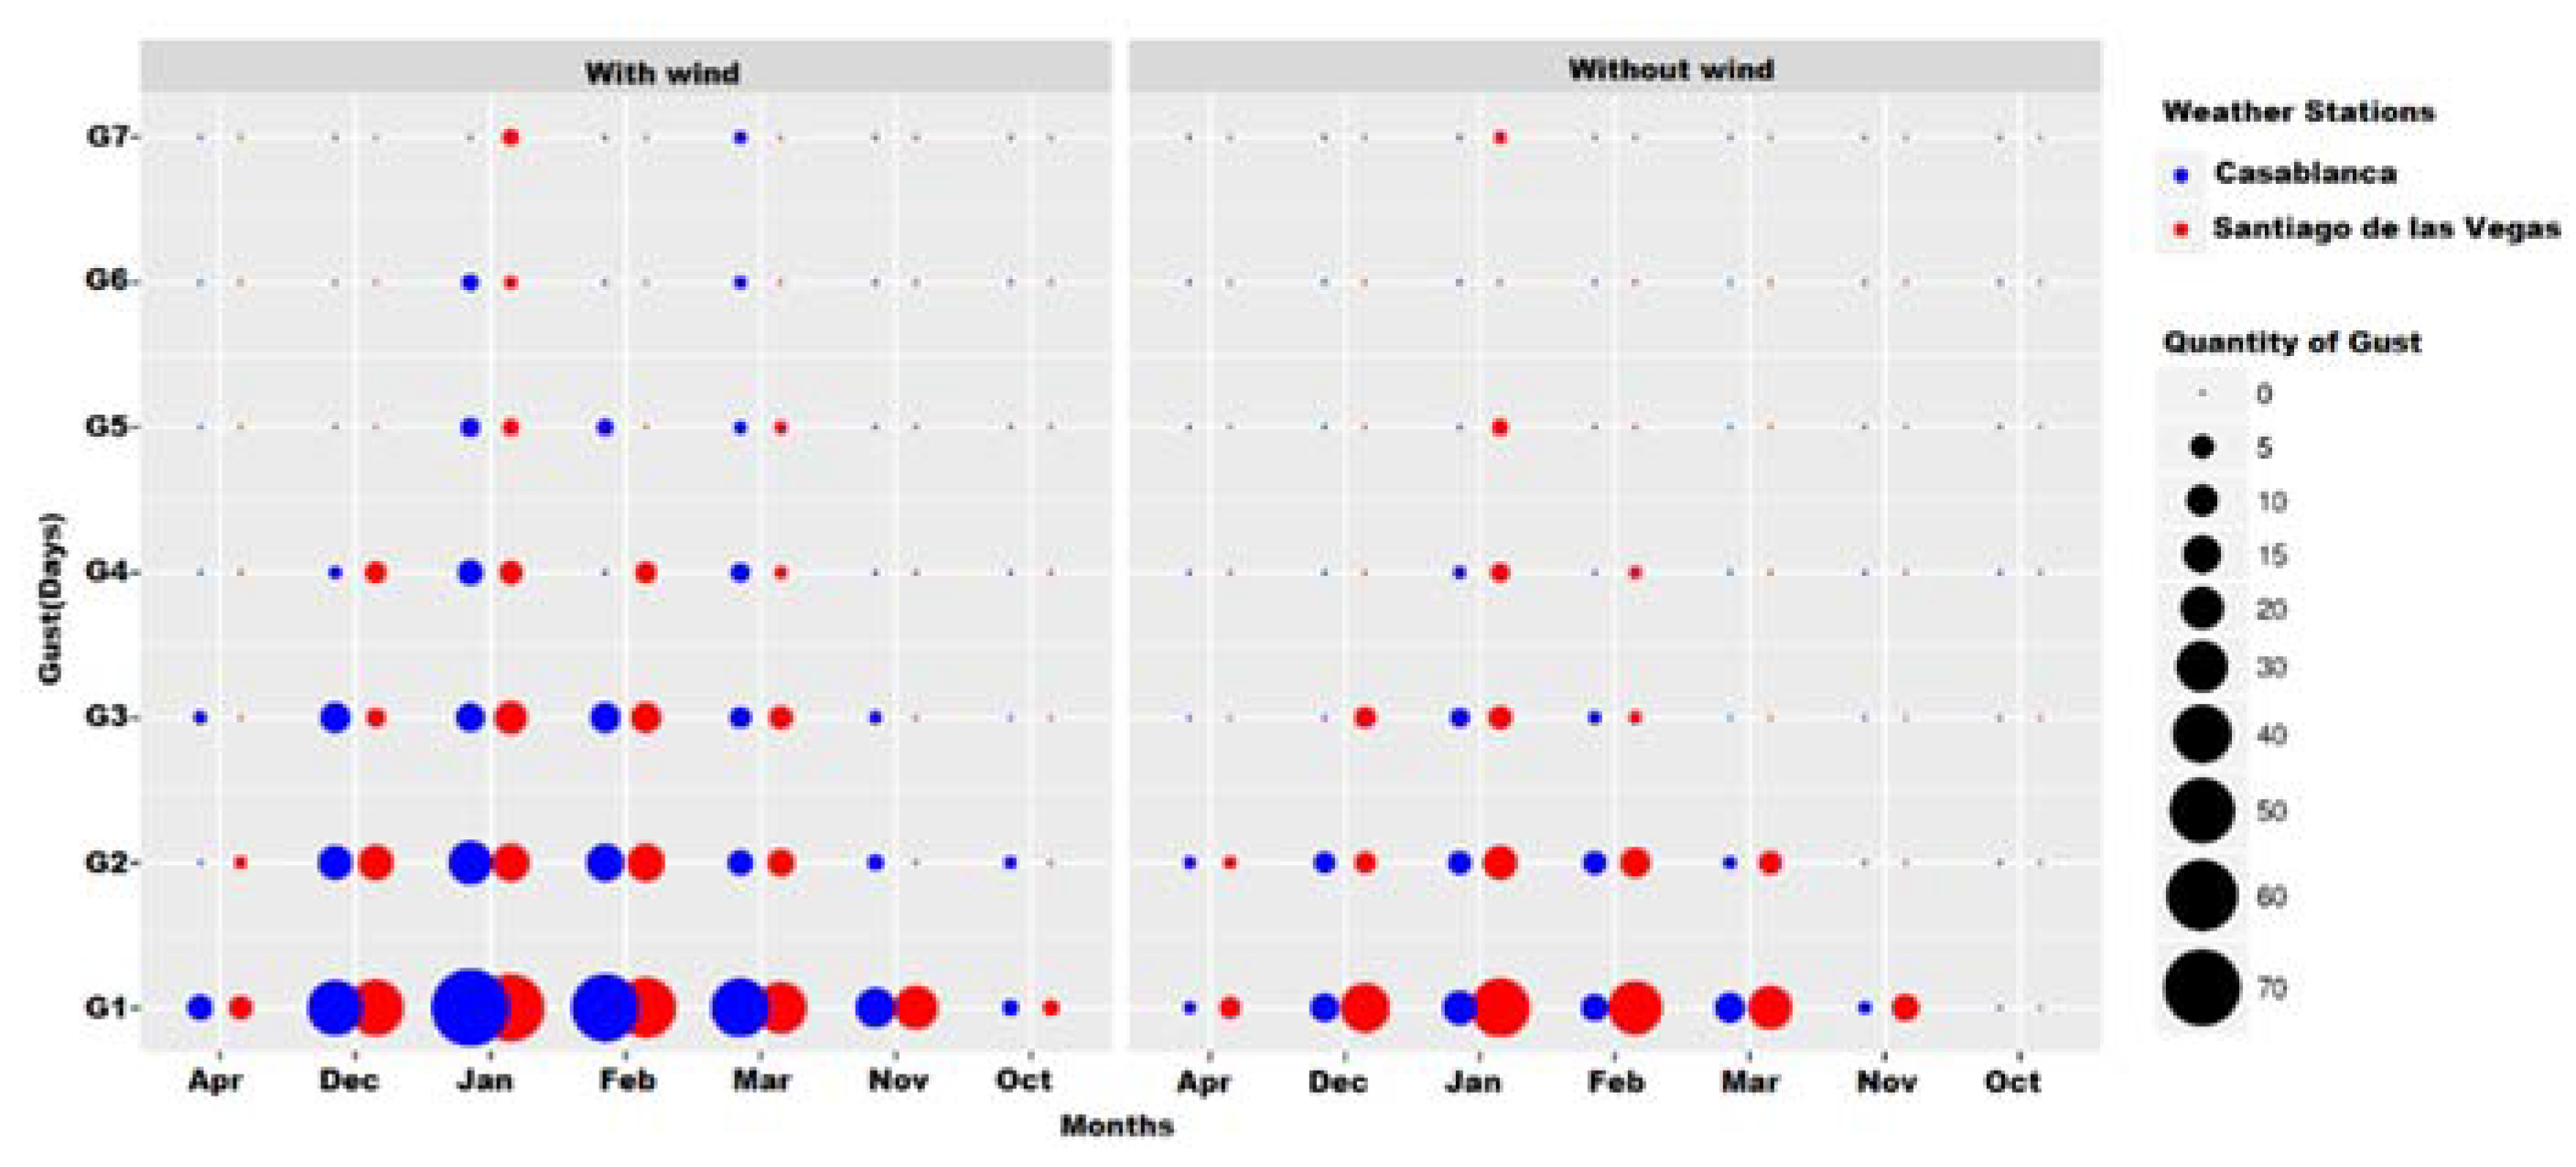
The highest number of gusts of days with CFI occurred in the months of January and February, both for CFIsv and CFIcv. Values of up to 7 consecutive days (G7) were reached with the presence of IFC, although gusts of 1 day (G1) predominated, that is, the manifestation of the event in isolation over time, as shown in
Figure 2.
In the 38 years analyzed, the CFIsv in the coastal station presented a greater quantity in the two-month period of January and February, with the month of January standing out with a total of 21 gusts. In Santiago de la Vegas there was a greater number of gusts, although they presented similarity in the months of greatest occurrence, January being the one with the highest number of cases, with a total of 63 gusts. The highest value of consecutive days with the presence of CFIsv was reached in January 2010 with 7 days for the Santiago de las Vegas station.
It is valid to point out that, with the influence of the wind, not only the number of gusts increased in the two variants for both seasons, but also their appearance in the month of October. A higher number of gusts occurred for both seasons in January, as in the variant without wind, with 112 cases in Casablanca and 89 in Santiago de las Vegas; this month was the most representative of the appearance of these events.
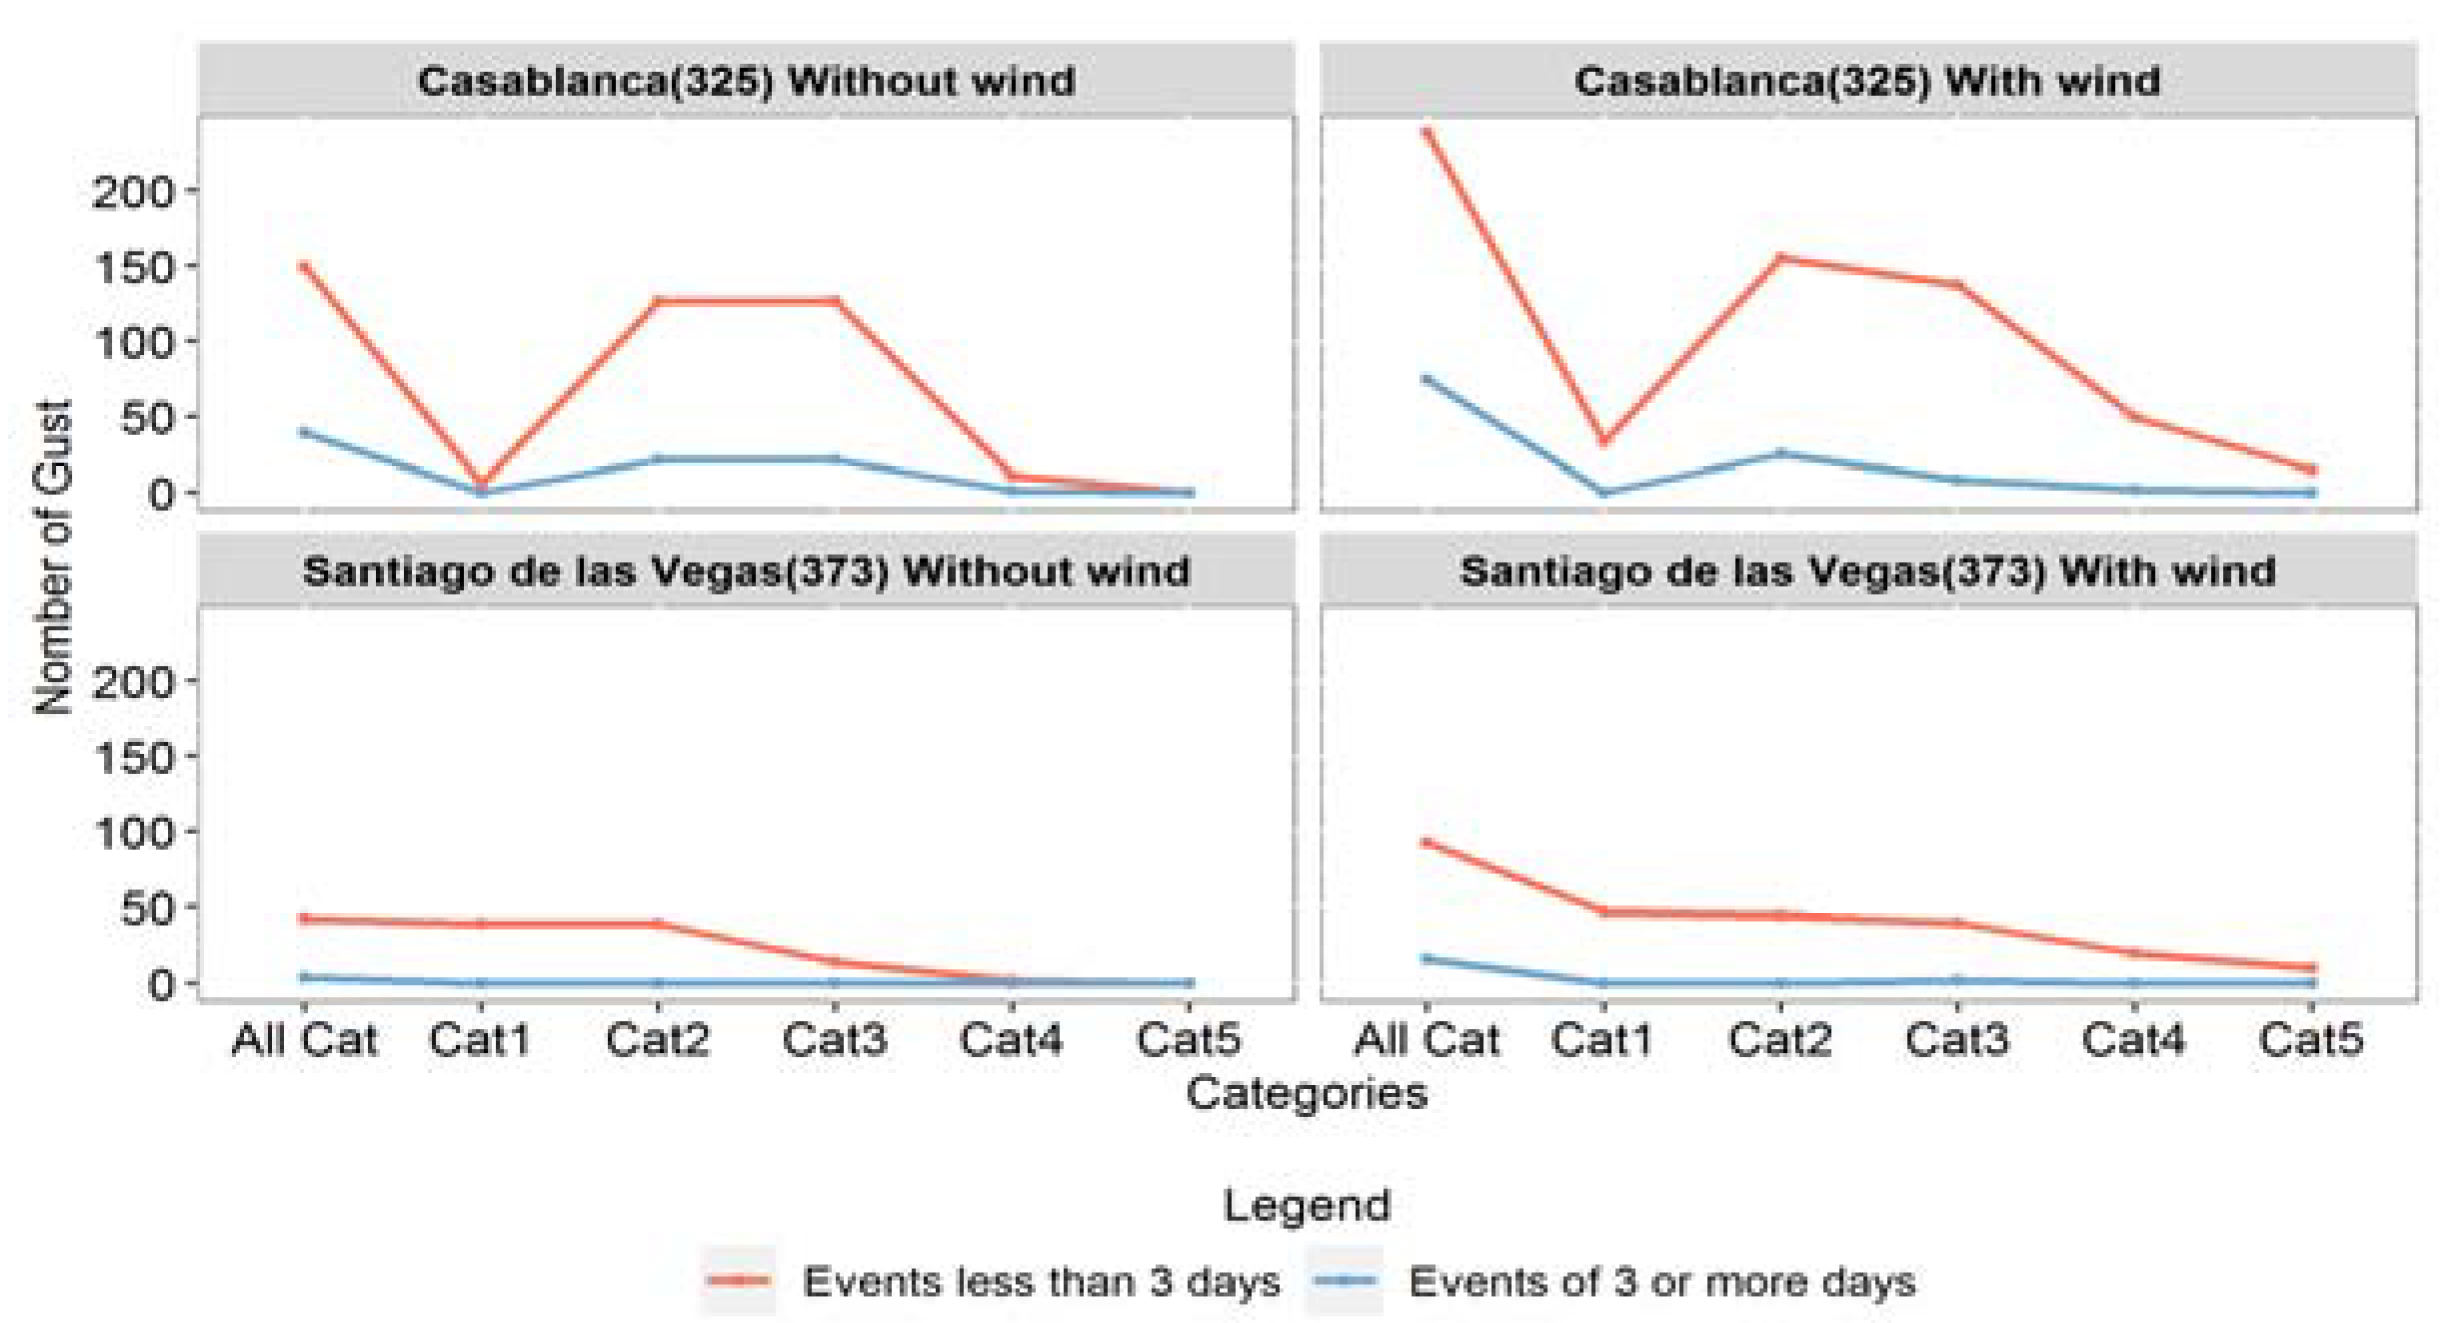
On the other hand, the gust that most prevailed in both seasons and variants was that of 1 day, which shows that isolated and non-consecutive events occurred in most cases, while those greater than 3 days presented fewer cases. It also highlights that category 5 only presented gusts of 1 day in the windy variant, while categories 2 and 3 are the ones that presented the highest number of events both with and without wind (
Figure 3).
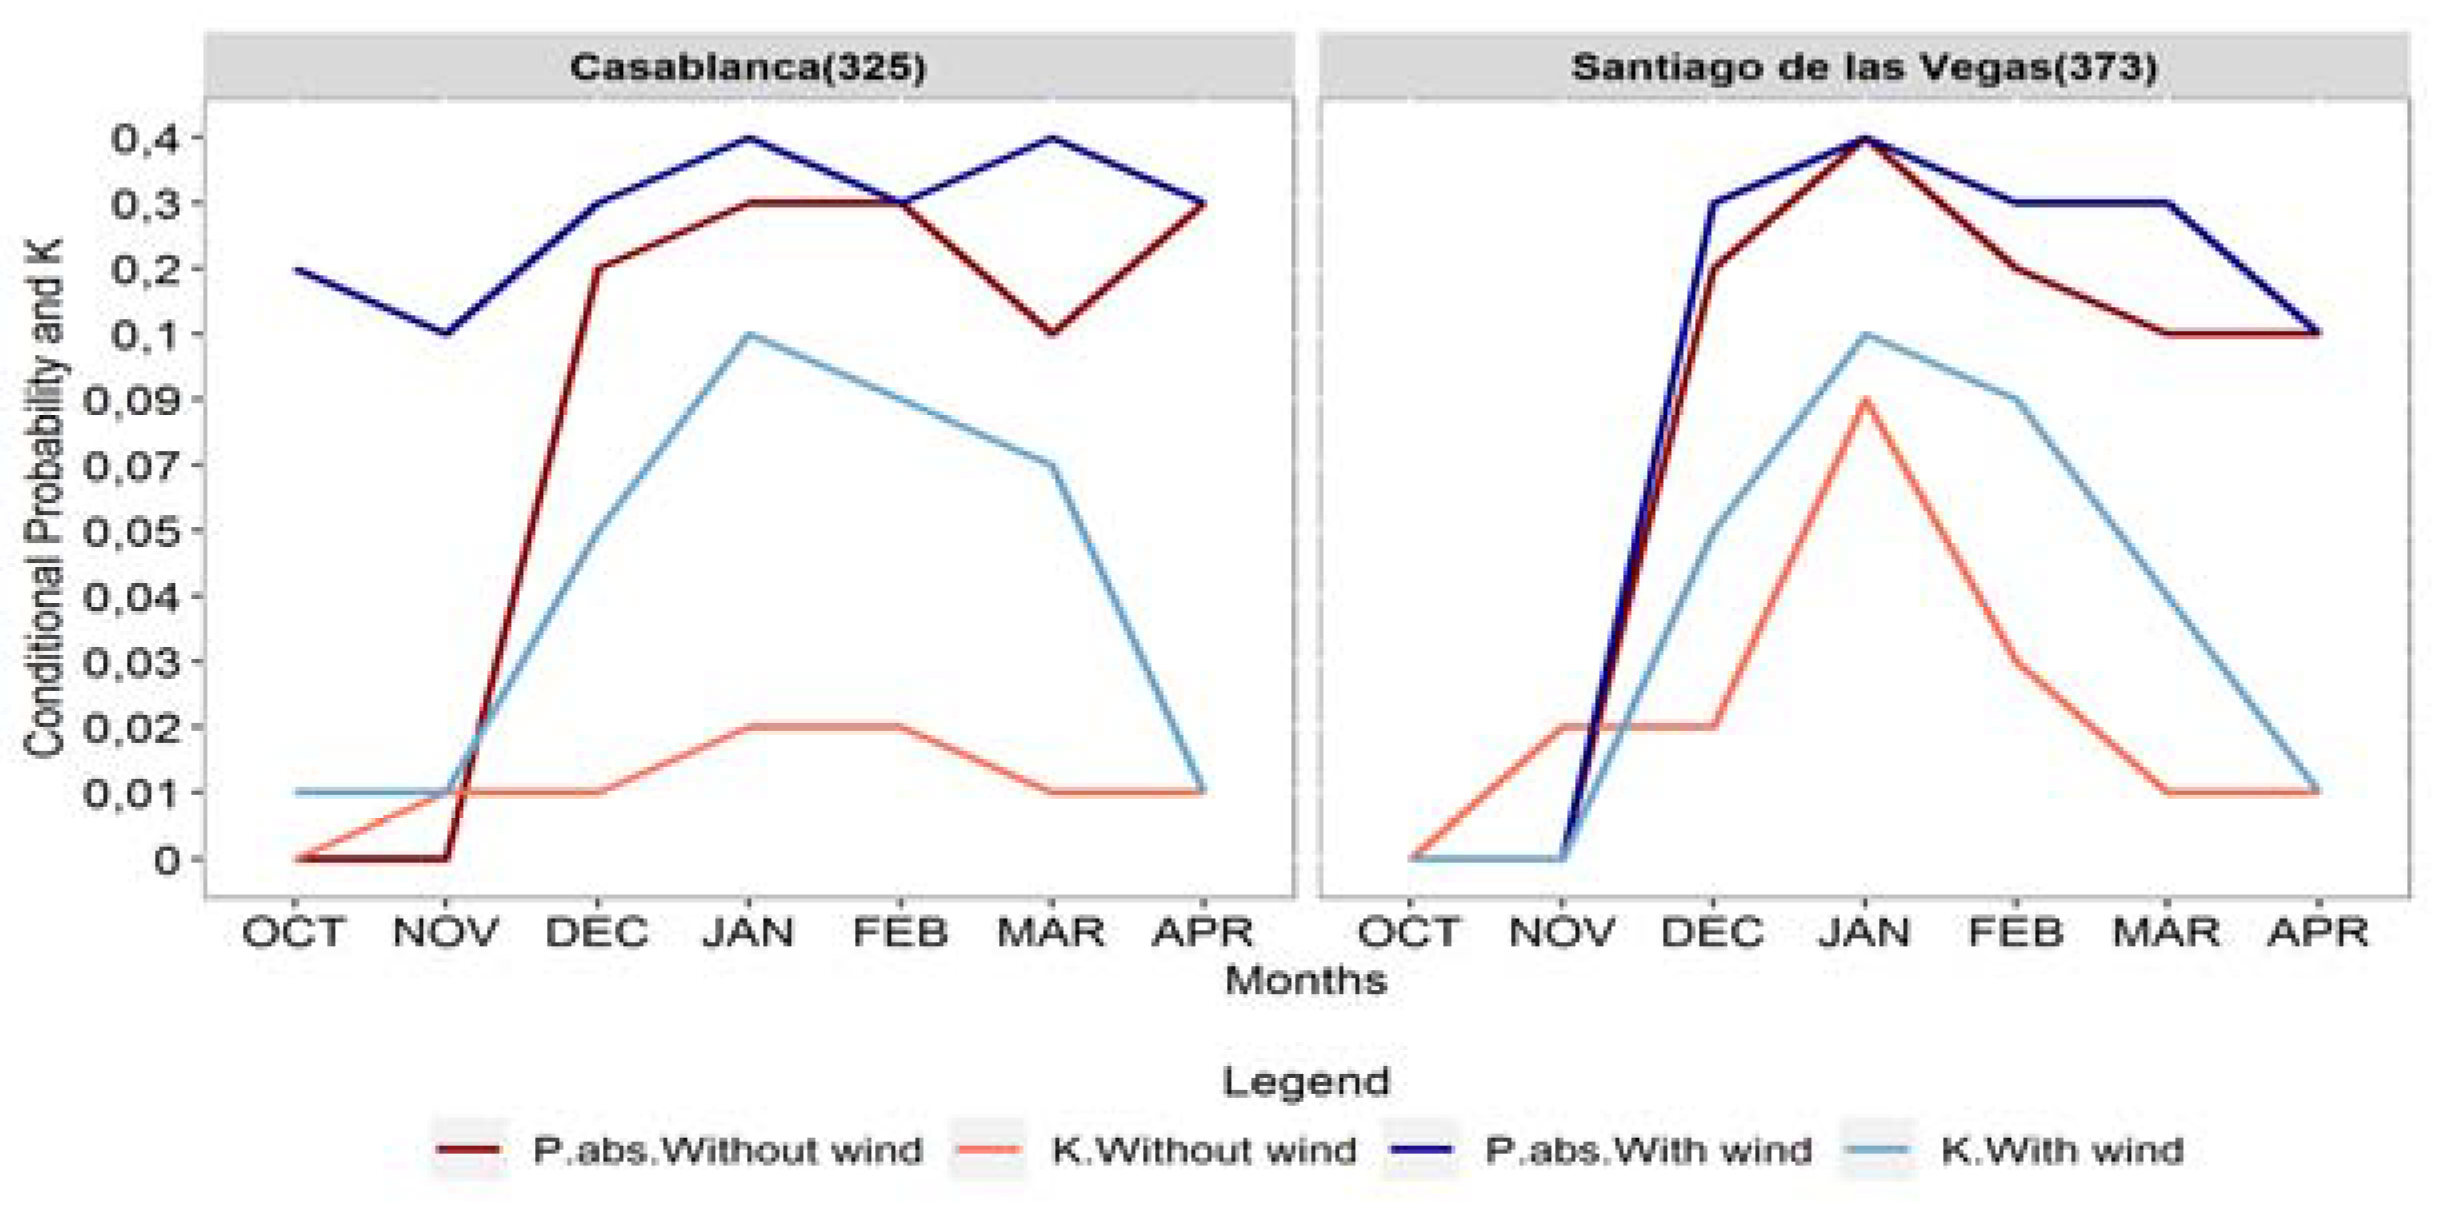
The absolute probability of occurrence of CFIcv with wind reached its maximum amount in Casablanca, while in the windless modality the maximum occurred in Santiago de las Vegas, occurring in both modalities and in both seasons in the month of January. The lowest probability was reported in the month of October, in the windless variant with 0% occurrence in both stations, while, in the windy variant, they occurred for both the coastal and inland stations in October with 0. 0.37% and 0.19%, respectively (See
Table 2 and
Table 3).
In Casablanca, the probability of the occurrence of days with CFI in the windless mode was 1.1%. For the years 1980–2018, there were a total of 28 days preceded by days in this modality, which is equivalent to a 31.1% probability of occurrence of CFI the day after this situation occurred. For the modality with wind during a season, the probability of occurrence was 7.16%. In the 1980–2018 seasons, 199 days preceded by days of the same modality were observed, resulting in a 36.8% probability of occurrence of these conditions the day after they occurred. This resulted in a greater possibility of finding isolated days with CFI than consecutive days with this condition.
In Santiago de las Vegas, the probability of the occurrence of days with CFI in the windless mode was 3.5%. For the period 1980–2018, a total of 80 days preceded by days in this modality occurred, which is equivalent to a 30.1% probability of occurrence of CFI the day after this situation occurred. For the windy modality during a season, the probability of occurrence was 6.3%. In the period 1980–2018, 183 days preceded by days of the same modality were observed, resulting in a 38.2% probability of occurrence of these conditions the day after they occurred. It is valid to emphasize that something similar occurs in Casablanca, where it is more frequent to find isolated days with CFI for both variants.
Figure 4 shows many of the aforementioned characteristics; however, the difference between the two variants (with and without wind) is notorious, reaffirming how decisive the role of the wind was when it came to increasing the probability of the occurrence of storms days with CFI, in addition to being evident of the greater persistence of the phenomenon in the January–February two-month period.
The previous results reflect that there are high values of persistence of the phenomenon in Havana during the months of December to February. This indicates that, in these months, the occurrence of CFI days is more likely, as well as the condition being maintained for more than 1 day, and this is more likely in windy CFI, representative of the worst bioclimatic conditions, although this phenomenon characteristically appears in isolation.
When comparing the results obtained by Hernández [
6] in the analysis of gusts and persistence of days with CCI (extremes due to heat) with the analysis of the persistence and gusts of days with CFI (extremes due to cold), it is observed that there is a lower number of gusts on days with intense cold than with intense heat, in addition, the duration of days with CFI is also lower than the days with CCI, situations typical of tropical climates. However, it is interesting that, for both indicators, the persistence values of the phenomenon become less appreciable as the gusts increased, being more noticeable for the CFI, of which persistence was not a predominant characteristic, which shows that these events are generally limited to periods of a few days.
However, the foregoing statement does not presuppose a total absence of cold temperatures or their extreme manifestations, but rather that, with the increase in climatic variability and the scarce presence of cold extremes, risk may increase due to the different vulnerabilities present in each region or country, conditioned by a lower adaptation to these conditions, which is a product of the prevailing climatic tendencies. So, we are faced with the need to deal with phenomena whose intensity and frequency are changing, or will change, in too short a time for humanity to successfully adapt and continue its development as a species. This knowledge should serve as the basis for the execution of actions that guarantee greater well-being in the populations.


