1. Introduction
In the south of Eastern Siberia, there are three observatories of the Institute of So-lar-Terrestrial Physics of the Siberian Branch of the Russian Academy of Sciences (ISTP SB RAS). They are equipped with instruments to investigate near-Earth space and near and deep space in the optical range. When passing through the atmosphere, optical radiation is subject to various distortions on the atmospheric inhomogeneities, which affects the quality of astronomical data and data of night airglow observations. The main meteorological characteristic defining observational conditions is the number of clear sky days or nights for a certain period (clear sky frequency [
1]) at the point of observations.
Large-scale circulation and weather conditions change over time. We are interested in monitoring these conditions and studying the climatic variability of basic meteorological parameters directly related to the concept of clear sky frequency and atmospheric transparency at the ISTP SB RAS optical observatories. It is essential to diagnose main regularities in the variability of conditions for observations and to assess their possible future changes. The main parameter directly related to the concept of clear sky frequency is cloud cover.
Selecting data for research is a major challenge. At present, this problem is solved on a global scale by reanalysis projects providing information on different meteorological parameters at different atmospheric heights in the regular latitude-longitude grid points with different time resolutions over several decades. In our study, we use total cloud cover data from the ERA5 project [
2] of the European Centre for Medium-Range Weather Forecasts (ECMWF) (
https://www.ecmwf.int/, accessed on 1 February 2021). Similar to other reanalyses, in ERA5, large-scale cloud cover is a calculated characteristic and must first be compared with observations.
The purpose of this comparison is to find out how much of ECMWF’s ERA5 data are suitable to study cloud cover, and what is the main meteorological parameter determining the conditions for optical observations in the local ground-based optical observatory (Geophysical Observatory of the ISTP SB RAS, Buryatia, Russia). As observational data, we use for comparison the data from the Filin-1C wide-angle camera located at the observatory.
2. Data and Instruments
ECMWF’s ERA5 reanalysis [
2]: total cloud cover. This parameter represents a cloud fraction of the grid box. Total cloud cover is a single level field calculated from cloud cover, which occurs at different model levels through the atmosphere, with reference to assumptions about the degree of overlap/randomness between clouds at different heights. Cloud fractions vary from 0 to 1.
Data are presented at one-hour resolutions on 0.25 × 0.25 horizontal grid from 1979 to date. In this article, we used December 2020 data at four grid points nearest to the ISTP SB RAS Geophysical Observatory.
FILIN-1C wide-angle camera:
CCD sensor-based devices are often used to assess atmospheric transparency and cloud cover. For example, in papers [
3,
4,
5], cloud-free and cloud-cover regions of the sky are distinguished based on star concentrations in CCD sensor images.
FILIN-1C wide-angle camera is designed to detect airglow and its spatial and temporal variations, study natural and man-made space objects (meteors, spacecraft), monitor atmospheric transparency and solve some other problems. As a recording device, the instrument employs a CCD camera VideoScan-11002/O/II/2001 manufactured by VideoScan research and production company, Russia (
http://videoscan.ru/, accessed on 1 July 2019), based on CCD matrix KODAK KAI-11002. Main parameters of the CCD camera: 4008 × 2672 pixel image resolution, 9 × 9 micron pixel size. To ensure that the light load of all matrix pixels exceeds the noise level, we set the exposure time to 300 s [
6].
To estimate atmospheric transparency, we use the number of stars in the camera field of view (FOV). The idea is based on the understanding that star images are characterized by brightness with strong spatial gradients that are much higher than those for the background airglow. This, in turn, makes it possible to count the stars visible in the image, and identify them as image areas whose intensity is higher in relation to the background. When changes in the atmospheric transparency are due to clouds, mist or fog, the star brightness drops, intensity gradients weaken, and stars begin to blend into the background. Thus, it is possible to develop an algorithm for processing night-sky images. The algorithm will distinguish relevant groups of pixels (regions) according to a certain threshold value of brightness, and the number of these groups to a certain accuracy will be equal to the number of stars in the camera FOV.
On average, about four thousand stars can be seen in FILIN-1C image of the moonless clear sky. A decrease in the total number of visible stars indicates decreased atmospheric transparency. The cloud criterion (Kc) is essentially the extent to which the camera FOV is shielded coverage by clouds. We calculated it using formula:
where Ns is the number of stars in the current frame, and maxNs is the maximum number of stars per frame during the entire considered time of observations.
3. Results
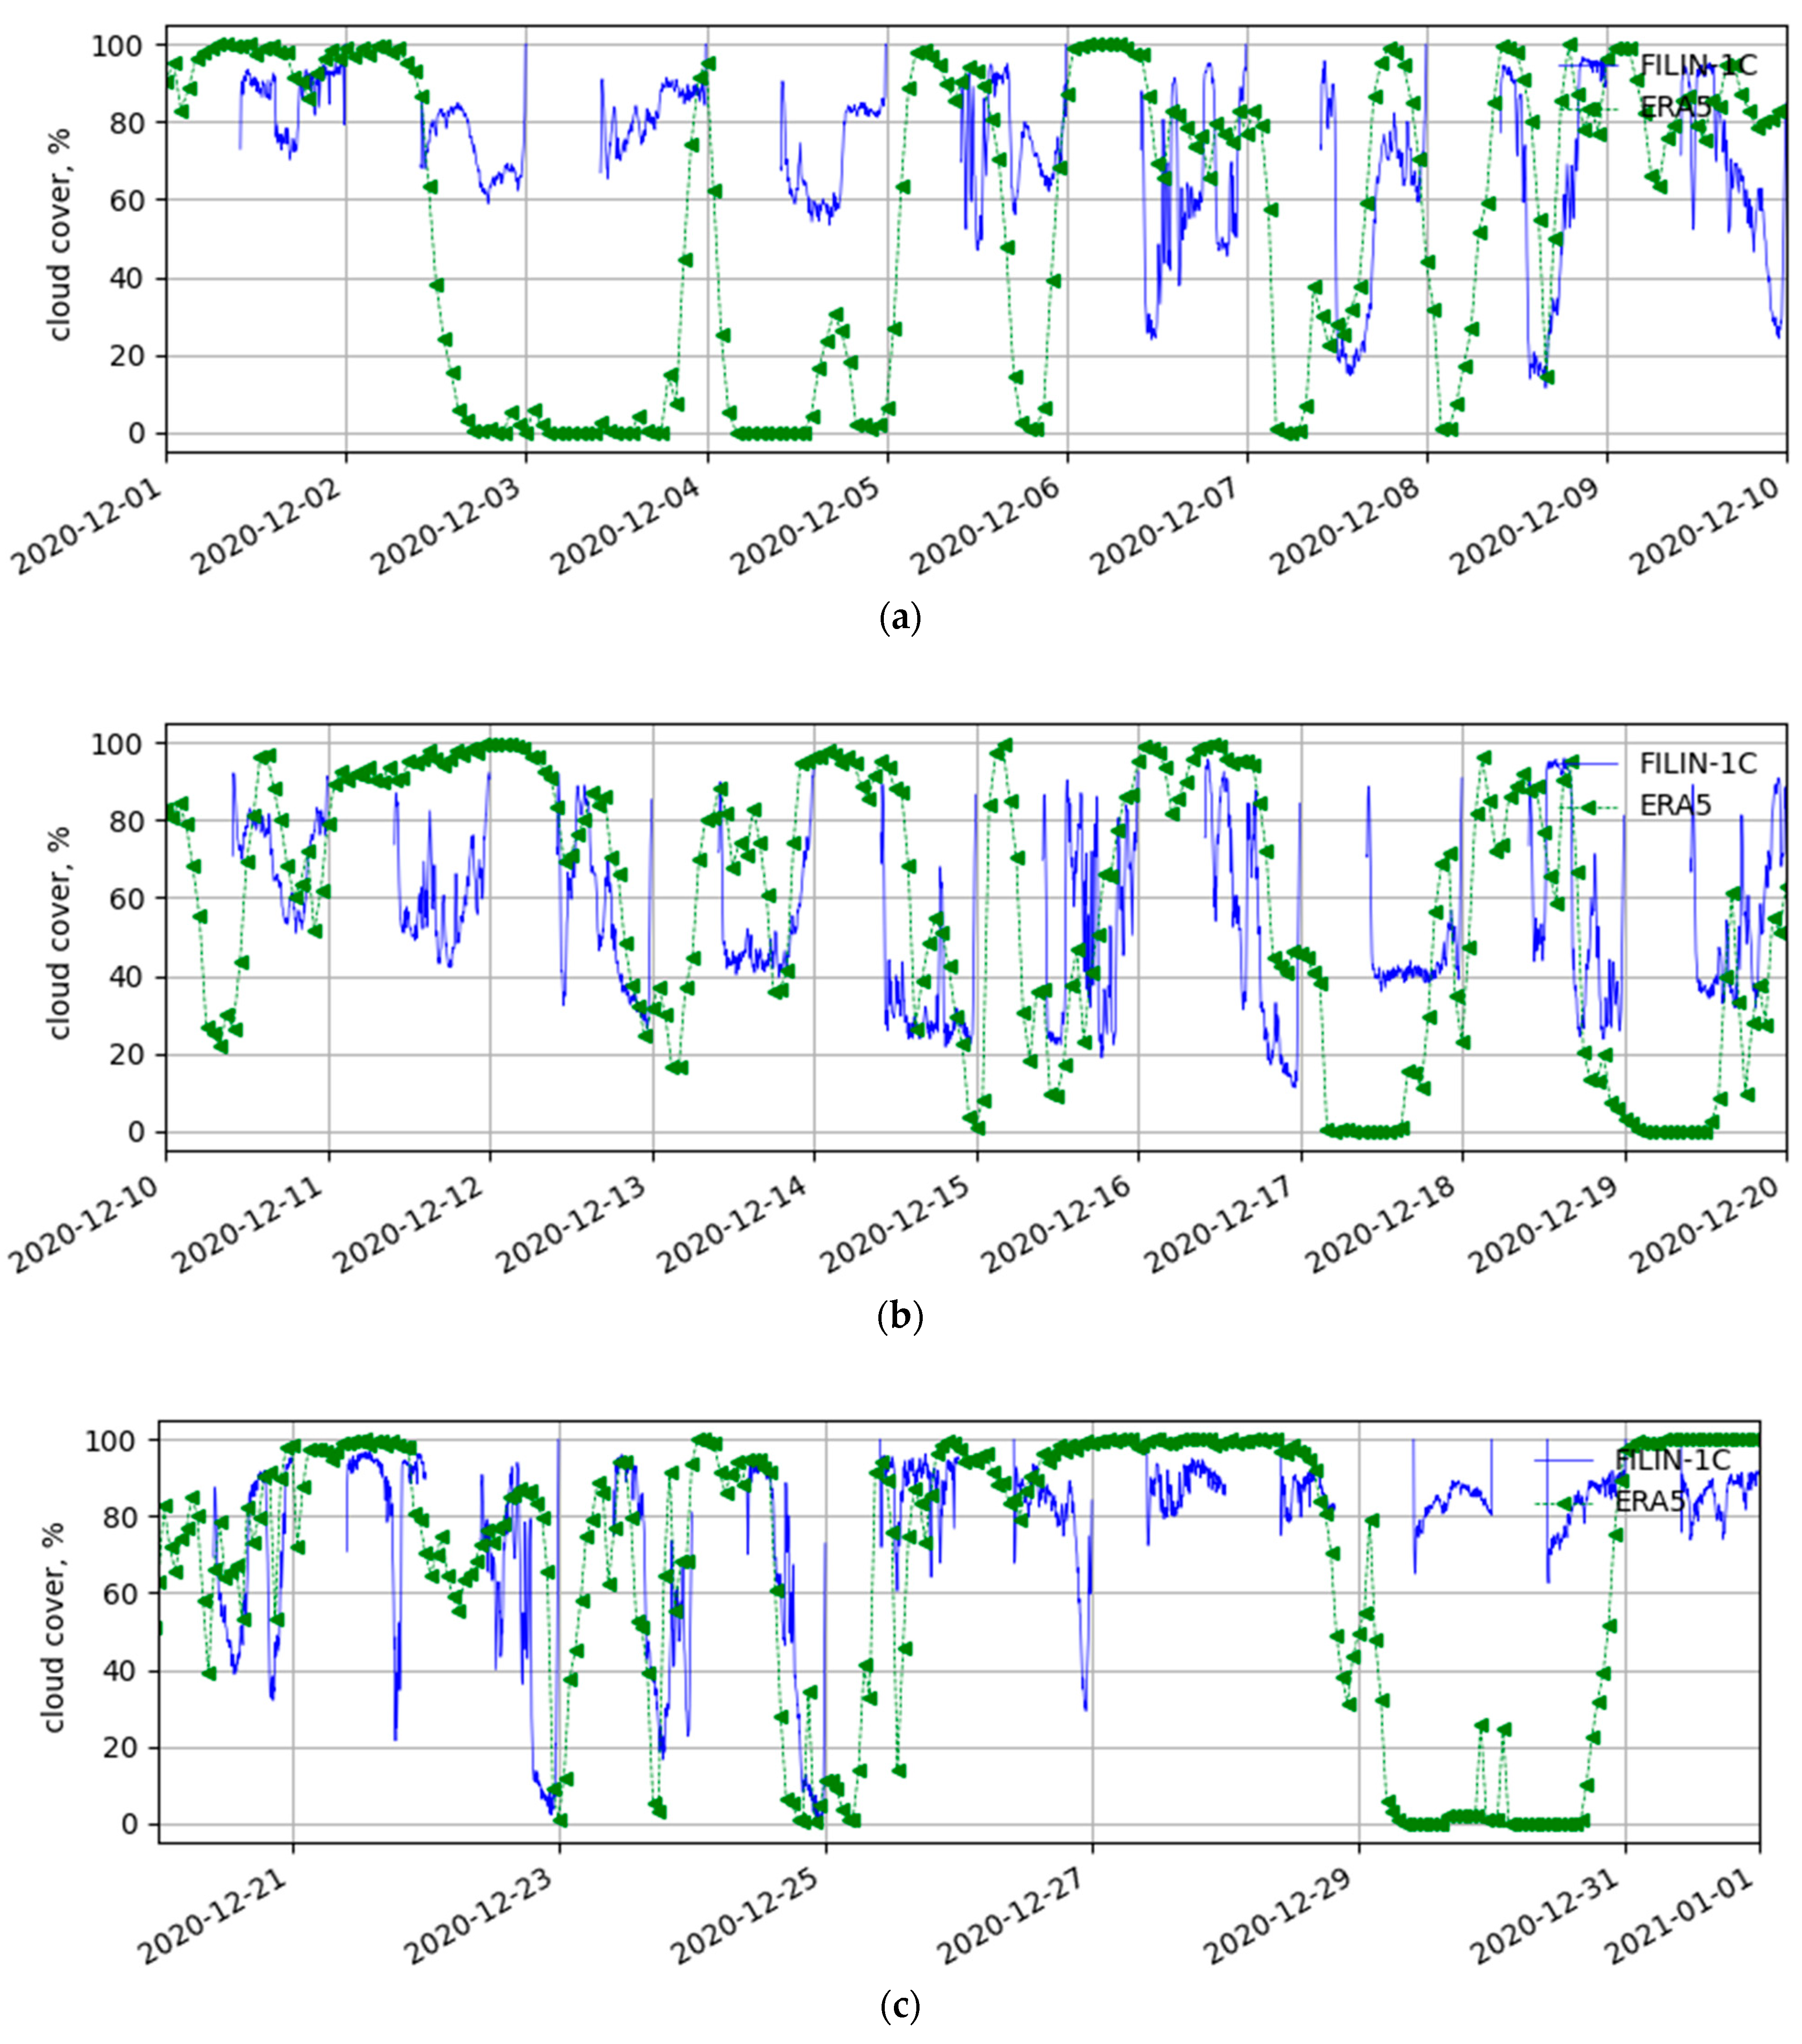
Figure 1 shows the advantages and disadvantages of each data sets, namely: FILIN-1C data are of good time resolution (5 min), but only for dark hours; ERA5 data are continuous with once per hour discreteness.
Figure 1 demonstrates the main features of the inter-dynamics of the two data sets:
- (1)
Time shifts between ERA5 and FILIN-1C data on different nights: 7 December 2020, 8 December 2020, 10 December 2020, 14 December 2020, 22 December 2020, 23 December 2020 and 24 December 2020.
- (2)
Poor representation in ERA5 data of relatively rapid changes in cloud cover, which are clearly visible in FILIN-1C data. (21 December 2020, 22 December 2020 nights, for example). Here, FILIN-1C data have a pronounced Kc minimum that is not found in ERA5. A thorough analysis of the camera original images revealed that this feature is due to short-term clearings (duration of several frames) within the camera working range.
- (3)
Early and late this month, there were a few nights that arose our interest; there was an obvious discrepancy between the Kc data and ERA5 cloud cover, namely, Kc values were too high at low cloud values (2, 3, 4, 5 and 29, 30 December). It turned out that thin clouds and moonlight shine caused data discrepancy. The full-moon light on those nights was scattered on the crystals of high thin clouds, or on the ice covering the camera protecting glass, and led to data distortion. Thus, on the full-moon nights, when the Kc criterion is used to identify cloud cover, one should bear in mind the risk of inaccurate representation of the real picture.
4. Conclusions
We reviewed two data sets on cloud cover: from ECMWF’s ERA5 reanalysis and a FILIN-1C wide-angle camera installed at the ISTP SB RAS Geophysical Observatory (Republic of Buryatia, Russia). When analyzing the results, technical features of data sets should be taken into account. The reanalysis data are the product of the total cloud cover calculations on a stable spatial grid when clouds occur at different levels in the model atmosphere, considering the assumptions about the degree of cloud overlap at different heights. They cannot be attributed to observational data and need to be validated for the selected region at a selected time interval. Camera FILIN-1C data are obtained with good time resolution, but only for dark hours. In the presence of thin cloud scattering crystals during full-moon phases, the moonlight shine can negatively contribute to the images obtained with the camera.
Comparison revealed both match and difference in data. From the material studied, we can confidently say that on the nights without interference (moonlight scattered on thin cloud crystals), ERA5 and FILIN-1C data are very well consistent. This gives us grounds to trust total cloud data from this reanalysis for optical and climatic studies in the Baikal Natural Territory. However, it should be borne in mind that sampling frequency over time of these data is not quite sufficient to monitor observational conditions at the local optical observatory, because they do not represent rapid variations in the total cloud cover. In addition, one should remember that in the case of loose stratified cloud cover, the obtained values of the Kc criterion can be lower compared to denser clouds. At the same time, the overall cloud dynamics from ERA5 and Kc is well correlated. It should be noted that ERA5 slightly overestimates the cloud cover density compared to in-situ data. However, insufficient data for analysis does not allow us to make reliable judgements about it.
Author Contributions
Methodology, S.P. and R.V.; investigation, E.D. and S.P.; resources, R.V.; data curation, R.V.; writing—original draft preparation, E.D. and S.P.; writing—review and editing, R.V.; visualization, S.P. All authors have read and agreed to the published version of the manuscript.
Funding
The study was financially supported by the Ministry of Science and Higher Education of the Russian Federation (Subsidy No. 075-GZ/C3569/278).
Institutional Review Board Statement
Not applicable.
Informed Consent Statement
Not applicable.
Data Availability Statement
Conflicts of Interest
The authors declare no conflict of interest.
References
- Darchia, S.P. On the Astronomical Climate of the USSR; Izdatel’stvo Nauka: Moscow, Russia, 1985; 175p. [Google Scholar]
- Hersbach, H.; Bell, B.; Berrisford, P.; Hirahara, S.; Horányi, A.; Muñoz-Sabater, J.; Nicolas, J.; Peubey, C.; Radu, R.; Schepers, D.; et al. The ERA5 Global Reanalysis. Q. J. R. Meteorol. Soc. 2020, 146, 1999–2049. [Google Scholar] [CrossRef]
- Zdor, S.E.; Kolinko, V.I. Night Cloud Sensor. Patent of Russia No. 2436133, 10 December 2011. [Google Scholar]
- Kazakovtsev, A.F.; Kolinko, V.I. A Method for Assessing Cloudiness of the Night Atmosphere and a Night Cloud Sensor for Its Implementation. Patent of Russia 2678950 C1, 4 February 2019. [Google Scholar]
- Kokarev, D.V.; Galileisky, V.P.; Morozov, A.M.; Elizarov, A.I. A Device for Observing the Optical State of the Sky within the Visible Hemisphere. Patent of Russia RU 191582 U1, 13 August 2019. [Google Scholar]
- Mikhalev, A.V.; Podlesnyi, S.V.; Stoeva, P.V. Night airglow in RGB mode. Sol.-Terr. Phys. 2016, 2, 106–114. [Google Scholar] [CrossRef]
| Publisher’s Note: MDPI stays neutral with regard to jurisdictional claims in published maps and institutional affiliations. |
© 2022 by the authors. Licensee MDPI, Basel, Switzerland. This article is an open access article distributed under the terms and conditions of the Creative Commons Attribution (CC BY) license (https://creativecommons.org/licenses/by/4.0/).


