1. Introduction
A recent report by the Intergovernmental Panel on Climate Change (IPCC) has described that the impact of climate change will lead to more extreme temperatures and more hot days [
1,
2], as well as longer and more intense heat waves. Extreme heat events are days that exceed local thresholds, including single-day events or events of successive days of heat waves. This phenomenon is now well understood due to numerous studies based on several human thermal indices, and their past changes have been investigated [
3]. However, quantifying and assessing extreme heat episodes from a human biometeorological point of view has received little attention in West Bengal, which goes against a satisfactory understanding of extreme heat episodes and the design of proper adaptive strategies. Therefore, the present research analysis aims to use Physiologically Equivalent Temperature (PET) using the RayMan model [
4,
5] to quantify biometeorological conditions and investigate the spatial changes of extreme heat episodes in Kolkata and its outskirts during 2020–2021.
2. Study Regions
This study was conducted over three stations of West Bengal (WB), i.e., Alipore (Kolkata), Dum Dum, and Diamond Harbour. Kolkata is the capital city of WB. Diamond Harbour is located in South 24-Parganas, and Dum Dum is located in North 24-Parganas. The geographical coordinates for each station with their altitudes are listed as follows: Alipore (KOL) (88.32° E, 22.52° N, 6 m), Dum Dum (DMM) (88.45° E, 22.63° N, 6 m), and Diamond Harbour (DHR) (88.20° E, 22.17° N, 4 m). Both Kolkata and Dum Dum lie at an altitude of 6 m above mean sea level. Diamond Harbour lies at a height of 4 m above mean sea level. The climatology follows a similar pattern in all three stations. The winter season starts from mid-November and continues till February. January is the coldest month of the year. The period from March to May is the summer season. The southwest monsoon is from June to September. October and the first half of November represent the post-monsoon season. July is generally the rainiest month. With the progress of the summer season, the evolution of both day and night time temperature increases rapidly until May, which is the hottest month, where the mean daily maximum temperature reaches 32 °C, and the mean daily minimum temperature reaches 23 °C. Occasionally, the day temperatures cross 40 °C on some individual days. The monsoon withdraws early in October, and the temperature begins to drop.
3. Data and Methodology
Meteorological data were obtained from the Indian Meteorological Department (IMD) at 3 h intervals starting from 05:30 h to 20:30 h for all three stations. The PET was calculated for the years 2020 and 2021 using air temperature, cloud cover, wind speed, and relative humidity datasets. In addition to meteorological variables, personal data such as clothing, gender, and age were also considered. No major changes were noticed when the personal variables were varied. Thus, personal variables were fixed at 1.75 m (height), standing (position), 75 kg (weight), 35 years old (age), and male (gender). Consequently, PET was calculated for the three stations. The PET values were further used to identify events when they exceeded 40 °C for each station and at each observation time. There are days with PET values no more than 40 °C, described as no event days. Days with more than 40 °C were classified into six categories, namely, (a) days between 1 and 5, (b) days between 6 and 10, (c) days between 11 and 15, (d) days between 16 and 20, (e) days 21 and 25, (f) and days between 26 and 30.
4. Results
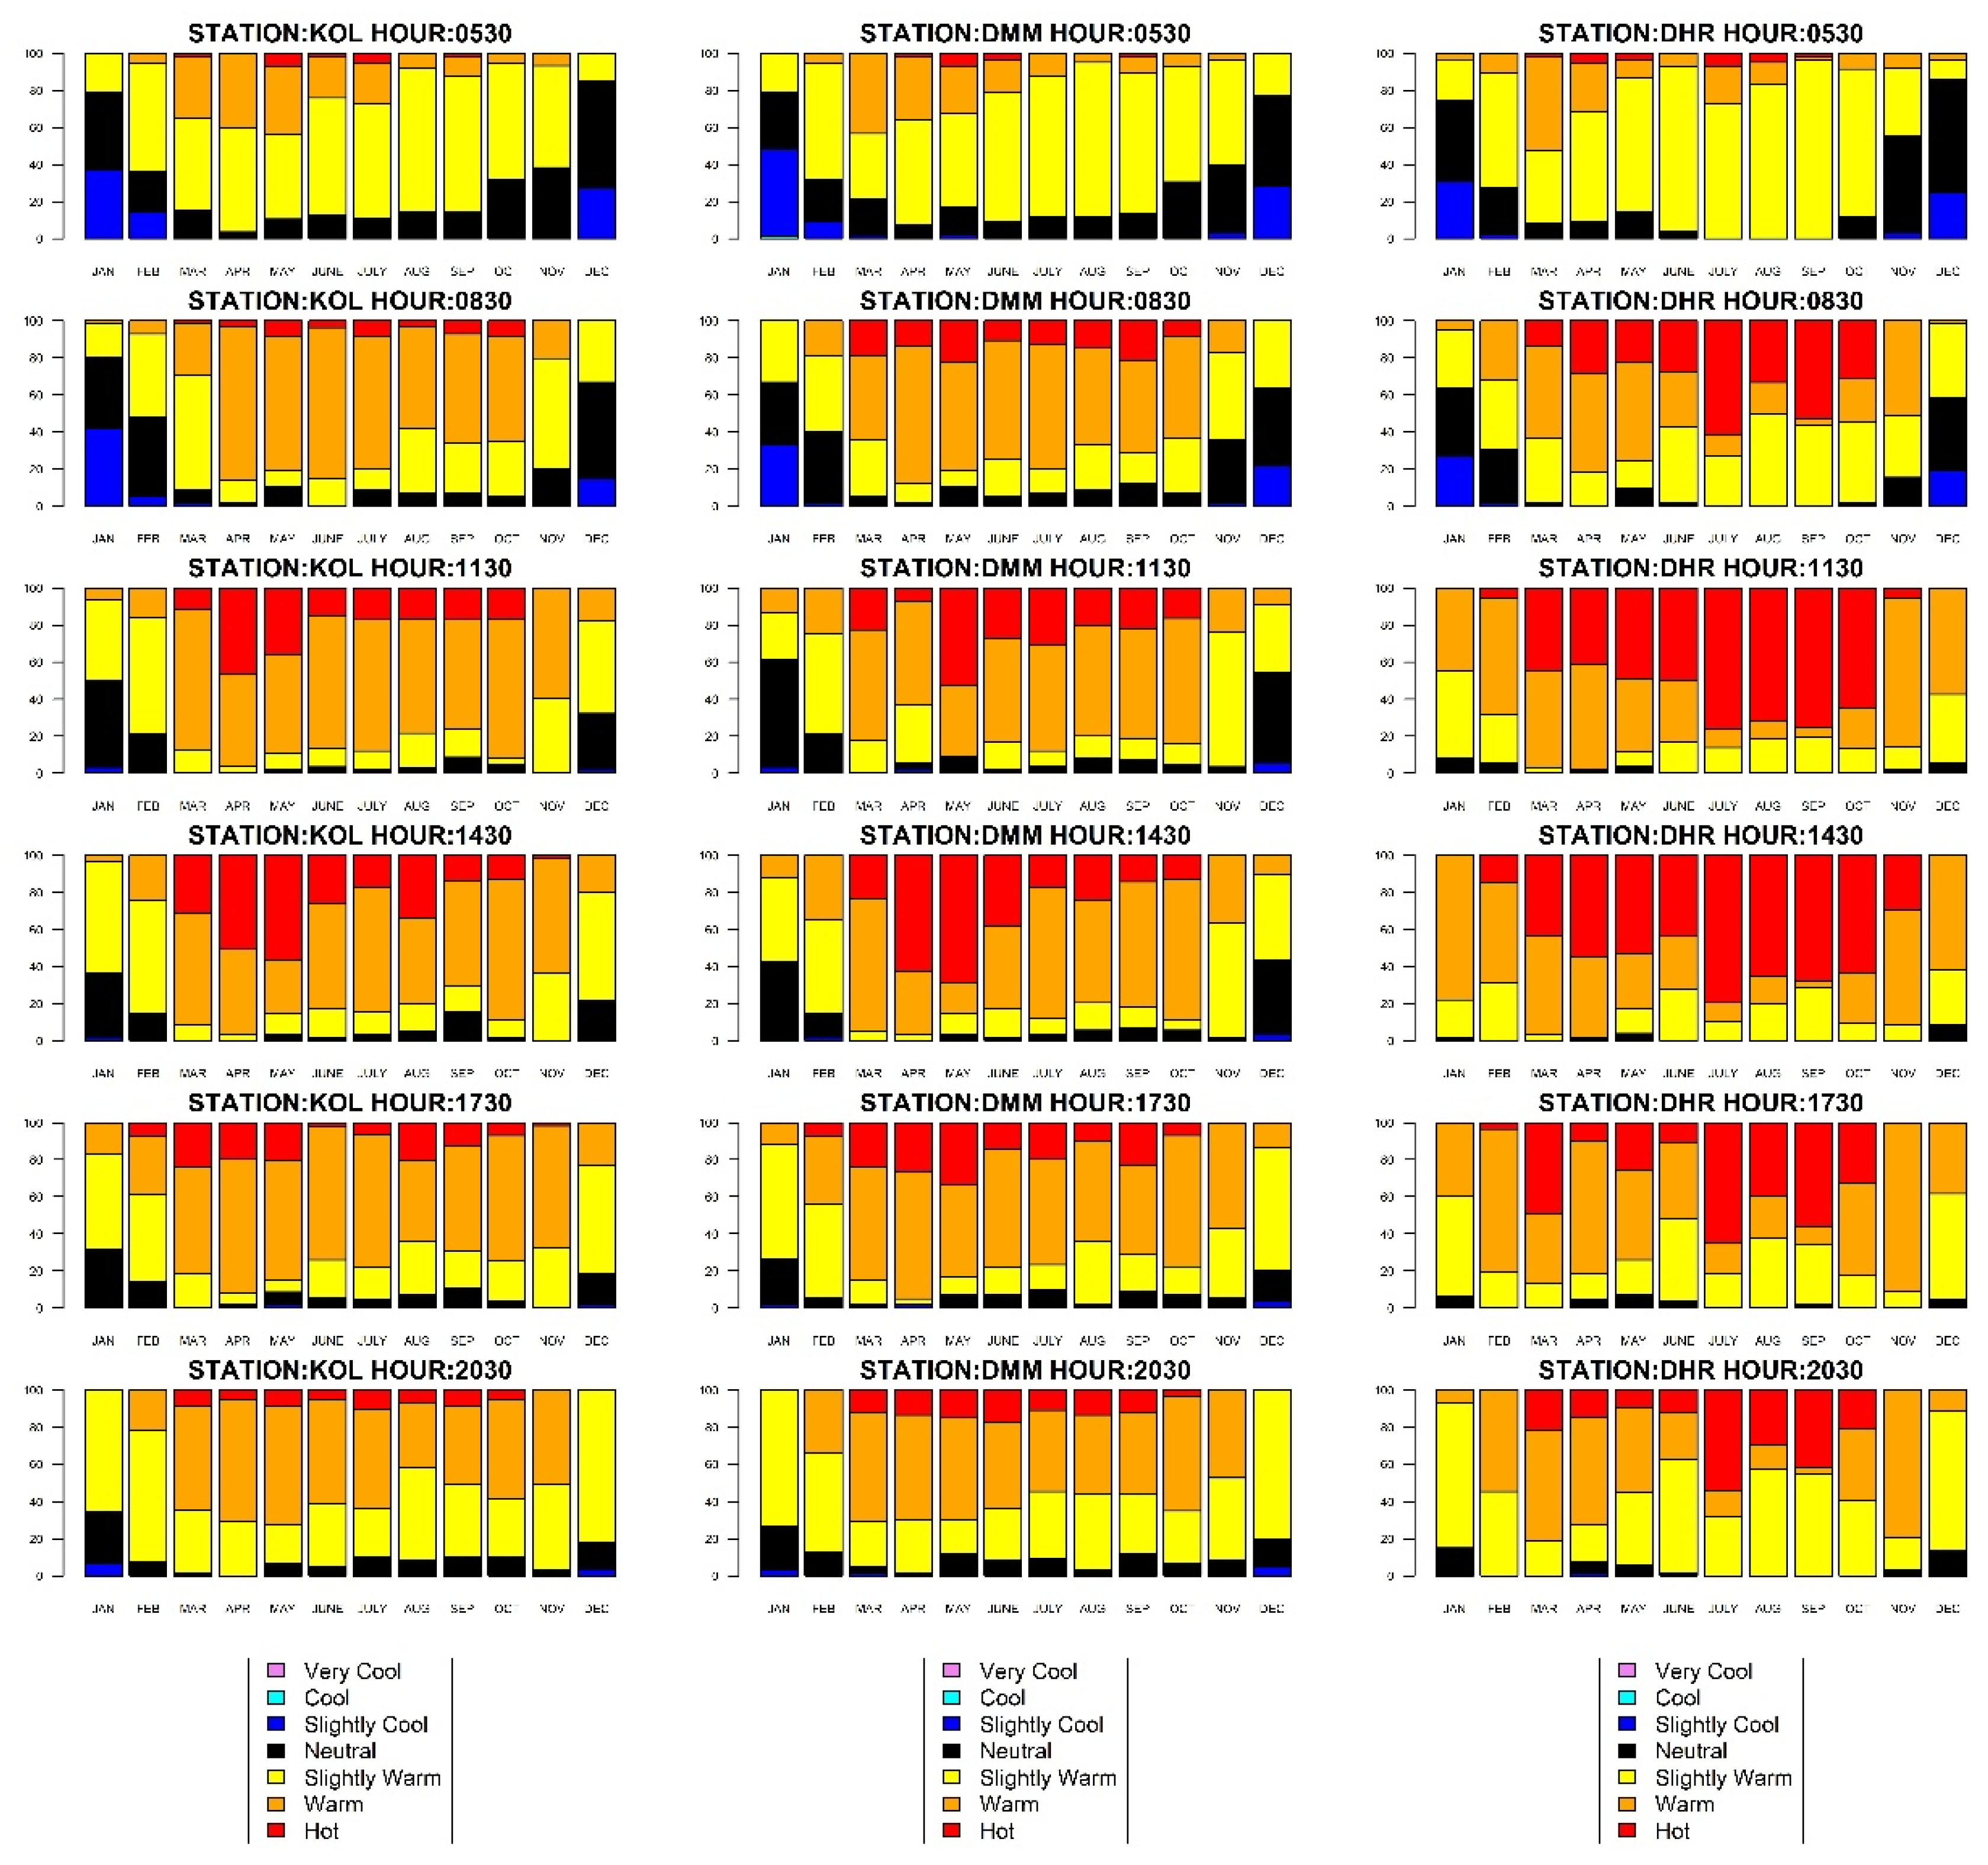
The bioclimate diagram of PET for Alipore (Kolkata), Dum Dum, and Diamond Harbour during the period (2020–2021) at 3 h intervals starting from 05:30 h (IST) till 20:30 h (IST) extracted from the IMD respectively based on
Table 1 and is presented in
Figure 1. Throughout the observations, PET values suggest that none of the stations experience cool or very cool thermal stresses. Monthly thermal classes of PET vary from slightly cool stress (more than 11.4 °C) to hot stress (more than 43.8 °C) for all three stations. At 14:30 h, a significant percentage of hot stress conditions is observed for Kolkata and Dum Dum from April to May, with a relatively low percentage of hot stress conditions in Diamond Harbour during these months. Out of all the considered stations, the largest share of hot stress conditions (more than 80%) is observed in Diamond Harbour from July to October.
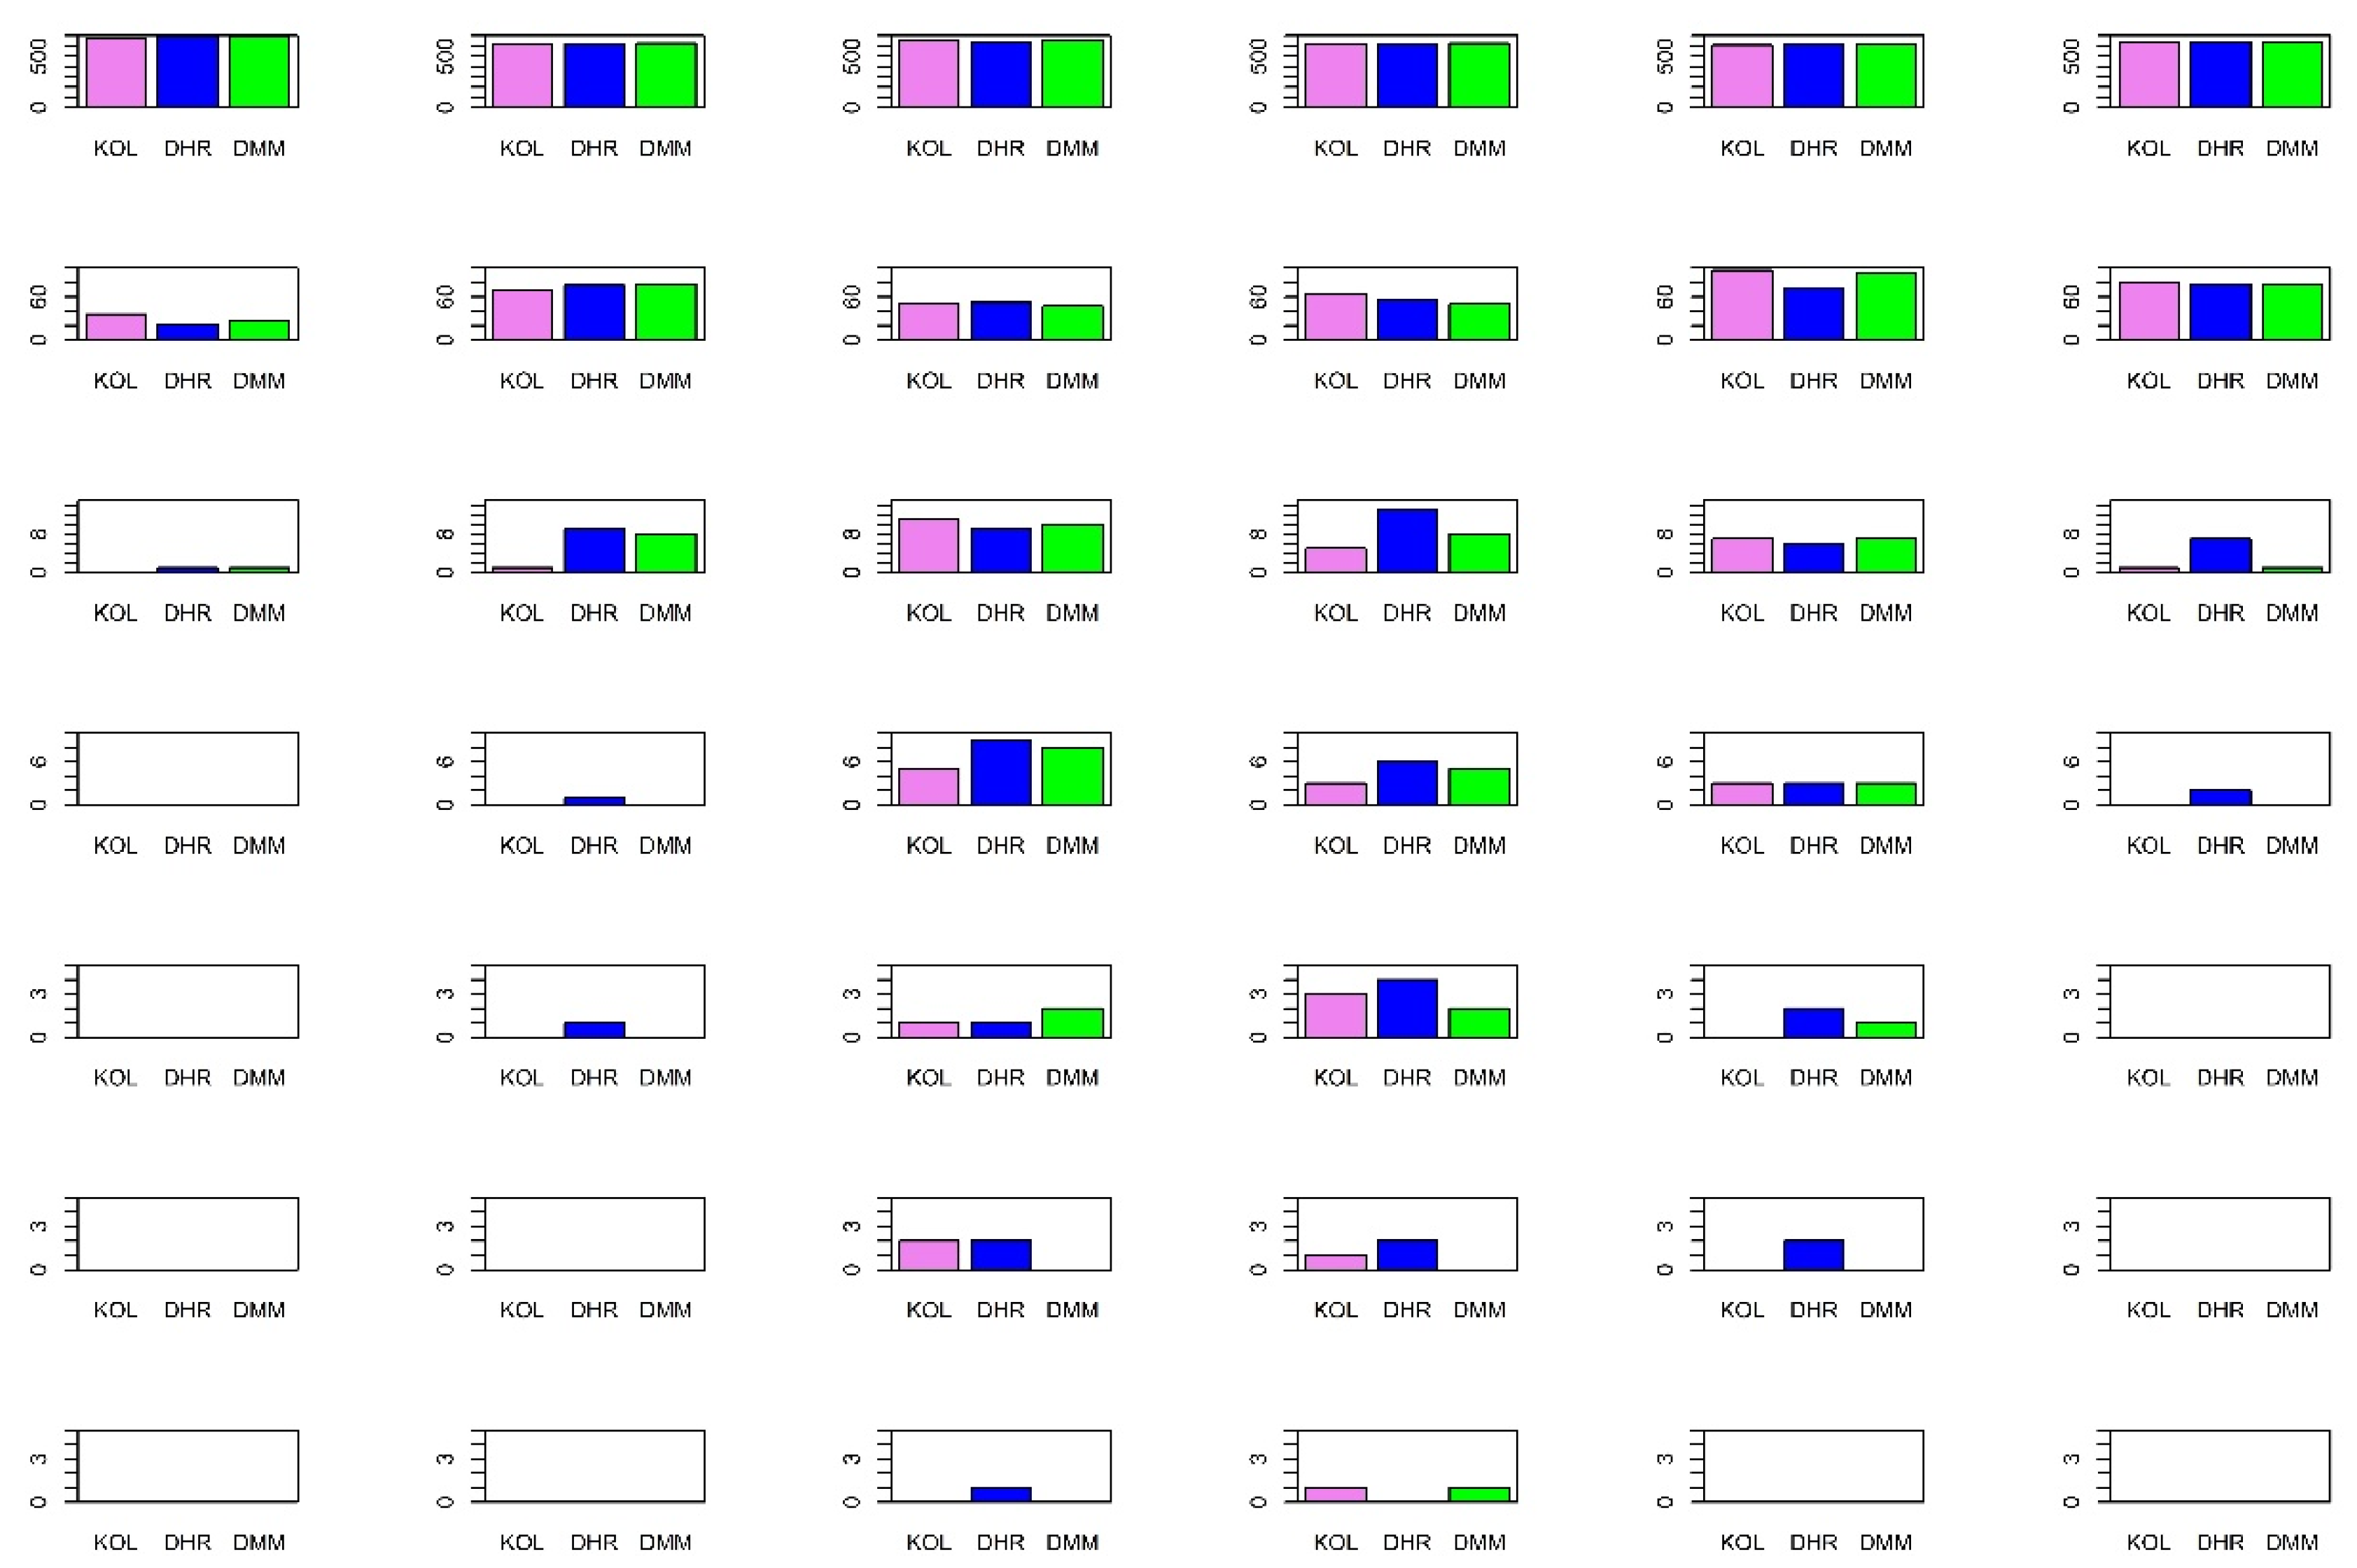
The frequency distribution of PET exceeding 40 °C at different hours of the day, occurring successively for (i) 1–5 days, (ii) 6–10 days, (iii) 11–15 days, (iv) 16–20 days, (v) 21–25 days, and (vi) 26–30 days, is presented in
Figure 2 along with the number of days not exceeding 40 °C. The number distribution of days not exceeding 40 °C remains the same for all the stations. The number of episodes occurring successively for 6–10 days, 11–15 days, 16–20 days, and 21–25 days is highest in Diamond Harbour relative to Kolkata and Dum Dum at 14:30 h. Episodes occurring successively for 26–30 days appear in Kolkata and Dum Dum, whereas no episodes appear in Diamond Harbour.
5. Discussion
Future research should consider data sources that have climate projection of improved resolution over the study sites. Furthermore, hourly data for each day are essential to express the diurnal variation of health-related thermal conditions. Future intense heat episodes that critically influence human health might occur often and more acutely in these sites. With respect to these expectations, clearly, there is a need to extend this research, taking into account the short-term acclimatization, impact of different age groups, living status of individuals, indoor environments, and building design and materials they are made of. These criteria will assist in future assessment and improvement to reduce thermal stress. At present, a major part of this region is experiencing a rapid urbanization process; therefore, environment planning at the small-scale level of towns should be upgraded to reduce the significant benefaction of extreme human bioclimate conditions. The potential steps could be the use of cool roofing, green terrace, paving materials, planting trees and vegetables, more water bodies in open spaces, etc.
Author Contributions
S.B. as the corresponding author, pursued the idea and analyzed all datasets, results, and prepared the draft; A.B. was involved and helped in interpreting and improving both results and the manuscript. All authors have read and agreed to the published version of the manuscript.
Funding
This research received no external funding.
Institutional Review Board Statement
Not Applicable.
Informed Consent Statement
Not Applicable.
Data Availability Statement
The codes and visualizations required for the study were made in R software. The data and code are available from the corresponding author upon reasonable request.
Acknowledgments
Meteorological datasets used in this study can all be obtained from publicly accessible archives.
Conflicts of Interest
The author declares no conflict of interest.
References
- Solomon, S.; Qin, D.; Manning, M.; Marquis, M.; Averyt, K.; Tignor, M.M.B.; Miller, H.L., Jr. Climate Change 2007: The Physical Science Basis; Contribution of Working Group I to the Fourth Assessment Report of the Intergovernmental Panel on Climate Change; Cambridge University Press: Cambridge, UK, 2007; pp. 1–996. [Google Scholar]
- Flato, G.; Marotzke, J.; Abiodun, B.; Braconnot, P.; Chou, S.C.; Collins, W.; Cox, P.; Driouech, F.; Emori, S.; Eyring, V. Evaluation of climate models. In Climate Change 2013: The Physical Science Basis; Contribution of Working Group I to the Fifth Assessment Report of the Intergovernmental Panel on Climate Change; Cambridge University Press: Cambridge, UK, 2014; pp. 741–866. [Google Scholar]
- Das, B.; Chakraborty, R. Climate Change Scenario Of West Bengal, India: A Geo-Environmental Assessment. Indian Cartogr. 2016, 36, 425–441. [Google Scholar]
- Matzarakis, A.; Mayer, H.; Iziomon, M.G. Applications of a universal thermal index: Physiological equivalent temperature. Int. J. Biometeorol. 1999, 43, 76–84. [Google Scholar] [CrossRef] [PubMed]
- Staiger, H.; Laschewski, G.; Grätz, A. The perceived temperature–a versatile index for the assessment of the human thermal environment. Part A: Scientific basics. Int. J. Biometeorol. 2012, 56, 165–176. [Google Scholar] [CrossRef] [PubMed]
- Banerjee, S.; Middel, A.; Chattopadhyay, S. Outdoor thermal comfort in various microentrepreneurial settings in hot humid tropical Kolkata: Human biometeorological assessment of objective and subjective parameters. Sci. Total Environ. 2020, 721, 137741. [Google Scholar] [CrossRef] [PubMed]
| Publisher’s Note: MDPI stays neutral with regard to jurisdictional claims in published maps and institutional affiliations. |
© 2022 by the authors. Licensee MDPI, Basel, Switzerland. This article is an open access article distributed under the terms and conditions of the Creative Commons Attribution (CC BY) license (https://creativecommons.org/licenses/by/4.0/).


