Proceeding Paper

Comparison of Selyaninov’s Hydrothermal Coefficient (Aridity Criterion) over Buryatia, Russia, in the Summer Period from 1979 to 2019 according to Meteorological Stations and ECMWF ERA5 †

1
Institute of Solar-Terrestrial Physics of SB RAS, Irkutsk 664033, Russia
2
Faculty of Geography, Irkutsk State University, Irkutsk 664033, Russia
*
Author to whom correspondence should be addressed.
Presented at the 5th International Electronic Conference on Atmospheric Sciences, 16–31 July 2022; Available online: https://ecas2022.sciforum.net/.
Environ. Sci. Proc. 2022, 19(1), 55; https://doi.org/10.3390/ecas2022-12805
Published: 14 July 2022
(This article belongs to the Proceedings of The 5th International Electronic Conference on Atmospheric Sciences)

Abstract

:
We studied moisture content/aridity conditions in Buryatia (Russia) in summertime for the period of 1979–2019. Selyaninov’s hydrothermal coefficient (HTC) was used as the aridity criterion. The HTC was calculated on the basis of precipitation and 2 m temperature data from two datasets: meteorological stations and the ECMWF ERA5 project. A comparison of the HTC calculations for these two datasets was performed. The ERA5 data showed underestimated HTC values compared to the observations. The inconsistencies found are mainly related to the underestimation of precipitation in the ERA5 project compared to the observational data. The air temperature obtained from the two datasets agrees well for most stations, both in value and in long-term dynamics. It has been shown that at the stations in central and southern Buryatia, the increase in aridity (and decreased HTC) in 1979–2019 is mainly due to the increase in air temperature.

1. Introduction

The Republic of Buryatia is located in the center of the Asian continent, in the southern part of Eastern Siberia and to the south and east of Lake Baikal. The relief of Buryatia is predominantly composed of mountains covered with forests, and there is a small number of plains.
Most of Lake Baikal (60% of the coastline), the deepest freshwater lake in the world, is located in Buryatia. A large part of the Selenga River basin, the largest tributary of Baikal, which provides about 50% of the inflow into the lake [1,2], (https://navostok.info/reg11.php, accessed on 1 May 2022) is located in South Buryatia. Thus, fluctuations in the water content of Lake Baikal are largely due to fluctuations in the discharge of the Selenga River, whose main supply is summer precipitation [1,2].
A third of the territory of Buryatia is occupied by agricultural land (used for wheat, rye, oats, buckwheat, corn, rapeseed, potatoes, and other vegetables). Cattle breeding is also well-developed in the area (https://navostok.info/reg11.php, accessed on 1 May 2022).
Almost 83% of Buryatia is occupied by forests. More than half of the forests (63%) suitable for exploitation are located near Lake Baikal. The forests of Buryatia are classified as forests posing a high fire risk (https://spravochnick.ru/ekonomika/lesnoe_hozyaystvo_kak_otrasl_ekonomiki/lesnoe_hozyaystvo_buryatii, accessed on 5 May 2022). Careless handling of fire and dry thunderstorms in summer are the main causes of forest fires [3].
Buryatia has a long duration of sunshine (1900–2200 h per year) (http://trasa.ru/region/buriatiya_clim.html, accessed on 5 May 2022) and a high frequency of clear skies [4]. In the 1960s, this feature made this region attractive for the placement of large optical observatories aimed at solving scientific problems, such as studies of the Sun and near and far space (http://en.iszf.irk.ru/Main_Page, accessed on 20 April 2022).
Thus, the level of Lake Baikal, crop yield, livestock numbers, the degree of fire hazard for forests, the transparency of the atmosphere, and the conditions of optical observations depend on the degree of moisture content/aridity in Buryatia in summertime. Therefore, the study and explanation of the long-term dynamics of moisture content/aridity over this territory in summer is an important task. In this paper, we solve this problem using a simple parameter—the hydrothermal coefficient (HTC) proposed by Selyaninov G.T. [5]. We are interested in the prospects of applying this specific agrometeorological index to solve the wide range of problems described above. We are also interested in the possibility of using grid data, particularly ECMWF ERA5 data, in our research. We compared the results of the HTC calculations determined using ERA5 data and observations. The comparison results are presented below.

2. Method and Data

We selected 10 meteorological stations in Buryatia whose data are freely available (meteo.ru): Taksimo and Bagdarin (north and northeast); Barguzin, Romanovka, and Sosnovo-Ozerskoye (center); Ulan-Ude, Ivolginsk, and Babushkin (south); and Tunka and Orlik (southwest and west) (Figure 1). We calculated Selyaninov’s hydrothermal coefficient (HTC) at each station for each of the three summer months according to the following formula:
HTC = SumP05/(SumT05/10)
where SumP05 is precipitation for the period with an air temperature above +5 °C, and SumT05 is the sum of the daily temperatures for the same period (http://www.agroatlas.ru/ru/content/Climatic_maps/GTK/GTK/index.html, accessed on 1 May 2022).
According to this formula, the lower the HTC, the drier the conditions.
In agrometeorological practice, to identify droughts and their intensity, periods with daily air temperatures above +10 °C are taken for HTC calculation. We used the less stringent +5 °C condition. As mentioned, we first considered the possibility of broader HTC application, not only in agriculture. Secondly, in general (not applicable to agricultural crops), the growing season begins when the daily air temperature passes +5 °C [6].
We used the following data:
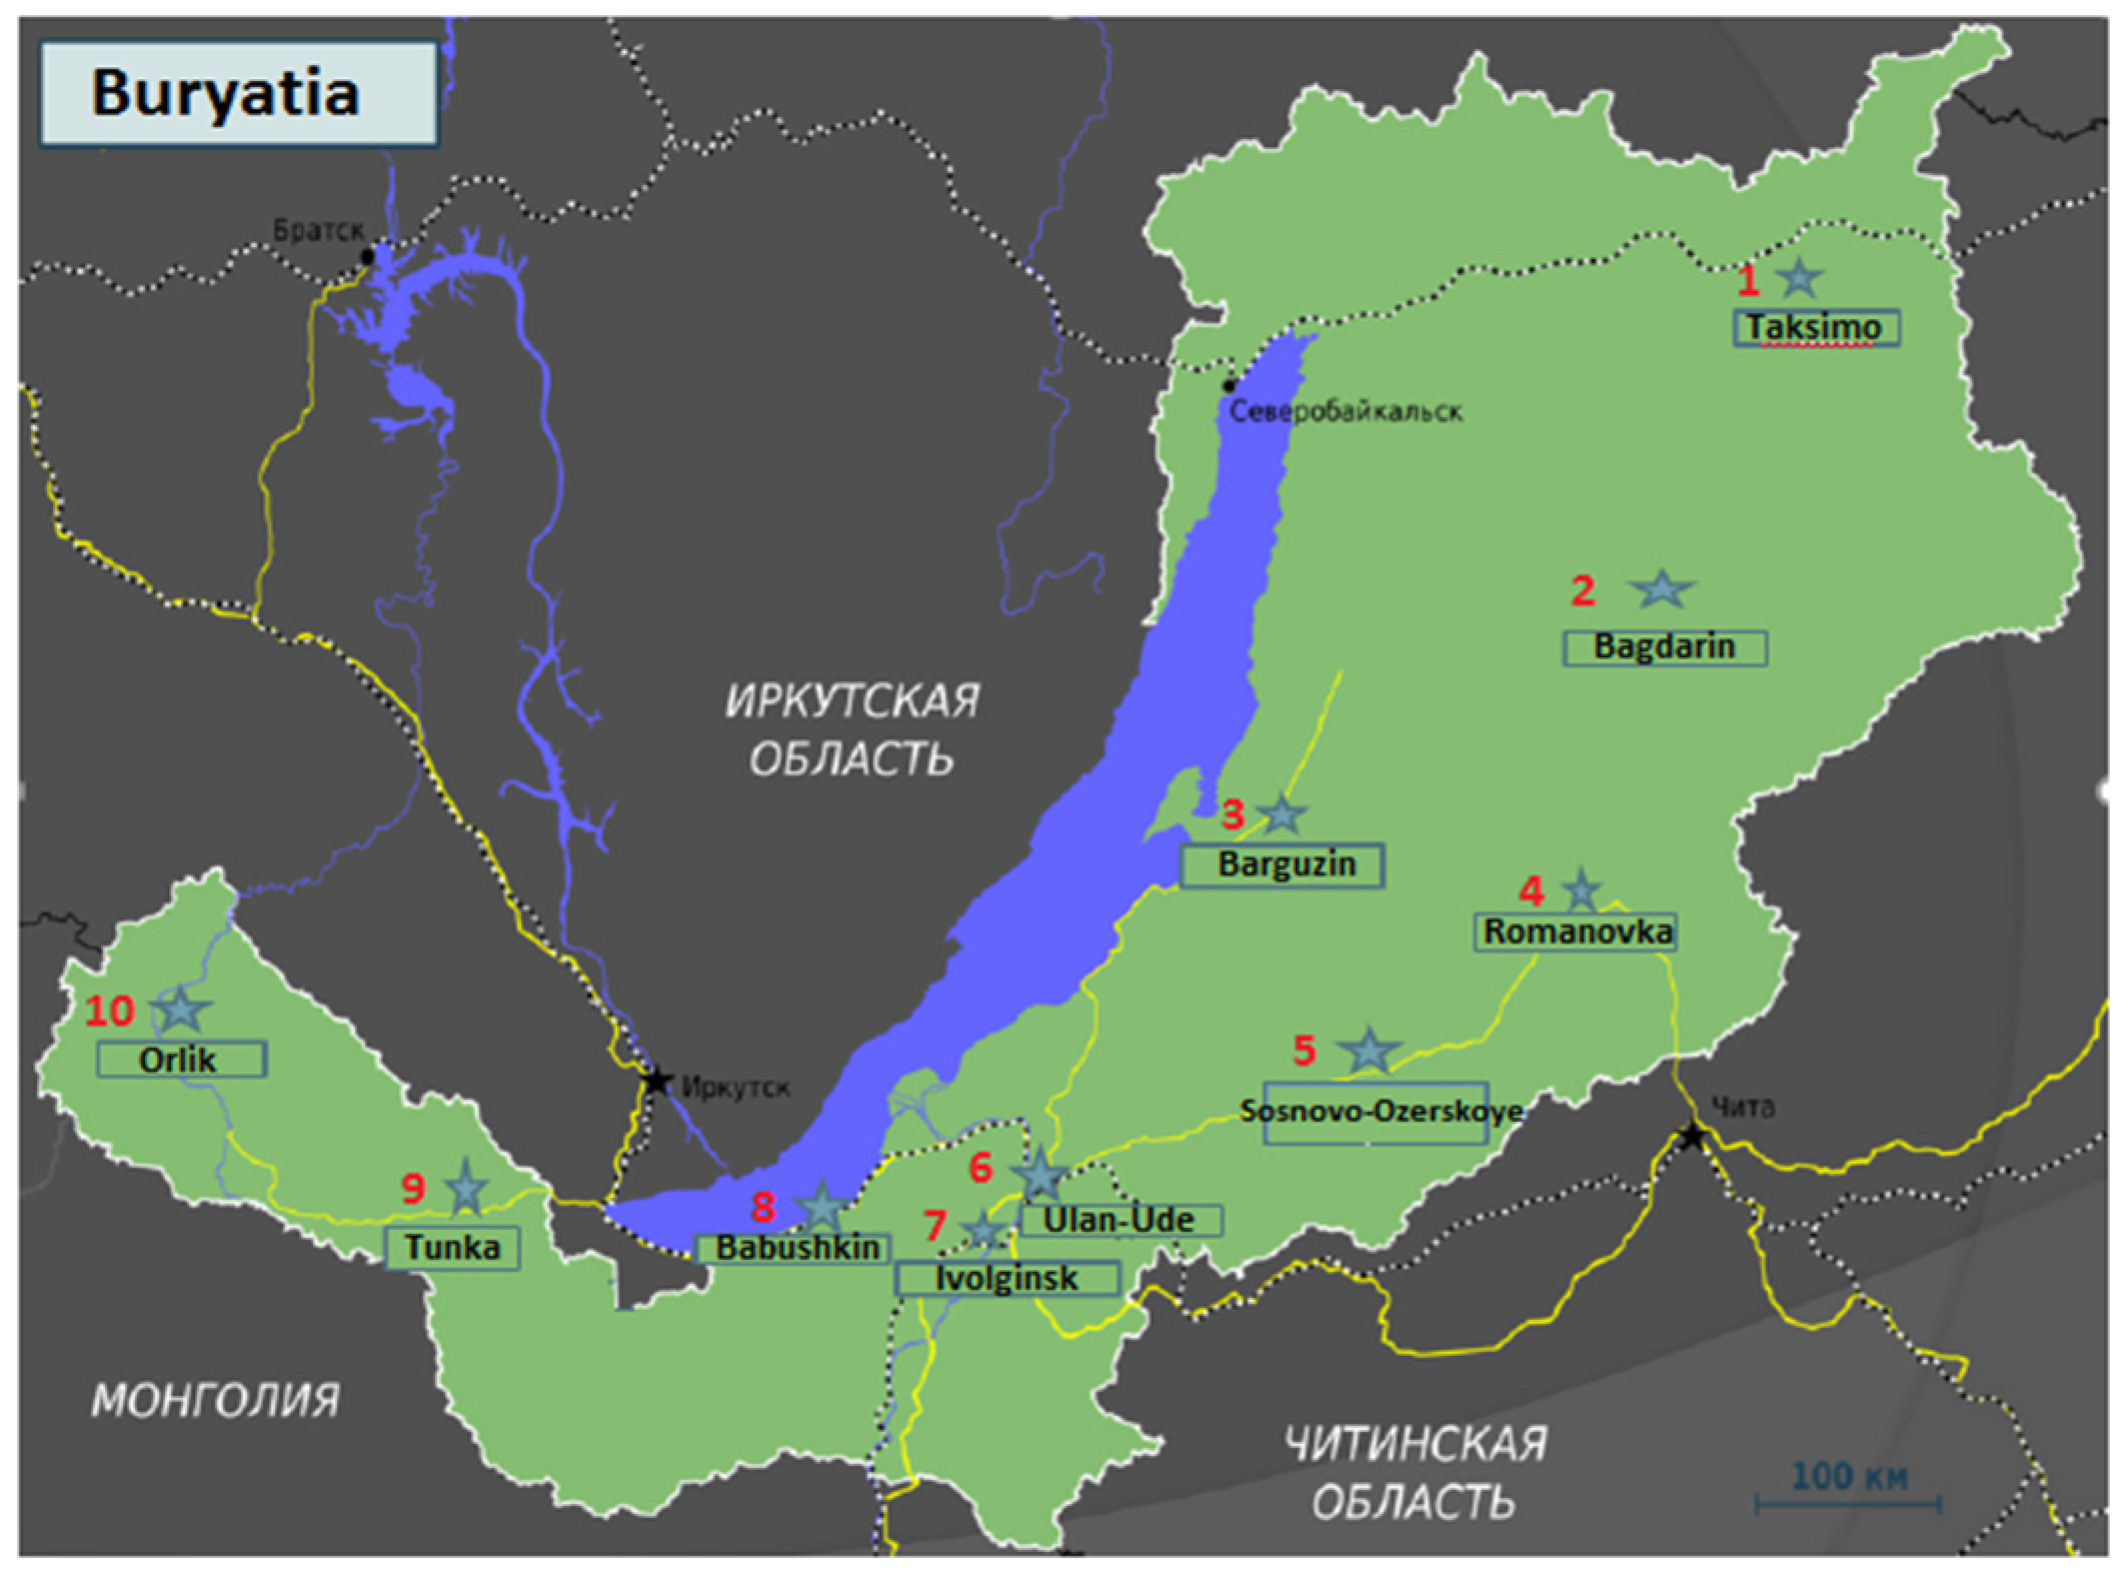
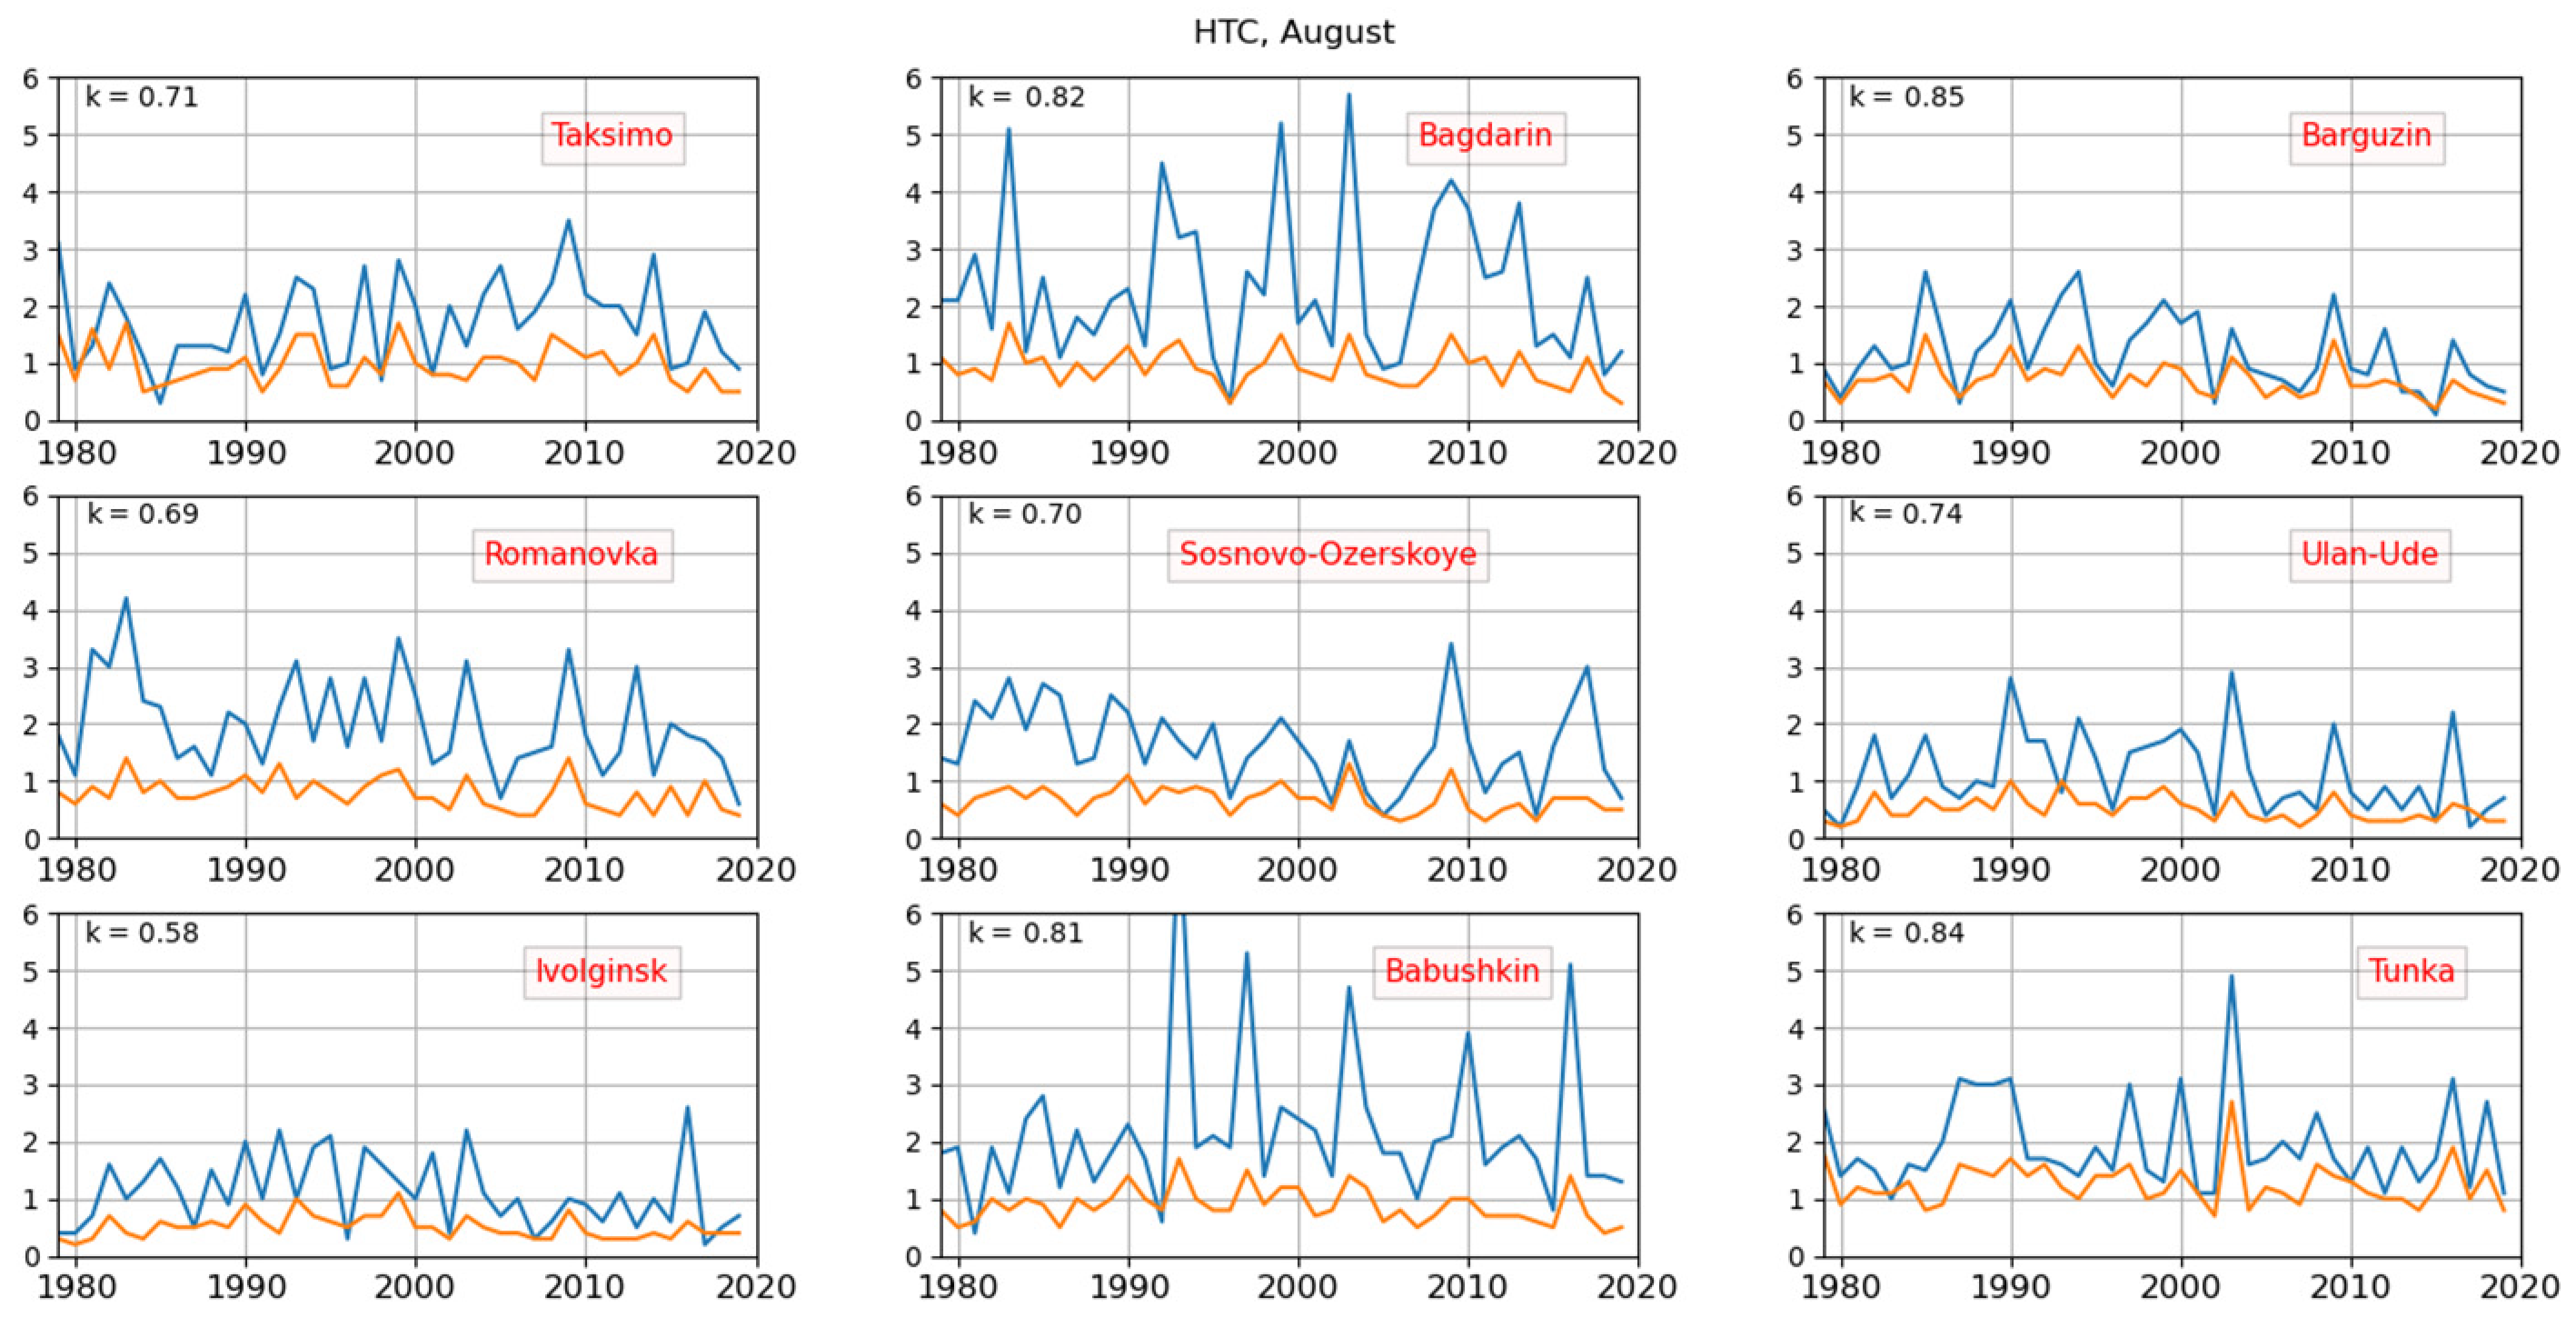
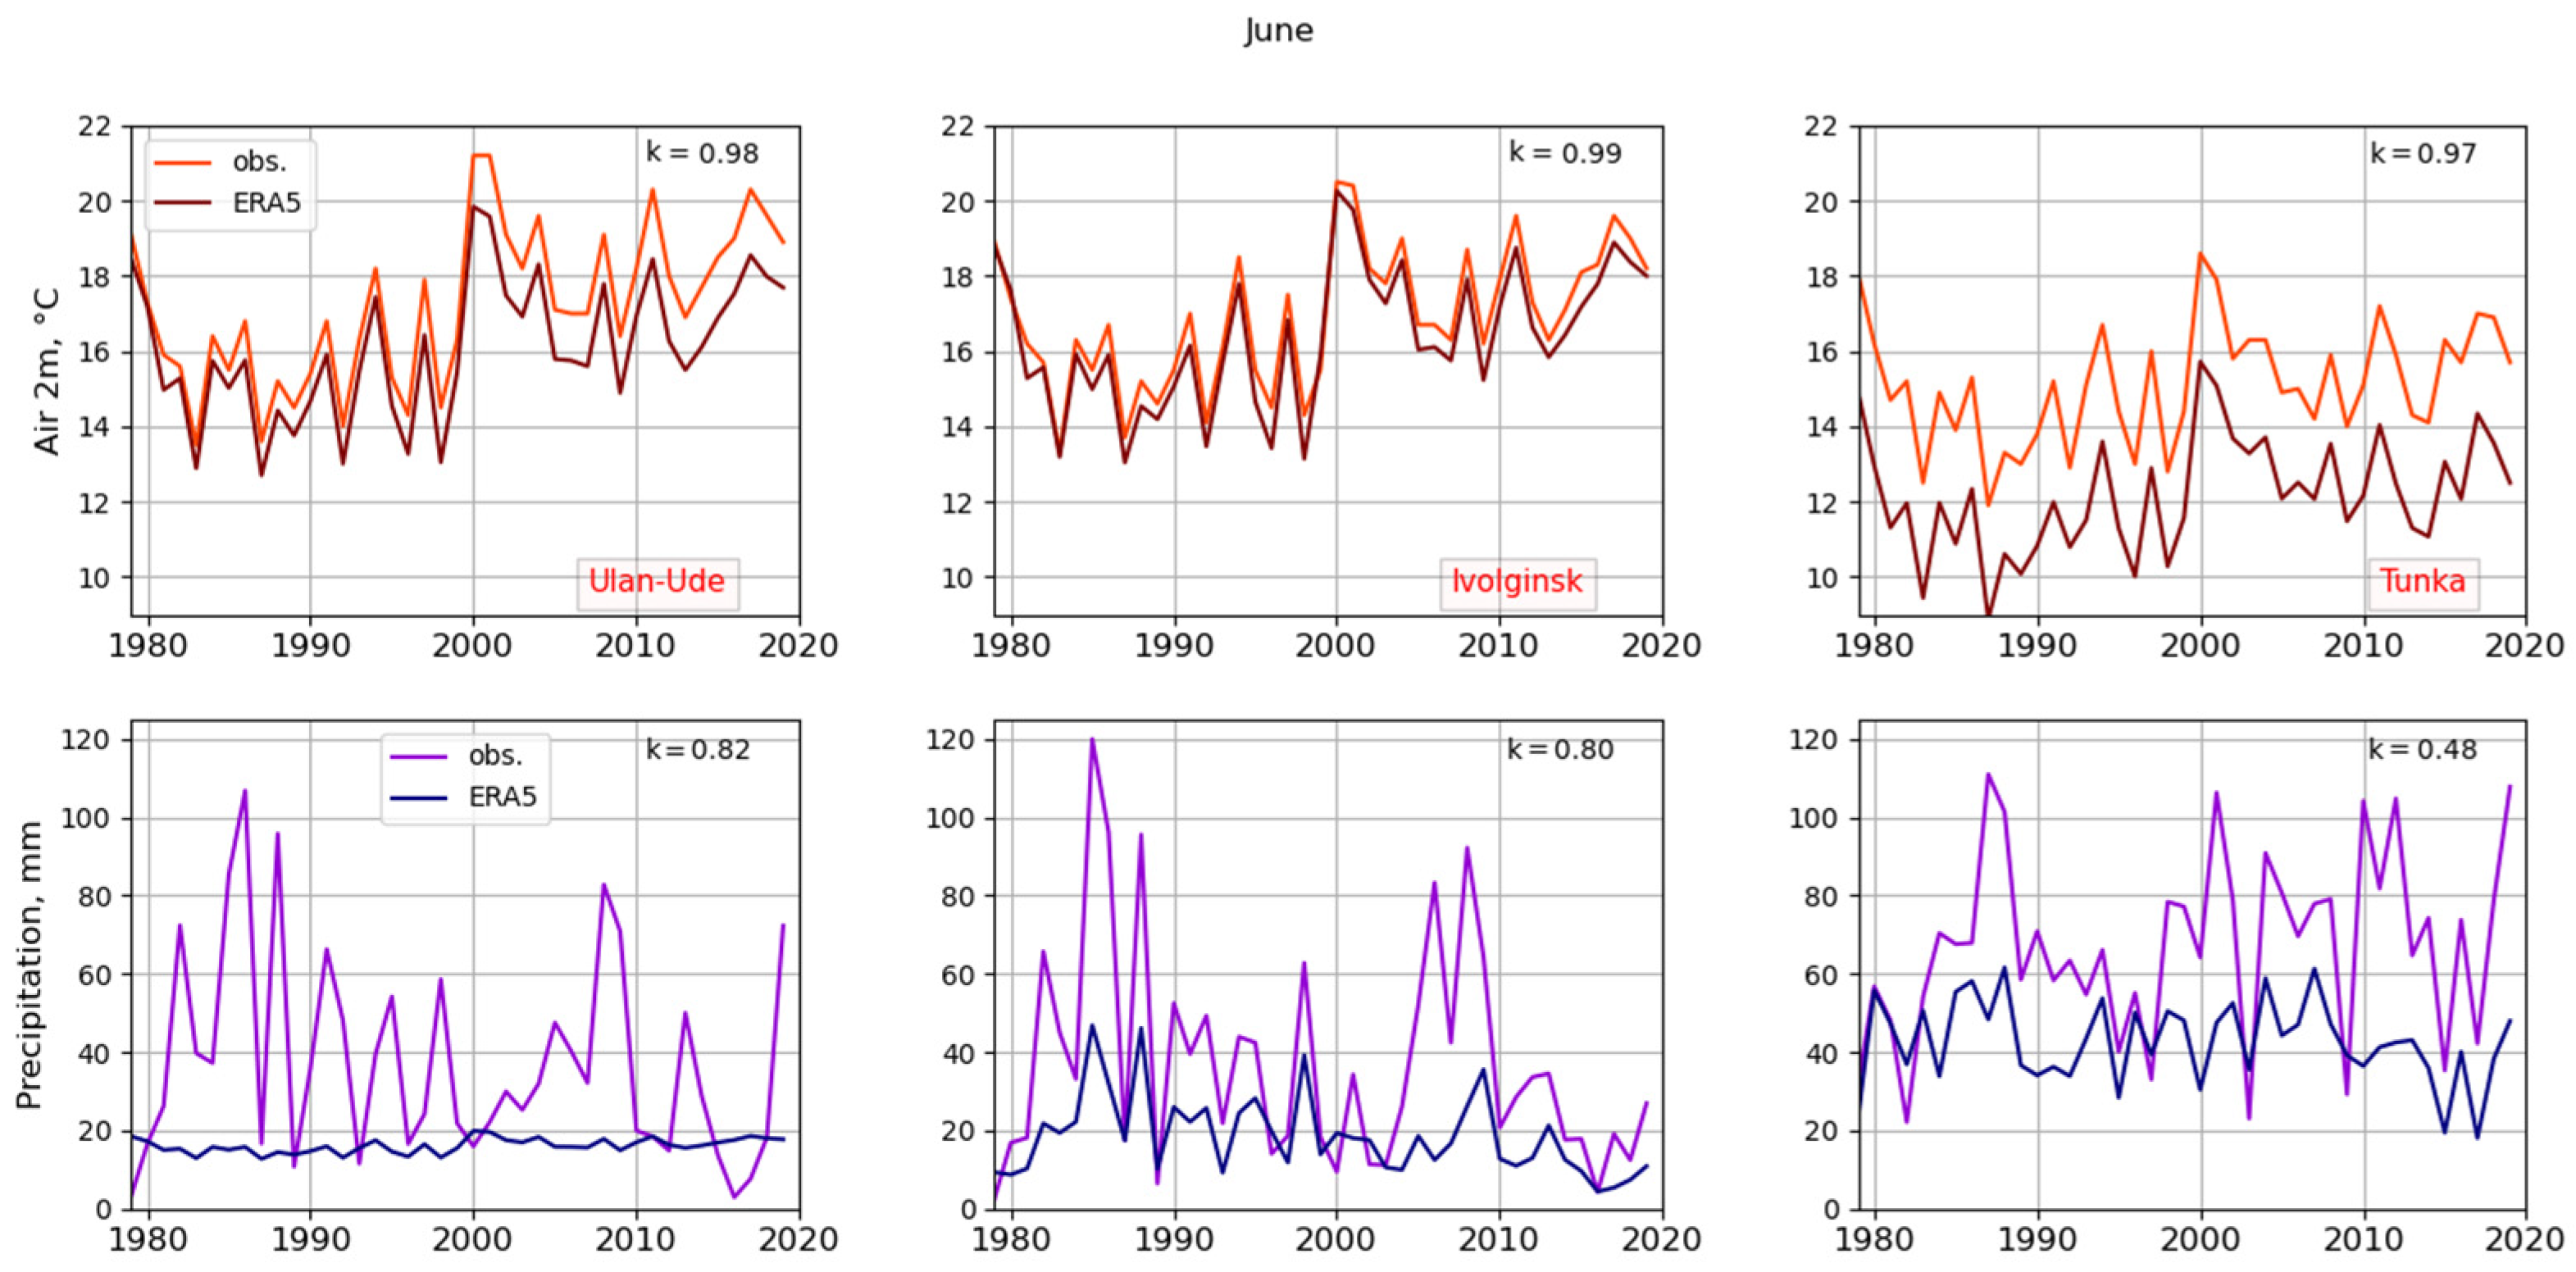
  • Daily 2 m air temperature and precipitation data from 1979 to 2019 for the three summer months (June, July, and August) from 10 meteorological stations: Taksimo and Bagdarin (north and northeast part of Buryatia); Barguzin, Romanovka, and Sosnovo-Ozerskoye (central part); Ulan-Ude, Ivolginsk, and Babushkin (south); and Tunka and Orlik (southwest and west) [meteo.ru] (Figure 1).
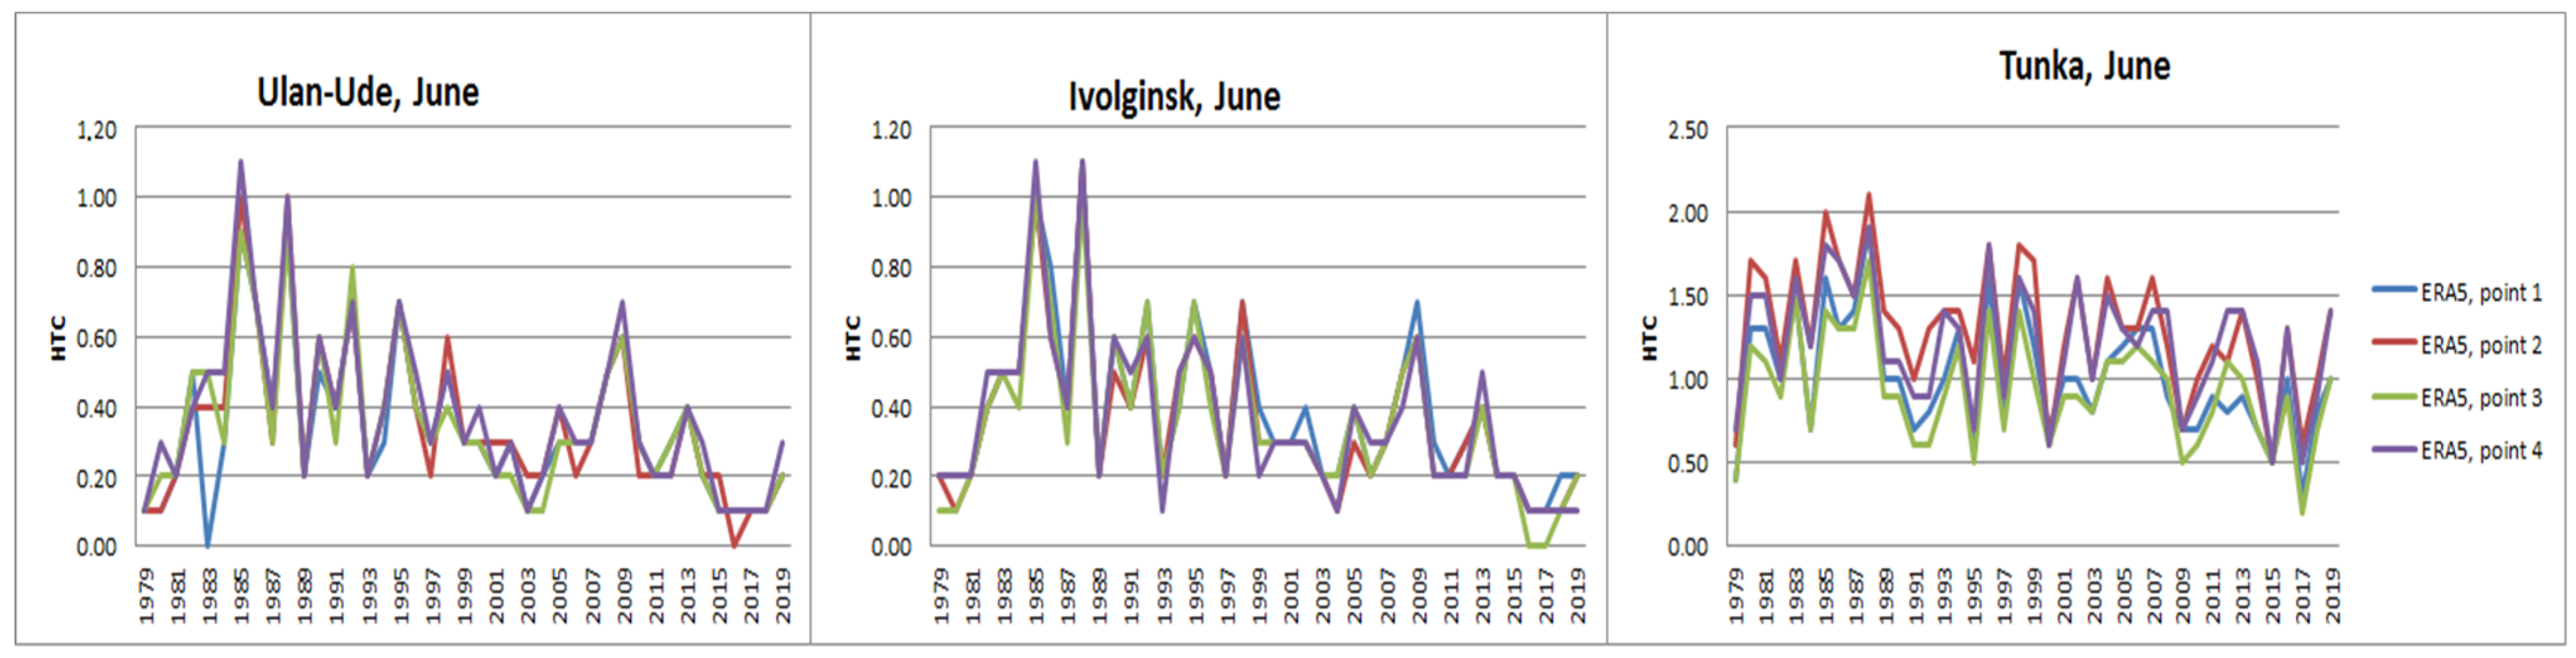
  • The 3 h 2 m air temperature and precipitation grid data from 1979 to 2019 for the three summer months (June, July, and August) from the ECMWF ERA5 project [7]. Based on these data, we calculated the daily temperature and precipitation.
Then, we calculated the sums of the precipitation and daily temperatures for each summer month for every station and for ERA5.
In order to compare the HTCs from the observations and from ERA5, we selected the four ERA5 grid points nearest to the meteorological station and averaged the data over these four points. This procedure was performed for each selected station. Of course, this is not entirely correct. It is necessary to interpolate the ERA5 data into points with the station coordinates. However, we compared the HTCs in each of the four grid points with each other and considered the similarity to be good. Figure 2 shows the HTCs calculated from the ERA5 data in the four grid points nearest to the Ulan-Ude (left), Ivolginsk (center), and Tunka (right) stations. We decided to use simple averaging.

3. Results

Figure 3, Figure 4 and Figure 5 show the HTCs for both datasets in June, July, and August, respectively. At most stations in June and at the Orlik station (Eastern Sayan Mountains) in August, the air temperature was below +5 °C for several days of the month in some years. Thus, it was not possible to correctly calculate the HTCs for these months during those years. In this paper, we only show the results for those stations where it was possible to calculate HTC for the entire period of 1979–2019. As such, calculations were carried out for 3 stations in June (south and west of Buryatia): Ulan-Ude, Ivolginsk, and Tunka (Figure 3); for all 10 stations in July (Figure 4); and for 9 stations in August (with the exception of Orlik) (Figure 5).
Comparison of observational and ERA5 data: The main feature that draws attention in Figure 3, Figure 4 and Figure 5 is the underestimated HTCs calculated according to the ERA5 data in comparison to the HTCs calculated from the data collected by the meteorological stations. At low HTCs (<1.5) that correspond to arid conditions and droughts, in some cases, there is also an opposite situation—the HTC from ERA5 is higher than the HTC from the station data. This feature is clearly visible in June for the Tunka station in 1980–1983, 1996, 1997, and 2003 (Figure 3).
To find out what the reasons for the differences found in the HTC are, we constructed plots of the monthly mean air temperature and the total monthly precipitation for each station, based on which the HTC was calculated. Figure 6 shows these plots for June. The results for July and August are similar to those shown in Figure 6. The observational and ERA5 air temperatures are in very good agreement, both in terms of values and in long-term dynamics, with the exception of the Tunka (Tunka Valley) and Orlik (mountains, East Sayan) stations. As such, as we see in Figure 6, the main reason for the underestimation of the HTCs calculated using ERA5 data is the strongly underestimated precipitation in the ERA5 project. We noted good agreement between the interannual variability in the precipitation from observations and from the ERA5 data (with the exception of the mountain and valley stations Orlik and Tunka).
Thus, the 2 m air temperature data from the ECMWF ERA5 project can be used to calculate the HTC over Buryatia. Unfortunately, precipitation in the ERA5 project is greatly underestimated, so it cannot be used correctly in calculations. We need to look for other precipitation data.
Climatic variability in HTC, temperature, and precipitation: Figure 3, Figure 4 and Figure 5 show the long-term decrease in the HTC (increased aridity) after 2000: in June at all three stations shown in Figure 3 (south and west of Buryatia); in July at the stations Barguzin, Sosnovo-Ozerskoye, and Ivolginsk (center and south) (Figure 4); and in August at the stations Barguzin, Ulan-Ude, and Ivolginsk (center and south) (Figure 5). Figure 6 shows that the main reason for this is the increase in air temperature. This finding requires more thorough study, such as a quantitative estimation of the trends and their interpretation. Note that the increase in aridity at the stations in the south of Buryatia shown in Figure 3, Figure 4 and Figure 5 is consistent with the information regarding the long-term low-water period (since 1996) in the Selenga River basin in summertime [1,2]. The increase in temperature and the decrease in precipitation in summertime in the territory that includes the south of Buryatia are discussed in papers [1,8,9,10]. Papers [10,11,12] say that the increase in temperature and the decrease in convective precipitation in summer result from the fact that high-pressure areas began to form over Mongolia more often.
We also note that in 2020–2022, there were signs of the long arid period in the Selenga River basin ending, but we think that it is premature to assert this.

4. Conclusions

The present work studies the long-term variability in the hydrothermal coefficient (HTC) proposed by Selyaninov G.T. (dryness/humidity criterion) according to observations and ECMWF ERA5 data on the 2 m temperature and precipitation inside the Republic of Buryatia, Russia, in summertime. The HTCs calculated from these two datasets were compared in order to study the potential of using ERA5 grid data for research in Buryatia. It was found that in the ERA5 project, precipitation is underestimated, and therefore, its use in HTC calculations is not possible. Air temperature information from the two datasets agrees well for most stations both in value and in long-term dynamics. It is shown that at the stations in central and southern Buryatia, the increase in aridity from 2000 to 2019 is mainly due to the increase in air temperature.

Author Contributions

Conceptualization, M.C., E.D. and E.K.; methodology, E.K. and E.D.; investigation, E.D., E.K. and M.C.; writing—original draft preparation, E.D.; writing—review and editing, E.K.; visualization, E.D. All authors have read and agreed to the published version of the manuscript.

Funding

This study was financially supported by the Ministry of Science and Higher Education of the Russian Federation (subsidy no. 075-GZ/C3569/278) and through grant No. 075-15-2020-787 for the implementation of major scientific projects on priority areas of scientific and technological development (under the project “Fundamentals, methods and technologies for digital monitoring and forecasting of the environmental situation on the Baikal natural territory”).

Institutional Review Board Statement

Not applicable.

Informed Consent Statement

Not applicable.

Data Availability Statement

Not applicable.

Conflicts of Interest

The authors declare no conflict of interest.

References

  1. Berezhnykh, T.V.; Marchenko, O.Y.; Abasov, N.V.; Mordvinov, V.I. Changes in the summertime atmospheric circulation over East Asia and formation of long-lasting low-water periods within the Selenga river basin. Geogr. Nat. Resour. 2012, 33, 223–229. [Google Scholar] [CrossRef]
  2. Frolova, N.L.; Belyakova, P.A.; Grigoriev, V.Y.; Sazonov, A.A.; Zotov, L.V.; Jarsjö, J. Runoff Fluctuations in the Selenga River Basin. Reg. Environ. Chang. 2017, 17, 1965–1976. [Google Scholar] [CrossRef]
  3. Andreev, D.V. Environmental consequences of fires. IOP Conf. Ser. Earth Environ. Sci. 2022, 981, 032094. [Google Scholar] [CrossRef]
  4. Darchia, S.P. On the Astronomical Climate of the USSR; Nauka: Moscow, Russia, 1985; 175p. (In Russian) [Google Scholar]
  5. Selyaninov, G.T. Metody Selskokhozyaistvennoi Kharakteristiki Klimata (Methods of Agricultural Characteristic of Climate); Mirovoi Agroklimaticheskii Spravochnik (World Agroclimatic Reference Book L); Gidrometeoizdat: Leningrad, Russia, 1937; pp. 5–27. (In Russian) [Google Scholar]
  6. Sadokov, V.P.; Kozeltseva, V.F.; Kuznetsova, N.N. Opredeleniye vesennikh dat ustoichivogo perekhoda srednei sutochnoi temperatury vozdukha cherez 0, +5 °C, ikh prognoz i otsenka. (Determining Springtime Dates of the Mean Daily Air Temperature Steady Transition across 0, +5 °C, Their Prediction and Analysis); Hydrometeorological Research Center of the Russian Federation: Moscow, Russia, 2012; pp. 162–172. (In Russian) [Google Scholar]
  7. Hersbach, H.; Bell, B.; Berrisford, P.; Hirahara, S.; Horányi, A.; Muñoz-Sabater, J.; Nicolas, J.; Peubey, C.; Radu, R.; Schepers, D.; et al. The ERA5 Global Reanalysis. QJRMS 2020, 146, 1999–2049. [Google Scholar] [CrossRef]
  8. Batima, P.; Natsagdorj, L.; Gombluudev, P.; Erdenetsetse, B. Observed Climate Change in Mongolia—Assessments of Impacts and Adaptations to Climate Change (AIACC). Working Paper. 2005, Volume 26. Available online: http://www.aiaccproject.org/working_papers/Working%20Papers/AIACC_WP_No013.pdf (accessed on 5 May 2022).
  9. Obyazov, V.A. Regionalny otklik prizemnoi temperatury vozdukha na globalnyie izmeneniya (na primere Zabaikalya). (Near-surface air temperature regional response to global changes (using the example of Zabaikalye). DAN (Rep. Russ. Acad. Sci.) 2015, 461, 459–462. (In Russian) [Google Scholar]
  10. Schubert, S.D.; Wang, H.; Koster, R.D.; Suarez, M.J.; Groisman, P.Y. Northern Eurasian Heat Waves and Droughts. J. Clim. 2014, 27, 3169–3207. [Google Scholar] [CrossRef]
  11. Antokhina, O.Y.; Antokhin, P.N.; Kochetkova, O.S.; Mordvinov, V.I. Letnyaya tsirkulyatsiya atmospfery Severnogo polushariya v periody silnogo i slabogo mussona Vostochnoi Azii. (Summer circulation of the Northern Hemisphere atmosphere during periods of strong and weak East Asian monsoon. Optika Atmospery Okeana (Atmos. Ocean. Opt.) 2015, 28, 52–58. (In Russian) [Google Scholar]
  12. Zhu, C.; Wang, B.; Qian, W.; Zhang, B. Recent weakening of northern East Asian summer monsoon: A possible response to global warming. Geophys. Res. Lett. 2012, 39, 9701. [Google Scholar] [CrossRef]
Figure 1. Meteorological stations in Buryatia whose data were used: 1—Taksimo, 2—Bagdarin, 3—Barguzin, 4—Romanovka, 5—Sosnovo-Ozerskoye, 6—Ulan-Ude, 7—Ivolginsk, 8—Babushkin, 9—Tunka, and 10—Orlik.
Environsciproc 19 00055 g001
Figure 2. HTCs from ERA5 in the four grid points nearest to the Ulan-Ude (left), Ivolginsk (center), and Tunka (right) stations.
Environsciproc 19 00055 g002
Figure 3. HTCs in June. Blue—meteorological stations data; orange—ERA5 data. k is the correlation coefficient. X-axis—years; Y-axis—HTC.
Environsciproc 19 00055 g003
Figure 4. HTCs in July. Blue—meteorological station data; orange—ERA5 data. k is the correlation coefficient. X-axis—years; Y-axis—HTC.
Environsciproc 19 00055 g004
Figure 5. HTCs in August. Blue—meteorological station data; orange—ERA5 data. k is the correlation coefficient. X-axis—years; Y-axis—HTC.
Environsciproc 19 00055 g005
Figure 6. Air temperature (top) and precipitation (bottom) in June at the Ulan-Ude, Ivolginsk, and Tunka stations.
Environsciproc 19 00055 g006
Publisher’s Note: MDPI stays neutral with regard to jurisdictional claims in published maps and institutional affiliations.

