Proceeding Paper

LSTM Model for Wind Speed and Power Generation Nowcasting †

by
Adrián Fuentes-Barrios
,
Maibys Sierra-Lorenzo
* and
Alfredo E. Roque-Rodríguez
Atmospheric Physics Center, Institute of Meteorology, Havana 11700, Cuba
*
Author to whom correspondence should be addressed.
Presented at the 5th International Electronic Conference on Atmospheric Sciences, 16–31 July 2022; Available online: https://ecas2022.sciforum.net/.
Environ. Sci. Proc. 2022, 19(1), 30; https://doi.org/10.3390/ecas2022-12851
Published: 25 July 2022
(This article belongs to the Proceedings of The 5th International Electronic Conference on Atmospheric Sciences)

Abstract

:
In the following work, the design of an LSTM-type neural network model for wind speed and power generation nowcasting, with measurements taken every 10 min and for up to two hours, is presented. For this study, the wind speed measurements were taken every 10 min at different heights above the ground by the measurement tower located in Los Cocos in the province of Holguín (Cuba), where the wind farms Gibara I and II are located. The real data were complemented with the wind speed numerical hourly forecasts from SisPI. The data covered the period between 1 February 2019 and 31 January 2020, that is, one year of measurements. Several LSTM models were built and evaluated, both considering the measurements alone and combining the measurements with the forecasts generated by SisPI. The results suggest that the constructed models perform better than other more traditional statistical models and other neural network models used in the country for similar purposes.

1. Introduction

Non-conventional energy sources have been reaching remarkable development and acceptance in recent decades, and their use has been very beneficial for the environment, reducing the use of fossil fuels that contribute to the greenhouse effect and climate change. Wind energy is one of those unconventional sources, and for Cuba, in particular, it is an alternative source in development. According to [1], the country currently plans to install more than 300 MW by the year 2030. A total of 13 wind farms will provide this energy production [2], and already in 2020, the generation of electricity from wind energy accounted for 6% of electricity in the Cuban electrical system. Given the intermittency and variability of the wind resources, the national electroenergetic system must be prepared to assume the generation of electricity from conventional sources at times when it cannot be generated from wind. The way in which this can be guaranteed is by having wind forecasts at the installation sites of the wind farms. These forecasts are very short-term estimates, ranging from a few minutes to 2 h. Research focusing on very short-term forecasting is mainly based on time-series or artificial intelligence, or the combination of both in hybrid methods. As examples, we may cite the works by [3,4]. Some results using the numerical forecast models, the persistence method, the nearest neighbor method [5], and the wavelet and neural networks, have also been reported [6]. In Cuba, with respect to predictions of wind factors, there are the works of [7,8,9,10], where short-term forecasts of wind speed were generated using the weather research and forecast (WRF) numerical model, statistical models and neural networks. However, only [10] addressed the very short-term prognosis. The weak point of the result mentioned above is that it uses only real data to generate the forecasts. However, there are many situations that threaten the obtaining of observations in real time, such as: electrical interruptions, communication problems, storage problems, among others. Given this instability of the measurements, a forecast method based only on this information would be just as unstable.. The foregoing observations led us to initiate this research, where, in addition to the use of real data, the forecast of the WRF model was used, so that it could be used as an alternative in the event of a measurement failure. The method used was an LSTM-type neural network.

2. Methods and Materials

For the generation of very short-term wind forecasts, one year’s worth of measurements were taken from Torre Los Cocos, located near the Gibara I and II wind farms. The time period lasted from 1 February 2019 and 31 January 2020. In this tower, wind measurements were obtained at heights of 10, 30, 50 and 100 m every 10 min. In this work, only the results using the measurements at 50 m height are shown.
In addition, the numerical forecasts were estimated using the 3km-resolution simulation domain (see Figure 1) offered by the short-range prediction system (SisPI, by the acronym in Spanish) [11,12]. The physical configuration of the WRF used in SisPI can be consulted in [11,12]. Since SisPI offers hourly forecasts, it was necessary to make an interpolation to obtain the wind series produced by the WRF every 10 min in order to make the numerical forecasts compatible with the measurements.
For both data sources, sets of 12 inputs were generated every 10 min to forecast 12 outputs, also taken every 10 min until the 2 h forecast was reached.
Several LSTM-type neural network models were used to generate wind force forecasts for up to 2 h. Figure 2 shows the configuration with best performance using the data from Torre Los Cocos only and its combination with the SisPI numerical forecasts.
For the evaluation, in addition to the validation set, four case studies (11 March 2019, 28 May 2019, 2 August 2019 and 18 November 2019) corresponding to different months of the year were omitted from the training, in which different wind regimes were represented. The mean absolute error (MAE), root mean square error (RMSE), and Pearson’s correlation were used to verify the results.

3. Results and Discussion

Figure 3 shows the mean absolute error obtained when forecasting 12 periods spaced out every 10 min, with the subset of data used for the validation of the LSTM model training. The red curve corresponds to the forecast using only the real data, while the blue curve refers to the combination of the real data with the SisPI forecasts. It is noteworthy that, in both cases, there was a growth in the MAE as the forecast moved away from the initial terms. However, it can be seen that, on average, the ability of the LSTM-type network was very strong, with an MAE of less than 0.8 m/s, being even less than the value of 0.5 m/s for the first six forecast periods. It is striking that the inclusion of the model information offered better results, with the MAE being slightly lower, which is a very good result, considering that, in operational practice, measurements are often lacking.

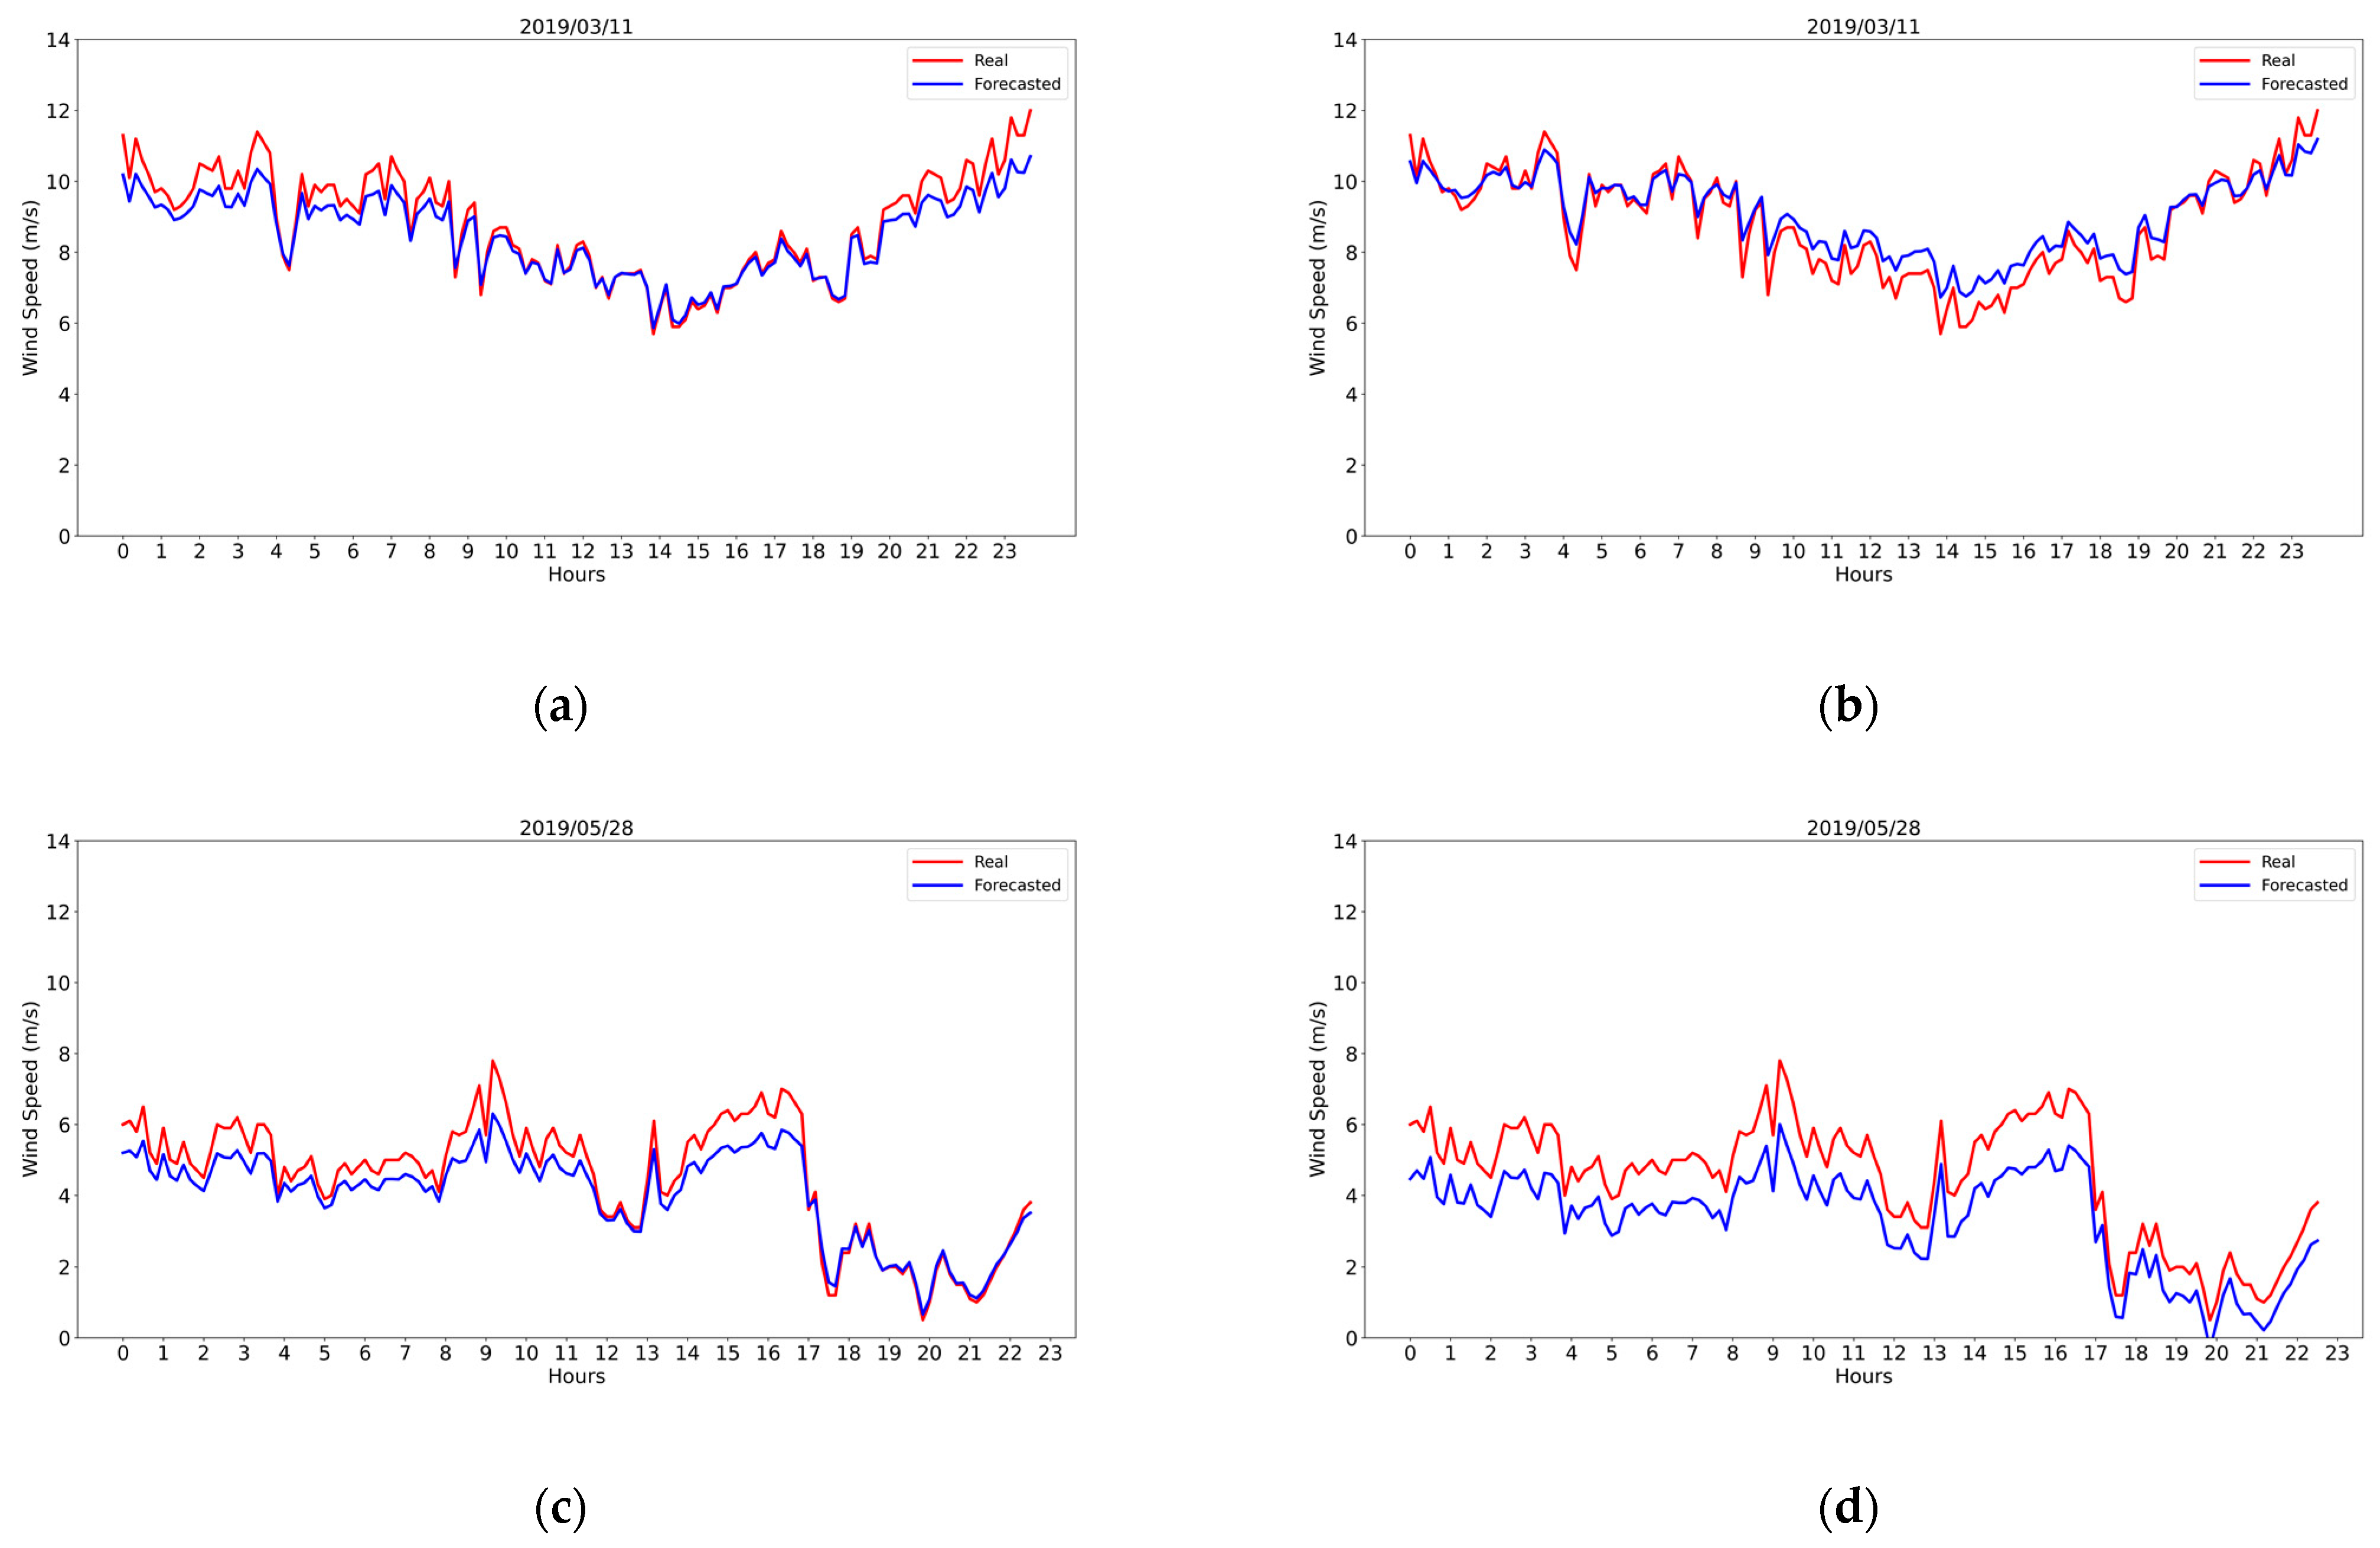
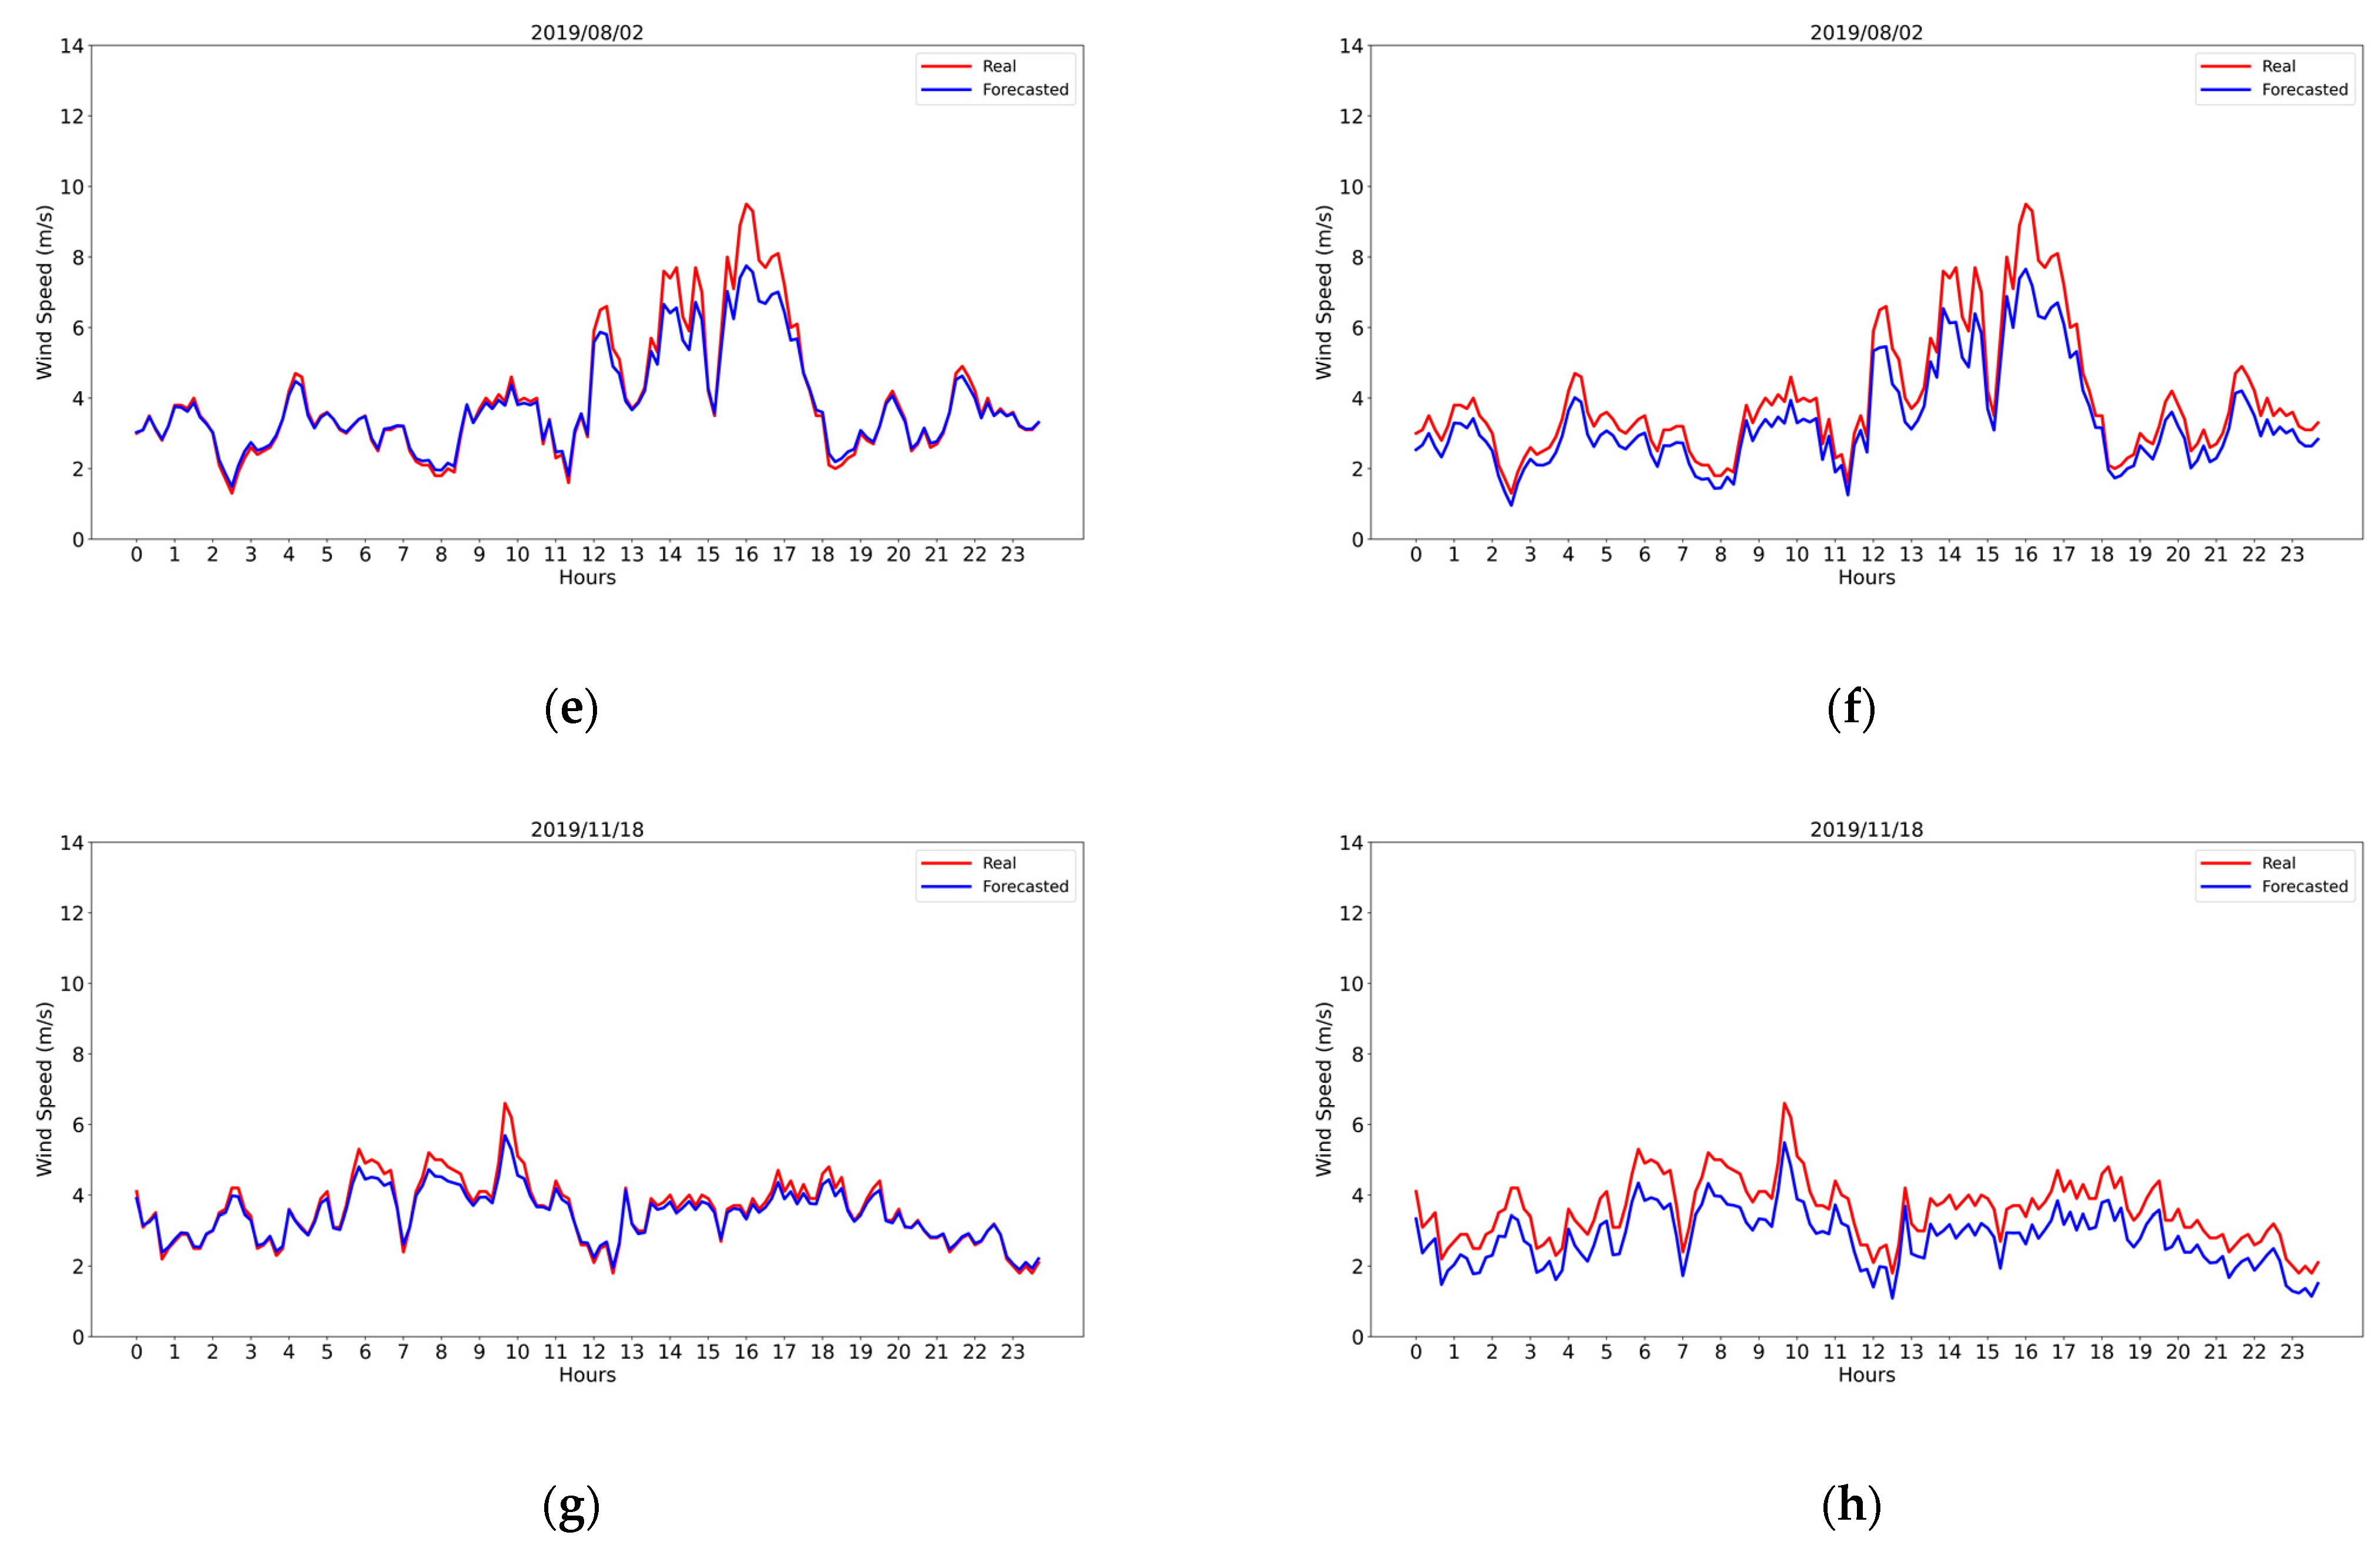
Verification of the Study Cases

Observing the results obtained for the selected case studies, Table 1 summarizes the values of the different metrics used. Note how, contrary to the average behavior observed previously, in these cases, the forecast generated by the LSTM model that combines SisPI and the observations is worse than that obtained when only the wind measurements were taken into account. However, the results are still good, and the errors were below 1 m/s, except for the results from 28 May 2019. Future research should examine the types of meteorological situation for which SisPI is failing to represent the fields of wind. Regarding the correlation, the behavior was similar with both training sets.
Figure 4 presents the graphs of the predicted wind strength, taking the first period of time for each group of 12 samples in the study cases. Likewise, the red curve corresponds to the results using the LSTM model trained with the observations only, and the blue curve includes the SisPI data.
The rows show the results for the cases following the order of 11 March 2019, 28 May 2019, 2 August 2019 and 18 November 2019, while the columns show the forecast obtained for each case with the observations alone (Figure 4a,c,e,g) and that obtained with the combination of the SisPI data and measurements (Figure 4b,d,f,h). In this case, the red lines represent the measured behavior of the wind, while the blue curve represents the forecast. It is easy to see that, for the SisPI forecast, the error is larger; however, fortunately this seems to be a systematic error, which can be resolved by a bias correction method.

4. Conclusions

From the results presented, we can arrive at the following conclusions:
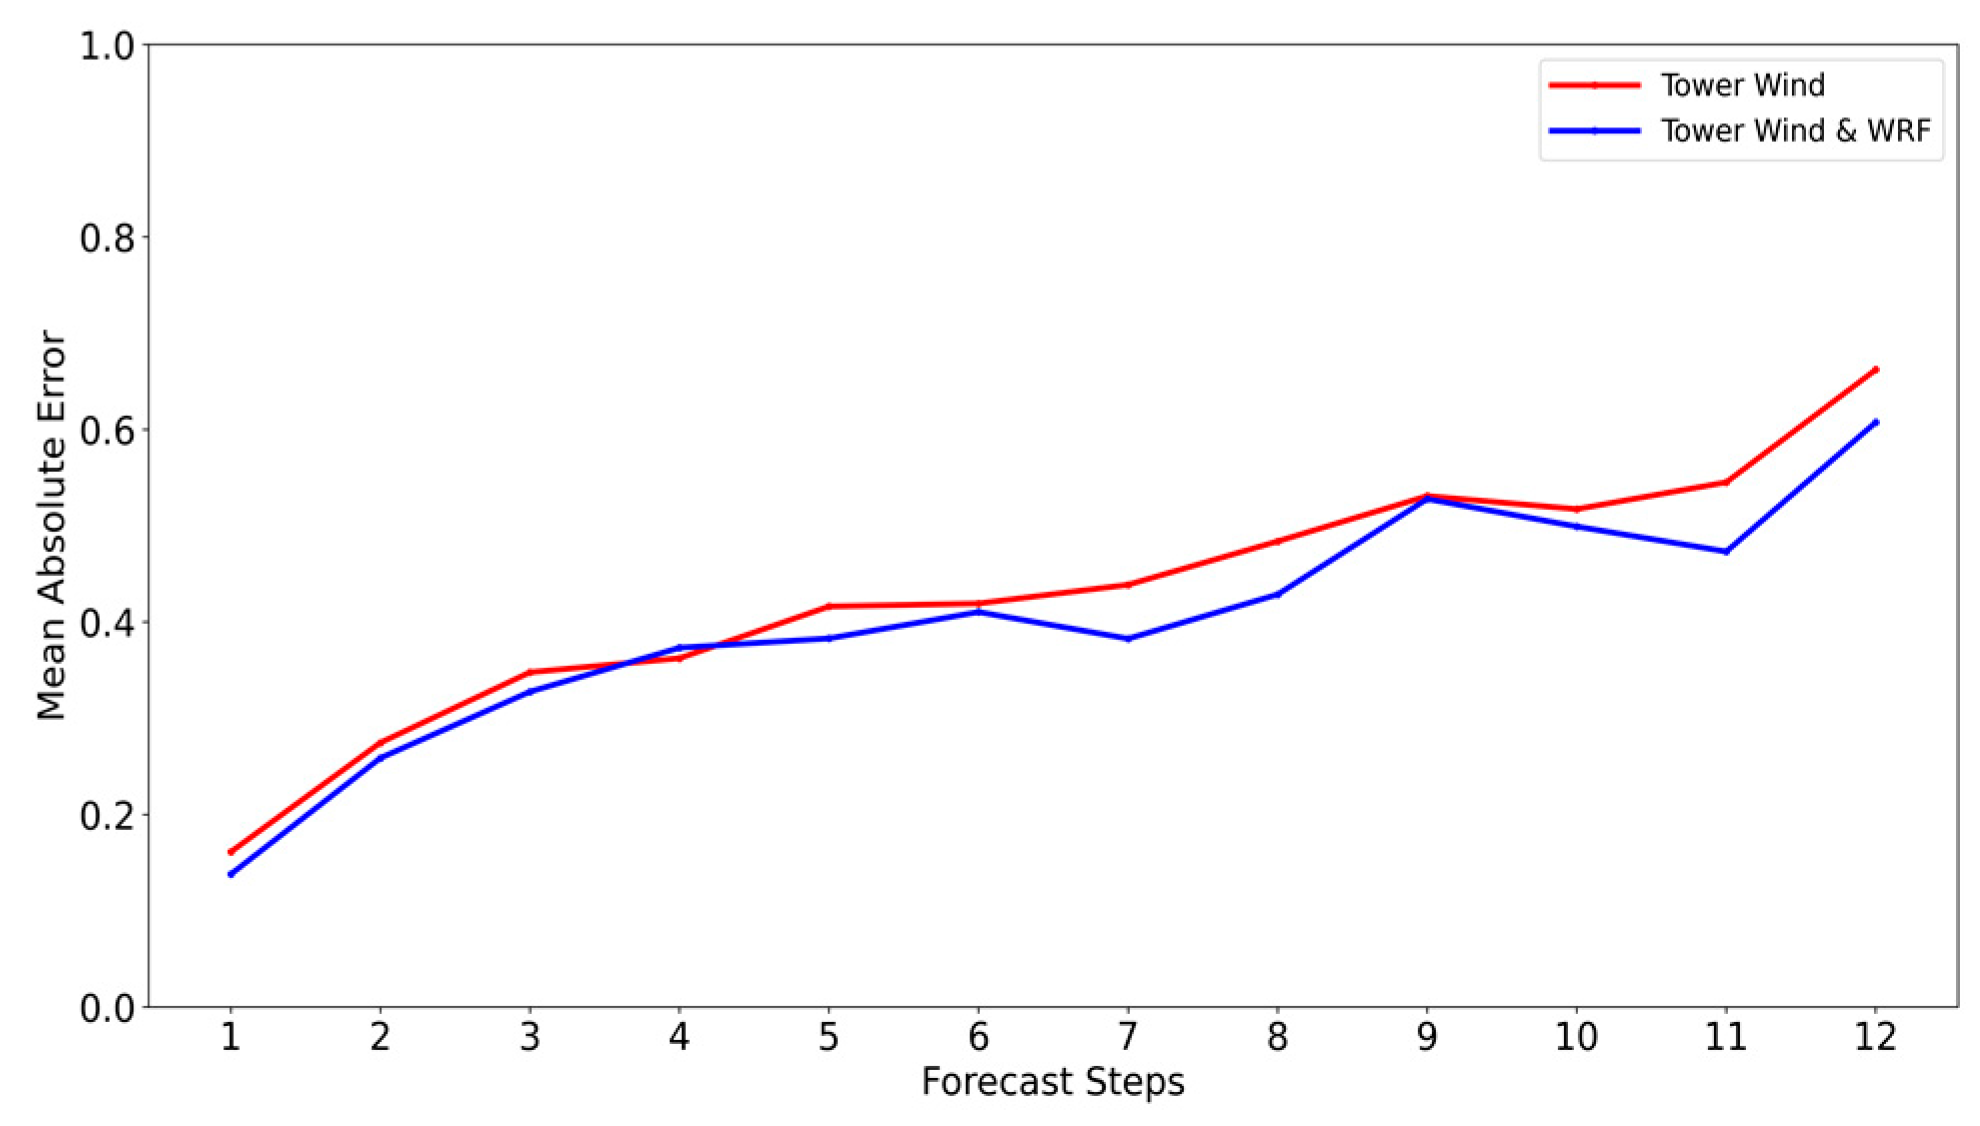
  • The LSTM model constructed both with data from the Los Cocos tower and with the combination of the same data with the SisPI forecasts demonstrates a very strong ability to forecast the force of the wind.
  • The forecasts including the SisPI data have a slightly higher MAE and RMSE; however, their correction is possible as they are systematic errors.
  • In the absence of observations, it is possible to use the SisPI data as an alternative for very short-term forecasting.

Author Contributions

Conceptualization, M.S.-L., A.E.R.-R. and A.F.-B.; methodology, M.S.-L. and A.F.-B.; software, A.F.-B.; validation, A.F.-B. and M.S.-L.; formal analysis, A.F.-B. and M.S.-L.; investigation, A.F.-B.; resources, M.S.-L.; data curation, A.F.-B.; writing—original draft preparation, A.F.-B.; writing—review and editing, M.S.-L. and A.E.R.-R.; visualization, A.F.-B.; supervision, M.S.-L. All authors have read and agreed to the published version of the manuscript.

Funding

This research was founded by the project “Improvement of the energy forecast system for wind and photovoltaic parks connected to the national electricity system” with grant number PN211LH005-032.

Institutional Review Board Statement

Not applicable.

Informed Consent Statement

Not applicable.

Conflicts of Interest

The authors declare no conflict of interest.

References

  1. Roque, A.; Yu, W. Informe Científico Técnico del Proyecto Atlas Eólico de Cuba; Technical Report; Instituto de Meteorología de Cuba: Havana, Cuba, 2014. [Google Scholar]
  2. Rosell, D. Conferencia Magistral “Desarrollo de las Fuentes Renovables de Energía. In Proceedings of the Congreso Internacional de Energía Renovable, Ahorro y Educación Energética”Palacio de Las Convenciones, La Habana, Cuba, 25–28 May 2015. [Google Scholar]
  3. Sapronova, C. Meissner & M. MANA 2015. Short Time Ahead Wind Power Production Forecast. Proyecto ENERGIX 2015–2016 Patrocinado por el Consejo de Investigación Noruego. Available online: https://windeurope.org/summit2016/conference/submit-an-abstract/pdf/246989398891.pdf (accessed on 13 April 2022).
  4. Carpinone, A.; Giorgio, M.; Langella, R.; Testa, A. Markov chain modeling for very-short-term wind power forecasting. Electric. Power Syst. Res. 2015, 122, 152–158. [Google Scholar] [CrossRef]
  5. Appice, A.; Pravilovic, S.; Lanza, A.; Malebra, D. Very Short-Term Wind Speed Forecasting Using Spatio-Temporal Lazy Learning; Springer: Cham, Switzerland, 2015. [Google Scholar]
  6. Senkal, S.; Ozgonenel, O. Performance Analysis of Artificial and Wavelet Neural Networks for Short Term Wind Speed Prediction. In Proceedings of the 2013 8th International Conference on Electrical and Electronics Engineering (ELECO), Bursa, Turkey, 28–30 November 2013; pp. 196–198. [Google Scholar] [CrossRef]
  7. Hinojosa, M. Pronóstico de Viento a Muy Corto Plazo Para Parques Eólicos. Bachelor’s Thesis, University of Havana, Habana, Cuba, 2015. [Google Scholar]
  8. Roque, A.; Borrajero, I.; Hernández, A.; Sierra, M. Short-term energy forecast for the Gibara I and Los Canarreos Wind Farms; Technical Report; Instituto de Meteorología de Cuba: Havana, Cuba, 2015. [Google Scholar]
  9. Roque, A.; Sierra, M.; Borrajero, I.; Ferrer, A.H. Short-Term Wind Forecast in Meteorological Reference Towers for the Cuban Wind Program; Technical Report; Instituto de Meteorología de Cuba: Havana, Cuba, 2015. [Google Scholar]
  10. Martínez-Pérez, B.; Roque-Rodríguez, A. Very short-term energy forecast for the Gibara I Wind Farm using an autoregressive model. Rev. Cuba. Meteorol. 2019, 25, 167–180. [Google Scholar]
  11. Sierra-Lorenzo, M.; Ferrer-Hernández, A.L.; Hernández-Valdés, R.; González-Mayor, Y.; Cruz-Rodríguez, R.C.; Borrajero-Montejo, I.; Rodríguez-Genó, C.F. Sistema Automático de Predicción a Mesoescala de Cuatro Ciclos Diarios; Technical Report; Instituto de Meteorología de Cuba: Havana, Cuba, 2014. [Google Scholar]
  12. Sierra-Lorenzo, M.; Borrajero-Montejo, I.; Ferrer-Hernández, A.L.; Hernández-Valdés, R.; Morfa-Ávalos, Y.; Morejón-Loyola, Y.; Hinojosa-Fernández, M. Estudios de Sensibilidad del Sispi a Cambios de la pbl, la Cantidad de Niveles Verticales y, las Parametrizaciones de Microfısica y Cúmulos, a Muy Alta Resolución; Technical Report; Instituto de Meteorología de Cuba: Havana, Cuba, 2017. [Google Scholar]
Figure 1. Simulation domains for SisPI. The green square corresponds with the 3km resolution domain used in this study.
Environsciproc 19 00030 g001
Figure 2. LSTM configuration.
Environsciproc 19 00030 g002
Figure 3. Behavior of the MAE for the 12 forecast terms of the validation set. The red line represents the results obtained with the data from Torre Los Cocos, and the blue line corresponds to the results obtained by training the LSTM with the SisPI forecast and the tower observations.
Environsciproc 19 00030 g003
Figure 4. Forecast wind values for each of the case studies rows in order: 11 March 2019 (a,b), 28 May 2019 (c,d), 2 August 2019 (e,f) and 18 November 2019 (g,h); using the LSTM model trained with observations only (left column) and the LSTM model input with SisPI and observations (right column).
Environsciproc 19 00030 g004aEnvironsciproc 19 00030 g004b
Table 1. Evaluation of the forecasts of the LSTM model in the case studies. The left column corresponds to the LSTM model built with only real data, and the right column refers to the combination of SisPI and the observations.
Metrics11 March 201928 May 2019 2 August 201918 November 2019
MAE0.360.390.501.150.220.600.150.77
Pearson correlation0.990.990.990.990.990.990.990.99
RMSE0.230.220.361.400.170.470.040.61
Disclaimer/Publisher’s Note: The statements, opinions and data contained in all publications are solely those of the individual author(s) and contributor(s) and not of MDPI and/or the editor(s). MDPI and/or the editor(s) disclaim responsibility for any injury to people or property resulting from any ideas, methods, instructions or products referred to in the content.

