Proceeding Paper

Review of Particulate Matter Levels and Sources in North Africa over the Period 1990–2019 †

National Centre of Energy, Sciences and Nuclear Techniques (CNESTEN), BP 1382, Rabat RP 10001, Morocco
*
Author to whom correspondence should be addressed.
Presented at the 5th International Electronic Conference on Atmospheric Sciences, 16–31 July 2022; Available online: https://ecas2022.sciforum.net/.
Environ. Sci. Proc. 2022, 19(1), 3; https://doi.org/10.3390/ecas2022-12798
Published: 14 July 2022
(This article belongs to the Proceedings of The 5th International Electronic Conference on Atmospheric Sciences)

Abstract

:
Africa, particularly West and North Africa, has some of the highest levels of average PM pollution, second only to South and East Asia and the Middle East. This study reports the PM2.5 and PM10 concentrations and their emissions sectors in North Africa from 1990 to 2019. The data were collected online from the following platforms: EDGAR (Emissions Database for Global Atmospheric Research), Climate Watch, Our World in Data, and the World Bank. The analysis of data indicated that outdoor air pollution in North Africa is the fourth leading risk factor for death, with 3.4 million deaths in total from 1990 to 2019. Globally, 43% of PM10 emissions in North Africa from 1970 to 2015 were contributed by buildings, 16.6% by other industrial combustion, 13.7% by transport, 11.4% by other sectors, 9.6% by agriculture, 5.3% by power industry, and 0.2% by waste. For PM2.5, the major emitter sector in North Africa, during the same period, was also buildings with 38.2%, followed by transport (21.5%), other industrial combustion (17.3%), other sectors (12.4%), power industry (6%), agriculture (4.5%), and waste (0.2%).

1. Introduction

Particles are airborne fragments in solid or liquid form. They are classified as primary or secondary particles depending on the compounds and the processes at the origin of their formation [1,2,3]. The size of the particles determines the extent of damage they cause to health and the environment [1,2,3]. Particles whose size is greater than 10 µm (PM10) are mostly stopped in the nose and they are not considered inhalable. However, particles whose size is less than 2.5 µm (PM2.5), also called fine particles, can penetrate deep into the respiratory tract, and reach the lungs [1,2,3]. Fine particle exposure can irritate the eyes, nose, throat, and lungs, and can cause coughing, sneezing, runny nose, and shortness of breath [1,2,3].
North Africa is one of the world’s most water-scarce regions, making it particularly vulnerable to climate change. The entire region is expected to be one of the most vulnerable and exposed to climate change “hot spot”, with health implications [4,5]. There are numerous worldwide review papers accessible in the literature that discuss air pollution and its influence on global health worldwide [6,7,8]. However, to our knowledge, few studies in that field have been carried out in North Africa. The lack of data on air quality and its effects in North Africa is a big issue. The existing research papers and measuring campaigns to evaluate PM concentrations and quantify trace components produced by various sources in some North African cities have been cried out by local scientists [9,10,11,12,13,14]. In the present study, to overlap this gap, free databases made available via international platforms were downloaded and used. The objectives were to report the PM2.5 and PM10 concentrations and their emissions sectors in North Africa from 1990 to 2019.

2. Materials and Methods

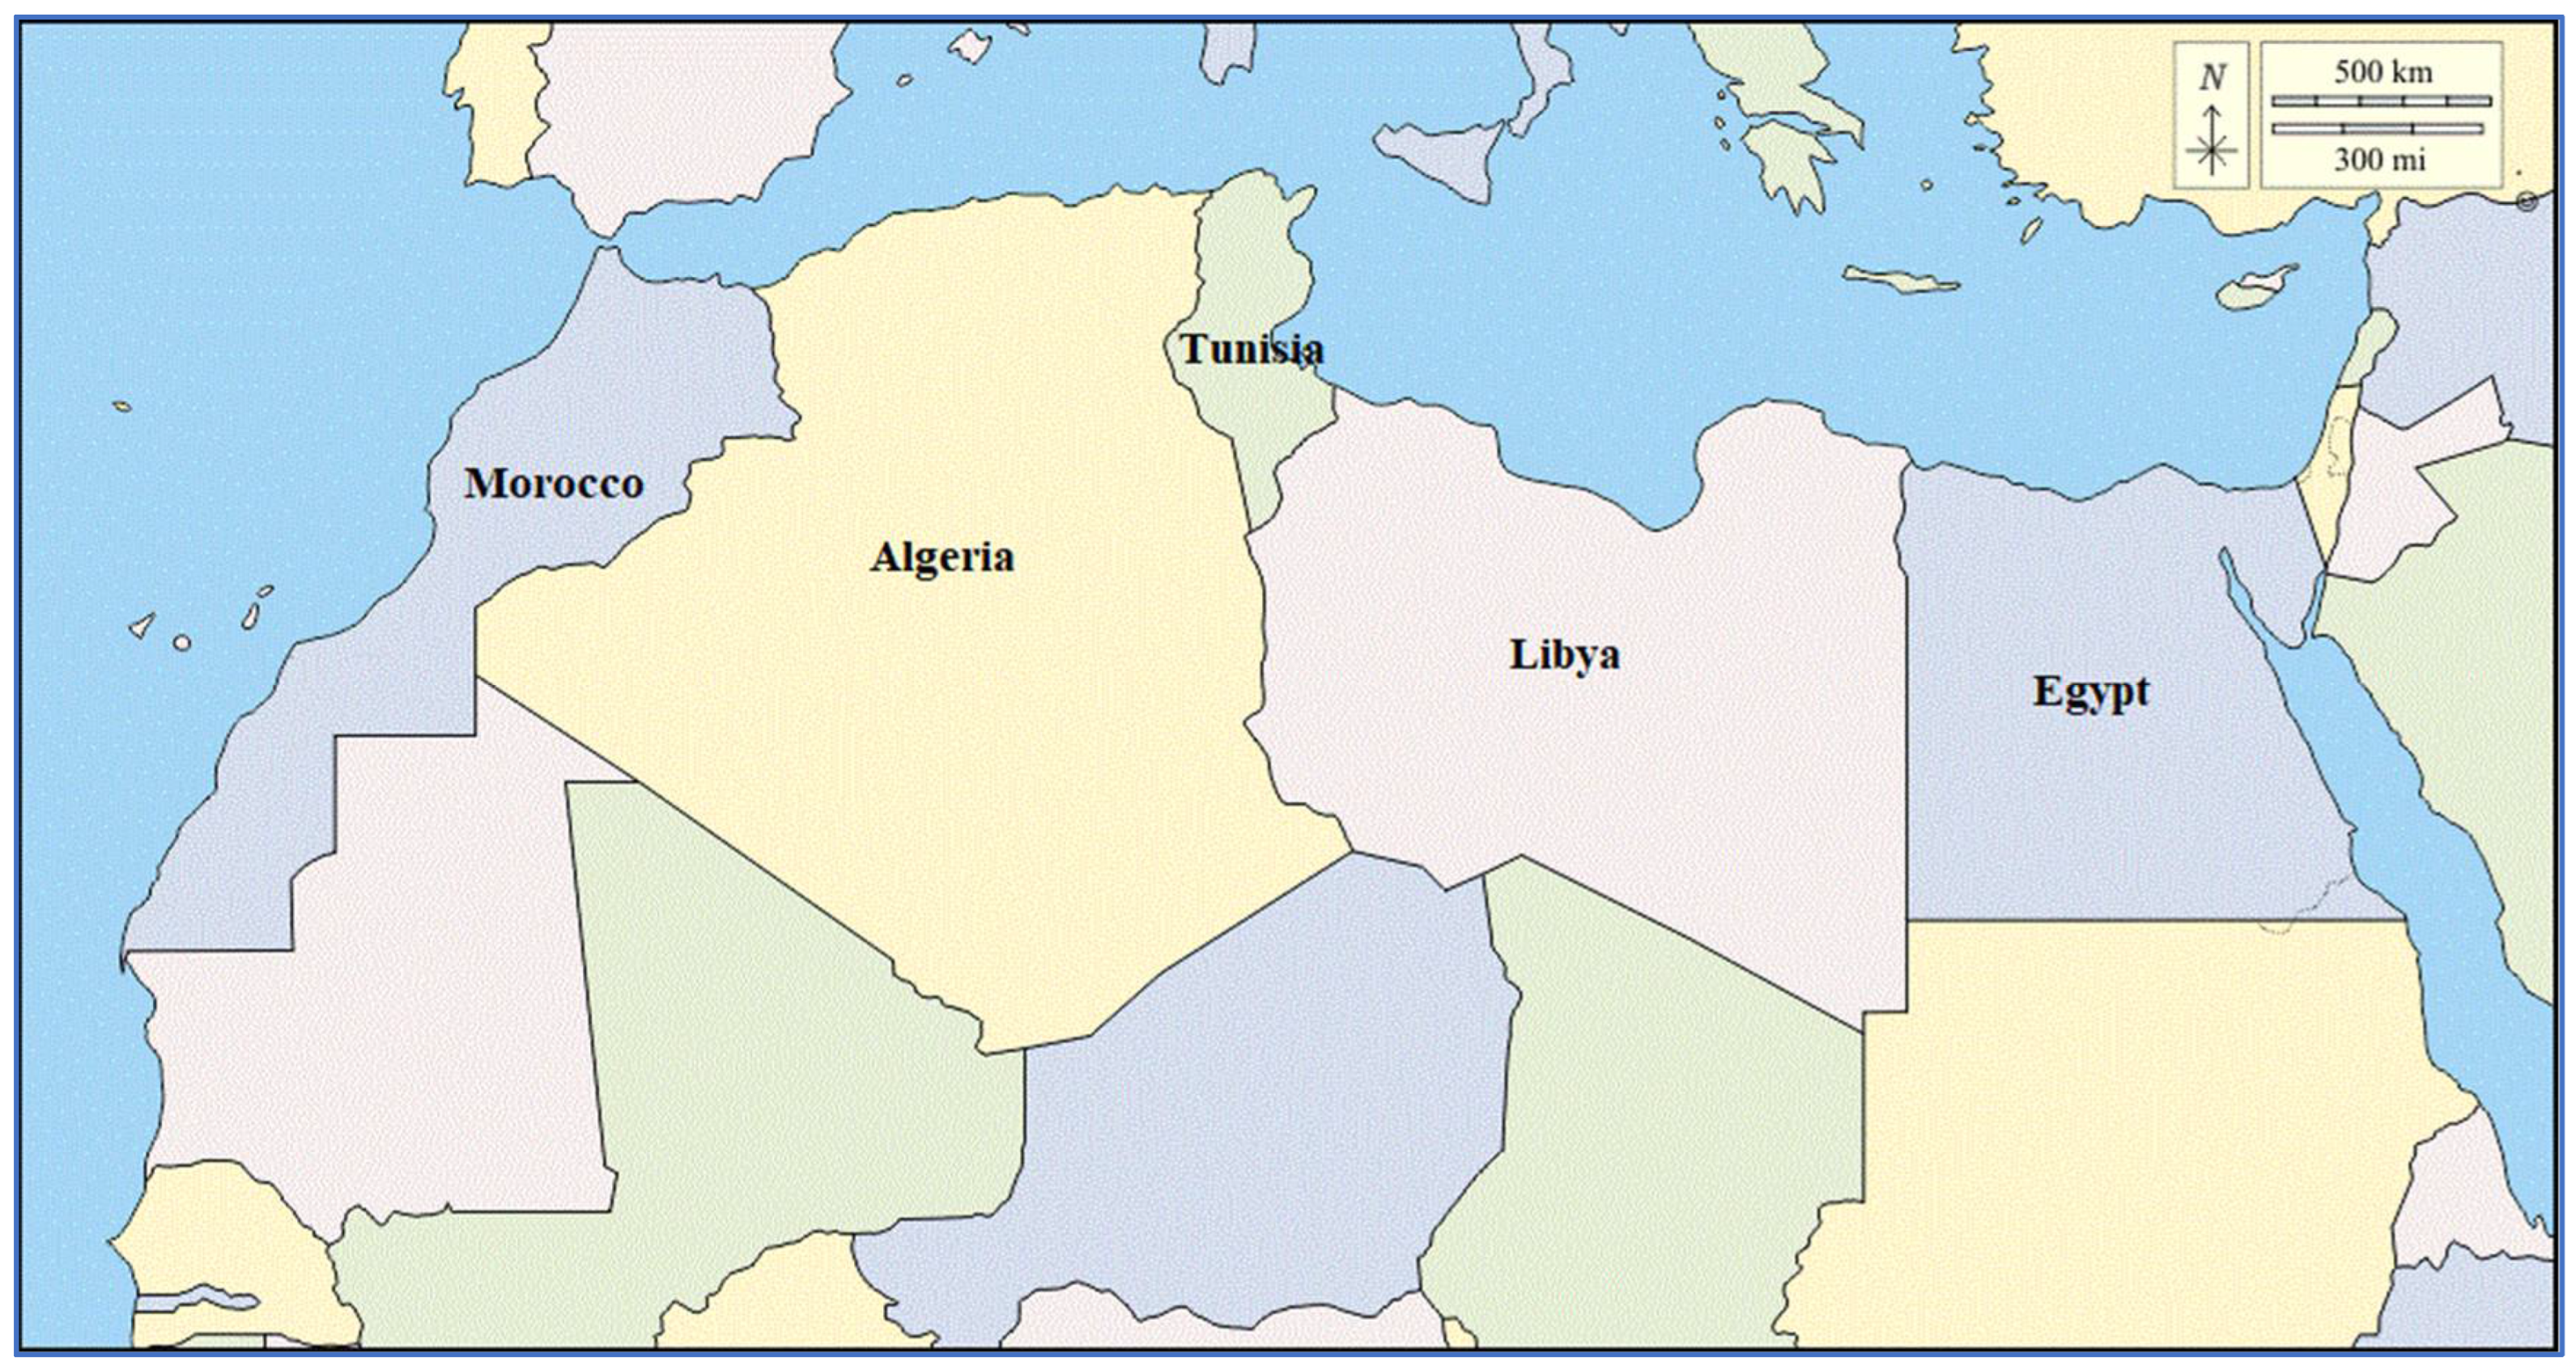
2.1. Study Area and Period

North Africa includes Morocco, Algeria, Tunisia, Egypt, and Libya (Figure 1) and benefits from a strategic location between Europe and Africa. The population of the region was 246,232,518 people in 2020 (3.3% of the total world population) [15]. Northern Africa ranks number 3 in Africa among subregions ranked by population [15]. The population density is 32 inhabitants per km2; 52.4% of the population is urban (129,068,218 people in 2020) [15]. Its GDP amounted to 435.6 billion dollars in 2022, the second-highest in Africa after Nigeria [16].
Global warming has had an impact on the North African region, resulting in a decrease in rainfall, growing seasons, and agricultural production yields. By 2100, climate change will cost agriculture in North Africa between 0.4 and 1.3 percent of GDP [17].
In terms of air quality, outdoor air pollution is the fourth greatest cause of mortality in North Africa, with 3.4 million deaths between 1990 and 2019 (Figure 2). Total GHG emissions climbed by 103% (about 3.6% each year on average). Faced with this and other environmental concerns such as the decrease of forest areas and growing energy costs, the countries of the region have implemented a series of national policy documents and plans to decrease their carbon footprint.

2.2. Methodology

This study reports the PM2.5 and PM10 concentrations in North Africa from 1990 to 2019. The data were collected online from four different online data platforms: EDGAR (Emissions Database for Global Atmospheric Research) [20], Climate Watch [21], Our World in Data [19], and the World Bank [22].
-
EDGAR (Emission Database for Global Atmospheric Research) is a multipurpose, independent, global database of anthropogenic emissions of greenhouse gases and air pollution on Earth. The current development of EDGAR is a joint project of the European Commission DG JRC and the Netherlands Environmental Assessment Agency (PBL). EDGAR provides independent emission estimates compared to what was reported by the European Member States or by Parties under the United Nations Framework Convention on Climate Change (UNFCCC), using international statistics and a consistent IPCC methodology. EDGAR provides both emissions as national totals and grid maps at 0.1 × 0.1-degree resolution at the global level, with yearly, monthly, and up to hourly data (https://edgar.jrc.ec.europa.eu/, accessed on 25 August 2022) [20].
-
Climate Watch is an open and online data platform that brings together dozens of datasets to let users easily search, analyze, and compare countries’ climate progress and commitments under the Paris Agreement. Users can use the platform to access historical emissions data, and the latest historical greenhouse gas emissions data, track net-zero targets and explore nationally determined contributions (NDCs) and long-term strategies to reduce GHG emissions. This free platform provides actionable analysis on how countries can enhance their efforts to combat climate change (https://www.climatewatchdata.org/, accessed on 15 August 2022) [21].
-
Our World in Data (https://ourworldindata.org, accessed on 25 August 2022) [19] is a data portal produced by the Oxford Martin Programme on Global Development at the University of Oxford [1] and is made available as a public good. It was founded by Max Roser, a social historian and development economist [2]. It serves as a helpful tool for researchers, making it easy to explore data sources and analyses on a variety of topics. This meta-database is open source, and the data visualizations for this website are released under a Creative Commons license.
-
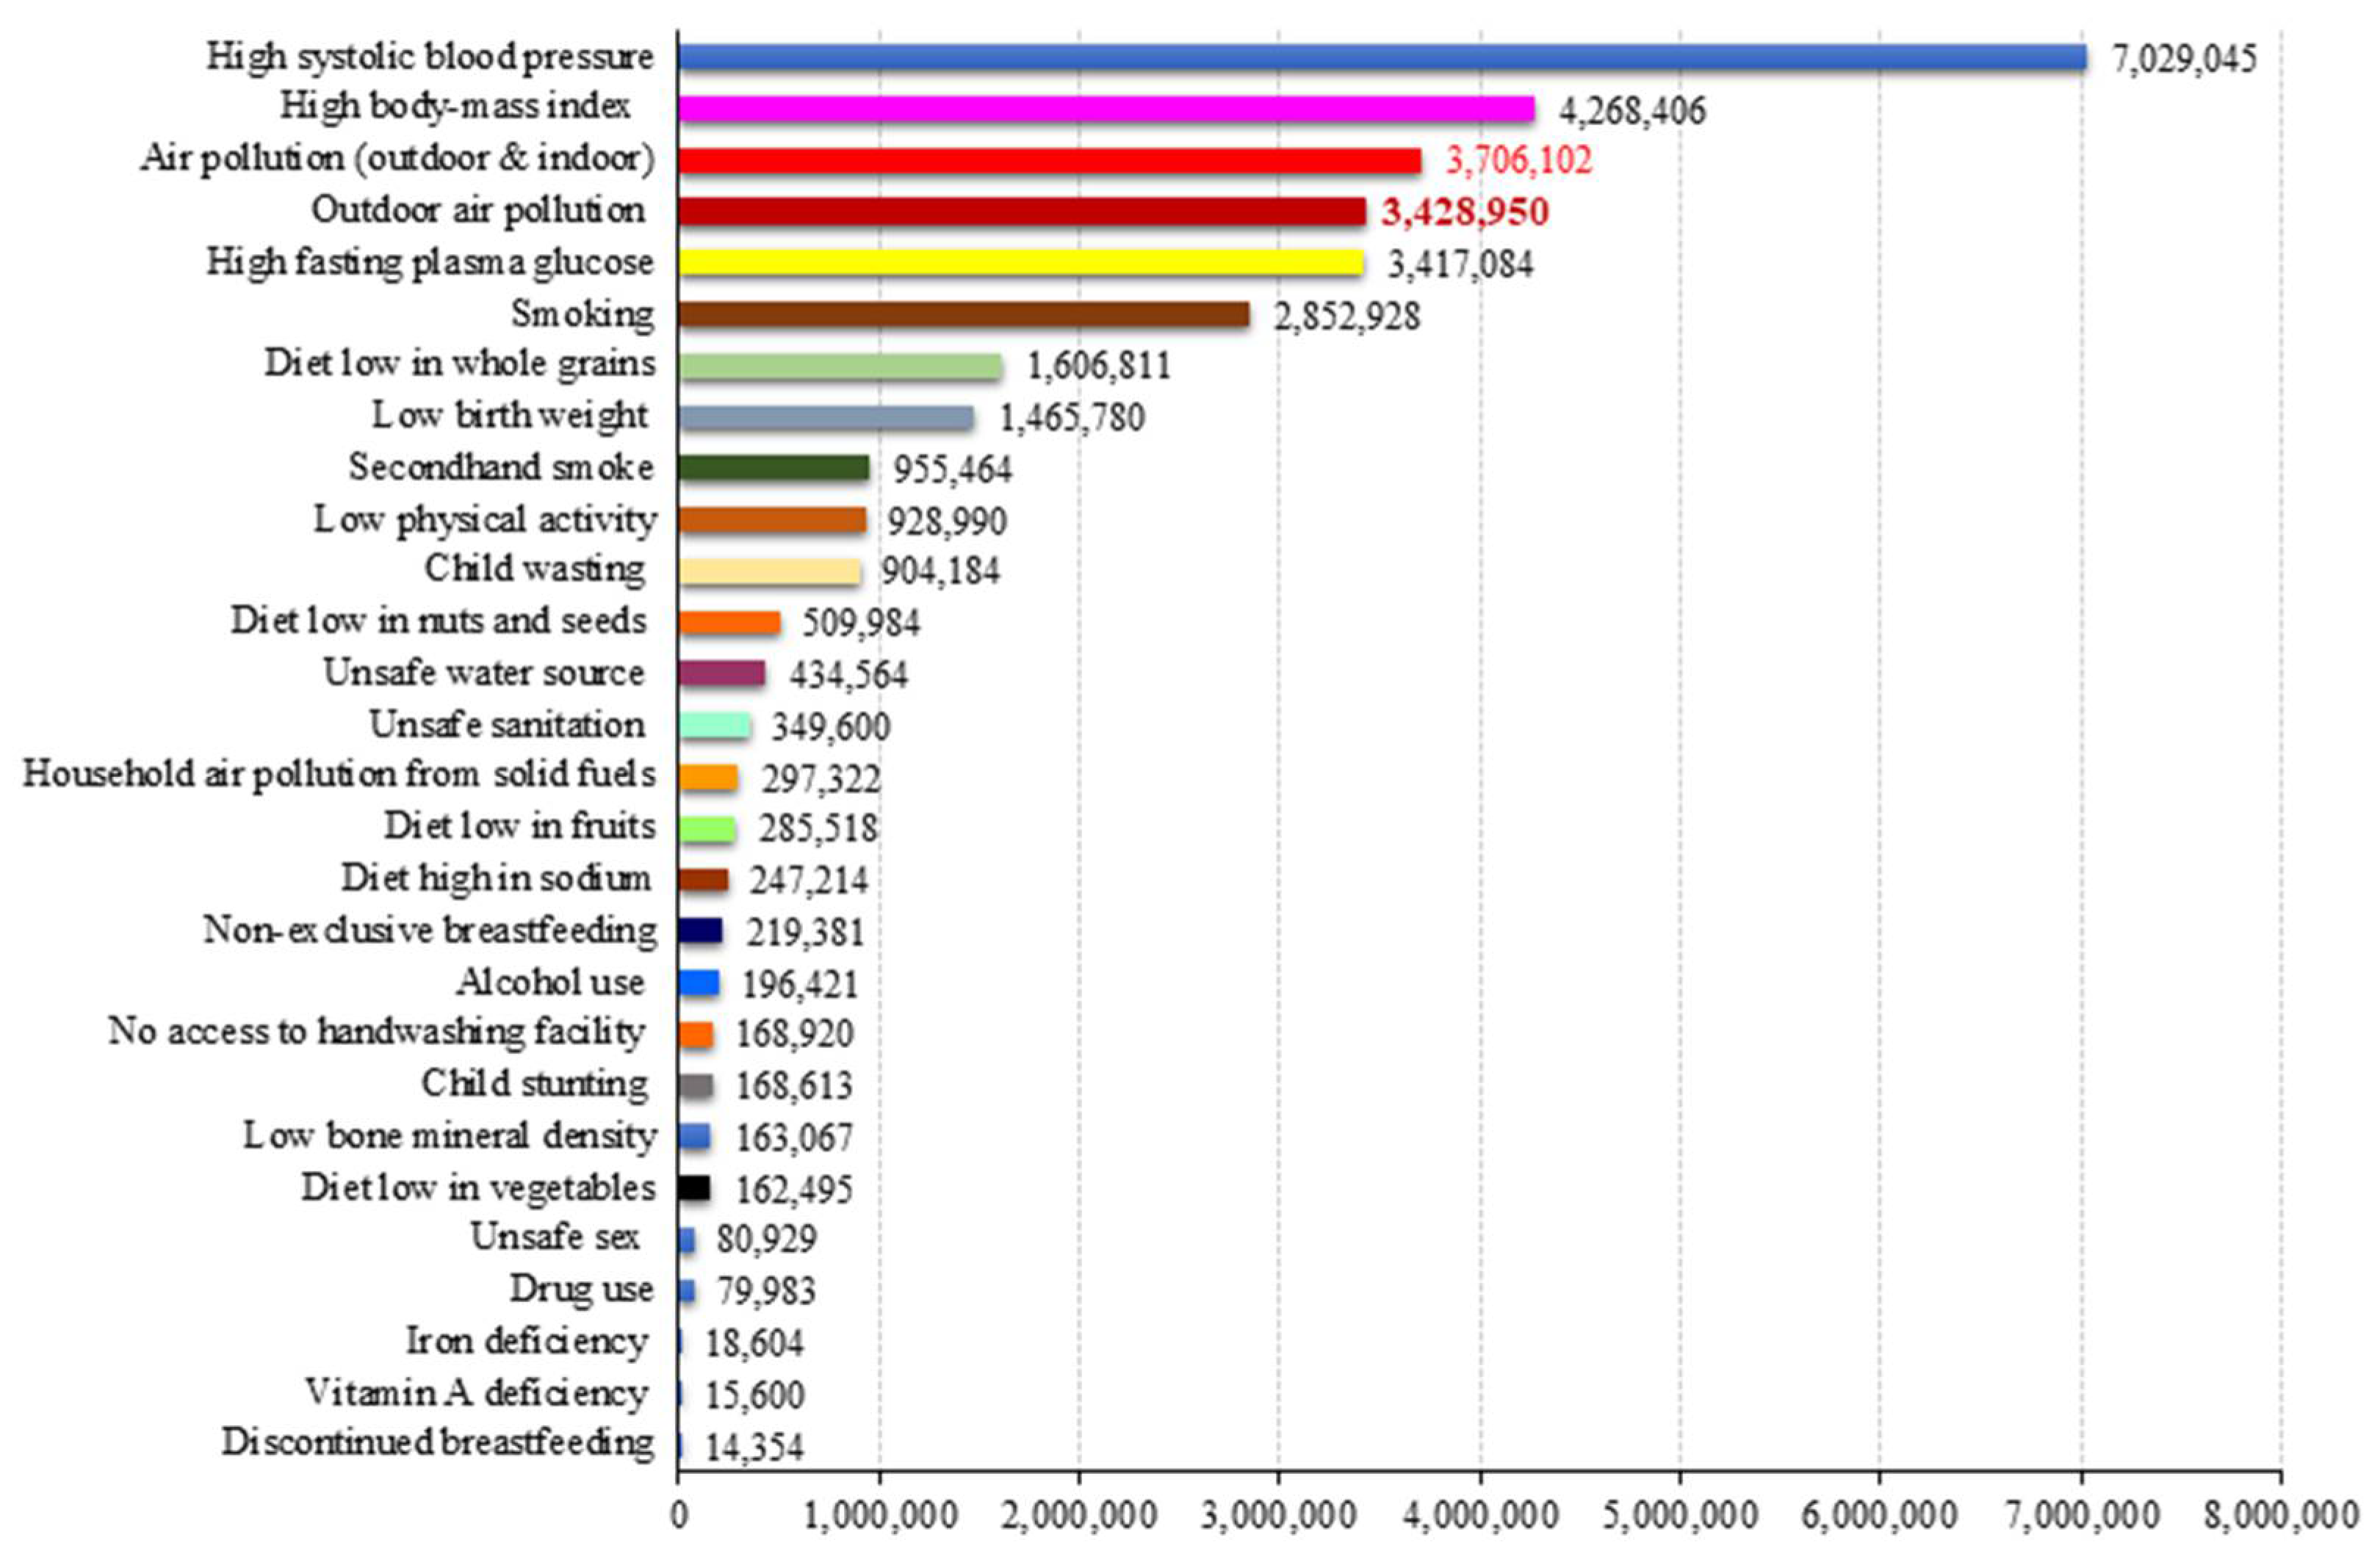
State of Global Air (www.stateofglobalair.org, accessed on 25 August 2022) [22]: The data used in the State of Global Air website are part of the Institute for Health Metrics and Evaluation’s (IHME) annual Global Burden of Diseases, Injuries, and Risk Factors (GBD) project, which is a systematic, scientific effort to quantify the magnitude of health loss caused by all major diseases, injuries, and risk factors by age, sex, and population. GBD studies approximately 350 diseases and injuries, as well as 84 behavioral, environmental, and metabolic risk variables in each country, with over 3600 partners in 195 countries and territories. Several countries have subnational assessments included [22].

3. Results and Discussion

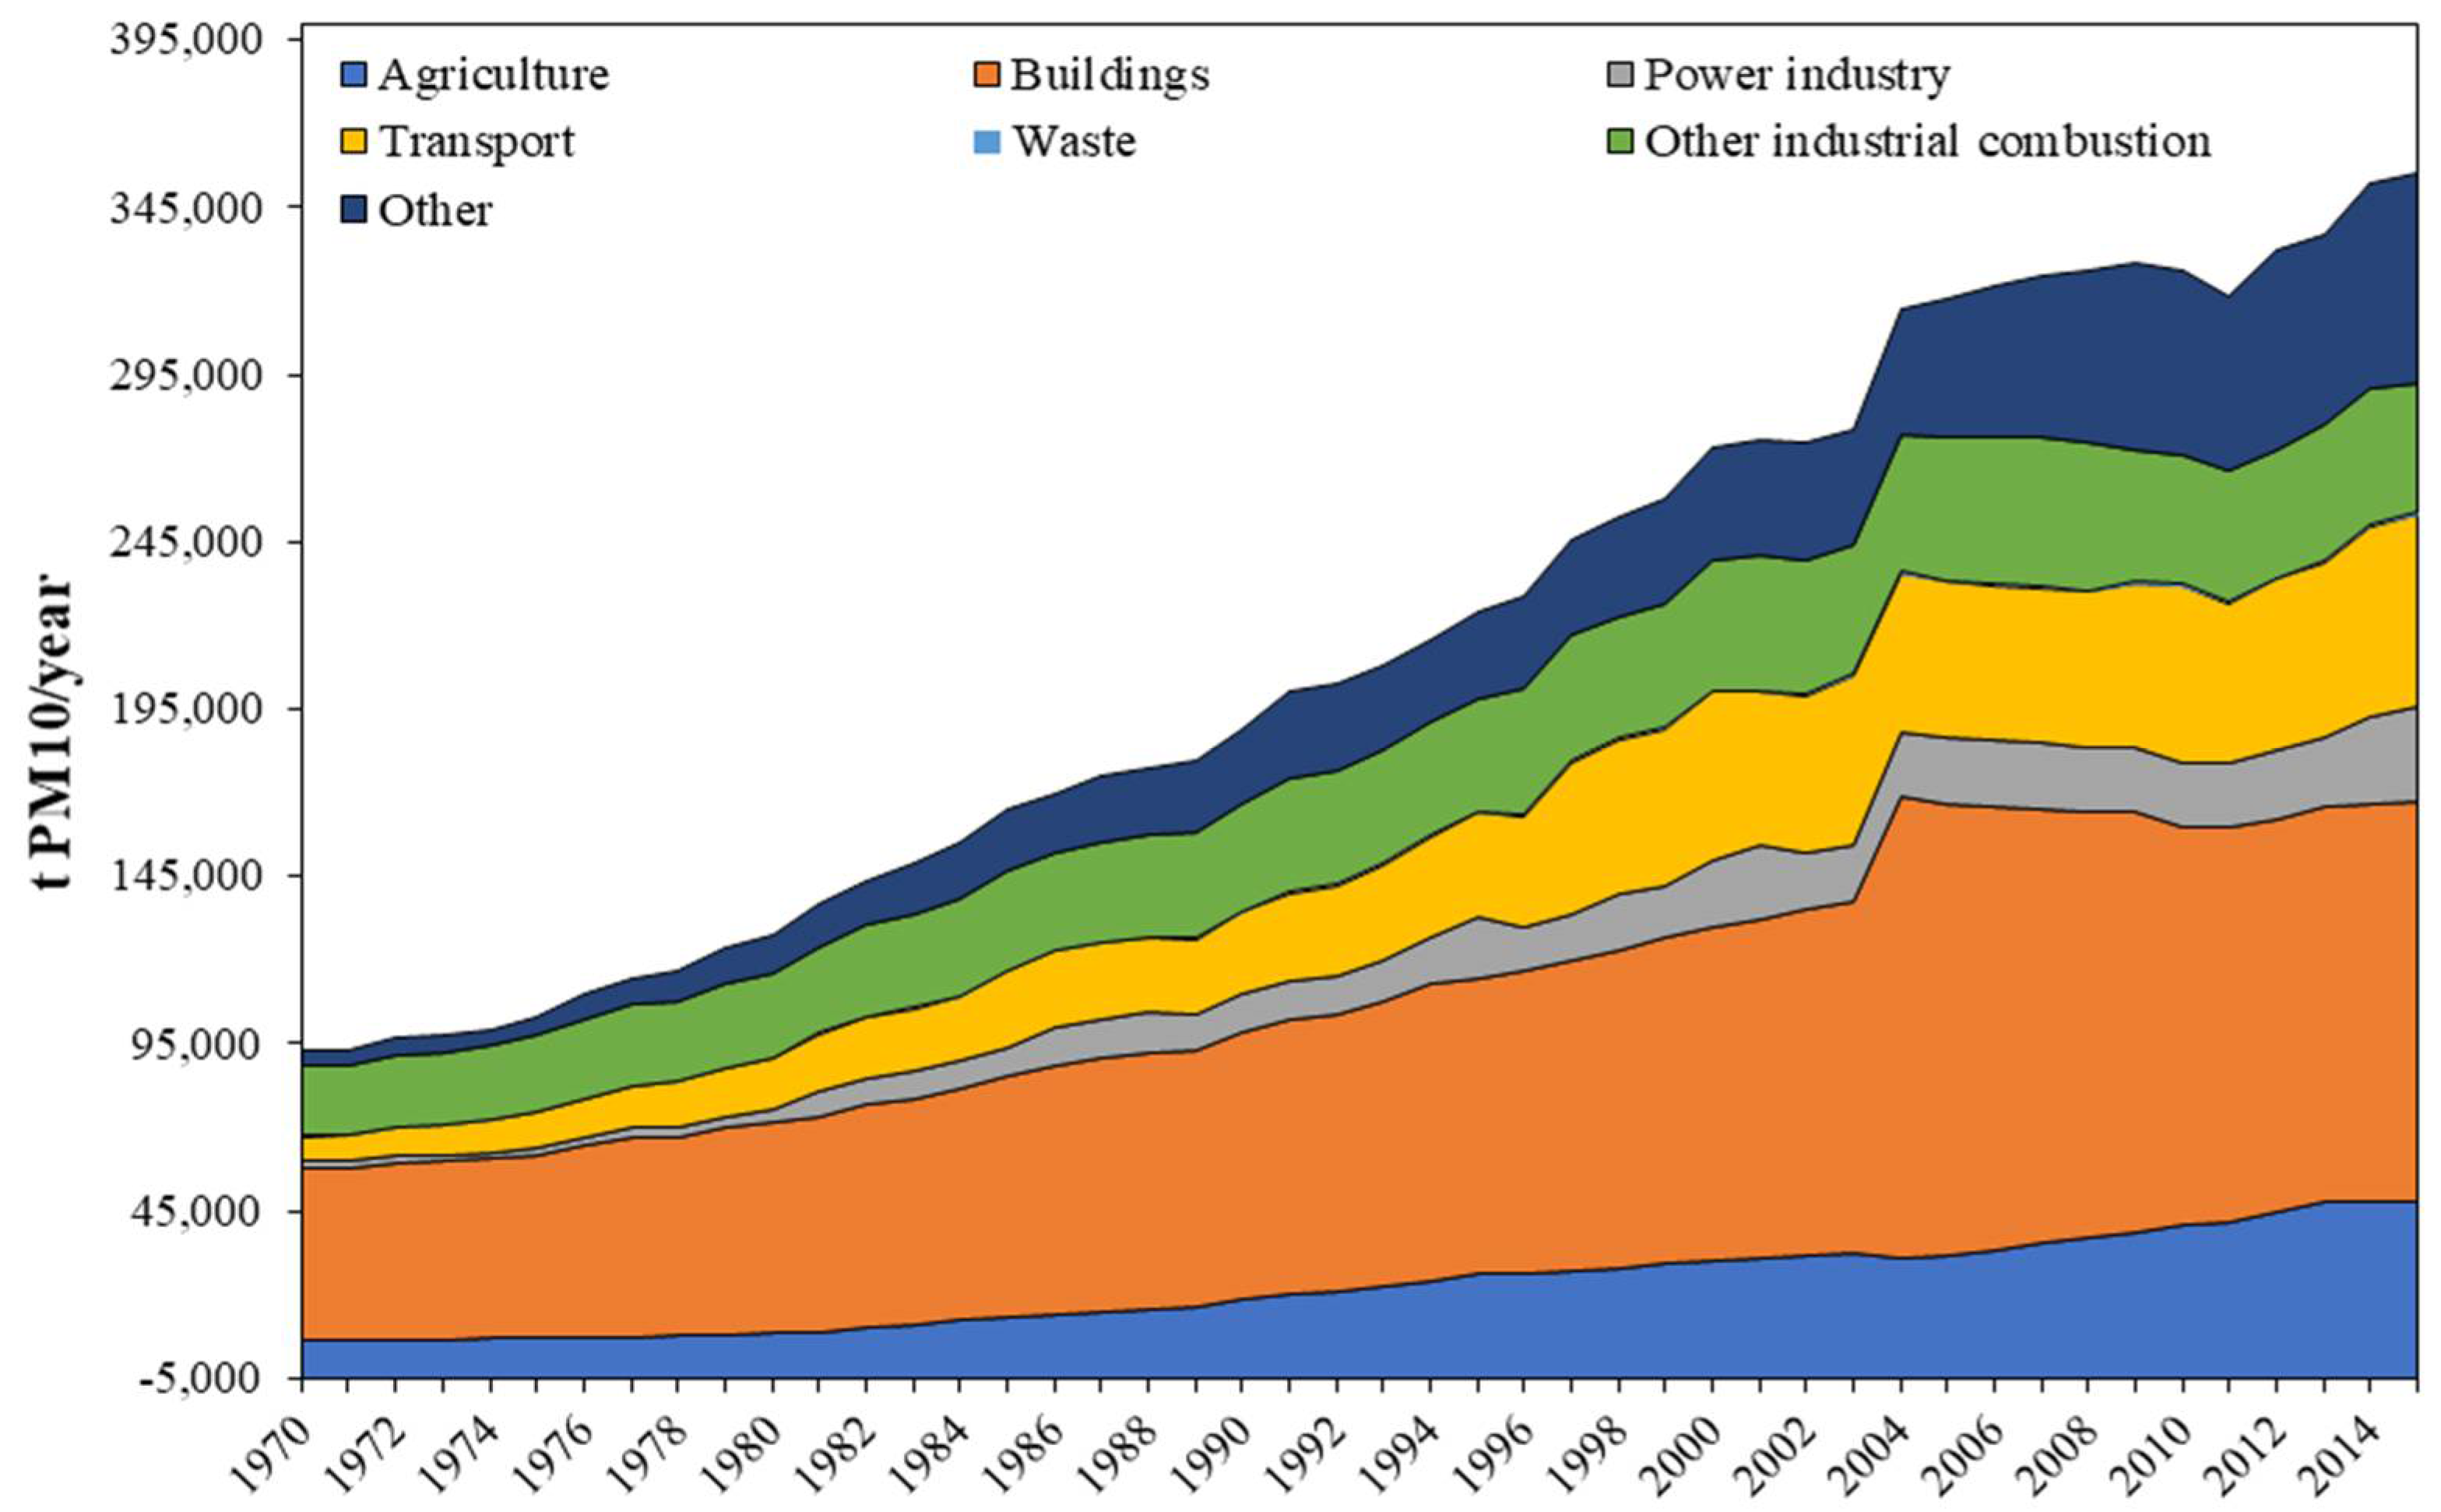
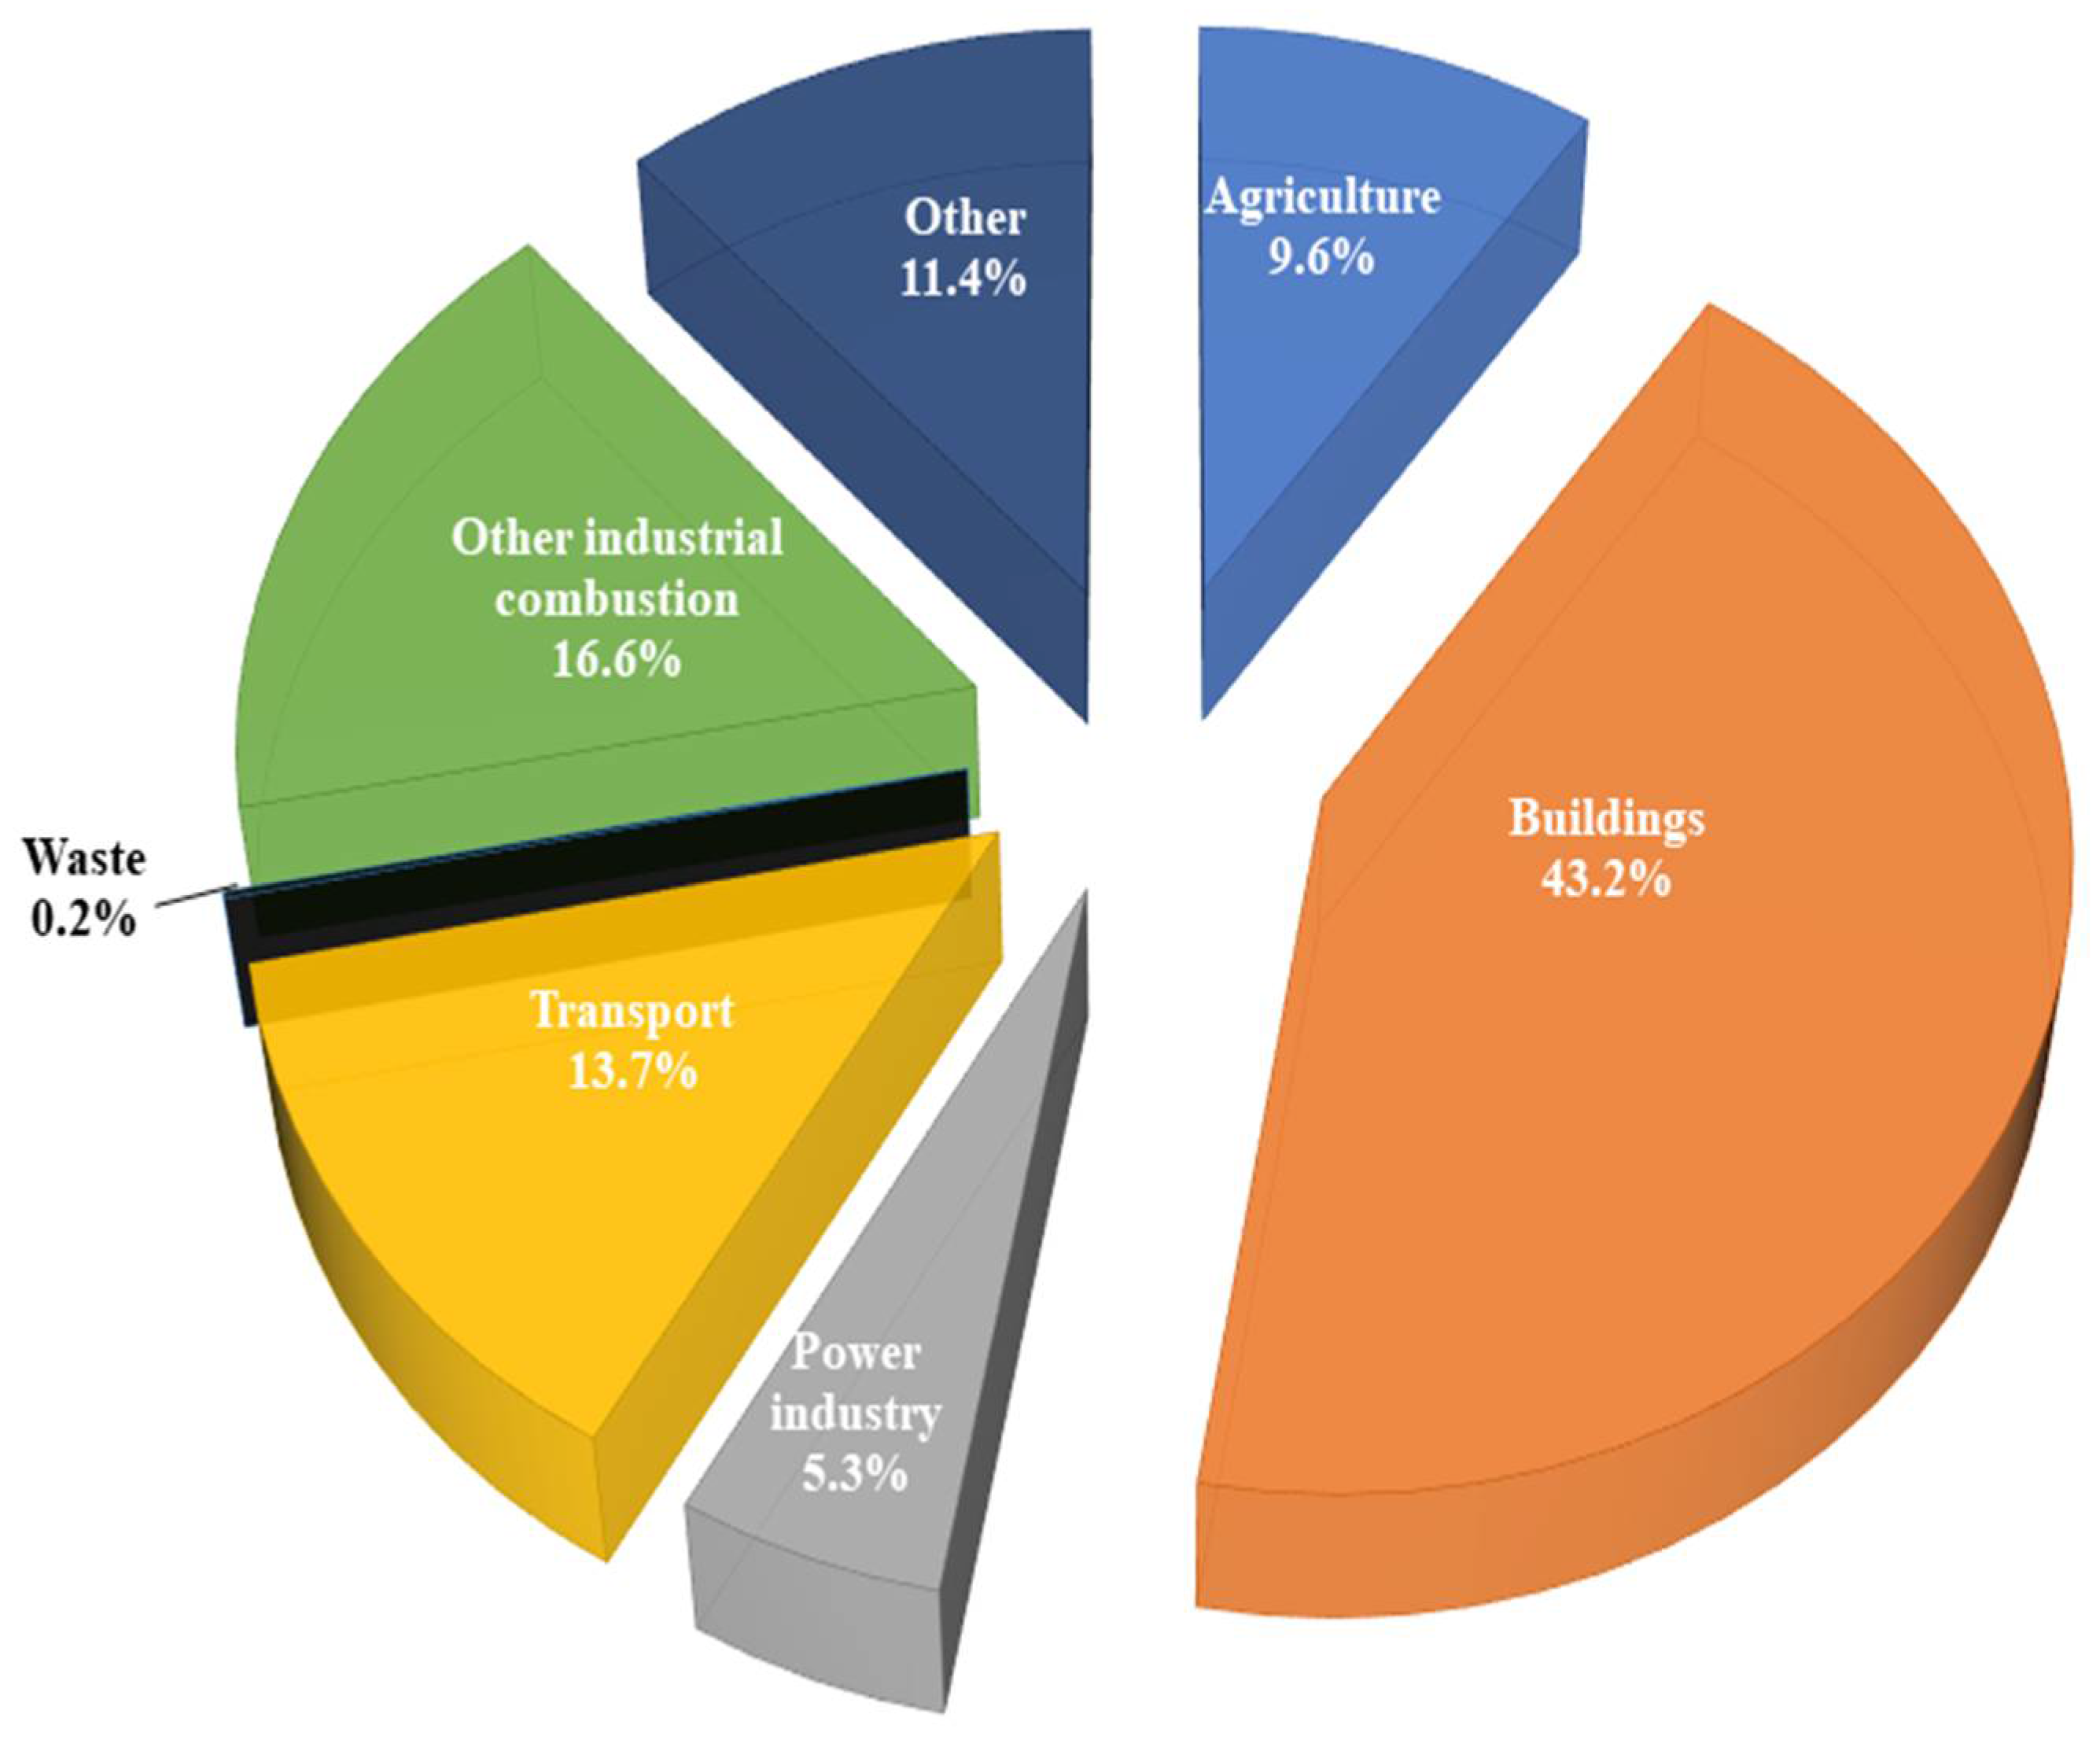
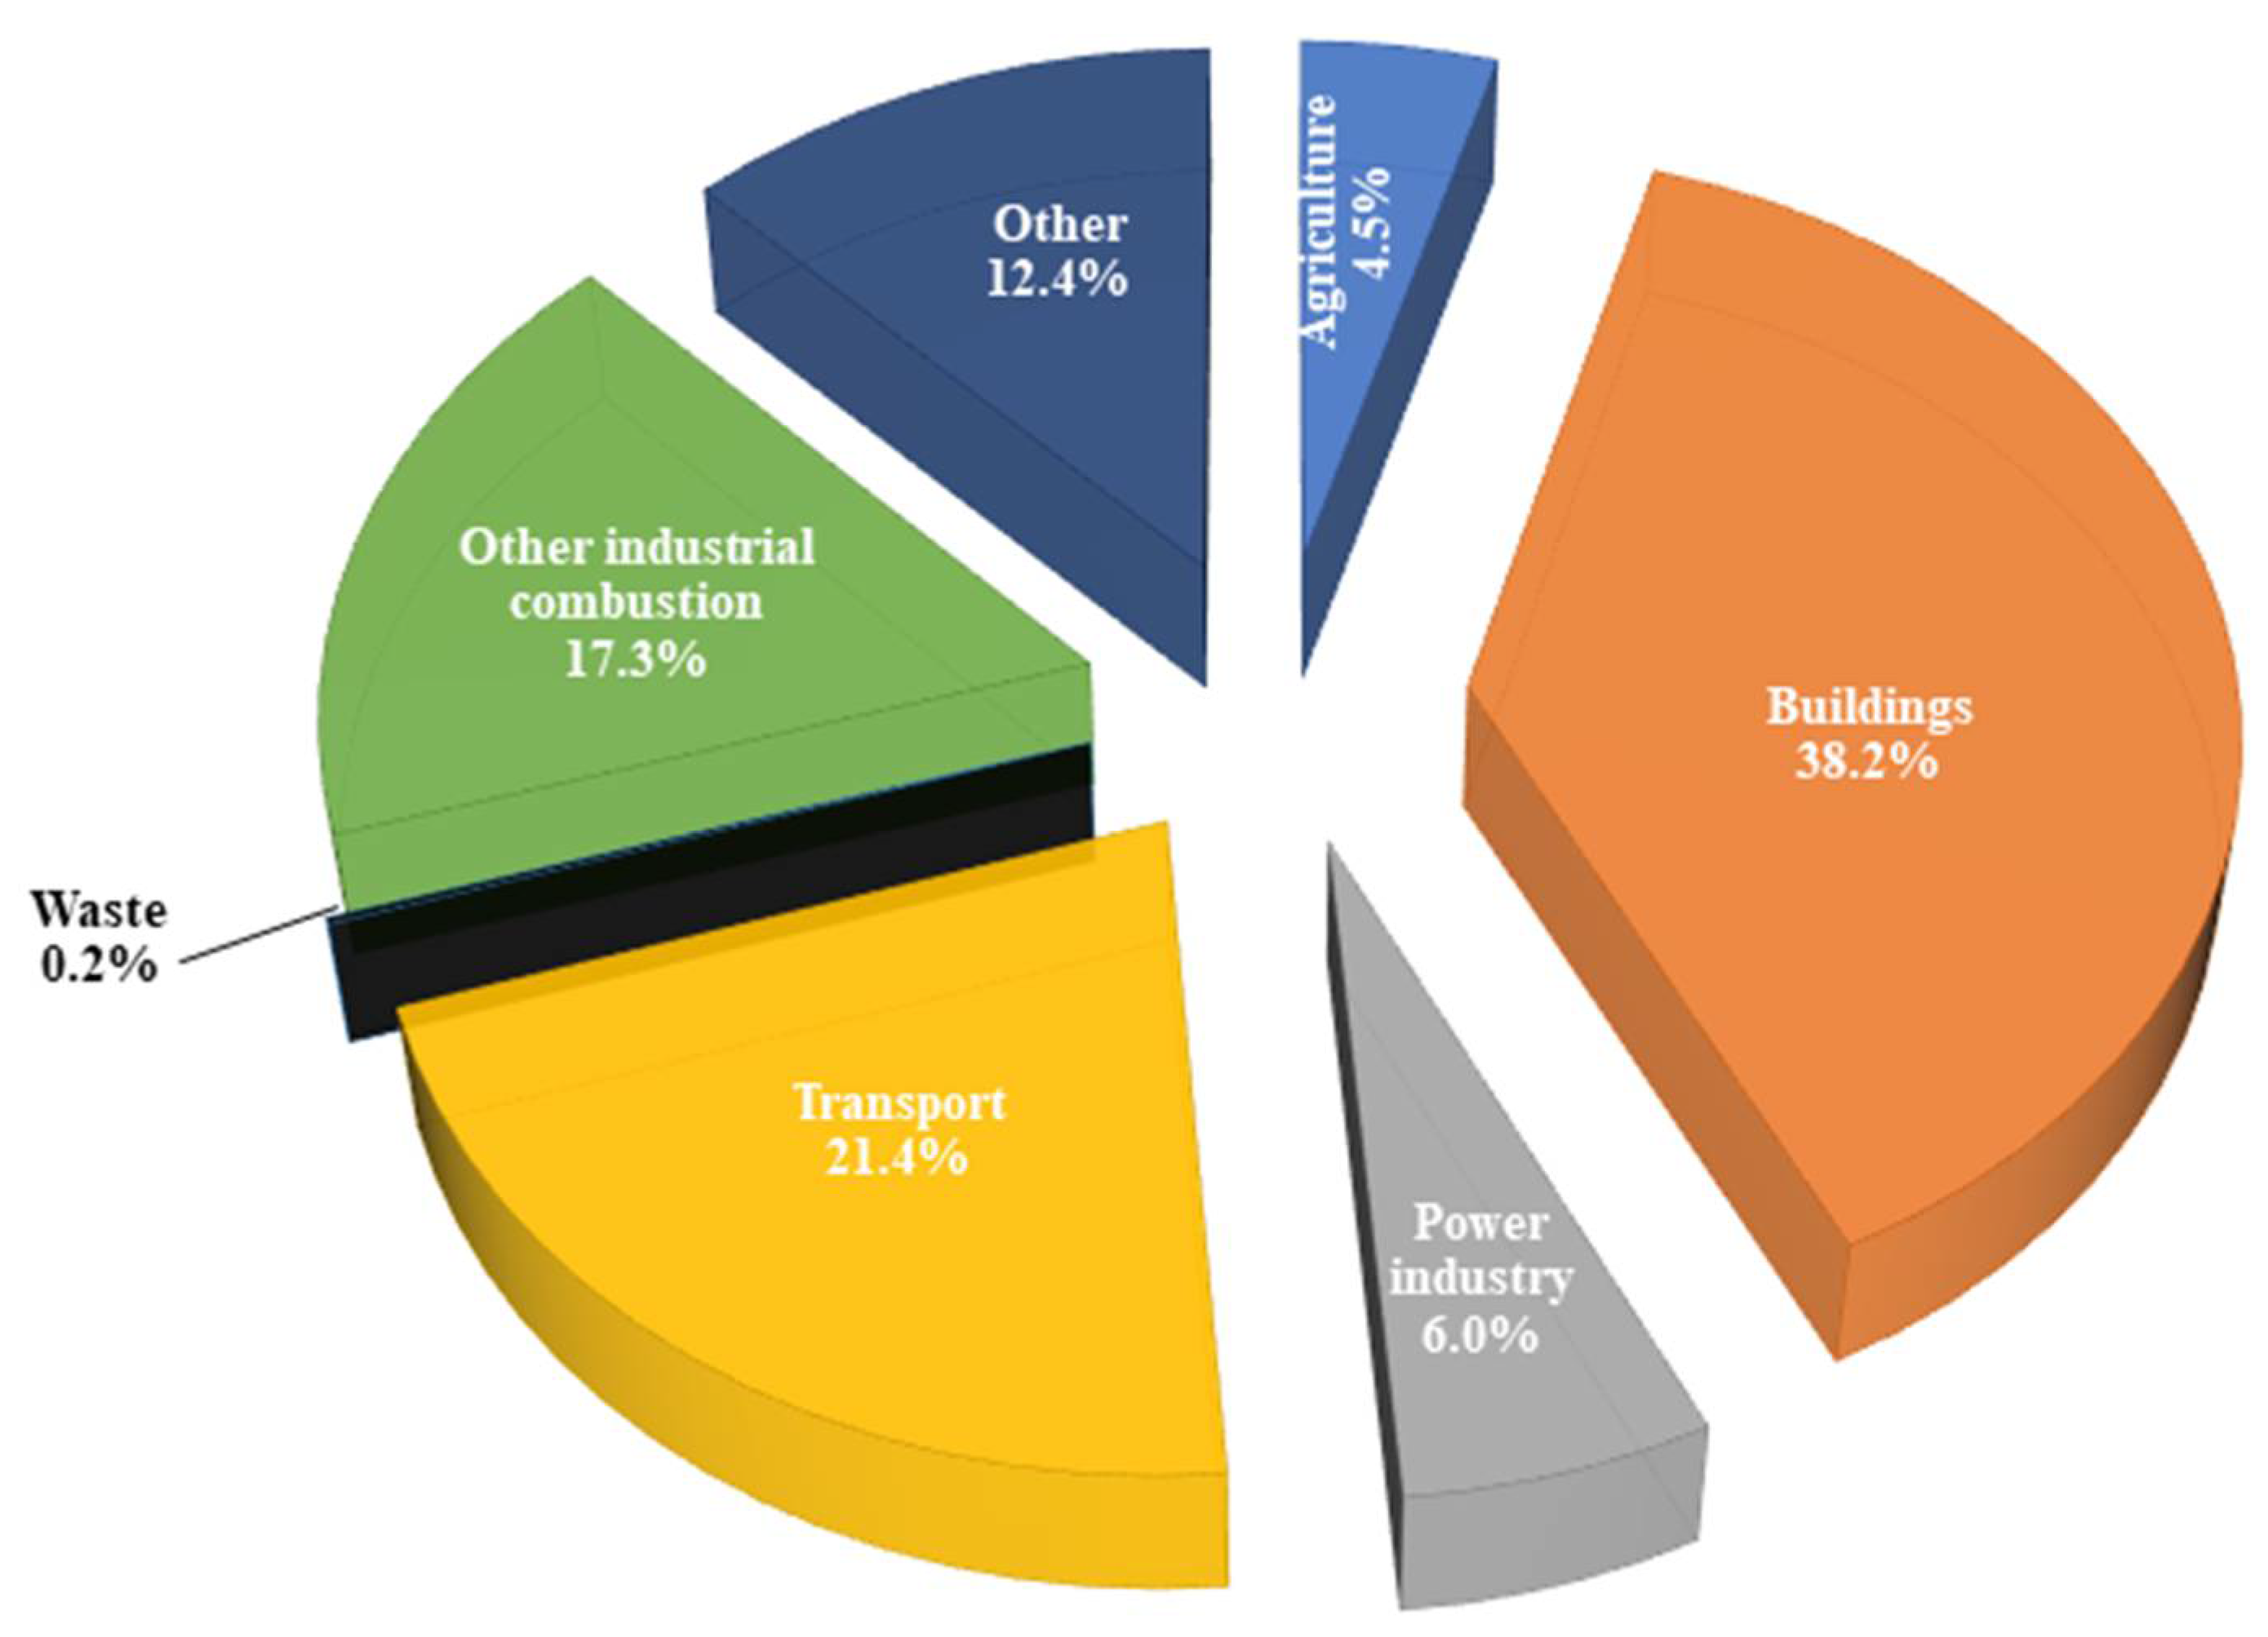
3.1. PM10 Emissions in North Africa

The 46-year evolution (1970–2015) of the PM10 emissions, in North Africa, is illustrated in Figure 3. Emission trends for the main activity sectors (namely power industry, other industrial combustion, transport, buildings, agriculture, waste, and other sectors) are also shown in this figure.
Power industry includes power and heat generation plants (public and auto-producers); Other industrial combustion includes combustion for industrial manufacturing and fuel production; Transport includes road transport, non-road transport, domestic aviation, and inland waterways; Buildings include small-scale non-industrial stationary combustion; Other sectors include industrial process emissions (non-metallic minerals, non-ferrous metals, solvents, and other product use, chemicals), agricultural soils (urea fertilization and lime application).
From 1970 to 2015, the total PM10 emissions in North Africa, including all sectors, grew from 93,145 t in 1970 to 355,006 t in 2015.
Globally, 43% of PM10 emissions in North Africa during this period were contributed by buildings, 16.6% by other industrial combustion, 13.7% by transport, 11.4% by other sectors, 9.6% by agriculture, 5.3% by the power industry, and 0.2% by waste (Figure 4).

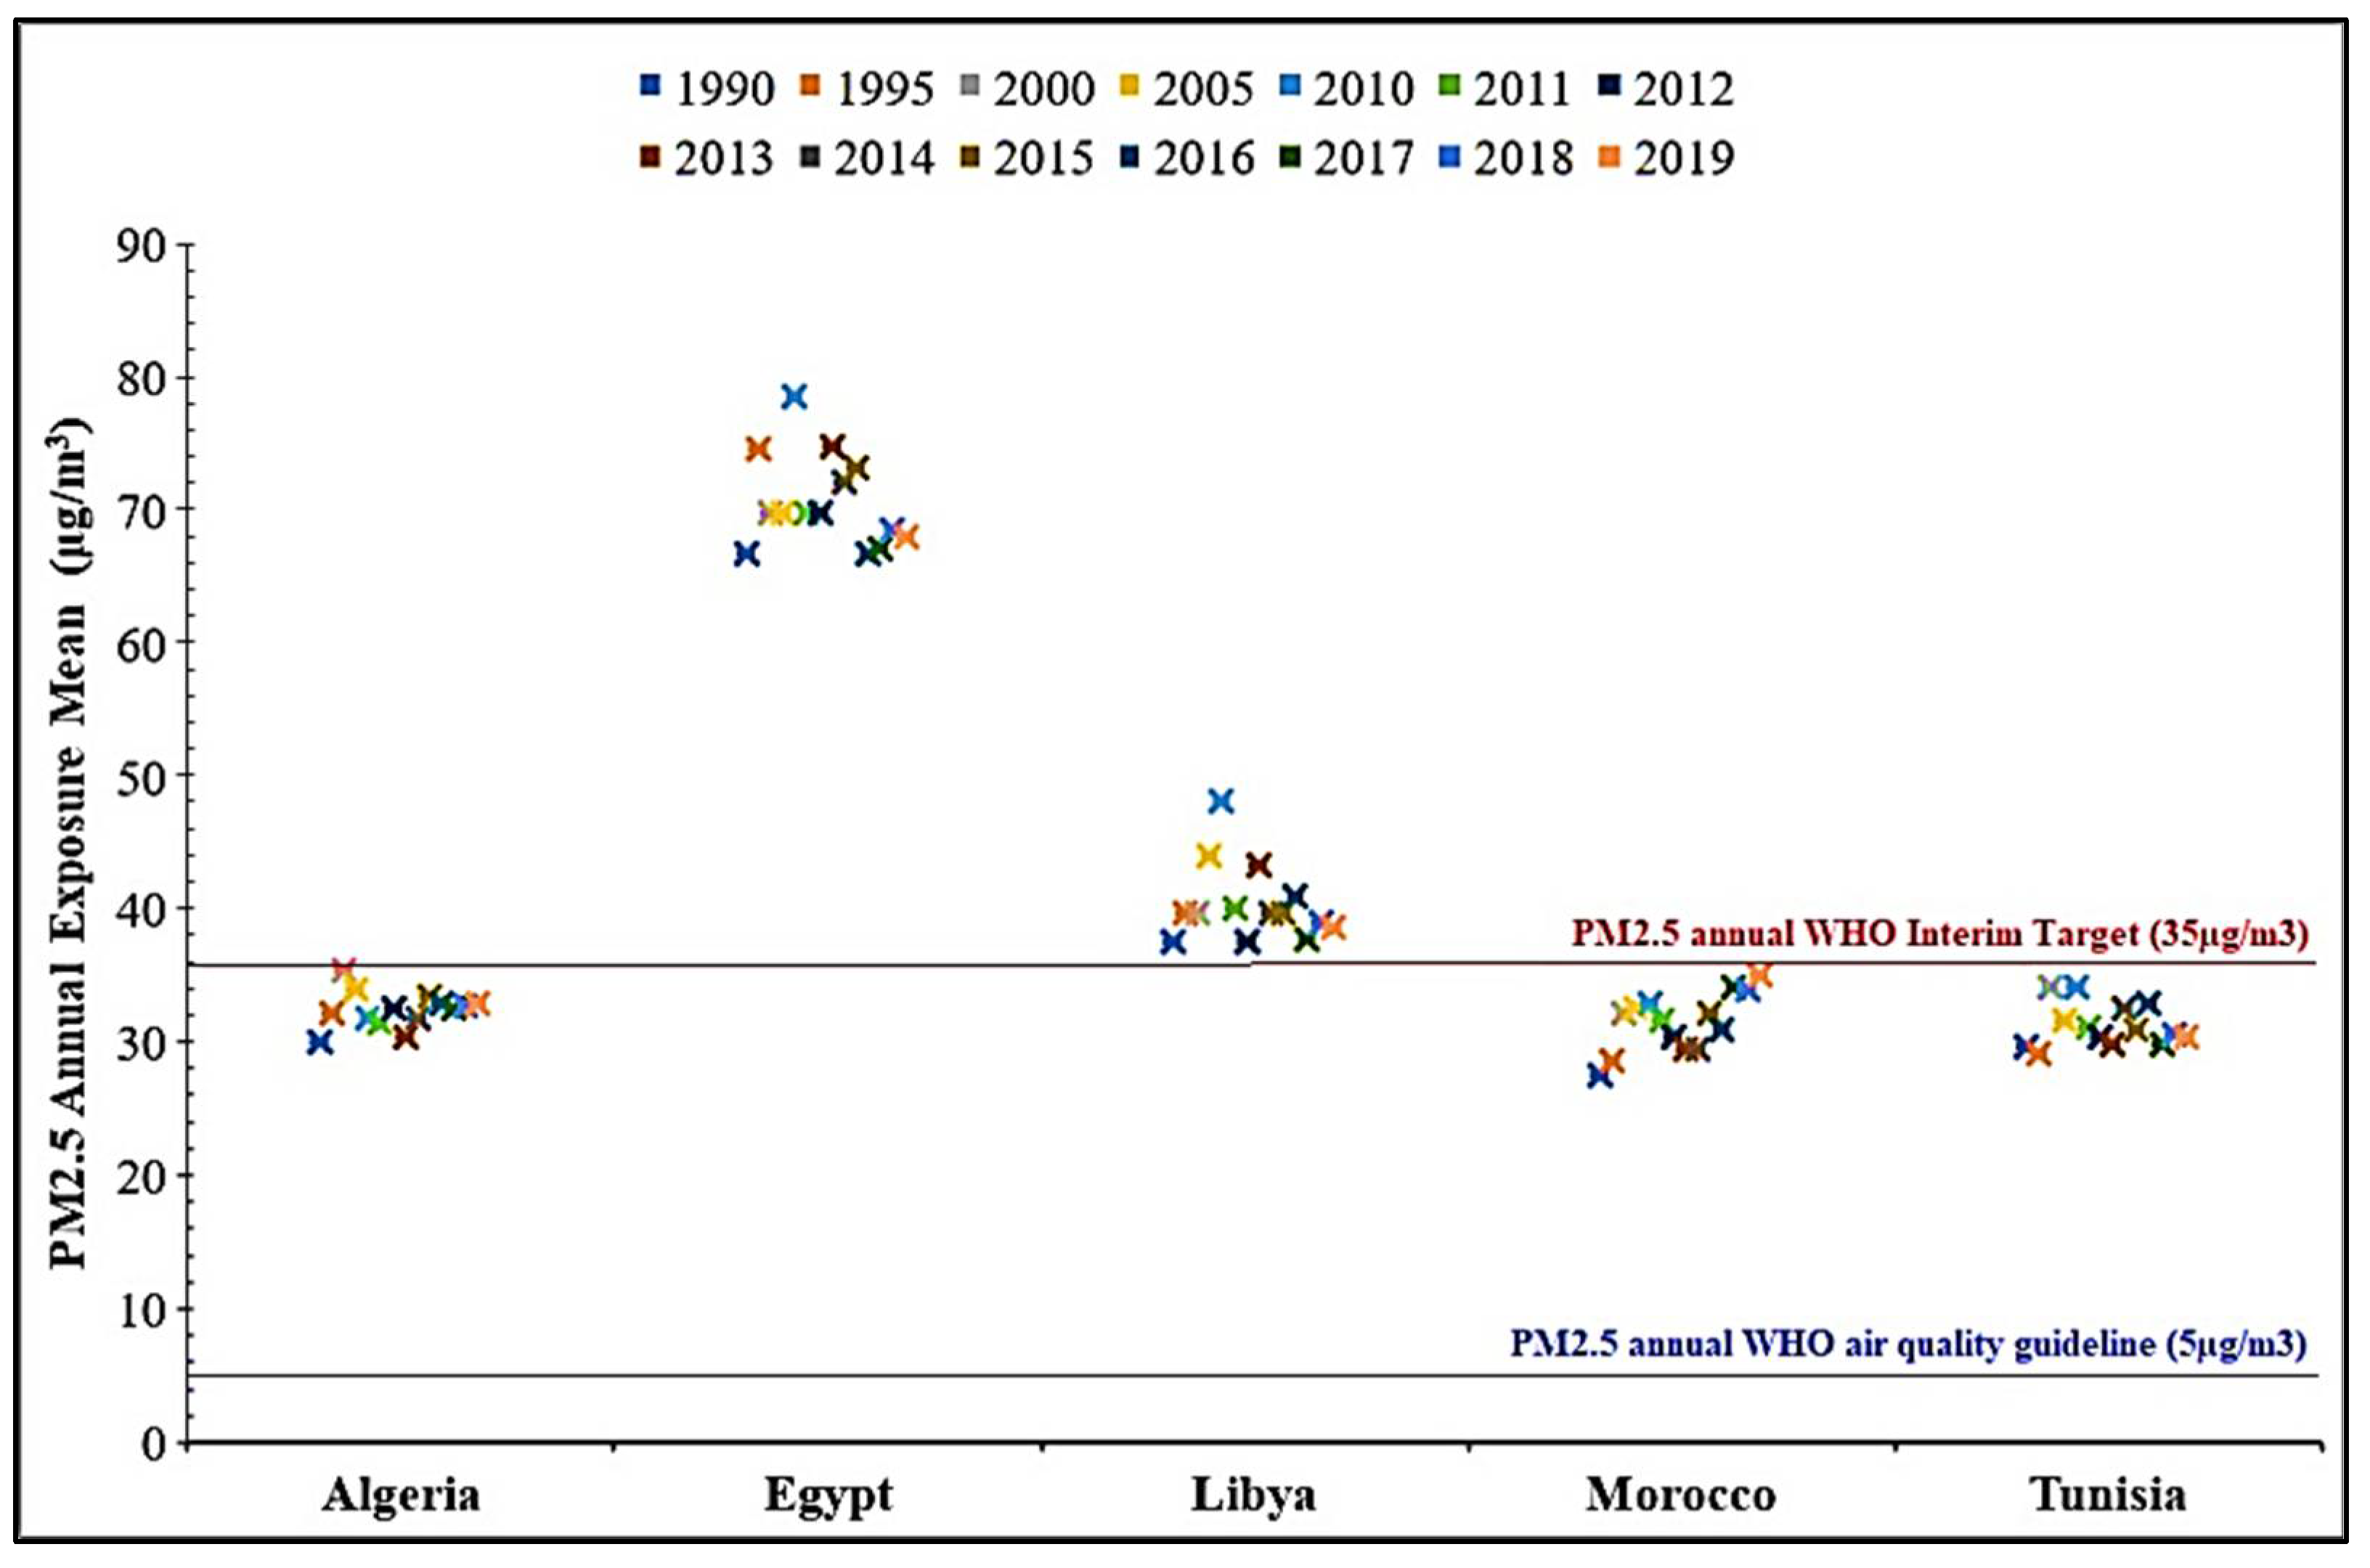
3.2. PM2.5 Emissions in North Africa

Figure 5 shows the evolution of PM2.5 emissions as well as the emission trends for the main activity sectors (namely power industry, other industrial combustion, transport, buildings, agriculture, waste, and other sectors), in North Africa over the period 1970–2015.
The total PM2.5 emissions in North Africa, including all the sectors, have evolved from 52,732 t in 1970 to 2,076,610 t in 2015.
The major emitter sector of PM2.5 in North Africa, over this period (Figure 6), was buildings with 38.2% of the total PM2.5 emissions, followed by transport (21.5%), other industrial combustion (17.3%), other sectors (12.4%), power industry (6%), agriculture (4.5%), and waste (0.2%).
Figure 7 presents the trend in PM2.5 annual exposure means in North African countries, over the period 1990–2019, compared to the PM2.5 annual WHO air quality guideline (AQG) and PM2.5 annual WHO Interim Target 1 (IT-1). In fact, in 2021, the WHO updated the global guidelines for air quality management [23] and set a new guideline value of annual PM2.5 concentrations which was set to 5 micrograms per cubic meter as the lower range of air pollution exposure, over which adverse health effects occur. In addition, the WHO has provided 4 interim targets of 35 µg/m3, 25 µg/m3, 15 µg/m3, and 10 µg/m3.
The exposure in all the North African countries continues to exceed the updated annual WHO AQG of 5 μg/m3 (Figure 7) which, according to WHO, are the lowest levels at which total, cardiopulmonary, and lung cancer mortality have been shown to increase with more than 95% confidence in response to long-term exposure to PM2.5 [24,25,26]. Furthermore, Egypt and Libya exceed even the first intermediate goal set by the WHO, Interim Target 1 (IT-1), which is 35 μg/m3 [23]. According to WHO, this level is estimated to be associated with about 15% higher long-term mortality than at AQG [24].

4. Conclusions

The present paper constitutes a review of PM2.5 and PM10 concentrations and their emission sectors in North Africa, from 1990 to 2019. Globally, 43% of PM10 emissions in North Africa were contributed by buildings, 16.6% by other industrial combustion, 13.7% by transport, 11.4% by other sectors, 9.6% by agriculture, 5.3% by power industry, and 0.2% by waste. For PM2.5, the major emitter sector in North Africa, during the same period, was also buildings with 38.2%, followed by transport (21.5%), other industrial combustion (17.3%). When PM2.5 concentrations in North Africa were compared to the annual WHO AQG, it was noticed that the PM2.5 annual exposure mean observed in the five North African countries, from 1990 to 2015, are far above the 5 µg/m3 annual WHO AQG.

Author Contributions

Conceptualization, M.T., A.B. and F.Z.; methodology, M.T.; validation, M.T., A.B. and F.Z.; formal analysis, M.T.; investigation, M.T.; data curation, M.T.; writing—original draft preparation, M.T.; writing—review and editing, M.T. and A.B.; visualization, M.T. All authors have read and agreed to the published version of the manuscript.

Funding

This research received no external funding.

Institutional Review Board Statement

Not applicable.

Informed Consent Statement

Not applicable.

Data Availability Statement

Data used in this study were downloaded from different free online data platforms: EDGAR (Emissions Database for Global Atmospheric Research), Climate Watch, Our World in Data, World Bank, and the State of Global Air.

Conflicts of Interest

The authors declare no conflict of interest.

References

  1. Manisalidis, I.; Stavropoulou, E.; Stavropoulos, A.; Bezirtzoglou, E. Environmental, and Health Impacts of Air Pollution: A Review. Front. Public Health 2020, 8, 14. [Google Scholar] [CrossRef] [PubMed]
  2. Singh, K.; Tripathi, D. Particulate Matter, and Human Health. In Environmental Health; IntechOpen: London, UK, 2021; Available online: https://www.intechopen.com/chapters/79308 (accessed on 24 August 2022). [CrossRef]
  3. Kim, K.H.; Kabir, E.; Kabir, S. A review on the human health impact of airborne particulate matter. Environ. Int. 2015, 74, 136–143. [Google Scholar] [CrossRef] [PubMed]
  4. Bettaieb, J.; Toumi, A.; Leffondre, K.; Chlif, S.; Ben Salah, A. High temperature effect on daily all-cause mortality in Tunis 2005–2007. Rev. Epidemiol. Sante Publique 2020, 68, 37–43. [Google Scholar] [CrossRef] [PubMed]
  5. Waha, K.; Krummenauer, L.; Adams, S.; Aich, V.; Baarsch, F.; Coumou, D.; Fader, M.; Hoff, H.; Jobbins, G.; Marcus, R.; et al. Climate change impacts in the Middle East and Northern Africa (MENA) region and their implications for vulnerable population groups. Reg. Environ. Chang. 2017, 17, 1623–1638. [Google Scholar] [CrossRef]
  6. Health Effects Institute. State of Global Air 2020; Special Report; Health Effects Institute: Boston, MA, USA, 2020; Available online: https://fundacionio.com/wp-content/uploads/2020/10/soga-2020-report.pdf (accessed on 25 August 2022).
  7. Correia, A.W.; Pope, C.A., III; Dockery, D.W.; Wang, Y.; Ezzati, M.; Dominici, F. The effect of air pollution control on life expectancy in the United States: An analysis of 545 US counties for the period 2000 to 2007. Epidemiology 2013, 24, 23–31. [Google Scholar] [CrossRef] [PubMed]
  8. Zhang, L.; Yang, Y.; Li, Y.; Qian, Z.M.; Xiao, W.; Wang, X.; Rolling, C.A.; Liu, E.; Xiao, J.; Zeng, W.; et al. Short-term and long-term effects of PM2. 5 on acute nasopharyngitis in 10 communities of Guangdong, China. Sci. Total Environ. 2019, 688, 136–142. [Google Scholar] [CrossRef] [PubMed]
  9. Tahri, M.; Bounakhla, M.; Zghaïd, M.; Benchrif, A.; Zahry, F.; Noack, Y.; Benyaïch, F. TXRF Characterization and Source Identification by Positive Matrix Factorization of Airborne Particulate Matter Sampled in Kenitra City (Morocco). X-ray Spectrom. J. 2013, 42, 284–289. [Google Scholar] [CrossRef]
  10. Ait Bouh, H.; Benyaich, F.; Bounakhla, M.; Noack, Y.; Tahri, M.; Zahry, F. Seasonal Variations of the Atmospheric Particles and Its Chemical Components in Meknes City—Morocco. J. Mater. Environ. Sci. 2013, 4, 49–62. Available online: https://www.jmaterenvironsci.com/Document/vol4/vol4_N1/7-JMES-275-2012-aitbouh_2.pdf (accessed on 25 August 2022).
  11. Croitoru, L.; Sarraf, M. The Cost of Degradation of the Environment in Morocco: Le Coût de la Dégradation de l’Environnement au Maroc (French). Environment and Natural Resources Global Practice Discussion Paper, No. 5 Washington, D.C. World Bank Group 2017. Available online: http://documents.worldbank.org/curated/en/741961485508255907/Le-Coût-de-la-Dégradation-de-l-Environnement-au-Maroc (accessed on 25 August 2022).
  12. Benchrif, A.; Benjamin, G.; Bounakhla, M.; Cachier, H.; Damnati, B.; Baghdad, B. Aerosols in Northern Morocco: Input pathways and their chemical fingerprint. Atmos. Environ. 2018, 174, 140–147. [Google Scholar] [CrossRef]
  13. Bouacha, M.I.; Safa, O.; Soudani, L.; Azzaoui, M.E.; Chafaa, M. Road Traffic and Canyon Street Effect on Air Pollution in Tiaret City, Algeria. Int. J. Ecosyst. Ecol. Sci. 2022, 12, 59–66. [Google Scholar] [CrossRef]
  14. Chekir, N.; Ben Salem, Y. What is the relationship between the coronavirus crisis and air pollution in Tunisia. Euro.-Mediterr. J. Environ. Integr. 2021, 6, 3. [Google Scholar] [CrossRef] [PubMed]
  15. Worldometers. Available online: www.worldometers.info/population/ (accessed on 1 June 2022).
  16. Statistica. Available online: www.statista.com (accessed on 1 June 2022).
  17. IPCC. Climate Change 2007: Synthesis Report. Contribution of Working Groups I, II and III to the Fourth Assessment Report of the Intergovernmental Panel on Climate Change; Core Writing Team, Pachauri, R.K., Reisinger, A., Eds.; IPCC: Geneva, Switzerland, 2007; 104p. [Google Scholar]
  18. D-Maps. Available online: https://d-maps.com/ (accessed on 1 June 2022).
  19. Roser, M. Our World in Data. University of Oxford. Available online: https://ourworldindata.org/ (accessed on 1 June 2022).
  20. EDGAR-Emissions Database for Global Atmospheric Research. Available online: https://edgar.jrc.ec.europa.eu/ (accessed on 1 June 2022).
  21. Climate Watch. Available online: https://www.climatewatchdata.org/ (accessed on 1 June 2022).
  22. Health Effects Institute. State of Global Air 2020. 2020. Available online: https://www.stateofglobalair.org (accessed on 1 June 2022).
  23. WHO ‘World Health Organization’. WHO Global Air Quality Guidelines: Particulate Matter (PM2.5 and PM10), Ozone, Nitrogen Dioxide, Sulfur Dioxide, and Carbon Monoxide. World Health Organization, 2021. Available online: https://apps.who.int/iris/handle/10665/345329 (accessed on 1 June 2022).
  24. WHO ‘World Health Organization’; Occupational and Environmental Health Team. WHO Air Quality Guidelines for Particulate Matter, Ozone, Nitrogen Dioxide, and Sulfur Dioxide: Global Update 2005: Summary of Risk Assessment. World Health Organization. 2006. Available online: https://apps.who.int/iris/handle/10665/69477 (accessed on 1 June 2022).
  25. Krzyzanowski, M.; Cohen, A. Update of WHO air quality guidelines. Air Qual. Atmos. Health 2008, 1, 7–13. [Google Scholar] [CrossRef]
  26. Pope, C.A.; Burnett, R.T.; Thun, M.J.; Calle, E.E.; Krewski, D.; Ito, K.; Thurston, G.D. Lung cancer, cardiopulmonary mortality, and long-term exposure to fine particulate air pollution. JAMA 2002, 287, 1132–1141. [Google Scholar] [CrossRef] [PubMed]
Figure 1. North Africa Region (source: https://d-maps.com/pays.php?num_pay=6&lang=en/, accessed on 25 August 2022 [18]).
Environsciproc 19 00003 g001
Figure 2. The total number of deaths by risk factor, measured across all age groups and both sexes in North Africa, over the period 1990–2019 (data source: https://ourworldindata.org/, accessed on 25 August 2022 [19]).
Environsciproc 19 00003 g002
Figure 3. North Africa PM10 emissions by Sector, over the period 1970–2015 (data source: https://edgar.jrc.ec.europa.eu/, accessed on 15 August 2022 [20]).
Environsciproc 19 00003 g003
Figure 4. Contribution of each sector to total PM10 emissions in North Africa averaged over the period 1970–2015 (data source: https://edgar.jrc.ec.europa.eu/, accessed on 25 August 2022 [20]).
Environsciproc 19 00003 g004
Figure 5. North Africa PM2.5 emissions by Sector over the period 1970–2015 (data source: https://edgar.jrc.ec.europa.eu/, accessed on 25 August 2022 [20]).
Environsciproc 19 00003 g005
Figure 6. The share of each sector in total PM2.5 emissions in North Africa averaged over the period 1970–2015 (data source: https://edgar.jrc.ec.europa.eu/, accessed on 25 August 2022 [20]).
Environsciproc 19 00003 g006
Figure 7. Trends in PM2.5 annual exposure mean in the North African countries, over the period 1990–2019, compared to the PM2.5 annual WHO air quality guideline and PM2.5 annual WHO Interim Target 1 (data source: www.stateofglobalair.org, accessed on 25 August 2022 [22]).
Environsciproc 19 00003 g007
Publisher’s Note: MDPI stays neutral with regard to jurisdictional claims in published maps and institutional affiliations.

