1. Introduction
The tropical wave season in Cuba spans months from May to October, a period that coincides with what is called the rainy season, although its influence can sometimes reach until November. The transit of these meteorological systems and their interaction with other systems disturbs the apparent stillness of the tropics, exacerbating the rainy processes and favoring, on occasion, the appearance of hail, tornadoes, waterspouts, or aeroavalanches, phenomena known in Cuba as severe local storms. In recent years, it has been found that 63% of the tropical cyclones that form in the Atlantic basin originate from tropical waves [
1]. In addition, it is conjectured that almost all the cyclones that occur in the eastern Pacific Ocean have their origin in the easterly waves when they cross the Caribbean Sea and Central America [
2].
A tropical wave is defined as a trough, or cyclonic curvature maximum, in the Eastern Trade Winds. The wave can reach its maximum amplitude in the lower troposphere or in the mean, or it may be a reflection of a cold low from the upper troposphere; or can also be an equatorward extension of the mid-latitude trough [
3].
Studies have shown that most tropical waves originate off the western coast of Africa. As an annual average, a total of 60 waves are generated with a standard deviation of 6, which propagate westward across the Atlantic at a speed of 10–21 kt. They have a period of 3–4 days and a wavelength of 2000–2500 km [
4], which makes it possible to capture them through synoptic-scale numerical models.
This paper analyzes the behavior of tropical waves that passed through Cuba and adjacent seas in the period 2012–2020. Taking into account its main statistical characteristics, the classifications by translation speed and associated convective activity are examined, as well as the temporal variability in terms of the number of months of duration.
2. Materials and Methods
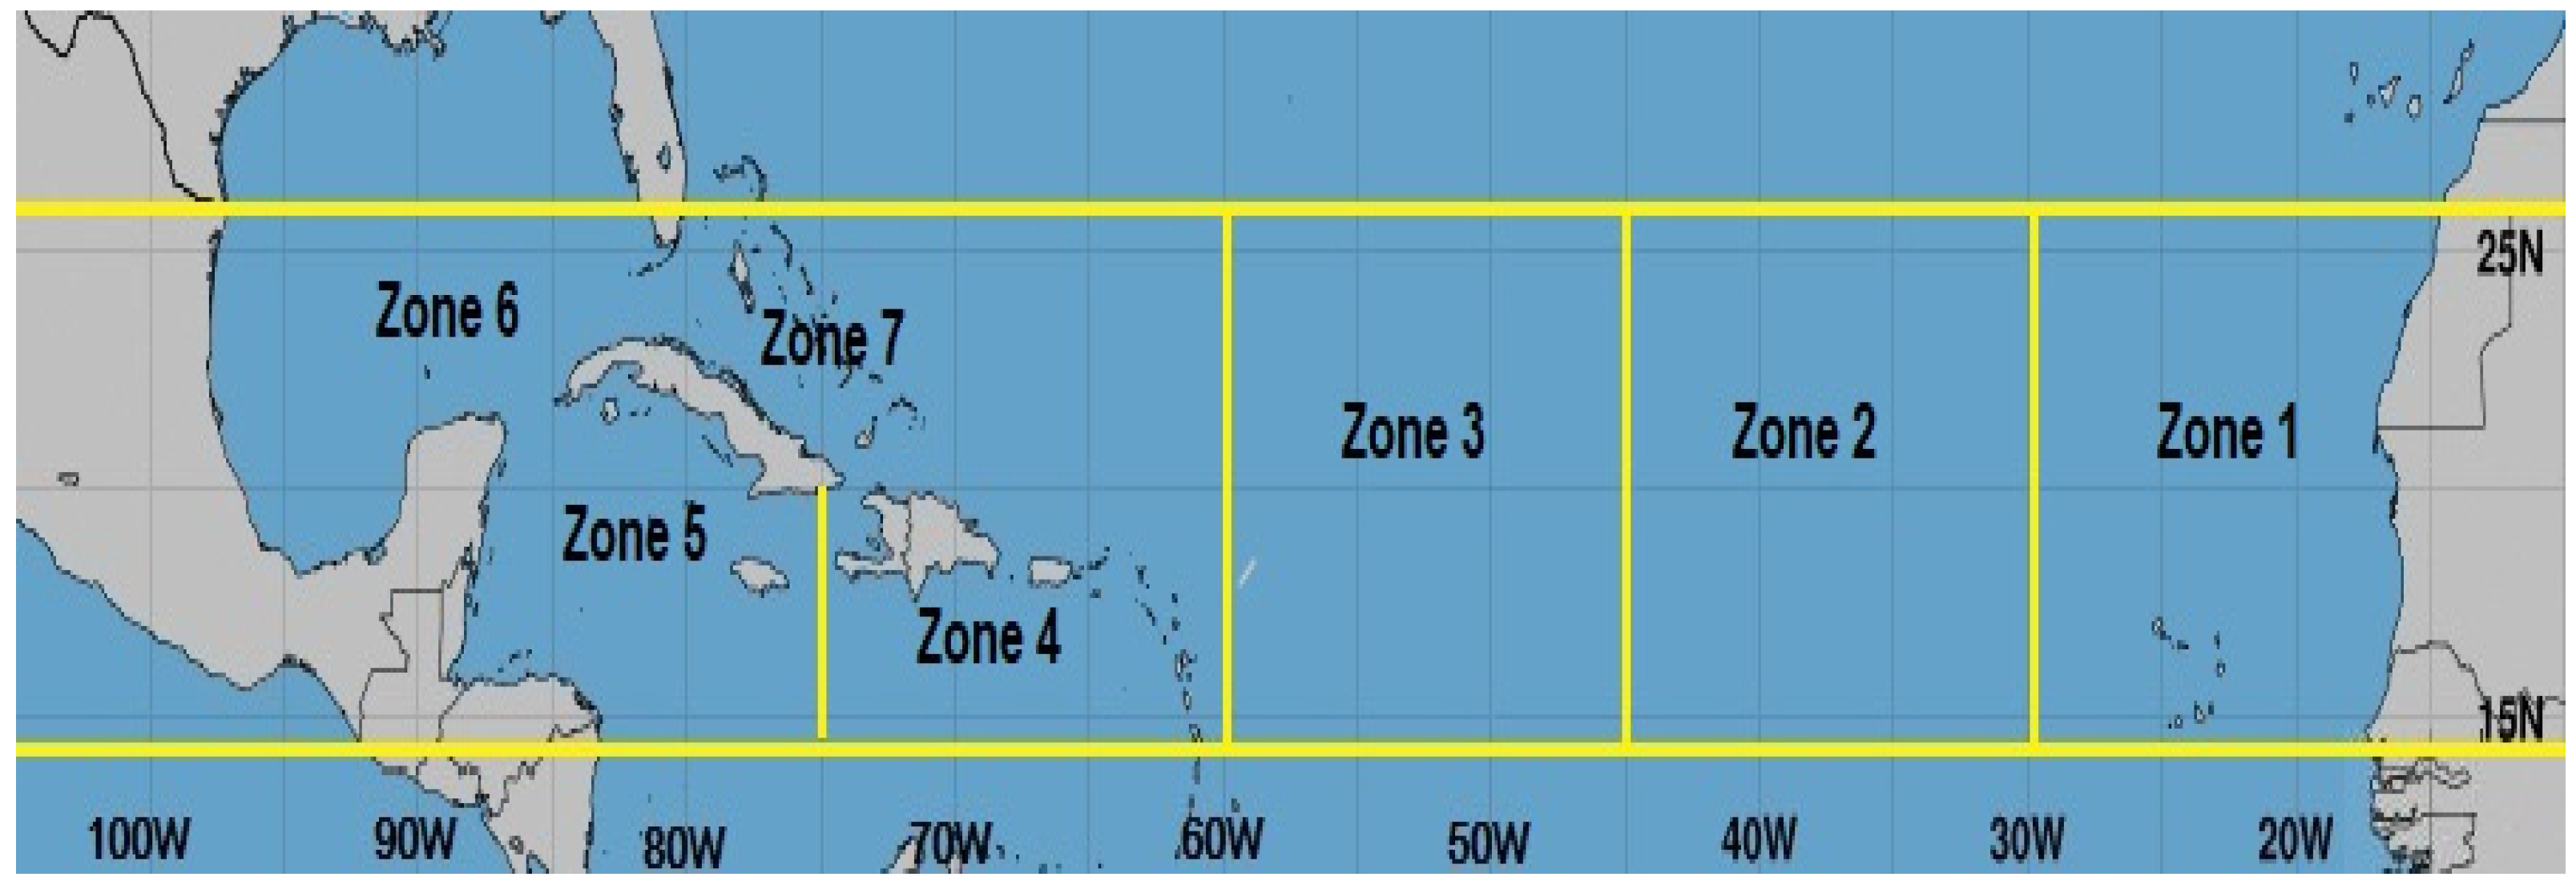
The study area was selected between approximately 15° and 25° north latitude and between 10° and 100° west longitude, including Cuba and adjacent seas (
Figure 1). This area was chosen because it is representative in the study of the trajectories of tropical waves that directly and indirectly affected the Cuban archipelago.
Information from the United States National Hurricane Center was consulted, using the Tropical Weather Discussions and the Tropical Weather Outlook. Also taken into account were the General Weather States, the rainfall data from the meteorological station network of the Cuban Institute of Meteorology, the pluviometric network of the National Institute of Hydraulic Resources, and the Hurricane Season Summaries (available at the InSMET website
https://www.insmet.cu/CiclonesTropicales/Resumendetemporada/, accessed on 15 October 2021). Surface maps; low (850 hPa and 700 hPa), medium (500 hPa), and high levels (200 hPa); and satellite images were analyzed.
Other criteria that refer to the formation, intensification, or dissipation zones of each of the systems were also considered (
Figure 1).
Regarding the place of training, five zones were considered:
Zone 1. Coasts of Africa and Eastern Atlantic, up to 30° west longitude.
Zone 2. Central Atlantic, between 30° and 45° west longitude.
Zone 3. Western Atlantic, between 45° and 65° west longitude.
Zone 4. Eastern Caribbean, comprising all the Caribbean Sea located to the east of the 75° west longitude meridian.
Zone 5. Western Caribbean, comprising all the Caribbean Sea located west of the 75° west longitude meridian.
For intensification and dissipation, the western Caribbean (zone 5) and the two zones indicated below were considered:
Zone 6. Gulf of Mexico, including the entire geographical area.
Zone 7. Bahamas, including the geographical area of the same name.
Taking into account the translation speed (TS) with which the waves travel, they were classified into three groups: slow (TS < 15 kt), normal (15 ≤ TS ≤ 25 kt), and fast (TS > 25 kt). Another classification was based on the cloudy pattern of the tropical waves: active (those that influenced with intense rains and/or severe weather) and inactive (those that, although their axis crossed the country, the cloudy conglomerate did not have an influence, and therefore, cloudiness and rainfall were insignificant).
The data processing was carried out in Microsoft Excel, version 2019. The tables and graphs that are presented hereafter were obtained from the aforementioned processing. The average and percentage values were calculated taking into account the distribution of annual and monthly frequencies.
3. Results and Discussion
3.1. Annual and Monthly Behavior
During the study period, a total of 579 tropical waves originated in the Atlantic basin, of which 323 passed through Cuba, which represents approximately 56% of the total waves formed.
Table 1 shows that the months June-July-August turned out to be the ones with the highest arrival of these systems to the archipelago, highlighting the month of July with a total of 93 waves, which represents 29% of the total waves that travelled through Cuba. In order of importance, this is followed by the months of August and June, with quantities of 65 and 58 systems, respectively. The results achieved highlight the fact that the least number of tropical waves to reach the archipelago occurs in the months of May and November, with 9 and 18 waves, respectively.
A maximum of 48 waves is reflected in the year 2019; the minimum is 19 in 2013. However, in the last nine years, there has been an increase of 91 waves (28% of the total number of waves that reached Cuba), taking into account the results obtained in Añón (2012) [
5].
3.2. Zone of Formation, Dissipation, and Intensification
According to the zone of formation, in
Table 2, it can be seen that more than half of these systems were formed on the western African coast and in the easternmost end of the Atlantic Ocean (zone 1), with a total of 234 systems, highlighting 2018 with 33 waves.
Most of the dissipations and intensifications occurred in the western Caribbean (zone 5) and in the area of the Gulf of Mexico (zone 6) after passing through Cuba (
Table 3a,b).
Table 3a shows that the year 2012 presents the greatest number of dissipations; of which, five of the ten waves that dissipated in that year did so in the Gulf of Mexico. Regarding the intensifications (
Table 3b), a maximum is appreciated in the year 2020 with a total of five waves that became tropical cyclones, mainly in the Eastern Caribbean (zone 4) and Western Caribbean (zone 5).
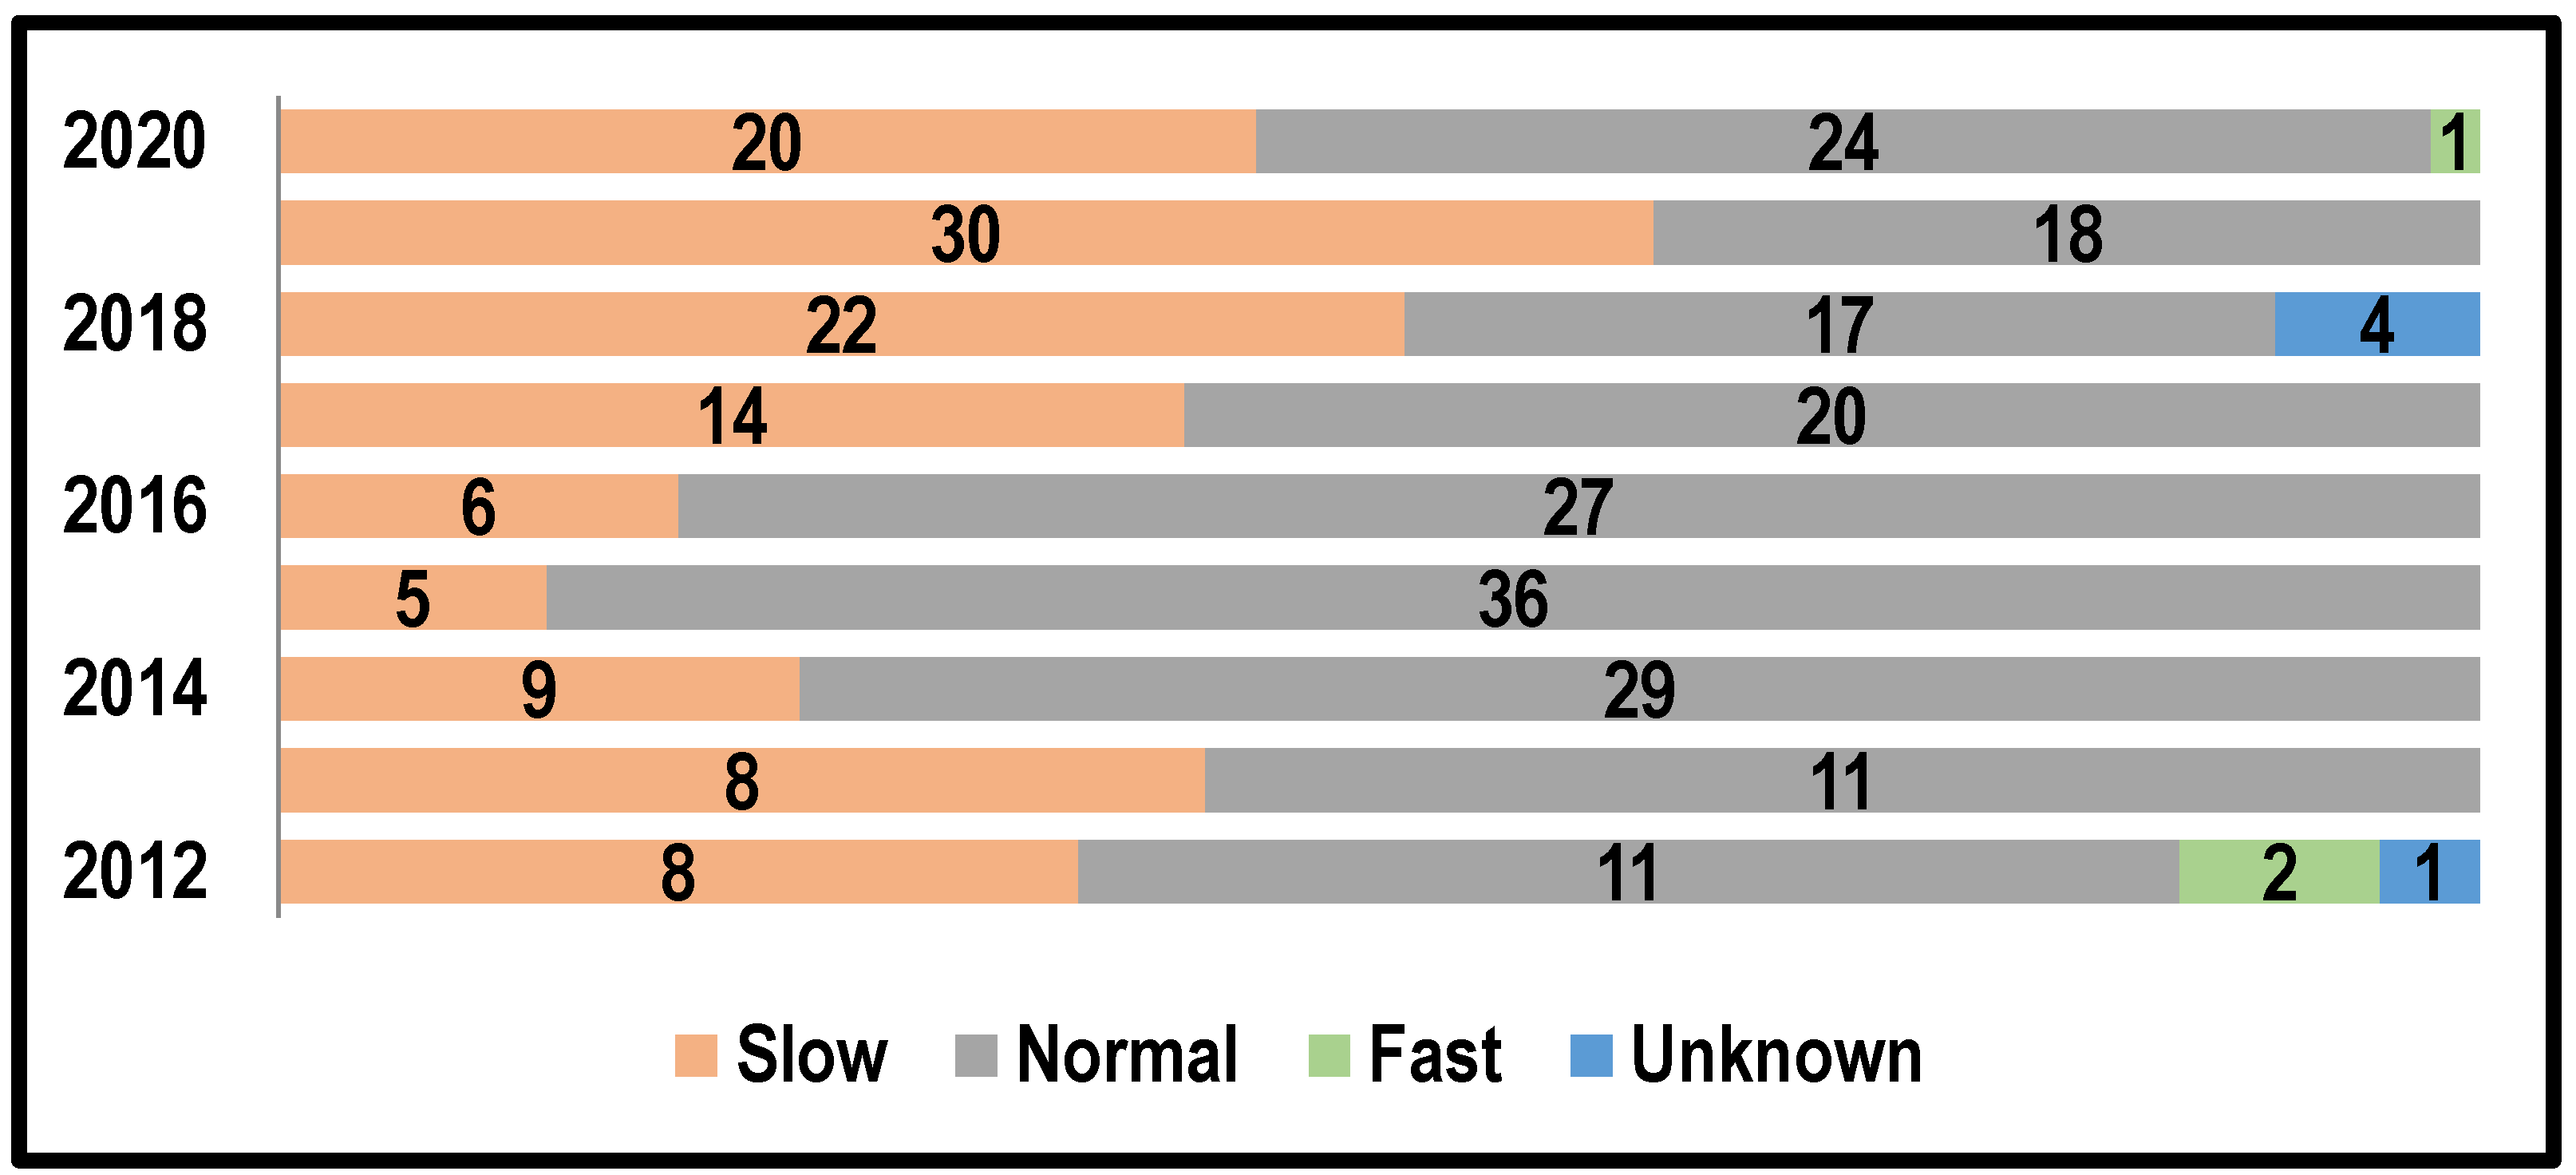
3.3. Translation Speed
Figure 2 shows that most of the waves moved at “normal” speeds, which represents 60% of the total waves that arrived in these years, with a maximum in 2015. However, in 2012 and in 2018, there were five waves whose TS is unknown, due to the fact that, on certain occasions, they are poorly defined in satellite images, which makes their monitoring difficult. The least frequent were those considered “fast”, represented by three waves during the years 2012–2020.
3.4. Precipitation and Associated Severe Phenomena
Of a total of 323 waves that arrived in Cuban territory, 305 traveled through the eastern half and 219 through the western half. In both areas, “active” waves predominated, which provided rain due to their interaction with other synoptic systems or because they had enough energy to generate rain by themselves, highlighting the year 2020 where the number of active waves more than doubled the total number of inactive waves that arrived that year (
Table 4).
Examining each of the events considered severe (
Table 5), it can be observed that the hail fall was the most important event in both, being higher in the eastern half, with a total of 24 waves that generated this phenomenon. The appearance of waterspouts was mainly reported in the western part of the country, with one case in the eastern part. The year 2020 stands out as the year with the greatest appearance of severe phenomena favored by the passage of these systems through the western half, while in the eastern half, the equivalent year is 2016. As for intense rain (accumulating ≥100 mm within 24 h), the years 2017 and 2020 stand out with the largest number of waves that originated this phenomenon, with the number of occurrences in the eastern half being higher than in the western half in the year 2017, and then the opposite in the year 2020.
In these intense rains, the convective rain must have a great weight in the initial moments; later, the stratiform precipitation contributes to locally registering accumulations equal to or greater than 100 mm within 24 h. The weight of convective precipitation is also noted, due to the occurrence of severe phenomena associated with these tropical systems [
6].
4. Conclusions
The study carried out on tropical waves in the period 2012–2020 revealved a total of 579 tropical waves in the Atlantic basin, of which 323 passed through Cuba (representing 56% of the total), confirming that they are not only important in the possible formation of tropical cyclones, but also in the accumulation of rain. More than 50% of the waves originated in the African and Eastern Atlantic coasts (zone 1), the most frequent being those that moved with “normal” speeds. Over the western Caribbean Sea, 52% of the tropical waves dissipated after passing through Cuba, while 50% of the intensifications of these systems occurred in the same area. The transit of tropical waves through the archipelago presented severe phenomena and/or intense rains associated with “active” waves. In the years 2012–2020, the activity of tropical waves was 28% higher than that of the 2003–2011 period, a behavior that was reflected in the months of June, July, and August, with a difference of 21% compared to what was found in Añón (2012).


