Proceeding Paper

Drop Size Distribution Retrievals for Light Rain and Drizzle from S-Band Polarimetric Radars †

1
Department of Electrical and Computer Engineering, Colorado State University, Fort Collins, CO 80523, USA
2
NASA Goddard Space Flight Center (GSFC) Wallops Flight Facility, Wallops Island, VA 23337, USA
3
Science Systems and Applications, Inc., Lanham, MD 20706, USA
4
Department of Atmospheric Science, Colorado State University, Fort Collins, CO 80523, USA
*
Author to whom correspondence should be addressed.
Presented at the 5th International Electronic Conference on Atmospheric Sciences, 16–31 July 2022; Available online: https://ecas2022.sciforum.net/.
Environ. Sci. Proc. 2022, 19(1), 23; https://doi.org/10.3390/ecas2022-12794
Published: 14 July 2022
(This article belongs to the Proceedings of The 5th International Electronic Conference on Atmospheric Sciences)

Abstract

:
Measurements of full drop size distribution (DSD) spectra were used as input for scattering calculations to derive fitted equations for light rain and drizzle for estimating the mass-weighted mean diameter, Dm, from radar reflectivity (Zh) at S-band. Testing was performed using Zh measured S-band polarimetric radars over two different disdrometer locations versus Dm from disdrometer measurements. Consistent results were obtained but only for Zh < 18 dBZ for light rain and <5 dBZ for drizzle. Additionally, gridded radar data were used to identify light rain and drizzle regions, and their Dm histograms were compared with those derived from stratiform and convective rain regions.

1. Introduction

The unbiased measurement of drizzle and light rain is per se difficult because of the large areal coverage and nonuniform intensities along with poor knowledge of drop size distribution shapes, especially over the oceans. Drizzle from shallow clouds, typically marine stratocumulus, is persistent over large areas which makes them important to global climate (e.g., [1]). Evaporation of stratocumulus drizzle that occurs below the cloud base is an important driver of cooling of the marine boundary [2]. Knowledge of stratocumulus drizzle has largely been obtained near cloud base using high resolution optical probes on aircraft (e.g., cloud droplet probe (CDP) and 2D-cloud probe [3,4]. The maximum drizzle drop size is typically < 300 μm and areal mean R < 10 mm/day from shallow clouds of thickness < 700 m [2]. The spectral shapes are assumed to be truncated exponentials and the reflectivity-rainfall rate, i.e., Z-R, power laws are derived from a/c probe data and fall speed assumptions are adjusted for pressure. They are used to estimate R from reflectivity measurements made by scanning radars.
Light rainfall (loosely defined as R < 1 mm/h) can occur either from stratiform regions of MCS, (Mesoscale Convective System) warm rain clouds, or shallow clouds, with max D typically < 1.5 mm. Light rain can also have a drizzle mode so the spectrum can be described as bimodal with two exponentials [3]. Heavier convective rain can also have a drizzle mode in addition to the precipitation mode with large drops. The advantage of polarimetric radar is most evident in moderate-to-heavy rain rates.
Polarimetric radars use differential reflectivity (Zdr) in addition to the radar reflectivity (Zh) for horizontal polarization to determine the two main parameters governing the rain drop size distributions [5]: namely, the mass-weighted mean diameter, Dm, and the normalized intercept parameter, NW. The third parameter is the spectral width (σM); these parameters are defined in terms of moments M3 (3rd moment) and higher and, thus, are independent of the shape of the distribution. One built-in assumption is that the drops are very close to oblate (except the larger ones with D > 3 mm which have a flattened base) and that the ratio of minor-to-major chords decreases with increasing size in accordance with theoretical models, for example [6]. For light rain, however, Zdr approaches 0 dB because of the dominance of the small drops which are almost spherical in shape. To illustrate this, we show in Figure 1 the results from S-band scattering calculations using measured 3 min drop size distributions (DSD) and assuming the equilibrium shapes of Beard–Chuang [6]. Panel (a) of Figure 1 shows the variation of Dm with Zdr, and panel (b) the variation of Dm with Zh (units of dBZ). The DSDs represent measurements in light rain, moderate rain, and heavy rain (all in green), as well as those in drizzle (shown in orange).
Figure 1a shows that for DSDs with 0.70 < Dm < 1 mm (light rain) and 0.1 < Dm < 0.5 mm (drizzle), the S-band Zdr values become rather small (< 0.25 dB) and fall off very sharply, thus implying that estimating Dm from Zdr will have large uncertainties associated with it. On the other hand, Dm shows two distinct branches that vary with Zh which suggests that Zh may be (relatively) more suitable for estimating Dm. Note that the definition of drizzle and light rain in terms of ranges of Dm is unconventional but reasonable since Zh is strongly weighted by the 6th moment which is subject to large sampling errors.
In this paper, we examine the use of S-band Zh for estimating Dm using radar measurements over disdrometer locations. The DSD measurements derived from two different types of disdrometers are used to calculate Dm values every three minutes which are then correlated with radar reflectivities for a number of events. Nonlinear least squares method was used for estimating Dm from Zh. Histograms of Dm for light rain are compared with those identified as stratiform and convective rain regions.

2. Disdrometer Data and Radar Measurements

2.1. Disdrometer Data

All ground-based DSD measurements for this study were obtained from two collocated disdrometers at three climatically different locations, all in the US: (i) from Greeley, Colorado, (GXY) a semiarid climate; (ii) Delmarva peninsula, a midlatitude coastal region (WFF); and (iii) Huntsville, Alabama, (HSV) a subtropical climate. At each site, a 2D-video disdrometer [7,8] and a meteorological particle spectrometer (MPS) [9] were installed within a 2/3-scaled DFIR (double fence intercomparison reference windshield [10]. By combining the MPS and 2DVD measurements, the full DSD spectra ranging from 100 μm to large drops were constructed, e.g., for every 3 min, for every event. The S-band scattering simulations shown earlier in green in Figure 1 had used 3 min DSDs from GXY and HSV.
For cloud droplet and drizzle DSDs, aircraft measurements using a 1 s cloud droplet probe (CDP) and a fast 2D-cloud probe were used to sample marine stratocumulus clouds during a campaign off the coast of Chile [11]. There was a total of 4142 quality-controlled 1 s DSDs. These data have been previously used in [12] to examine DSD characteristics and their latitude variability. The orange points in Figure 1 represent the S-band simulation results using these measurements.

2.2. S-Band Radars

Two S-band polarimetric radars have been used for this work, (i) CSU-CHILL radar based in Greeley, Colorado, [13] and (ii) NPOL radar based in the Delmarva peninsula [14]. Both radars have been used for numerous studies relating to rain microphysics.

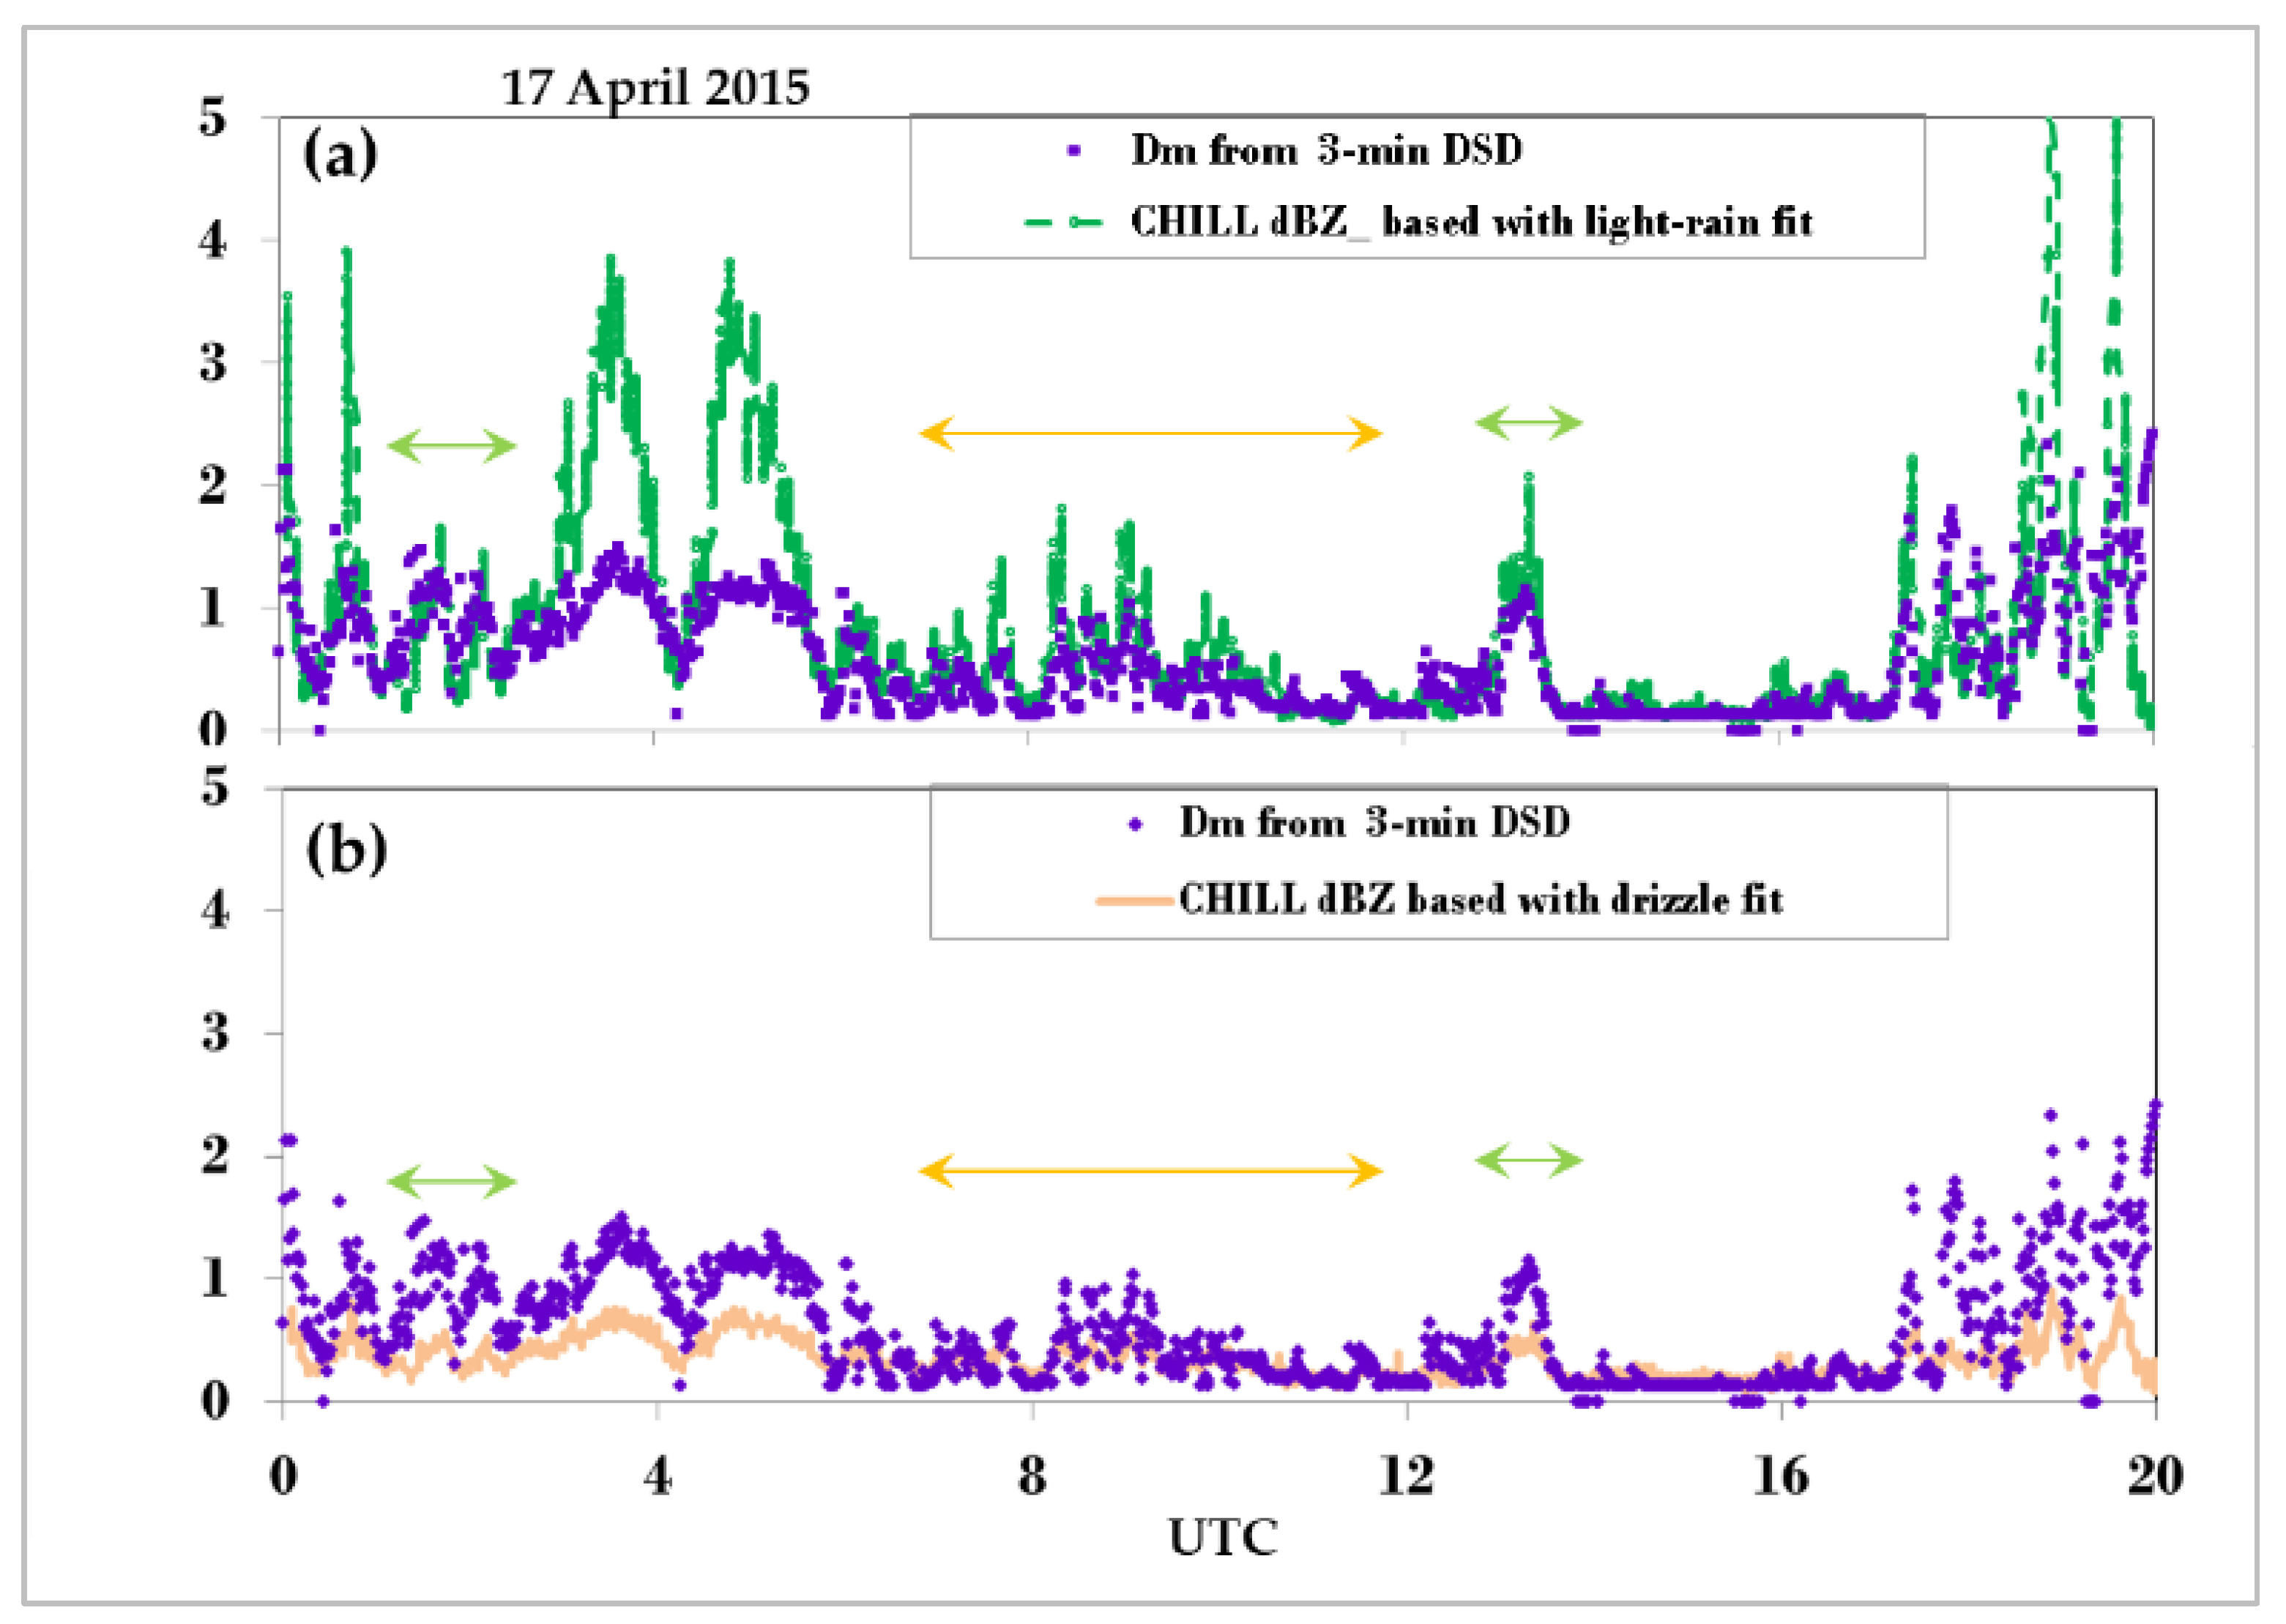
2.2.1. Greeley Event

At the Greeley site, the disdrometer location was nearly south of the radar at a range of 13 km. DSD data from many events were recorded and for some of the events, the CSU-CHILL radar was used to scan over the disdrometer site (see, for example, [15,16]). The CHILL radar uses a dual-offset Gregorian antenna that produces a main lobe pattern with high polarization purity and very low side lobe levels [13]. These low side lobes minimize ground clutter contamination even at the short (13 km) range to the disdrometers.
One of the events, which occurred on 17 April 2015, was part of a midlatitude synoptic-scale cyclone that had produced a variety of rain types ranging from fine drizzle and light rain to modest thunderstorms. The whole event lasted over 18 h from 02:00 to 20:00 UTC. Radar scans were made at regular and closely spaced time intervals, approximately every 5 min and 30 s.
The reflectivity data from the radar were extracted over the disdrometer site and overlaid over the disdrometer-based Dm = M4/M3. The black points in Figure 2 show the variation of Dm from the 3 min DSDs from MPS and 2DVD versus the Zh measured by radar. There seems to be good overlap throughout the whole Dm–Zh range. Of particular interest here are the DSDs with Dm < 0.35 mm values which can be considered as drizzle and those in the 0.7 to 1.0 mm range which can be considered as light rain.

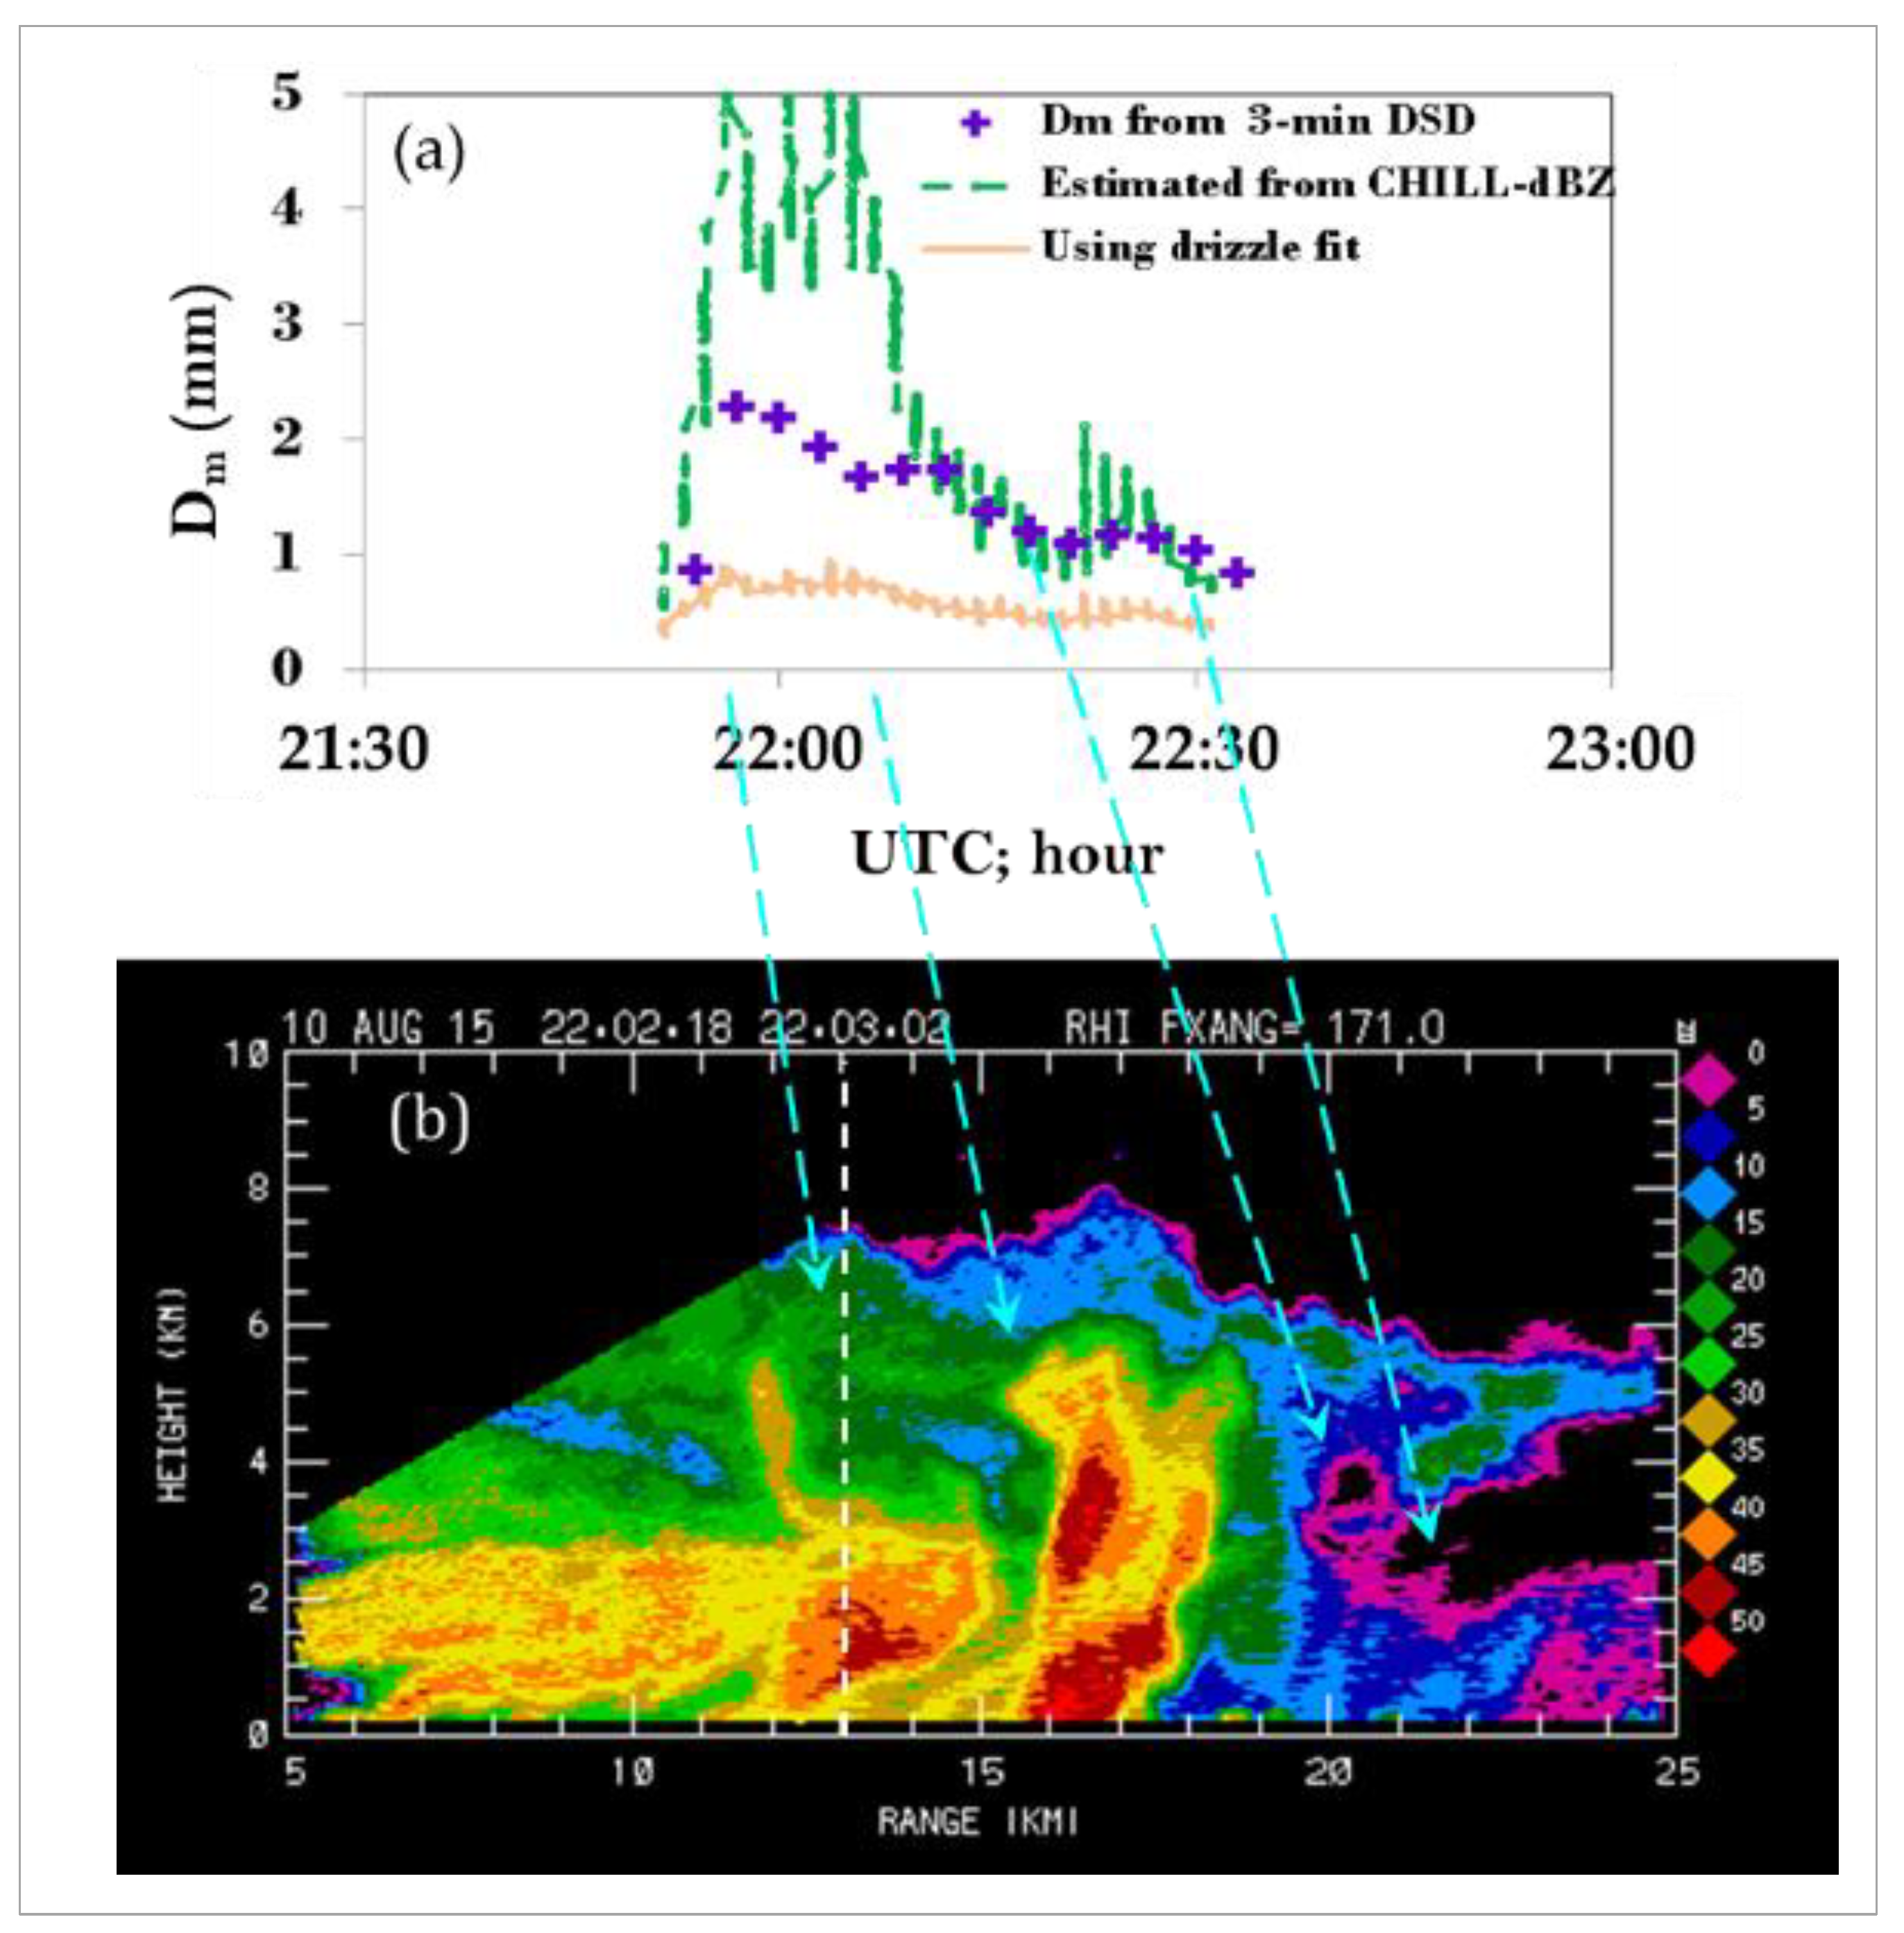
2.2.2. Event over Delmarva Peninsula

The second example presented here is the outer rain bands of category-1 Hurricane Dorian that passed over the MPS/2DVD site in the Delmarva peninsula on 6 September 2019. It produced long periods of (largely) stratiform rain over the disdrometer site. The NPOL radar, 38 km from the site, made regular, preprogrammed, scans for the entire event. DSD characteristics have been examined in [17] and a 1-D super-particle Lagrangian model (called McSnow; [18]) has been used to evaluate the importance of various microphysical processes [19].
As in the Greeley example in Figure 2, the S-band radar data were extracted over the disdrometer site (37.5 km range) and compared with our S-band simulation results. They are shown in Figure 3. Once again, the Dm values are from the disdrometer measurements, and the Zh data are from the S-band radar (similar to Figure 2), and, once again, good overlap is seen. Note, however, only a few points lie below Dm of 0.8 mm, implying relatively heavier rain rates than drizzle and light rain.

2.3. Fitted Equations

Since the above comparisons (plus several other events not shown here) have shown good agreement between simulations and measurements, fitted equations were derived to estimate Dm from S-band radar Zh. Separate equations were derived for drizzle and light rain. The fitted curves are shown in Figure 4. From the two curves, one can expect the equation for drizzle to have fewer uncertainties (parameterization errors) than the equation for light rain.
The fitted equations were used to derive Dm for the 17 April 2015 event at Greeley. As mentioned earlier, this event included light rain as well as drizzle.
Panels (a) and (b) of Figure 5 show the estimated Dm from the radar Zh over the disdrometer site using the fitted equations for light rain (green) and drizzle (orange), respectively. The 3 min DSD-based Dm values are also shown in both panels (purple). For Dm < 1 mm, the light rain equation in panel (a) agrees reasonably well with the DSD-based Dm’s, for example, between 01 and 02 h and 13 and 14 h UTC, indicated with green arrows. The agreement is poor at 07–11 UTC when Dm was < 0.5 mm much of the time, marked with an orange arrow, and for this period, the drizzle equation is seen to yield significantly better agreement. For Dm > 1 mm, neither equation yields good agreement.
Another example event, shown in Figure 6, occurred on 10 August 2015 when a 500 hPa ridge pattern was affecting Colorado. Based on the Denver 12 UTC radiosonde data, wind speeds below 10 km MSL were less than 15 ms−1 and the precipitable water content was ~22 mm. In this typical late summer synoptic pattern, an area of nonsevere thunderstorms passed from south to north across the CHILL radar vicinity between approximately 21:55 and 23:00 UTC.
Panel (a) of Figure 6 shows the comparisons between the 3 min DSD-based Dm and the radar retrieved Dm, once again using the fitted equations. Panel (b) shows an RHI scan taken at 22:03 UTC along the azimuth corresponding to the disdrometer site. The dashed white line shows the location of the disdrometer. Two closely spaced convective cells can be seen in panel (b), and the two peaks just before 22:00 and just after 22:00 UTC in panel (a) can be attributed to these cells, as they moved closer to the disdrometer location with time. Behind the two cells are less intense precipitation (convective) and further behind is a region of shallow rain which passed over the disdrometers between 22:10 and 22:40 UTC. The two convective cells and the light rain regions from the RHI scan are approximately ‘connected’ with the time periods at the disdrometer site in panel (a), represented by dashed blue arrows, as the storm passed over the site. As in the previous example, during the period when the convective cell passed over the site, there is no agreement between the disdrometer-based Dm and the two radar-based estimates. During the light shallow rain period, the green points (using the light-rain fitted equation) shows close agreement with the DSD-based estimates. Note the Dm values are in the 0.5 to 1 mm range. The orange points, representing the drizzle-fitted equation, lie noticeably lower than the DSD-based Dm values.

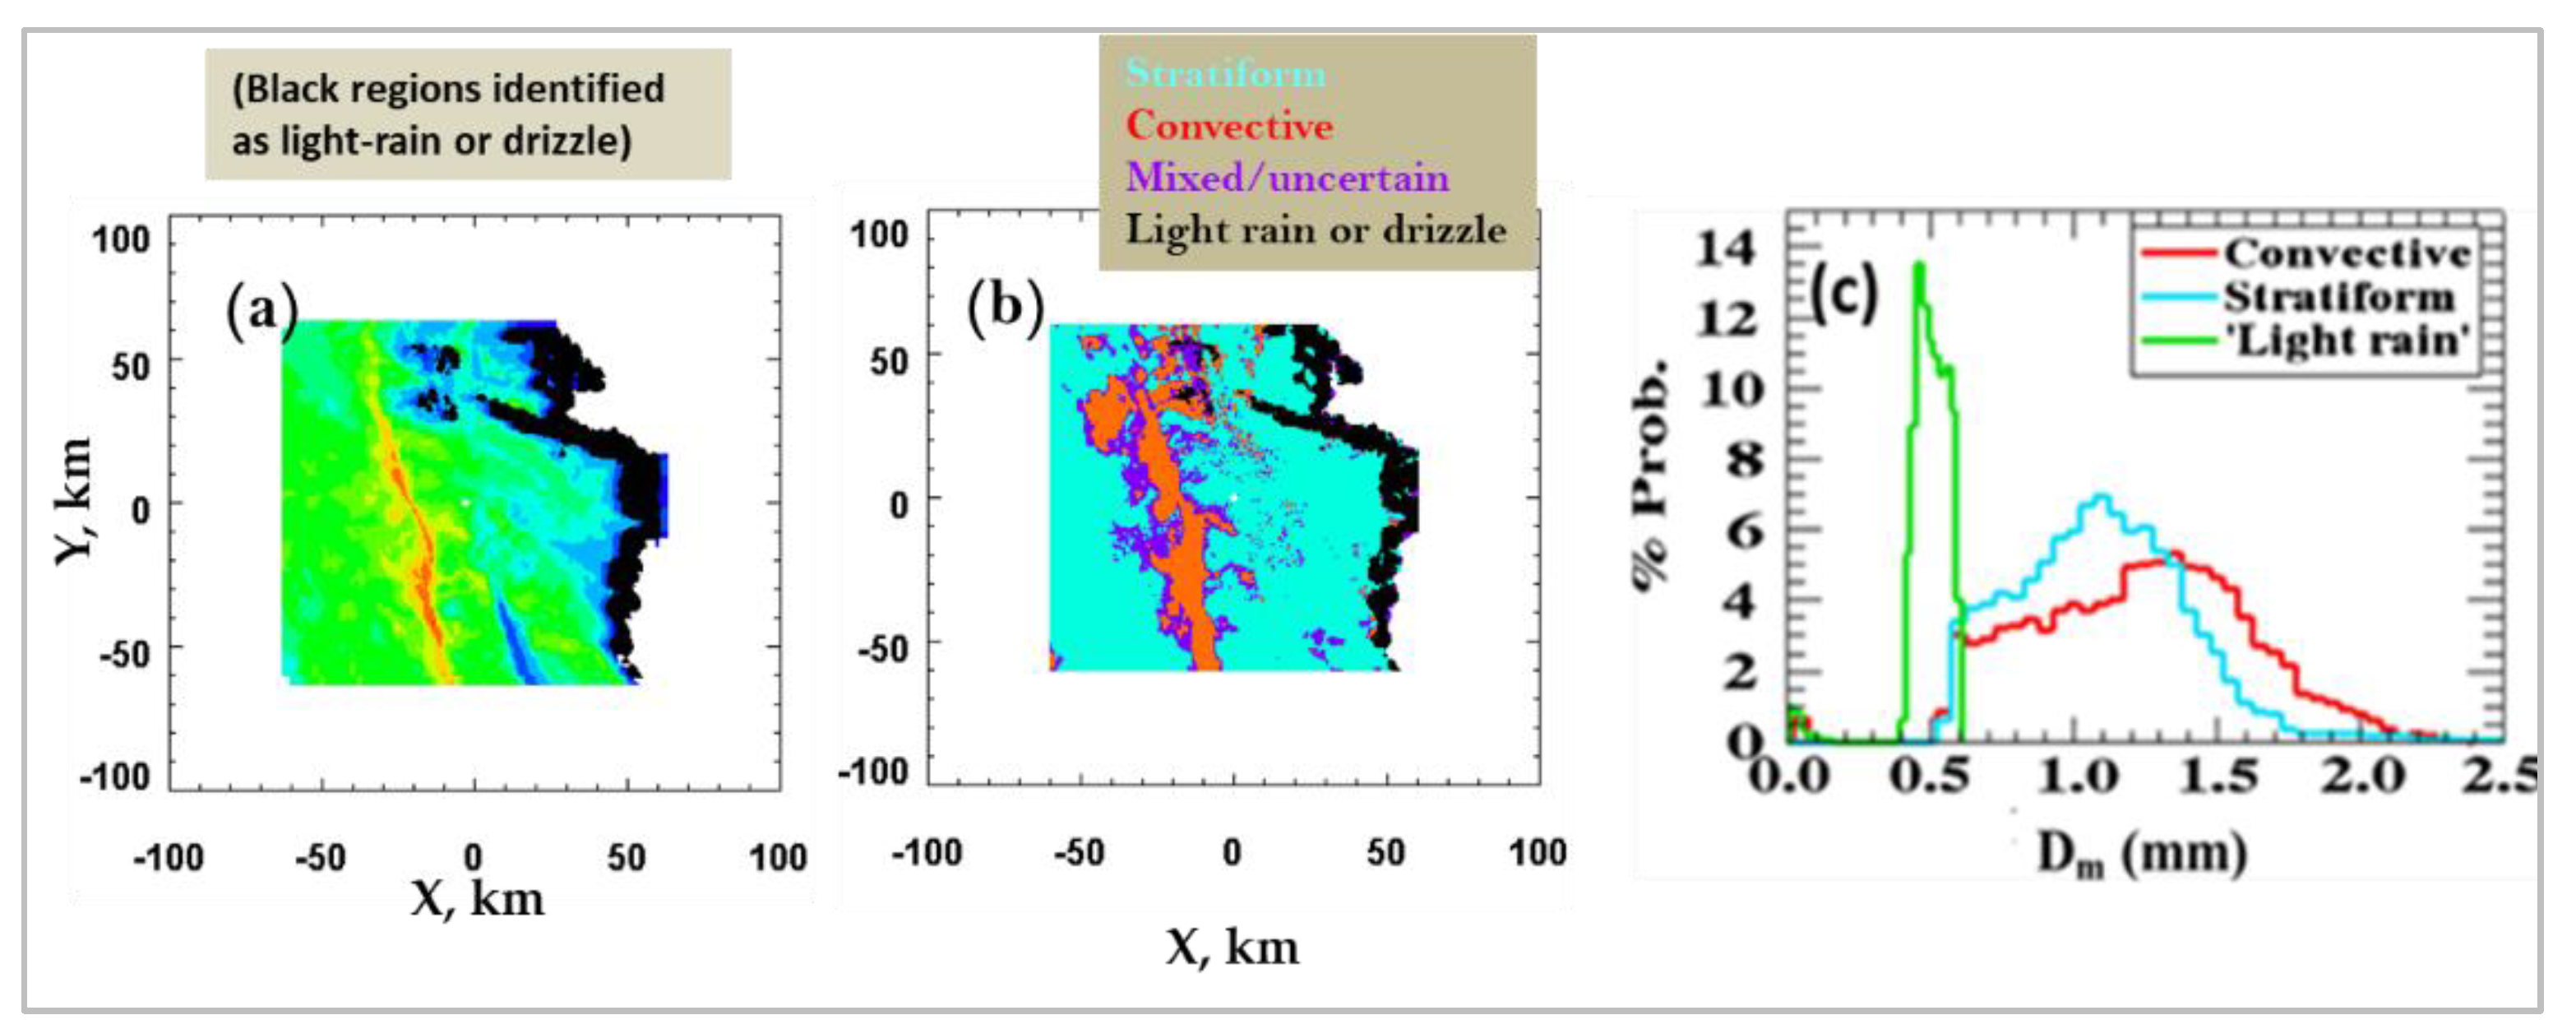
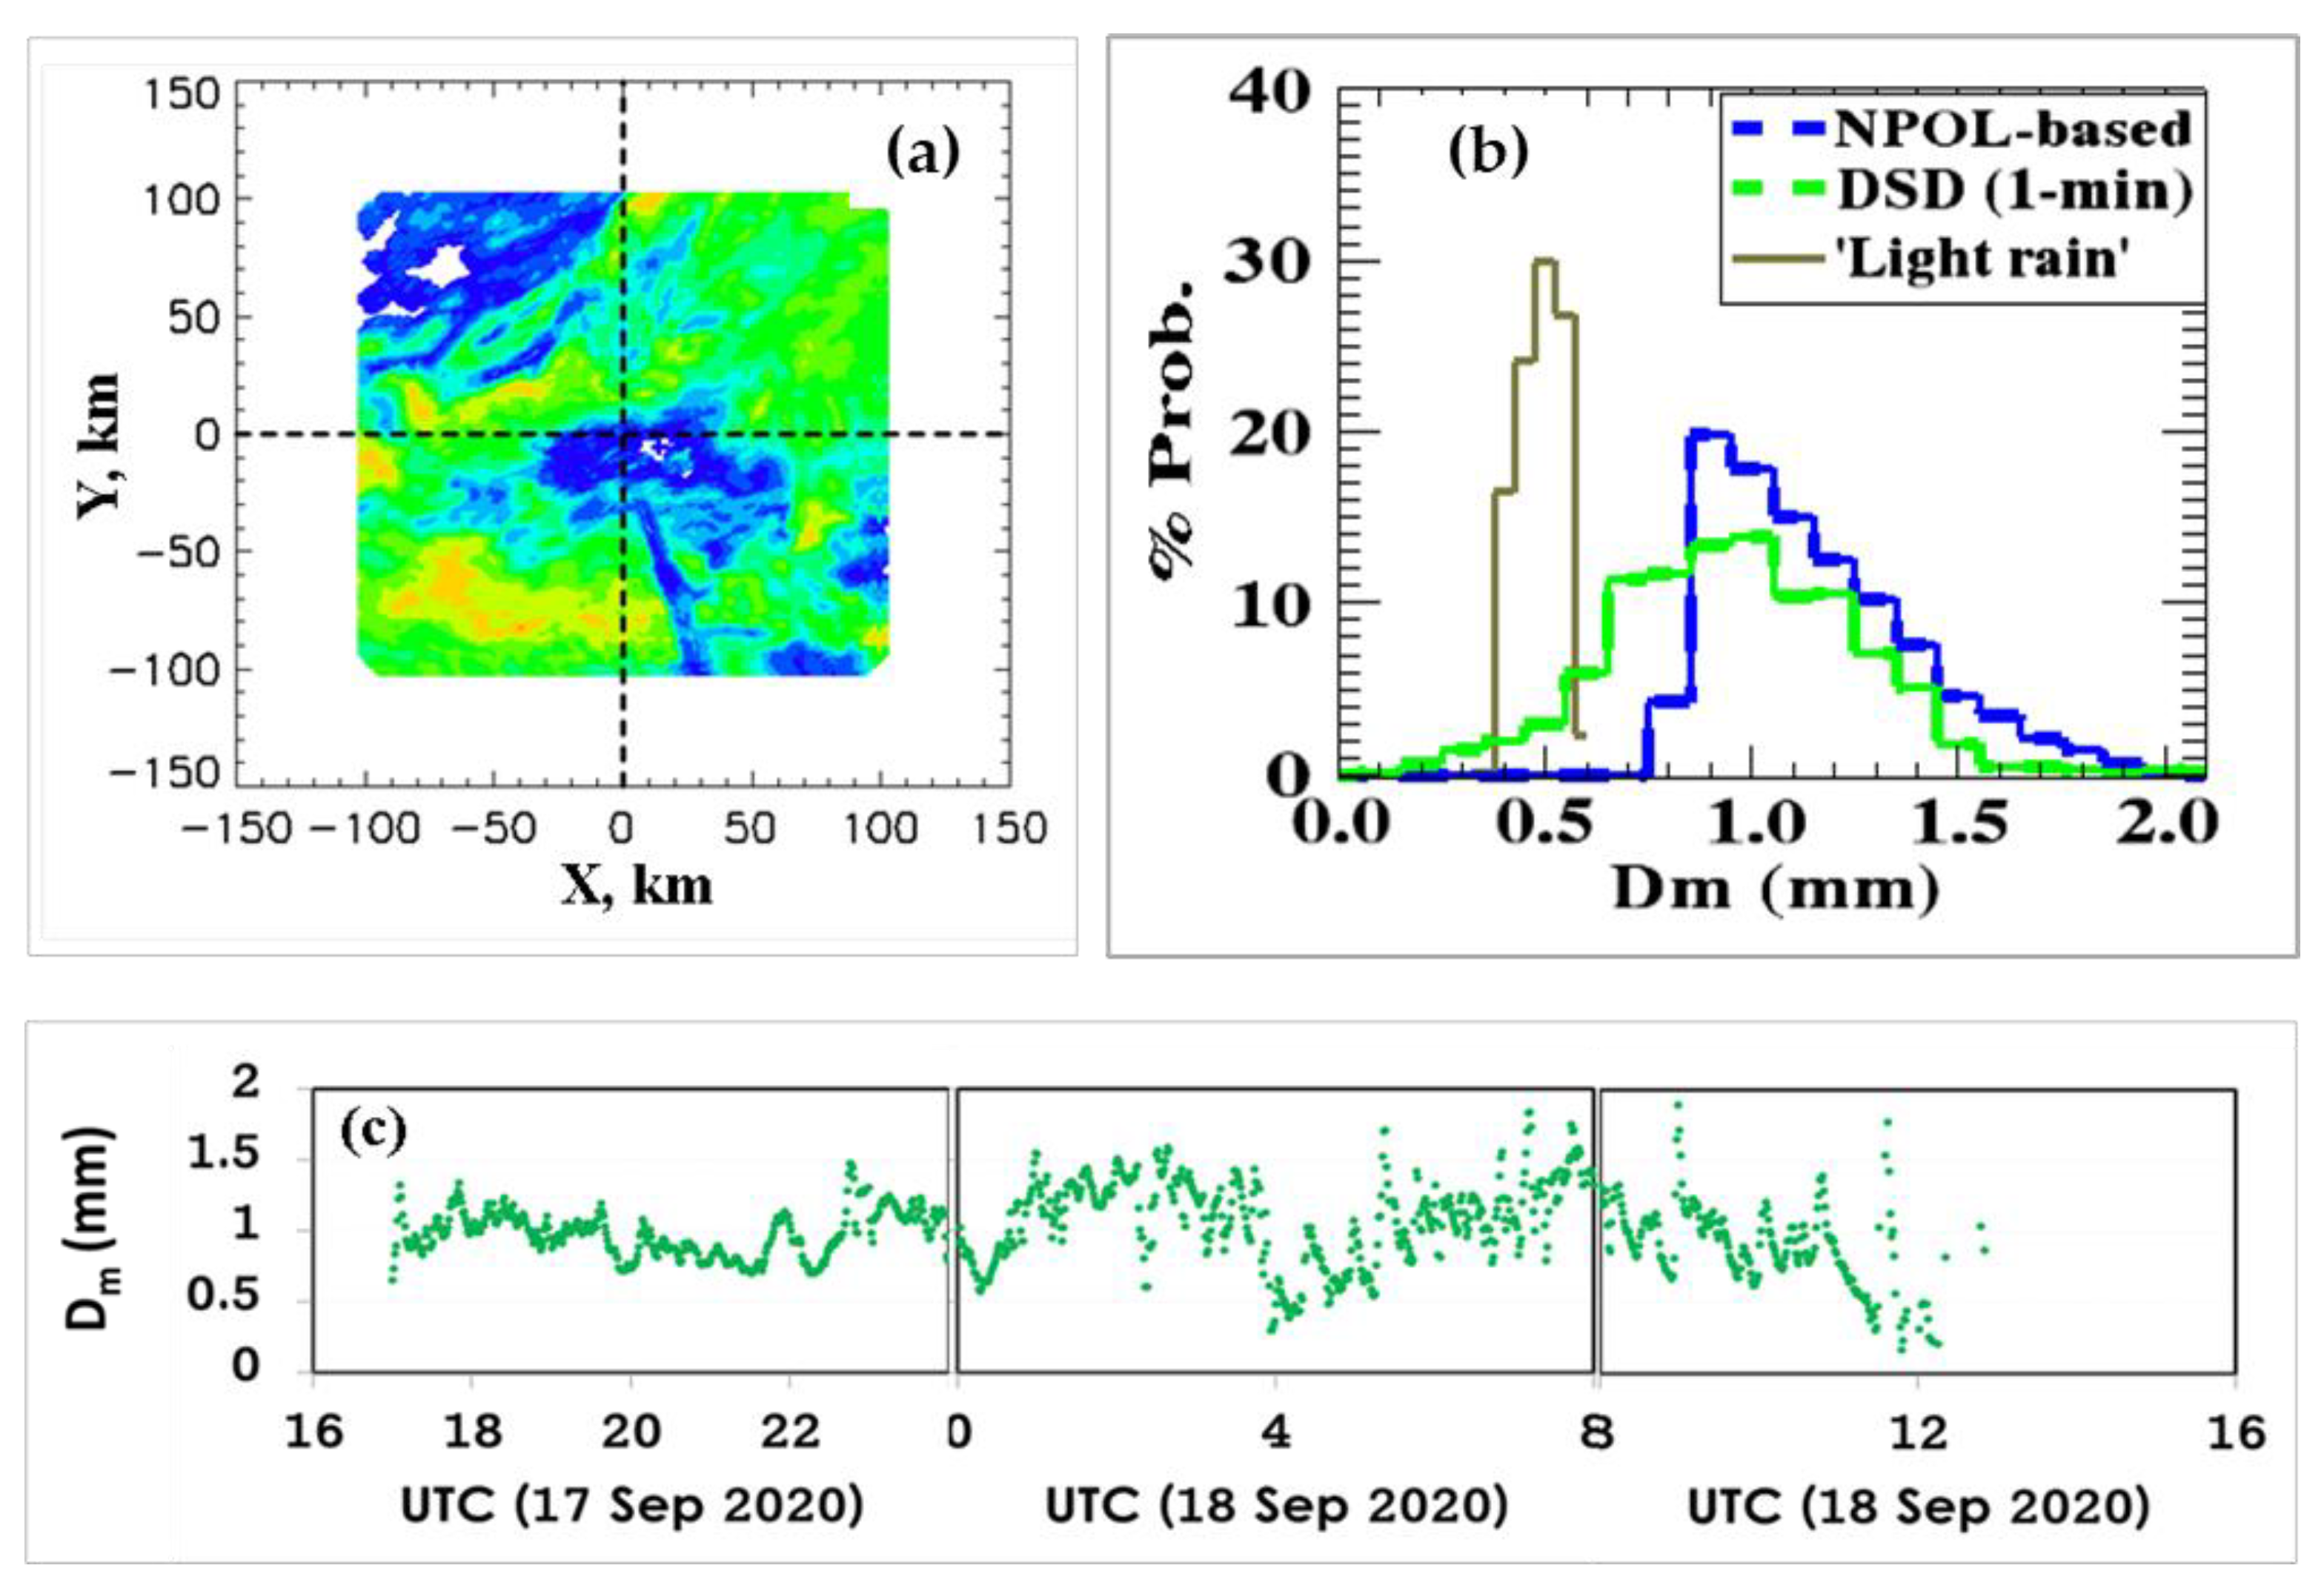
3. Rain-Type Classification

In a previous paper [20], data from the NPOL radar during a widespread event with embedded line convection were used to identify regions of stratiform and convective rain using retrieved DSD parameters. The classification results were compared with an independent ‘texture-based’ method [21]. The 500 m × 500 m cartesian gridded data constructed from the radar volume scans were used. For the DSD-based classification method, a third category, representing ‘mixed’, or ‘uncertain’ (or ‘transition’) rain type was introduced. We now consider the additional category of light rain.
Figure 7a is a reflectivity plot for the 500 m × 500 m gridded data. In the line convection regions, reflectivities were as high as 55 to 60 dBZ. By contrast, light rain regions identified with ‘black marks’ had less than 12 dBZ. The DSD-based rain-type classifications are shown in panel (b); stratiform in cyan color, convective in red, mixed/uncertain in purple, and light rain/drizzle in black. Values of Dm for these regions were derived using the light-rain-fitted equation; their histogram is compared with those derived for stratiform and convective rain regions which had used Zdr-based estimates, as given in [20]. The light-rain Dm histogram spans up to only 0.6 mm which is much less than the other two rain types. Bringi et al. ([12], see their Figure 3a) derived Dm histogram from aircraft measurements in stratocumulus drizzle (warm rain). The drizzle histogram spanned only up to 0.4 mm. This is to be expected since drizzle contains droplets which are even smaller than those in light rain.
The averaged Dm and log10 NW for all four categories are shown in Table 1. The values for stratiform and convective rain are similar to those for coastal sites, rather than continental locations, such as Colorado in the US (see, for example, [22]). For the mixed rain category, the values lie in between, and for light rain category, Dm (as expected) is much lower than the other categories. Note also that NW is significantly higher. Bringi et al. [12] also found significantly higher NW values from the aircraft measurements in drizzle (see their Figure 3a in [12]).
Another event that has been recently considered is the remnants of storm Sally which had passed over the Delmarva peninsula on 17 to 18 September 2020. It was a wide-spread event spanning hundreds of kilometers along the southwest to northeast direction and lasted over 20 h over the NPOL radar site. NPOL volume scans were made continuously, and they were used to construct 500 m × 500 m gridded data at various heights. The disdrometer site mentioned earlier had recorded DSD data throughout the event. Panel (a) of Figure 8 shows the NPOL reflectivity gridded data at 1000 m above sea level. A fitted equation to derive Dm from Zh alone for the light rain region was applied to the gridded data for regions which were identified as light rain; whereas the Zdr-based estimates of Dm were used for other rain type regions. The histograms are shown in grey and blue, respectively, in Figure 8b. The rain type for this storm over the disdrometer region was found to be mostly stratiform or light rain. The mode of the histogram for stratiform rain is at around 1 mm. This is in good agreement with the mean value for Dm for stratiform rain in Table 1 for the first event shown in Figure 7. The shape of the Dm histogram is also similar to the shape shown in Figure 7 for stratiform rain: they both span the same range of values, from 0.7 mm to 1.7 mm. Similar observations can be made for the light rain histograms also: i.e., similar mode and similar range of values.
Finally, panel (c) of Figure 8 shows Dm values from the full DSD spectra every 3 min. They range from 0.25 mm (towards the end of the storm) to around 1.8 mm over a period of 19 h. Their histogram, shown in green in panel (b), ‘straddles’ the other two histograms from the NPOL data; this provides qualitative but independent validation for the fitted equation for light rain.

4. Summary

Retrieval of the mass-weighted mean diameter (Dm) for light rain and drizzle from polarimetric radars cannot be achieved with great accuracy because of the dominance of small (near-spherical) drops. This is especially the case at S-band where Zdr values become very close to 0 dB. Other polarimetric radar parameters such as specific differential phase and specific differential attenuation will also be very close to zero.
For these cases, the only option in prior work [2] has been to use DSD measurements from a/c probes to simulate the radar reflectivity and use pressure adjusted terminal fall speeds for rainfall rate, R, (approximately R = M3.67 moment) followed by regression to arrive at a statistical Z-R power law. This power law is then used to estimate rain rate with scanning radars. Surprisingly, simulations using drizzle DSDs showed that Dm can be estimated from reflectivity alone with reasonable accuracy. Simulations using light rain DSDs also show that Dm estimation will have fairly low parameterization/algorithm errors though not as low as those for drizzle.
Separate fitted equations were derived for deriving Dm from S-band Zh for light rain and drizzle regions. Testing was carried for two example events. The fitted equation for drizzle showed very good agreement between radar-based and DSD-based Dm for Dm < 0.5 mm. The fitted equation for light rain showed good agreement between radar-based and DSD-based Dm for 0.7 mm < Dm < 1.0 mm. It should be noted that the definition of drizzle and light rain based on the range of Dm (rather than rain rate) is unconventional. In retrospect, the mass-mean diameter (M3/M0)1/3 which is used in bulk microphysical schemes might have been a better choice [23], but the correlation with M6 would have resulted in very large scatter.
NPOL gridded data were used to identify regions of light rain and the corresponding histogram of estimated Dm was compared with those from stratiform (S) and convective (C) rain regions. Their mean values (for the events analyzed herein) were 0.51 mm (light rain), 1.06 mm (S), and 1.24 mm (C). The concentration parameter, also known as the normalized intercept parameter, NW (=M3/Dm4 to within a constant) values in the light rain region were significantly higher than those in the other two categories.
To the best of our knowledge, this is the first time that Dm for drizzle and light rain based on size spectra using two collocated disdrometers (optical array probe and 2D-video) along with reflectivity from scanning S-band radars has been used to develop algorithms to retrieve Dm using radar reflectivity alone albeit based on datasets which are relatively small and certainly not global (i.e., the retrieval algorithm may change if data from high latitudes were used). Needless to mention that the radar calibration needs to be highly stable, and its accuracy monitored with frequent checks adopted, for example, by NASA’s NPOL radar or the CSU-CHILL radar. The estimates of Dm obtained herein from drizzle and light ran can be used to validate the predictions of Dm from two-moment microphysical schemes as opposed to validation of rain rate which is highly variable in space and time with most of the variability linked to large variability in NW or the number density of drops and much less due to Dm or the spectral shape.

Author Contributions

Conceptualization, V.B.; methodology, M.T. and V.B.; formal analysis, M.T.; investigation, M.T., V.B., D.W., D.M. and C.P.; resources, D.W. and P.K.; data curation, P.K. and D.M.; writing—original draft preparation, M.T. and V.B.; writing—review and editing, D.W., P.K. and C.P.; supervision, V.B. and D.W.; project administration, V.B. All authors have read and agreed to the published version of the manuscript.

Funding

M.T. was funded by NASA’s Precipitation Measurement Mission via Grant Award Number 80NSSC19K0676. V.B. was funded by NASA’s Atmospheric Dynamics program via Grant Award Number 80NSSC20K0893.

Data Availability Statement

Data can be made available upon request to any of the authors.

Conflicts of Interest

The authors declare no conflict of interest. The funders had no role in the design of this study; in the collection, analyses, or interpretation of its data; in the writing of this manuscript; and in the decision to publish these results.

References

  1. Comstock, K.K.; Bretherton, C.S.; Yuter, S.E. Mesoscale Variability and Drizzle in Southeast Pacific Stratocumulus. J. Atmos. Sci. 2005, 10, 3792–3807. [Google Scholar] [CrossRef]
  2. Bretherton, C.S.; McCaa, J.R.; Grenier, H. A snew parameterization for shallow cumulus convection and its application to marine subtropical cloud-topped boundary layers. Part I: Description and 1-D results. Mon. Weather Rev. 2004, 132, 864–882. [Google Scholar] [CrossRef]
  3. Abel, S.J.; Boutle, I.A. An improved representation of the rain size spectra for single-moment microphysics schemes. Quart. J. R. Meteor. Soc. 2012, 138, 2151–2162. [Google Scholar] [CrossRef]
  4. Wood, R. Drizzle in Stratiform Boundary Layer Clouds. Part II: Microphysical Aspects. J. Atmos. Sci. 2005, 62, 3034–3050. [Google Scholar] [CrossRef]
  5. Bringi, V.N.; Chandrasekar, V. Polarimetric Doppler Weather Radar: Principles and Applications; Cambridge University Press: Cambridge, UK, 2001. [Google Scholar]
  6. Beard, K.V.; Chuang, C. A new model for the equilibrium shape of raindrops. J. Atmos. Sci. 1987, 44, 1509–1524. [Google Scholar]
  7. Schoenhuber, M.; Lammer, G.; Randeu, W.L. One decade of imaging precipitation measurement by 2D-video-distrometer. Adv. Geosci. 2007, 10, 85–90. [Google Scholar]
  8. Schönhuber, M.; Lammer, G.; Randeu, W.L. The 2D-Video-Distrometer. In Precipitation: Advances in Measurement, Estimation and Prediction; Michaelides, S., Ed.; Springer: Berlin/Heidelberg, Germany, 2008; pp. 3–31. ISBN 978-3-540-77654-3. [Google Scholar]
  9. Baumgardner, D.; Kok, G.; Dawson, W.; O’Connor, D.; Newton, R. A new ground-based precipitation spectrometer: The Meteorological Particle Sensor (MPS). In Proceedings of the 11th Conference on Cloud Physics, Ogden, UT, USA, 3–7 June 2002. [Google Scholar]
  10. Rasmussen, R.; Baker, B.; Kochendorfer, J.; Meyers, T.; Landolt, S.; Fischer, A.P.; Black, J.; Thériault, J.M.; Kucera, P.; Gochis, D.; et al. How Well Are We Measuring Snow: The NOAA/FAA/NCAR Winter Precipitation Test Bed. Bull. Am. Meteorol. Soc. 2012, 93, 811–829. [Google Scholar]
  11. Wood, R.; Mechoso, C.R.; Bretherton, C.S.; Weller, R.A.; Huebert, B.; Straneo, F.; Albrecht, B.A.; Coe, H.; Allen, G.; Vaughan, G.; et al. The VAMOS Ocean-cloud-atmosphere-land study regional experiment (VOCALS-REx): Goals, platforms, and field operations. Atmos. Chem. Phys. 2011, 11, 627–654. [Google Scholar] [CrossRef]
  12. Bringi, V.N.; Grecu, M.; Thurai, M.; Protat, A. Using Observed Drop Size Distributions in Light Rainfall: Application to the Combined DPR-GMI Algorithm. In Proceedings of the AGU Fall Meeting, Online, 1–17 December 2020. [Google Scholar]
  13. Bringi, V.N.; Hoferer, R.; Brunkow, D.A.; Schwerdtfeger, R.; Chandrasekar, V.; Rutledge, S.A.; George, J.; Kennedy, P.C. Design and Performance Characteristics of the New 8.5-m Dual-Offset Gregorian Antenna for the CSU-CHILL Radar. J. Atmos. Ocean. Technol. 2011, 28, 907–920. [Google Scholar] [CrossRef]
  14. Wolff, D.B.; Marks, D.A.; Petersen, W.A. General application of the Relative Calibration Adjustment (RCA) technique for monitoring and correcting radar reflectivity calibration. J. Atmos. Ocean. Technol. 2015, 32, 496–506. [Google Scholar] [CrossRef]
  15. Thurai, M.; Gatlin, P.N.; Bringi, V.N.; Petersen, W.A.; Notaros, B.; Carey, L.D.; Kennedy, P.; Notaroš, B.; Carey, L.D. Towards completing the rain drop size spectrum: Case studies involving 2D-video disdrometer, droplet spectrometer, and polarimetric radar measurements. J. Appl. Meteorol. Climatol. 2017, 56, 877–896. [Google Scholar] [CrossRef]
  16. Thurai, M.; Bringi, V.; Gatlin, P.N.; Petersen, W.A.; Wingo, M.T. Measurements and Modeling of the Full Rain Drop Size Distribution. Atmosphere 2019, 10, 39. [Google Scholar] [CrossRef]
  17. Thurai, M.; Bringi, V.N.; Wolff, D.B.; Marks, D.; Pabla, C.S. Drop size distribution measurements in outer rainbands of hurricane dorian at the NASA wallops precipitation-research facility. Atmosphere 2020, 11, 578. [Google Scholar] [CrossRef]
  18. Brdar, S.; Seifert, A. McSnow: A monte-carlo particle model for riming and aggregation of ice particles in a multidimensional microphysical phase space. J. Adv. Model. Earth Syst. 2018, 10, 187–206. [Google Scholar] [CrossRef]
  19. Bringi, V.; Seifert, A.; Wu, W.; Thurai, M.; Huang, G.-J.; Siewert, C. Hurricane Dorian Outer Rain Band Observations and 1D Particle Model Simulations: A Case Study. Atmosphere 2020, 11, 879. [Google Scholar] [CrossRef]
  20. Thurai, M.; Wolff, D.; Marks, D.; Pabla, C.; Bringi, V. Separation of Stratiform and Convective Rain Types Using Data from an S-Band Polarimetric Radar: A Case Study Comparing Two Different Methods. Environ. Sci. Proc. 2021, 8, 1. [Google Scholar]
  21. Steiner, M.; Houze, R.A.; Yuter, S.E. Climatological Characterization of Three-Dimensional Storm Structure from Operational Radar and Rain Gauge Data. J. Appl. Meteorol. Climatol. 1995, 34, 1978–2007. [Google Scholar] [CrossRef]
  22. Bringi, V.N.; Chandrasekar, V.; Hubbert, J.; Gorgucci, E.; Randeu, W.L.; Schoenhuber, M. Raindrop Size Distribution in Different Climatic Regimes from Disdrometer and Dual-Polarized Radar Analysis. J. Atmos. Sci. 2003, 60, 354–365. [Google Scholar] [CrossRef]
  23. Naumann, A.K.; Seifert, A. Evolution of the Shape of the Raindrop Size Distribution in Simulated Shallow Cumulus. J. Atmos. Sci. 2016, 73, 2279–2297. [Google Scholar] [CrossRef]
Figure 1. Scattering simulations using DSD measurements. DSD-based Dm versus (a) Zdr and (b) Zh both at S-band. The orange points represent the measurements in stratocumulus drizzle (aircraft) and the green points represent measurements from ground-based disdrometers in Greeley, Colorado, and Huntsville, Alabama.
Environsciproc 19 00023 g001
Figure 2. Same as panel (b) of Figure 1 but with experimental data (black points) superimposed from an event on 17 April 2015 at Greeley, Colorado, with Dm values from 3 min DSD disdrometer measurements and Zh from the CSU-CHILL S-band radar measurements over the disdrometer site.
Environsciproc 19 00023 g002
Figure 3. Same as panel (b) of Figure 1 but with experimental data (red points) superimposed from an event over the Delmarva peninsula (outer-rainbands of category-1 Hurricane Dorian on 6 September 2019), shown as red points, with Dm values from 3-min DSD disdrometer measurements and Zh from the NPOL S-band radar measurements over the disdrometer site.
Environsciproc 19 00023 g003
Figure 4. Same as Figure 1, with fitted curves superimposed for both drizzle (orange-line) and the ground-based data (green).
Environsciproc 19 00023 g004
Figure 5. Dm’s from 3 min DSDs (purple) for the long duration event on 17 April 2015 and Dm estimates from the CSU-CHILL S-band radar dBZ over the disdrometer site using the fitted equation for (a) light rain (green points) and (b) drizzle (orange). The orange and the green arrows represent the time intervals when the drizzle fit and the light-rain fit yield better agreement with the DSD-based Dms, respectively.
Environsciproc 19 00023 g005
Figure 6. (a) Dm comparisons for another event (10 August 2015) in the same way as Figure 5. (b) CHILL S-band RHI scan taken along the azimuth angle of the disdrometer site (at 13 km range, marked with a dashed white line) at 22:03 UTC. The blue arrows point to the different rain types as they passed over the disdrometer site corresponding to the UTC in panel (a).
Environsciproc 19 00023 g006
Figure 7. (a) The 500 m × 500 m gridded data (dBZ) constructed from NPOL volume scan during an embedded line convection event over the Delmarva peninsula on 30 April 2021 (see [20] for details). (b) Rain-type classification (retrieved DSD-based) for stratiform, convective, and mixed rain types and regions identified as light rain marked in black. (c) Dm histograms estimated for the regions identified as light rain compared with those for stratiform and convective rain.
Environsciproc 19 00023 g007
Figure 8. (a) The 500 m × 500 m gridded data (dBZ) constructed from NPOL volume scan during remnants of storm Sally over the Delmarva peninsula on 17–18 September 2020. (b) Dm histogram estimated for the region identified as light rain (grey) compared with that for other rain regions from the NPOL data (blue) and from 3 min DSD measurements (green). (c) Dm from 3 min DSD measurements from disdrometers for the entire event.
Environsciproc 19 00023 g008
Table 1. Mean values of retrieved Dm and log10 (NW) for the four NPOL-pixel-based categories.
NPOL Classification<Dm> mm<log10 NW>
Stratiform1.064.22
Convective1.244.90
Mixed1.054.77
Light rain0.516.18
Publisher’s Note: MDPI stays neutral with regard to jurisdictional claims in published maps and institutional affiliations.

