Proceeding Paper

Performance Assessment of CHIRPSv2.0 and MERRA-2 Gridded Precipitation Datasets over Complex Topography of Turkey †

1
Department of Civil Engineering, Eskisehir Technical University, Eskisehir 26555, Turkey
2
Department of Hydraulics and Hydraulic Structures, Faculty of Water Resources and Environmental Engineering, Kabul Polytechnic University, Kabul 1010, Afghanistan
*
Author to whom correspondence should be addressed.
Presented at the 5th International Electronic Conference on Atmospheric Sciences, 16–31 July 2022; Available online: https://ecas2022.sciforum.net/.
Environ. Sci. Proc. 2022, 19(1), 21; https://doi.org/10.3390/ecas2022-12815
Published: 14 July 2022
(This article belongs to the Proceedings of The 5th International Electronic Conference on Atmospheric Sciences)

Abstract

:
Precipitation is a major component of the global water cycle, and its accurate measurement, especially over complex topography, requires a dense gauge network, which is often limited for many parts of the world. In recent decades, gridded precipitation datasets (GPDs) that merge information from satellites, numerical weather prediction models, and available ground data could be a potential alternative source for many hydro-climatic studies. However, their validation is a prerequisite task before utilizing them for different applications. This study aims to evaluate the spatio-temporal consistency of CHIRPSv2.0 and MERRA-2 datasets over different elevation ranges in Turkey based on five hydrological years (2015–2019) under Kling-Gupta Efficiency (KGE) metric for daily and monthly time steps. Moreover, three categorical indicators, including Threat Score (TS), Pierce Skill Score (PSS), and Gilbert Skill Score (GSS), are employed to address GPD detectability strength for various precipitation intensities. In general, GPDs show high performance for monthly (median KGE of; 0.62–0.76) time step than daily (median KGE of; 0.19–0.28), and MERRA-2 outperforms CHIRPSv2.0 considering daily precipitation, while CHIRPSv2.0 shows higher performance for monthly precipitation, comparatively.

1. Introduction

Accurate precipitation estimates with high spatio-temporal resolution are essential for many studies related to water resources on regional and global scales [1,2]. Moreover, monitoring precipitation over highly elevated regions and complex topography has been a great challenge in recent years [3,4], and the lack of precipitation observations usually limits hydro-climatic studies, especially for data-scarce regions [5]. Alternatively, gridded precipitation datasets (GPDs), which take advantage of satellite sensor information and numerical weather prediction model output data, present high spatio-temporal resolution and long-term precipitation estimates [1,6]. Considering the input and algorithms utilized to retrieve precipitation estimates, GPDs are classified into the following three groups; (a) those based on information retrieved from ground gauge networks such as the Global Precipitation Climatology Centre (GPCC) [7] and Climate Prediction Center unified (CPC) [8], (b) those that take advantage of satellite Passive-Microwave (PMW) and Infrared (IR) sensors information such as Precipitation Estimation from Remotely Sensed Information using Artificial Neural Networks (PERSIANN) [9], Integrated Multi-satellitE Retrievals for GPM (IMERG) early run [10], and (c) those based on numerical weather prediction models output data (reanalysis) such as the European Centre for Medium Range Weather Forecasts (ECMWF) reanalysis fifth generation (ERA5) [11]. It is worth mentioning that some of the GPDs, such as the Climate Hazards group InfraRed Precipitation with Stations (CHIRPS) [12] and modern-era retrospective analysis for research and applications, version 2 (MERRA-2) [13], utilize information from satellite, reanalysis, and available ground data. Overall, multi-source GPDs show higher accuracy in precipitation estimates over diverse regions [14,15,16,17,18,19]. On the other hand, the validation of GPDs over a particular area may not be applicable for other regions, and a detailed assessment is required to address GPDs performance over time and space.
According to the previously described context, this study aims to evaluate the spatio-temporal consistency of two multi-source GPDs (CHIRPSv2.0 and MERRA-2) in reproducing daily and monthly precipitation estimates over distinct elevation ranges. The evaluation is based on five hydrological years (2015–2019). This study provides valuable insights for both developers and end-users to enhance the algorithm and support GPDs selection.
The structure of this paper is as follows: Section 1 presents a detailed introduction to GPDs. Section 2 of this study gives information on materials and methods. Section 3 presents the results and discussions, and finally, conclusions are summarized in Section 4.

2. Materials and Methods
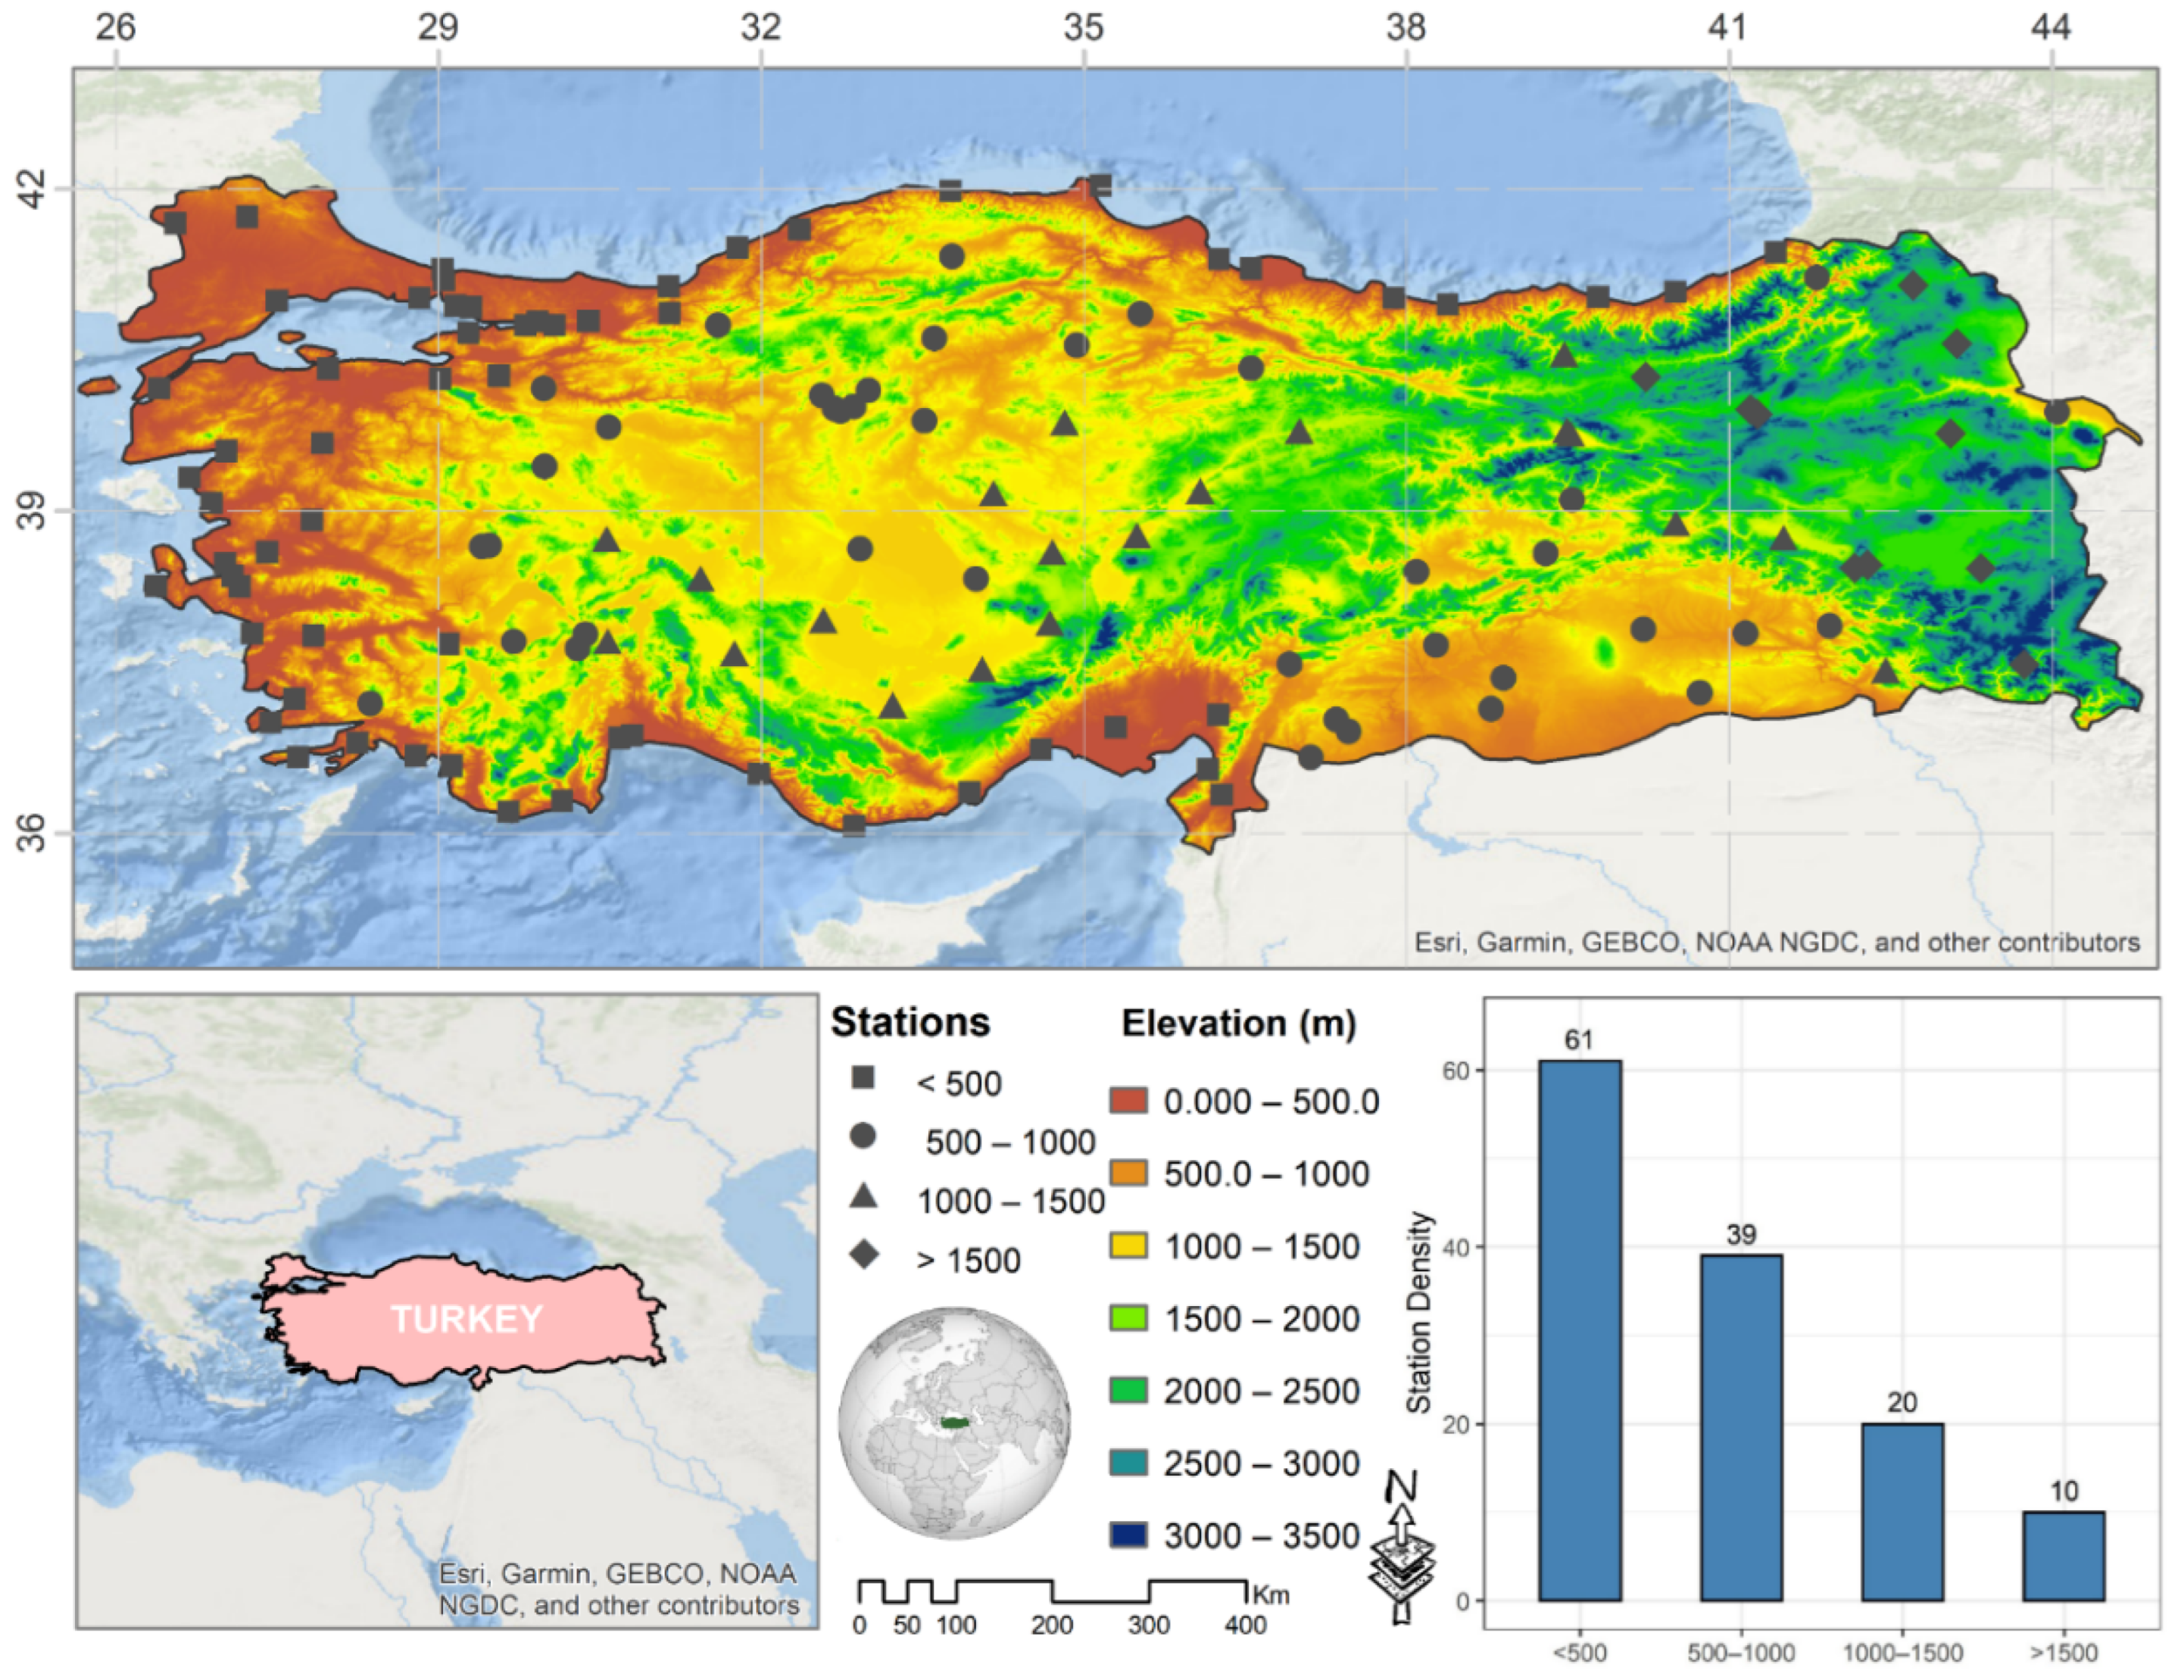
2.1. Study Area

Turkey, covering around 784,000 km2 (36–42° N latitude and 26–45° E longitude), is selected as the study area (Figure 1). The diverse landscape and highly elevated mountains located in the eastern and northeastern parts of the country have a significant effect on the amount of precipitation. Most of the flat and low-land areas (with an elevation of less than 1000 m) are situated in the western parts, while the highly elevated and complex topographic areas (with an elevation of more than 1000 m) are located in the eastern regions [20,21]. Generally, coastal areas with an elevation of less than 500 m experience higher precipitation than inland regions.

2.2. Data

In this study, the daily rain gauge observations were prepared by the General Directorate of Meteorology (GDM) of Turkey. The data is subjected to extensive quality control by taking into account outliers, discontinuities, and data entry repetition, with 130 rain gauge stations passing the quality control filtering procedures and being accepted as a reference for GPD accuracy assessment. The spatial distribution of the rain gauge network and the number of stations within each elevation range over Turkey is shown in Figure 1.
The Climate Hazards group InfraRed Precipitation with Stations (CHIRPS) version 2 presents precipitation with a high spatial resolution (0.05°) and spatial coverage within 50° S–50° N from 1981 to the present. The dataset was originally developed for climate change analysis and drought monitoring. CHIRPSv2.0 presents precipitation with daily, pentad, monthly, and annual temporal resolutions, and it is available after one month time lag (latency) for public use [12]. CHIRPS can be downloaded at http://chg.ucsb.edu/data/chirps (accessed on 5 May 2022).
The Modern-Era Retrospective Analysis for Research and Applications, version 2 (MERRA-2), was the upgraded version of MERRA-1 and is produced by NASA’s Global Modeling and Assimilation Office (GMAO). MERRA-2 presents precipitation with global coverage and spatial resolution around ~0.5° from 1980 to the present [13]. The dataset can be found with 1 h, 3 h, or aggregated daily and monthly temporal resolution from https://disc.gsfc.nasa.gov (accessed on 5 May 2022) and https://esgf-node.llnl.gov/projects/esgf-llnl/websites (accessed on 5 May 2022).

2.3. Methodology

In this context, a quantitative statistical analysis based on the modified Kling–Gupta Efficiency [22] was used to assess the accuracy of GPDs over time and space for daily and monthly precipitation. KGE (Equation (1)) is a relatively new objective function combining Pearson correlation coefficient (r), the ratio of bias (Bias), and variability ratio (VR).
K G E = 1 ( r 1 ) 2 + ( B i a s 1 ) 2 + ( V R 1 ) 2
where r is the Pearson correlation coefficient (Equation (2)), Bias is the ratio of mean observed to GPD precipitation (Equation (3)), and VR is the ratio of observed to GPD precipitation coefficient of variation (Equation (4)).
r = 1 n 1 n [ ( o n µ o ) × ( s n µ s ) ] × ( δ o × δ s ) 1
B i a s = µ s × ( µ o ) 1
V R = ( δ s × µ o ) × ( δ o × µ s ) 1
In the above equations, δ and µ show the standard deviation and mean of the distribution, and o and s indicate the observed and estimated, respectively.
Moreover, the categorical statistics were utilized to evaluate the detectability of GPDs for daily precipitation. Hence, the daily precipitation from observed and two GPDs are considered as discrete values and classified into five thresholds. The five precipitation thresholds are considered as no/tiny-precipitation (less than 1 mm/day), light precipitation (1–5 mm/day), moderate precipitation (5–20 mm/day), heavy precipitation (20–40 mm/day), and extreme precipitation (more than 40 mm/day) [23]. The Threat Score (TS) (Equation (5)), Pierce Skill Score (PSS) (Equations (5) and (6)), and Gilbert Skill Score (GSS) (Equation (7)) evaluate the detectability strength of CHIRPSv2.0 and MERRA-2 datasets.
T S = H H + F + M
P S S = ( H × CN ) ( F × M ) ( H + M )   ( F + CN )
G S S = H H random H + M + F H random ,   where   H random = ( H + M ) ( H + F ) H + M + F + CN
In the above equations: M (Miss); when the observed precipitation is not detected. F (False); when the precipitation is detected but not observed, H (Hit); when the observed precipitation is correctly detected, CN (Correct Negative); a no precipitation event is detected. All selected statistical indicators have their optimum at unity. Furthermore, A point-grid method was carefully chosen for comparison of GPDs with gauge precipitation data, where the value of each grid box at the station location is extracted. Finally, the stations are classified based on their location (Figure 1) over four distinct elevation ranges (<500 m, 500–1000 m, 1000–1500 m and >1500 m) and the accuracy assessment of GPDs was done considering daily and monthly time steps.

3. Result and Discussion

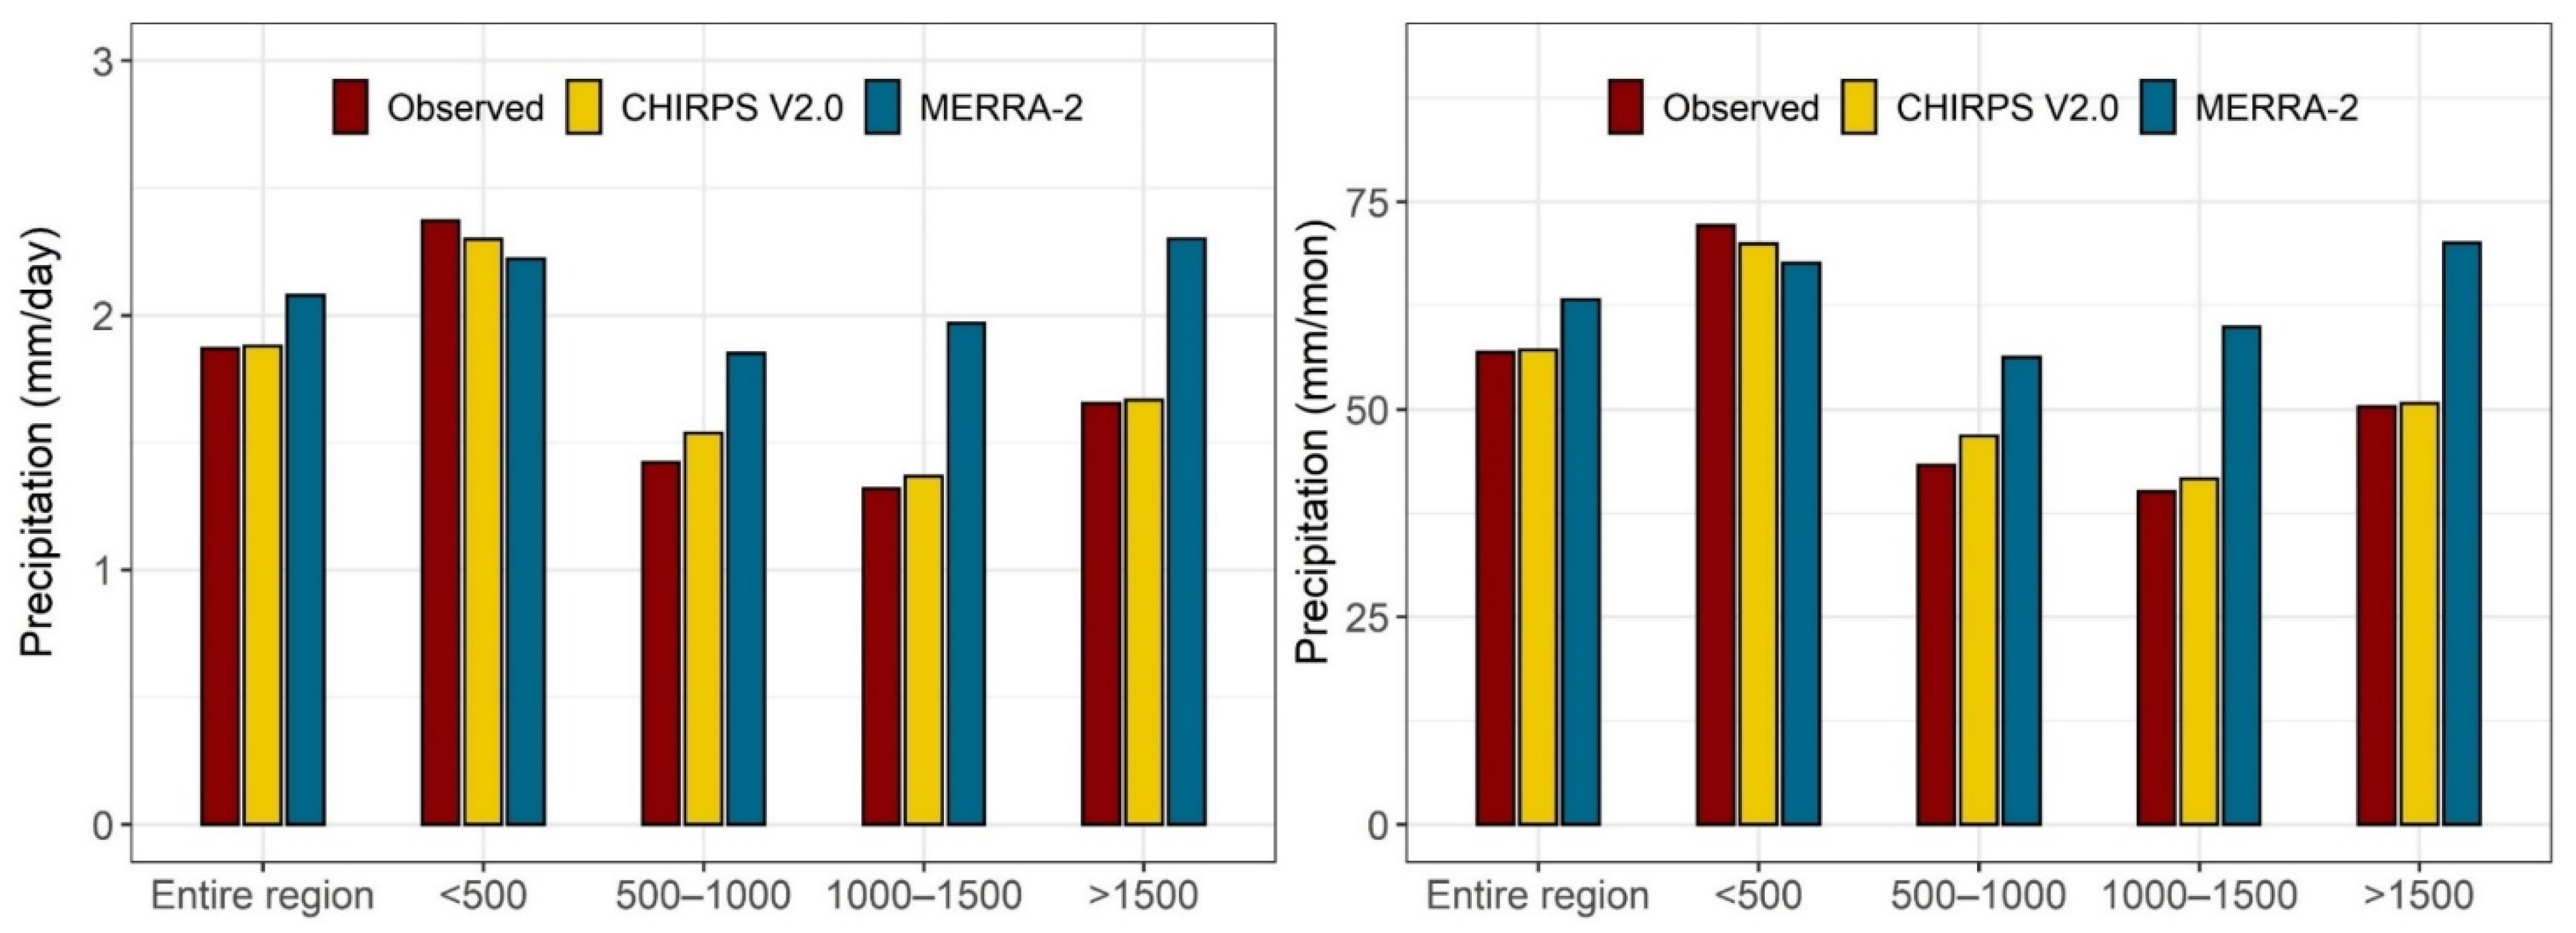
3.1. Evaluation of Mean Precipitaiton

Figure 2 shows the mean daily and monthly precipitation at the regional scale, obtained from observed, CHIRPSv2.0 and MERRA-2 datasets. Considering the observed data, the region receives precipitation of around 1.80 mm and 56.25 mm for daily and monthly time steps, respectively. Moreover, areas with an elevation of less than 500 m, which mostly represent coastal regions, experience higher precipitation amounts (2.37 mm/day and 73.2 mm/month), and areas located within 500–1500 m elevation ranges show the lowest amount of precipitation, which typically represents precipitation in the central part of Turkey surrounded by Taurus Mountains.
Furthermore, regions with elevation more than 1500 m relatively represent the highly elevated areas located in the eastern part of the country and experience higher precipitation, comparatively. From the results, CHIRPSv2.0 shows close precipitation estimates to observed and its perfect records are obtained over areas with elevations above 1500 m. On the other hand, MERRA-2 underestimates daily and monthly precipitation only in the coastal areas (area with elevation less than 500 m) where the amount of overestimation is increased by increasing elevation ranges from the west to the east, and shows the highest overestimation over regions with elevations above 1500 m.

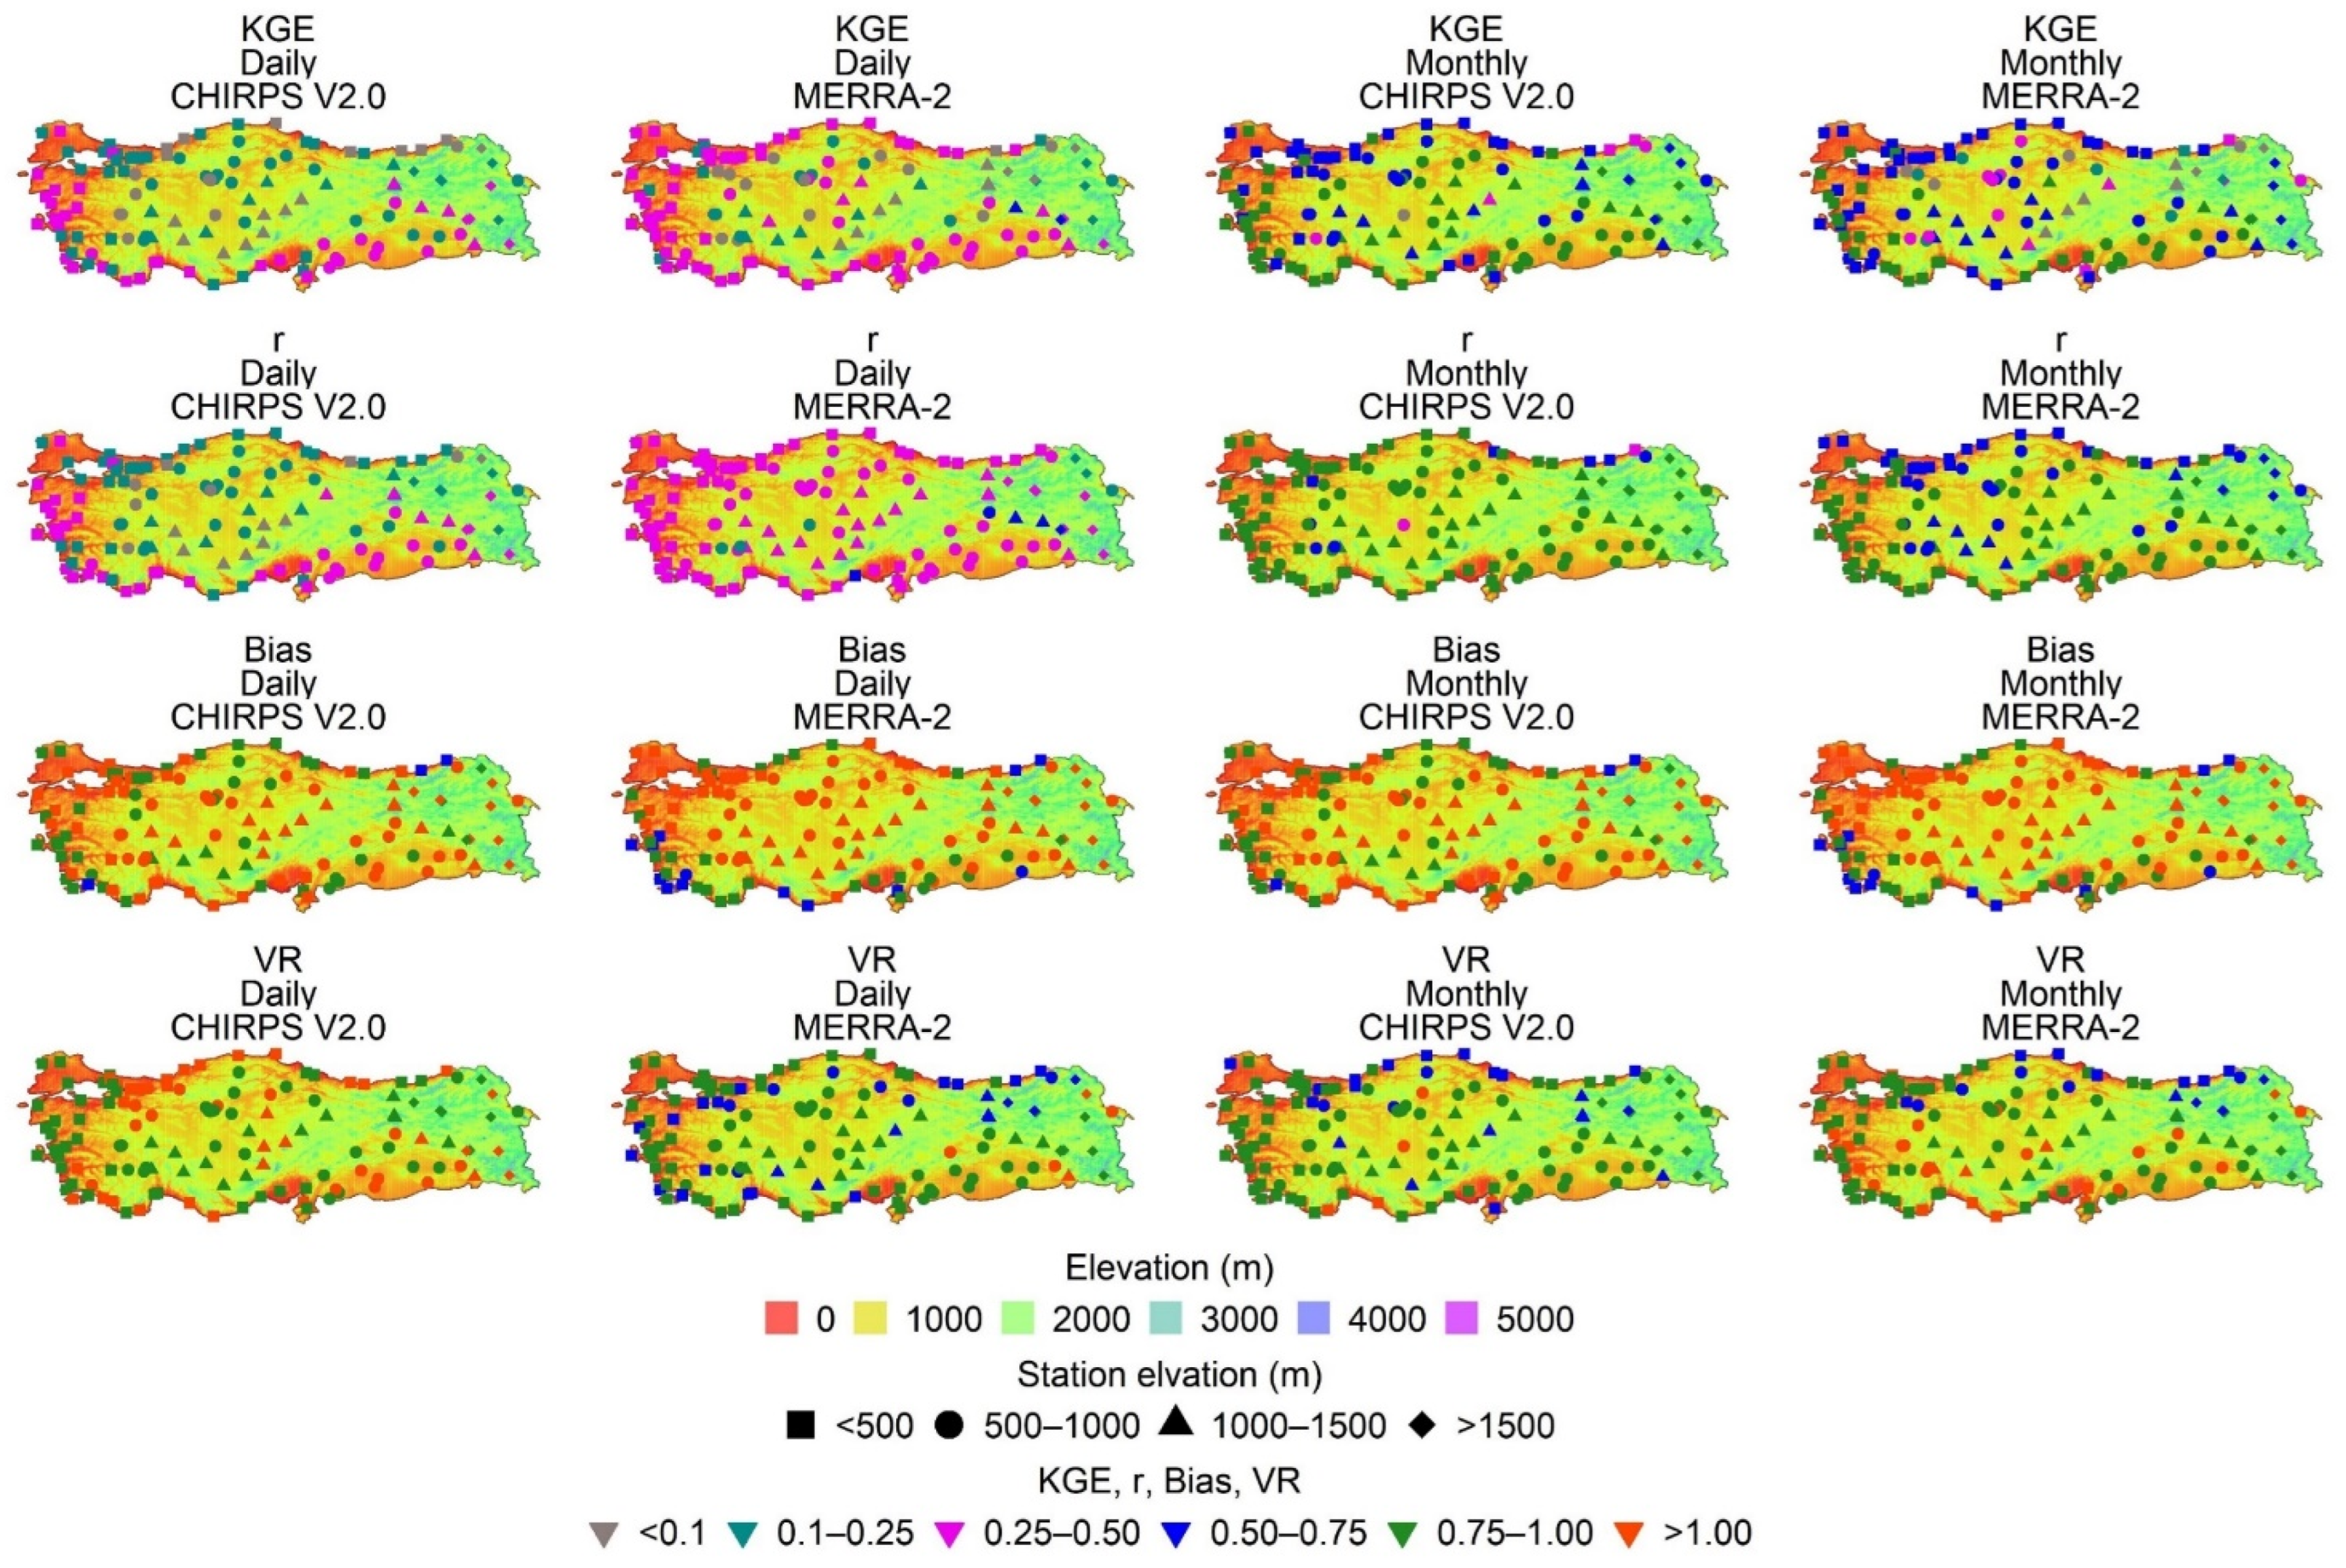
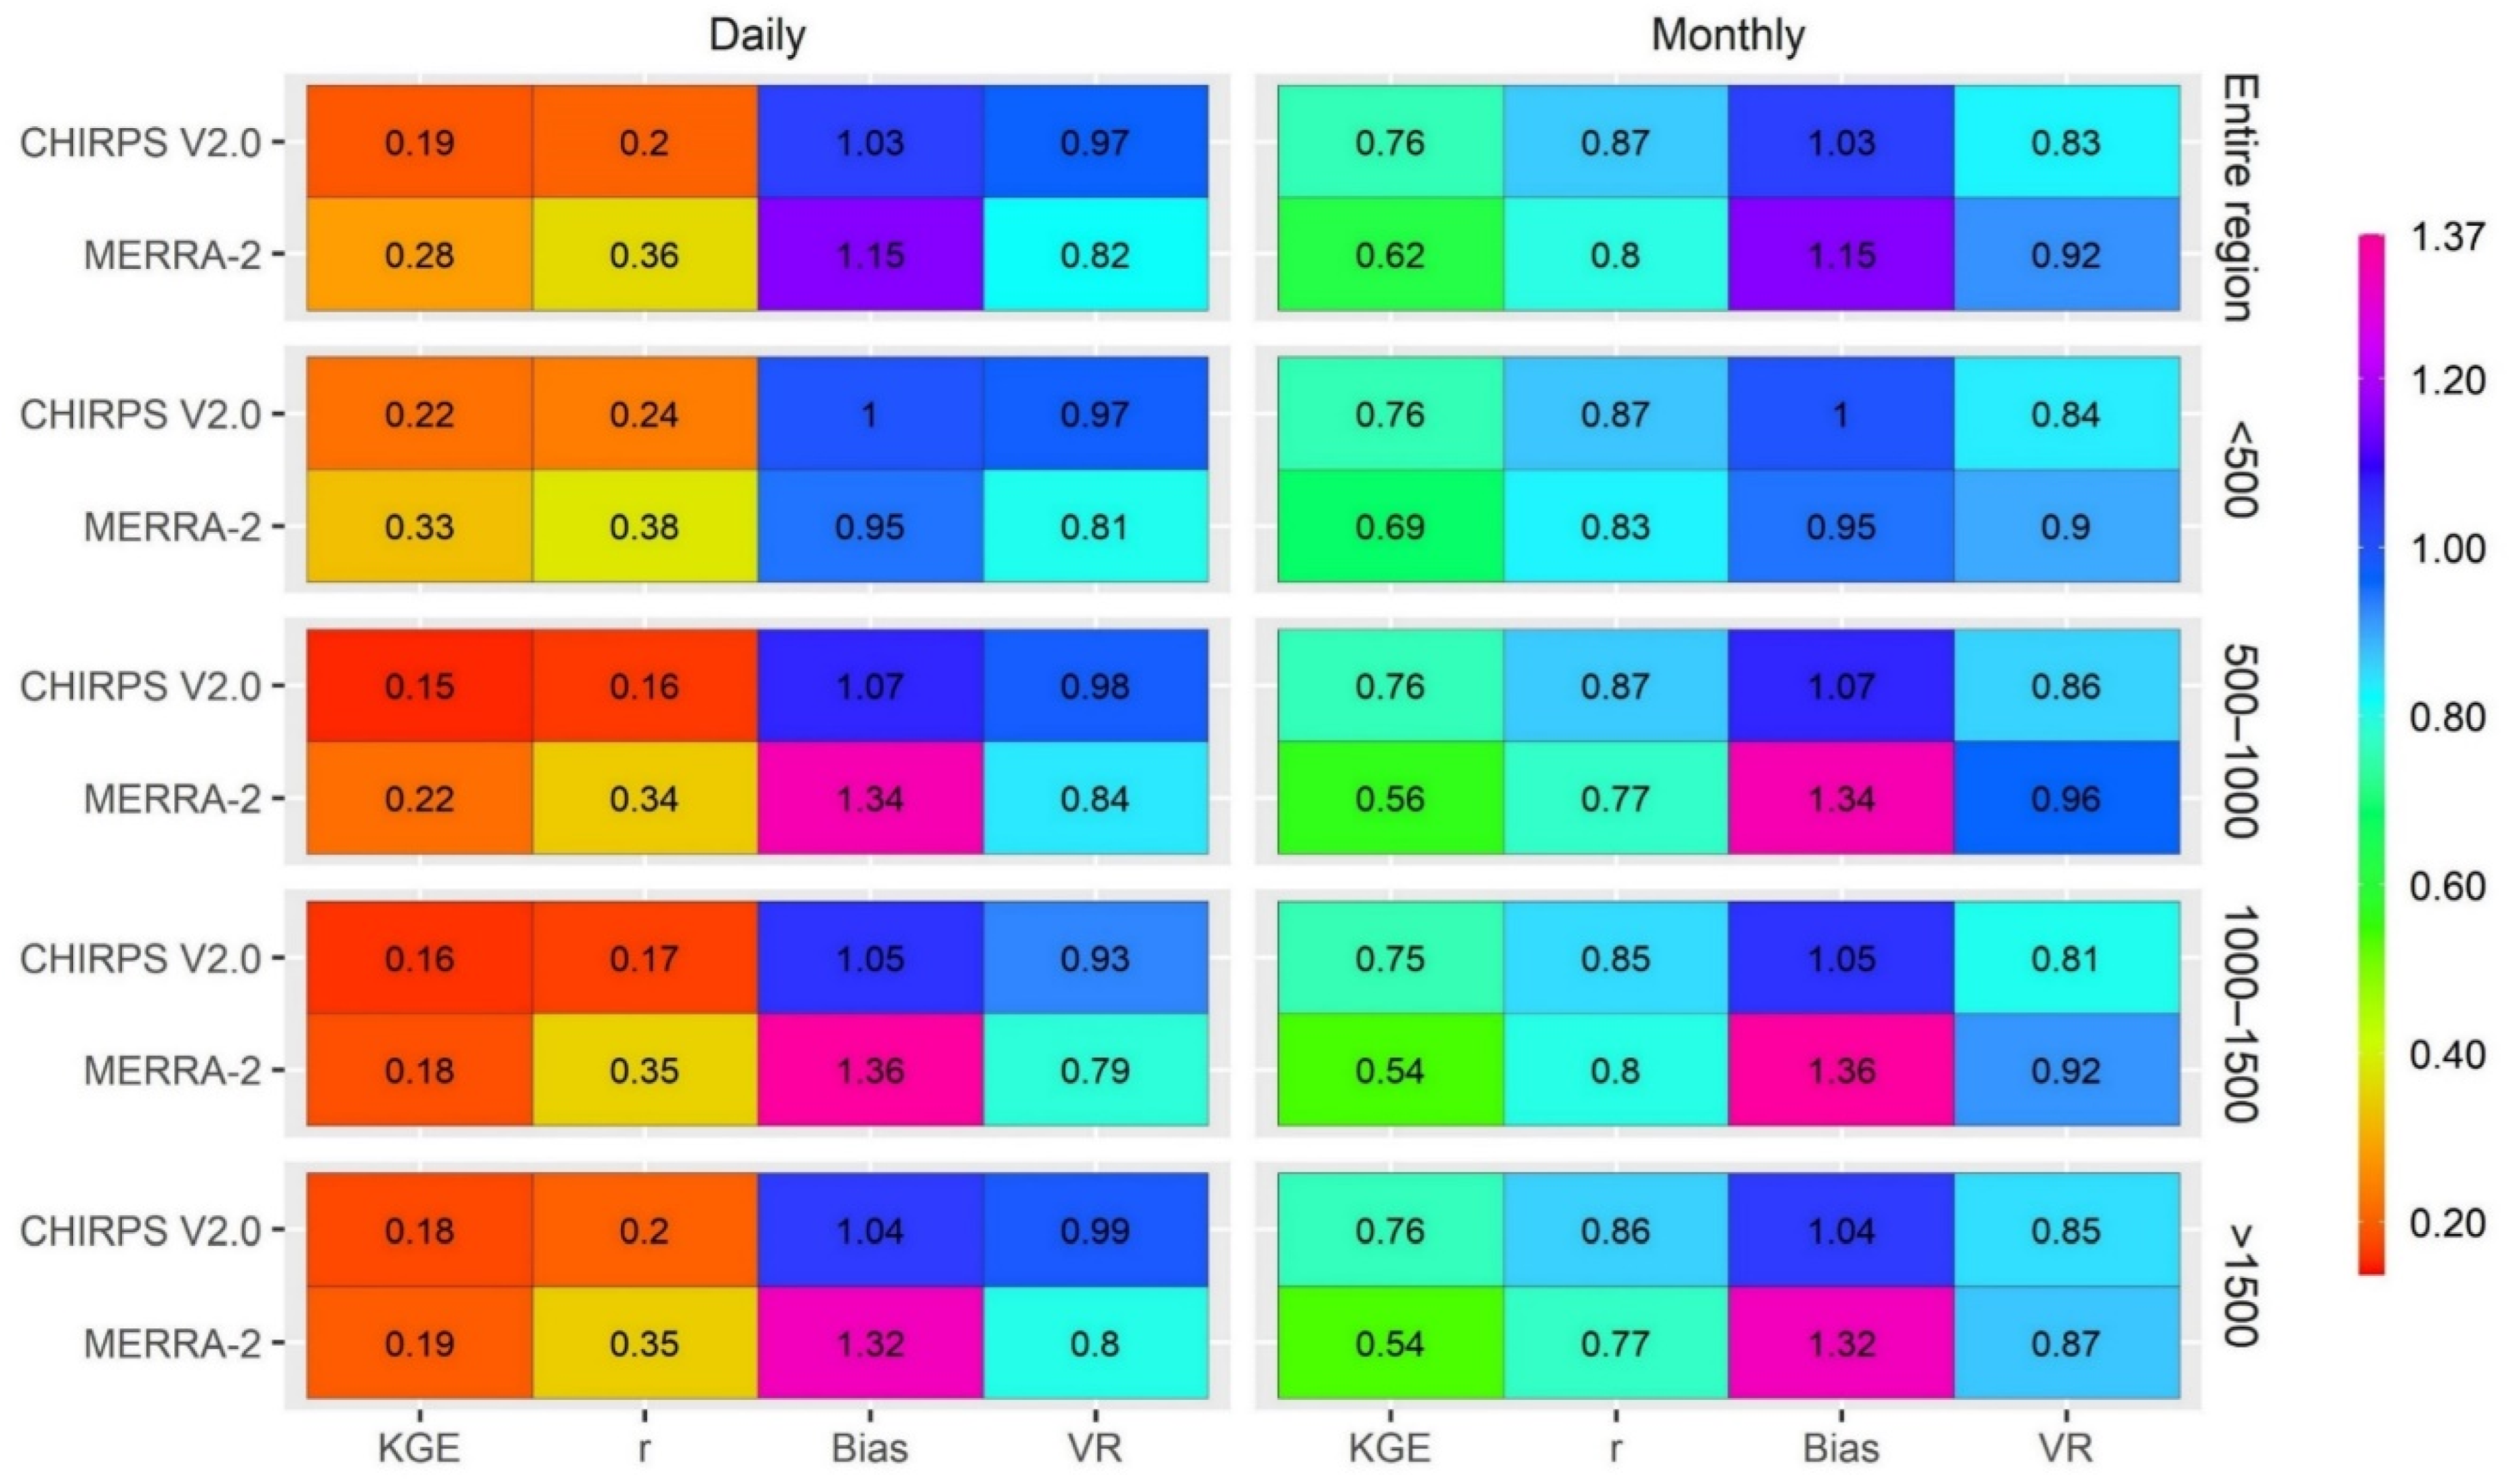
3.2. Performance Accuracy of GPDs at the Grid-Point and Reginal Scales

The reliability of select GPDs at the station location is expressed in the form of Kling-Gupta Efficiency (KGE) and its three components (correlation, Bias, and variability ratio) considering the daily and monthly time steps (Figure 3). Overall, both CHIRPSv2.0 and MERRA-2 show higher performance for the monthly precipitation than the daily time step. Considering daily precipitation, MERRA-2 shows higher performance compared to CHIRPSv2.0 at the grid-point level for the daily time step, which is relatively indicated by higher KGE and correlation coefficient (r) values. However, MERRA-2 shows a larger bias than CHIRPSv2.0, especially in the inner (with an elevation range of 500–1500 m) and eastern parts of the country for both time steps. Moreover, CHIRPSv2.0 is able to present effective monthly precipitation compared to MERRA-2, in terms of KGE and correlation, and shows lower bias comparatively. Overall, MERRA-2 shows lower performance over highly elevated parts (areas with an elevation of more than 1500 m), such as the eastern regions.
Figure 4 presents the performance of selected GPDs at the regional scale over the entire region and four distinct elevation ranges. Considering daily precipitation, MERRA-2 shows higher performance over the entire region (median KGE of; 0.28), and its performance varies from 0.18 to 0.33 over different elevation ranges. However, MERRA-2 dis-plays lower performance when the elevation is increased. On the other hand, CHIRPSv2.0 exhibits a stable but lower performance compared to MERRA-2 over different elevation ranges (median KGE of; 0.15–0.22). Moreover, both GPDs show significantly higher performance for monthly precipitation, but CHIRPSv2.0 outperforms MERRA-2 for the monthly time step. This can be attributed to the fact that MERRA-2 shows a slightly lower correlation compared to CHIRPSv2.0 for the monthly time step. Furthermore, CHIRPSv2.0 displays a variability ratio close to unity for the daily precipitation, whereas MERRA-2 shows a variability ratio closer to one for the monthly time step. Finally, both GPDs show a relatively higher correlation to the observed for the monthly time step compared to the daily time step.

3.3. Detection Ability of GPDs for Daily Precipitation

The detection ability of GPDs for different intensities is expressed in the form of Threat Score (TS), Pierce Skill Score (PSS), and Gilbert Skill Score (GSS) (Figure 5). Overall, both GPDs show higher detectability of no/tiny precipitation and moderate precipitation (5–20 mm/day). Generally, GPDs’ detection abilities decrease with the increase of precipitation intensities, which is generally the case in the literature. This was partly due to the demanding classification criteria: several intensity classes are selected, which makes it hard to differentiate among them instead of a simple rain/no rain scenario. Considering the detection ability of GPDs over the entire region and four elevation ranges, both GPDs show higher detectability of moderate precipitation than light precipitation. This may be due to the higher probability of the occurrence of moderate precipitation rather than light precipitation. However, MERRA-2 shows higher detectability strength compared to CHIRPSv2.0 over different elevation classes, and CHIRPSv2.0 only shows slightly higher detection ability for extreme (>40 mm/day) precipitation over areas with an elevation of less than 500 m, which mostly presents coastal regions in the country. Finally, both GPDs show higher detection ability for flat and low-land regions, and their detectability strength decreases as the elevation increases.

4. Conclusions

In this study, the spatio-temporal consistency of CHIRPSv2.0 and MERRA-2 are evaluated over four distinct elevation ranges, considering daily and monthly time steps. The observed precipitation data from 130 stations were collected for five hydrological years (2015–2019). The Kling–Gupta Efficiency (KGE), including its three components (Pearson correlation, the ratio of bias, and variability ratio), is selected for GPD stability evaluation over time and space. Moreover, three categorical metrics (TS, PSS, and GSS) are employed for GPDs detection ability analysis considering five precipitation intensities. Based on the comprehensive evaluation of GPDs, the following findings can be summarized:
  • MERRA-2 shows a higher precipitation amount (bias) for areas over 500 m elevation and becomes more observable over areas with an elevation of more than 1500 m, while CHIRPSv2.0 produces effective daily and monthly precipitation and it has a nearly perfect match with observed precipitation over areas having an elevation of more than 1500 m.
  • Overall, MERRA-2 exhibits higher performance compared to CHIRPSv2.0 for the daily time step, where CHIRPSv2.0 outperforms MERRA-2 considering the monthly time window.
  • Considering the performance of GPDs over different elevation ranges, CHIRPSv2.0 presents a relatively stable performance compared to MERRA-2 for both daily and monthly precipitation.
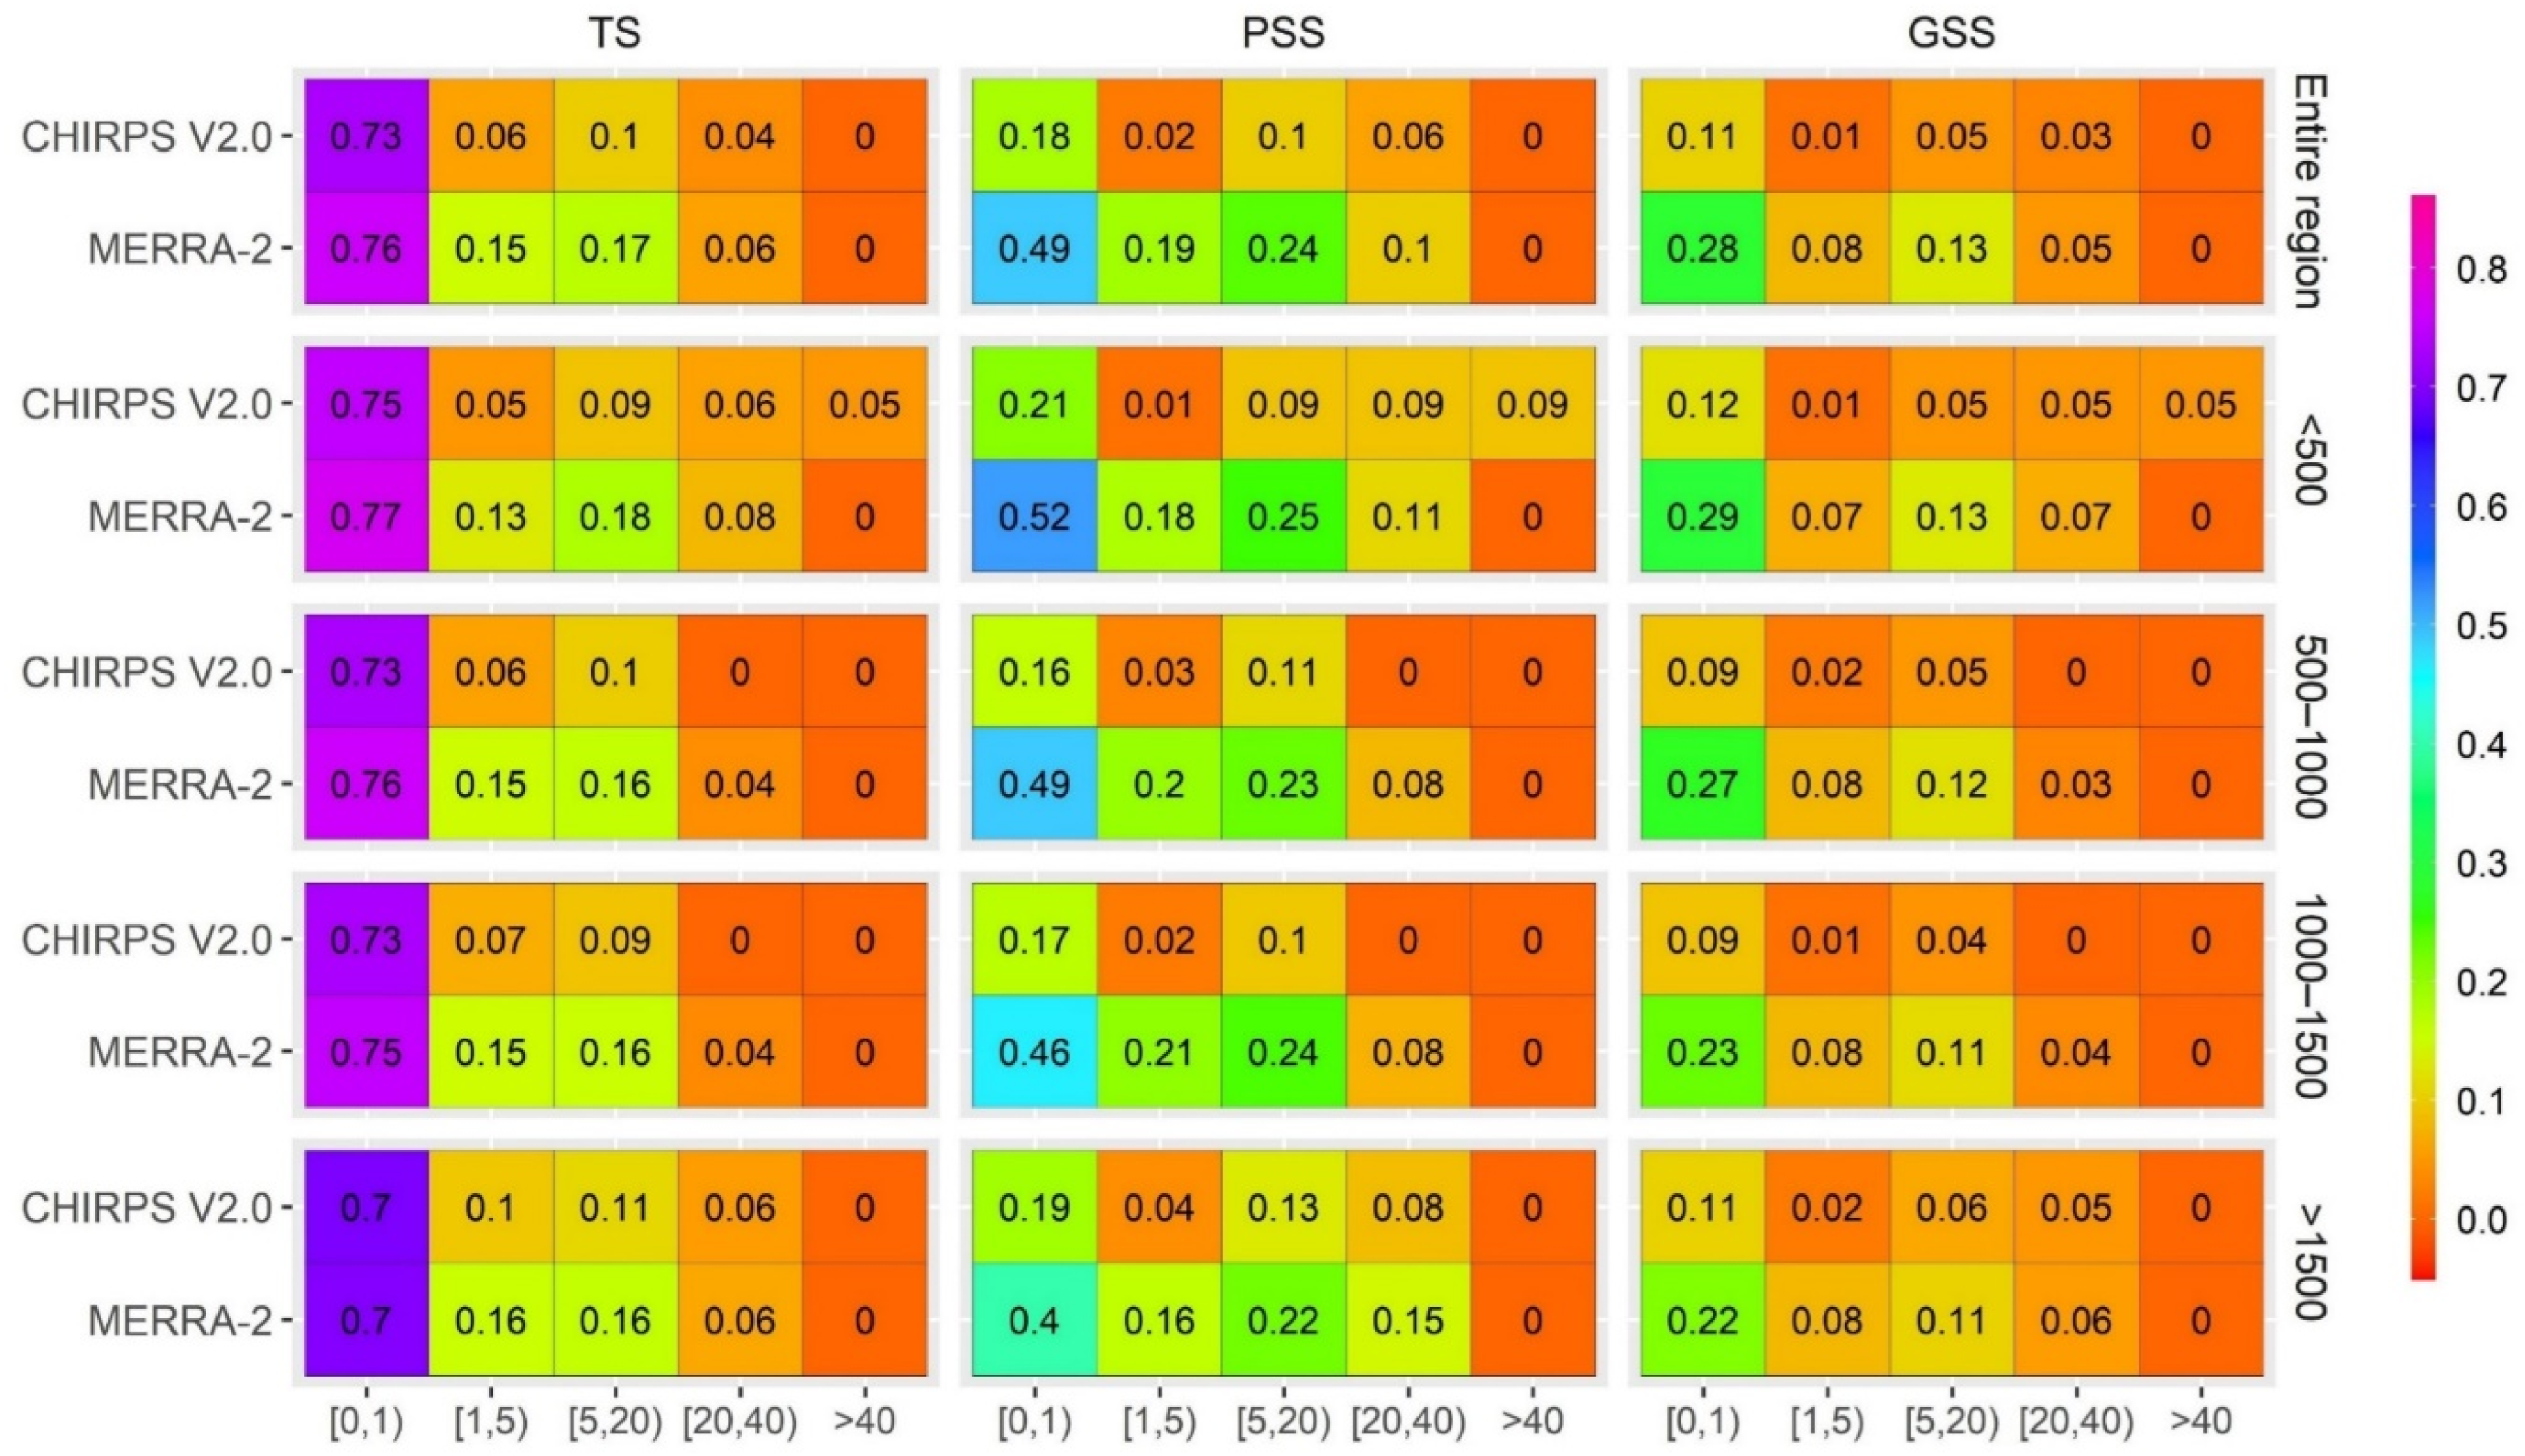
  • Overall, MERRA-2 displays relatively higher detectability strength compared to CHIRPSv2.0 for different precipitation intensities, while CHIRPSv2.0 shows detection ability higher than MERRA-2 only for extreme precipitation over areas with less than 500 m elevation. Moreover, both the CHIRPSv2.0 and MERRA-2 detection abilities decrease as the intensity and elevation increase.
The results of this study provide an insight for both GPDs’ developers and end users to consider these findings as guidance for future GPD development and in careful selection of GPDs for research purposes.

Author Contributions

H.H. contributed to the methodology, data analysis and drafted the first manuscript. A.A.S. helped in conceptualization, supervision, and editing. All authors have read and agreed to the published version of the manuscript.

Funding

This study was partly supported by the Eskisehir Technical University Scientific Research Project (Project No.: 20DRP214).

Institutional Review Board Statement

Not applicable.

Informed Consent Statement

Not applicable.

Data Availability Statement

Publicly available datasets were analyzed in this study.

Acknowledgments

The authors of this research would like to express their gratitude to Turkey’s General Directorate of Meteorology (GDM), as well as all other organizations that contributed to this study by providing data. In addition, we are grateful for the time and effort contributed by panel members and editors.

Conflicts of Interest

The authors declare no conflict of interest.

References

  1. Xu, J.; Ma, Z.; Yan, S.; Peng, J. Do ERA5 and ERA5-land precipitation estimates outperform satellite-based precipitation products? A comprehensive comparison between state-of-the-art model-based and satellite-based precipitation products over mainland China. J. Hydrol. 2022, 605, 127353. [Google Scholar] [CrossRef]
  2. Talchabhadel, R.; Aryal, A.; Kawaike, K.; Yamanoi, K.; Nakagawa, H.; Bhatta, B.; Karki, S.; Thapa, B.R. Evaluation of precipitation elasticity using precipitation data from ground and satellite-based estimates and watershed modeling in Western Nepal. J. Hydrol. Reg. Stud. 2021, 33, 100768. [Google Scholar] [CrossRef]
  3. Hafizi, H.; Sorman, A.A. Assessment of Satellite and Reanalysis Precipitation Products for Rainfall–Runoff Modelling in a Mountainous Basin. Environ. Sci. Proc. 2021, 8, 25. [Google Scholar]
  4. Uysal, G.; Şorman, A.Ü. Evaluation of PERSIANN family remote sensing precipitation products for snowmelt runoff estimation in a mountainous basin. Hydrol. Sci. J. 2021, 66, 1790–1807. [Google Scholar] [CrossRef]
  5. Wang, Q.; Xia, J.; She, D.; Zhang, X.; Liu, J.; Zhang, Y. Assessment of four latest long-term satellite-based precipitation products in capturing the extreme precipitation and streamflow across a humid region of southern China. Atmos. Res. 2021, 257, 105554. [Google Scholar] [CrossRef]
  6. Abd Elhamid, A.M.; Eltahan, A.M.; Mohamed, L.M.; Hamouda, I.A. Assessment of the two satellite-based precipitation products TRMM and RFE rainfall records using ground based measurements. Alex. Eng. J. 2020, 59, 1049–1058. [Google Scholar] [CrossRef]
  7. Iizumi, T.; Takikawa, H.; Hirabayashi, Y.; Hanasaki, N.; Nishimori, M. Contributions of different bias-correction methods and reference meteorological forcing data sets to uncertainty in projected temperature and precipitation extremes. J. Geophys. Res. Atmos. 2017, 122, 7800–7819. [Google Scholar] [CrossRef]
  8. Xie, P.; Chen, M.; Yang, S.; Yatagai, A.; Hayasaka, T.; Fukushima, Y.; Liu, C. A Gauge-Based Analysis of Daily Precipitation over East Asia. J. Hydrometeorol. 2007, 8, 607–626. [Google Scholar] [CrossRef]
  9. Sorooshian, S.; Hsu, K.-L.; Gao, X.; Gupta, H.V.; Imam, B.; Braithwaite, D. Evaluation of PERSIANN system satellite-based estimates of tropical rainfall. Bull. Am. Meteorol. Soc. 2000, 81, 2035–2046. [Google Scholar] [CrossRef]
  10. Huffman, G.J.; Bolvin, D.T.; Nelkin, E.J. Integrated Multi-satellitE Retrievals for GPM (IMERG) technical documentation. NASA/GSFC Code 2015, 612, 2019. [Google Scholar]
  11. Hersbach, H.; Bell, B.; Berrisford, P.; Hirahara, S.; Horányi, A.; Muñoz-Sabater, J.; Nicolas, J.; Peubey, C.; Radu, R.; Schepers, D. The ERA5 global reanalysis. Q. J. R. Meteorol. Soc. 2020, 146, 1999–2049. [Google Scholar] [CrossRef]
  12. Funk, C.; Peterson, P.; Landsfeld, M.; Pedreros, D.; Verdin, J.; Shukla, S.; Husak, G.; Rowland, J.; Harrison, L.; Hoell, A. The climate hazards infrared precipitation with stations—A new environmental record for monitoring extremes. Sci. Data 2015, 2, 150066. [Google Scholar] [CrossRef] [PubMed]
  13. Gelaro, R.; McCarty, W.; Suárez, M.J.; Todling, R.; Molod, A.; Takacs, L.; Randles, C.A.; Darmenov, A.; Bosilovich, M.G.; Reichle, R. The modern-era retrospective analysis for research and applications, version 2 (MERRA-2). J. Clim. 2017, 30, 5419–5454. [Google Scholar] [CrossRef] [PubMed]
  14. Hafizi, H.; Sorman, A.A. Assessment of 13 Gridded Precipitation Datasets for Hydrological Modeling in a Mountainous Basin. Atmosphere 2022, 13, 143. [Google Scholar] [CrossRef]
  15. Uysal, G.; Hafizi, H.; Sorman, A.A. Spatial and temporal evaluation of multiple gridded precipitation datasets over complex topography and variable climate of Turkey. In Proceedings of the EGU General Assembly Conference Abstracts, Online, 19–30 April 2021; p. EGU21-14239. [Google Scholar]
  16. Wei, L.; Jiang, S.; Ren, L.; Wang, M.; Zhang, L.; Liu, Y.; Yuan, F.; Yang, X. Evaluation of seventeen satellite-, reanalysis-, and gauge-based precipitation products for drought monitoring across mainland China. Atmos. Res. 2021, 263, 105813. [Google Scholar] [CrossRef]
  17. Satgé, F.; Defrance, D.; Sultan, B.; Bonnet, M.-P.; Seyler, F.; Rouché, N.; Pierron, F.; Paturel, J.-E. Evaluation of 23 gridded precipitation datasets across West Africa. J. Hydrol. 2020, 581, 124412. [Google Scholar] [CrossRef]
  18. Beck, H.E.; Pan, M.; Roy, T.; Weedon, G.P.; Pappenberger, F.; Van Dijk, A.I.; Huffman, G.J.; Adler, R.F.; Wood, E.F. Daily evaluation of 26 precipitation datasets using Stage-IV gauge-radar data for the CONUS. Hydrol. Earth Syst. Sci. 2019, 23, 207–224. [Google Scholar] [CrossRef]
  19. Liu, J.; Shangguan, D.; Liu, S.; Ding, Y.; Wang, S.; Wang, X. Evaluation and comparison of CHIRPS and MSWEP daily-precipitation products in the Qinghai-Tibet Plateau during the period of 1981–2015. Atmos. Res. 2019, 230, 104634. [Google Scholar] [CrossRef]
  20. Amjad, M.; Yilmaz, M.T.; Yucel, I.; Yilmaz, K.K. Performance evaluation of satellite-and model-based precipitation products over varying climate and complex topography. J. Hydrol. 2020, 584, 124707. [Google Scholar] [CrossRef]
  21. Sensoy, S. The mountains influence on Turkey climate. In Proceedings of the Balwois Conference on Water Observation and Information System for Decision Support, Ohrid, Macedonia, 25–29 May 2004. [Google Scholar]
  22. Kling, H.; Fuchs, M.; Paulin, M. Runoff conditions in the upper Danube basin under an ensemble of climate change scenarios. J. Hydrol. 2012, 424, 264–277. [Google Scholar] [CrossRef]
  23. Zambrano-Bigiarini, M.; Nauditt, A.; Birkel, C.; Verbist, K.; Ribbe, L. Temporal and spatial evaluation of satellite-based rainfall estimates across the complex topographical and climatic gradients of Chile. Hydrol. Earth Syst. Sci. 2017, 21, 1295. [Google Scholar] [CrossRef]
Figure 1. Shows the digital elevation model (DEM) using 30 m SRTM (Shuttle Radar Topography Mission—https://eartheplorer.usgs.gov (accessed on 3 May 2022)) and station distribution over different elevation ranges.
Environsciproc 19 00021 g001
Figure 2. Mean daily and monthly precipitation from observed, CHIRPSv2.0, and MERRA-2 over the entire region and four elevation ranges.
Environsciproc 19 00021 g002
Figure 3. Reliability of CHIRPSv2.0 and MERRA-2 at the station location expressed in the form of KGE and its three components for daily and monthly precipitation.
Environsciproc 19 00021 g003
Figure 4. Reliability of CHIRPSv2.0 and MERRA-2 at the regional scale expressed in the form of KGE and its three components for daily and monthly precipitation.
Environsciproc 19 00021 g004
Figure 5. GPDs’ skill in reproducing daily precipitation events of different intensities is stated in the form of TS, PSS, and GSS over the entire region and four elevation ranges.
Environsciproc 19 00021 g005
Publisher’s Note: MDPI stays neutral with regard to jurisdictional claims in published maps and institutional affiliations.

