Proceeding Paper

Local Climate Zones (LCZs) and Urban Morphological Parameters Using GIS: An Application to Italian Cities †

by
Riccardo Buccolieri
1,*,
Antonio Esposito
1,
Gianluca Pappaccogli
2,
Myrtille Grulois
3,
Antonio Donateo
2,
Jose Luis Santiago
4,
Alberto Martilli
4,
Giuseppe Maffeis
5 and
Pietro Salizzoni
3
1
Dipartimento di Scienze e Tecnologie Biologiche ed Ambientali, University of Salento, S.P. 6 Lecce-Monteroni, 73100 Lecce, Italy
2
National Research Council of Italy, Institute of Atmospheric Sciences and Climate (CNR-ISAC), 73100 Lecce, Italy
3
École Centrale de Lyon, 36 Avenue Guy de Collongue, 69134 Lyon, France
4
Environment Department, CIEMAT, Av. Complutense, 40, 28040 Madrid, Spain
5
TerrAria s.r.l., Via Melchiorre Gioia 132, 20125 Milan, Italy
*
Author to whom correspondence should be addressed.
Presented at the 5th International Electronic Conference on Atmospheric Sciences, 16–31 July 2022; Available online: https://ecas2022.sciforum.net/.
Environ. Sci. Proc. 2022, 19(1), 15; https://doi.org/10.3390/ecas2022-12795
Published: 14 July 2022
(This article belongs to the Proceedings of The 5th International Electronic Conference on Atmospheric Sciences)

Abstract

:
LCZs refer to a classification system that exists out of 17 classes, 10 of which can be described as urban, proposed as the new standard for characterizing and comparing urban landscapes. This study evaluates the reliability of the LCZ level 0 map obtained from WUDAPT by comparing it with a more detailed LCZ map inferred from the morphological information of several Italian cities. Morphological data from Digital Elevation Models (DEMs) are used to obtain a detailed morphological characterization of each city. Preliminary results for the city of Lecce show that the WUDAPT L0 method misclassified some LCZs, especially at the core urban cells, whereas wider matching is observed at the boundary between urban and rural areas.

1. Introduction

Local Climate Zones (LCZs) were introduced in 2012 as a new standard for characterizing urban landscapes that considers the micro-scale of land cover and the associated physical properties. LCZs refer to a classification system based on 17 classes, 10 of which can be described as urban (Figure 1). The LCZ classes are formally defined as regions of uniform surface cover, structure, material, and human activity that span hundreds of meters to several kilometers in a horizontal scale [1].
The concept of LCZs contributed to a progressive step in the thermal analysis of urban areas. Thermal differences, for example in Urban Heat Island/surface Urban Heat Island (UHI/SUHI) intensities, are no longer confined to urban/rural temperature differences, but can also focus more closely on the differences between LCZs. Thus, the LCZ system provides an approach to the comparison of the thermal features of various neighborhoods/areas within a city (intra-urban analysis), and/or a comparison of similar types of neighborhoods/areas between cities (inter-urban analysis). The concept of LCZ classification has found wide acceptance and application in a range of urban climate investigations, as recently reviewed by Lehnert et al. [2].
LCZ maps of the city are referred to as the Level 0 product as they represent the first level of information about urban areas. Levels 1 and 2 represent more detailed and higher resolution information [4]. The World Urban Database and Access Portal Tools (WUDAPT, www.wudapt.org) community provides a procedure for generating the LCZ level 0 product, which uses freely available Landsat imagery, Google Earth for creating the training areas (TAs) [5].
There are other approaches for generating LCZ level 0 products that can also lead to more detailed Level 1 and 2 data. Where the data are available, administrative data (on building footprints, heights, green spaces, etc.) and Geographic Information System (GIS) software can be used. Raster-based methods superimpose a standard grid over the urban landscape and information about selected variables (e.g., building height, sky view factor) can be acquired at the scale of the individual cell. Each variable represents a layer, and the gridded layers are then combined using rules to generate LCZ types. This method has been used to generate LCZ maps for Hong Kong [6,7], Nagpur in India [8], three medium-sized Central European cities, Brno, Hradec Kralove, and Olomouc in the Czech Republic [9] and for Bilbao (ES) [10]. Vector-based methods capture the boundary of the LCZ neighborhood and represent a more precise delineation of contiguous neighborhood types as individual objects, as employed by Unger et al. [11] for Szeged (HU), Perera et al. [12] for Colombo (Sri Lanka) and Muhammad et al. [13] for Berlin (DE).
This study compares the LCZ level 0 map obtained from WUDAPT (LCZ WUDAPT hereinafter) with a more detailed LCZ map retrieved from the morphological information (LCZ GIS) of several Italian cities and shows the main differences in terms of the fraction of an area that has been classified correctly (same in WUDAPT and GIS), over the total area. For this purpose, morphological data from Digital Elevation Models (DEMs) are used to obtain different morphological parameters used for the detailed classification of LCZ classes.

2. Methodology

Both the LCZ WUDAPT and the LCZ GIS maps are currently being produced for several Italian cities (Lecce, Bari, Naples, Rome and Milan).

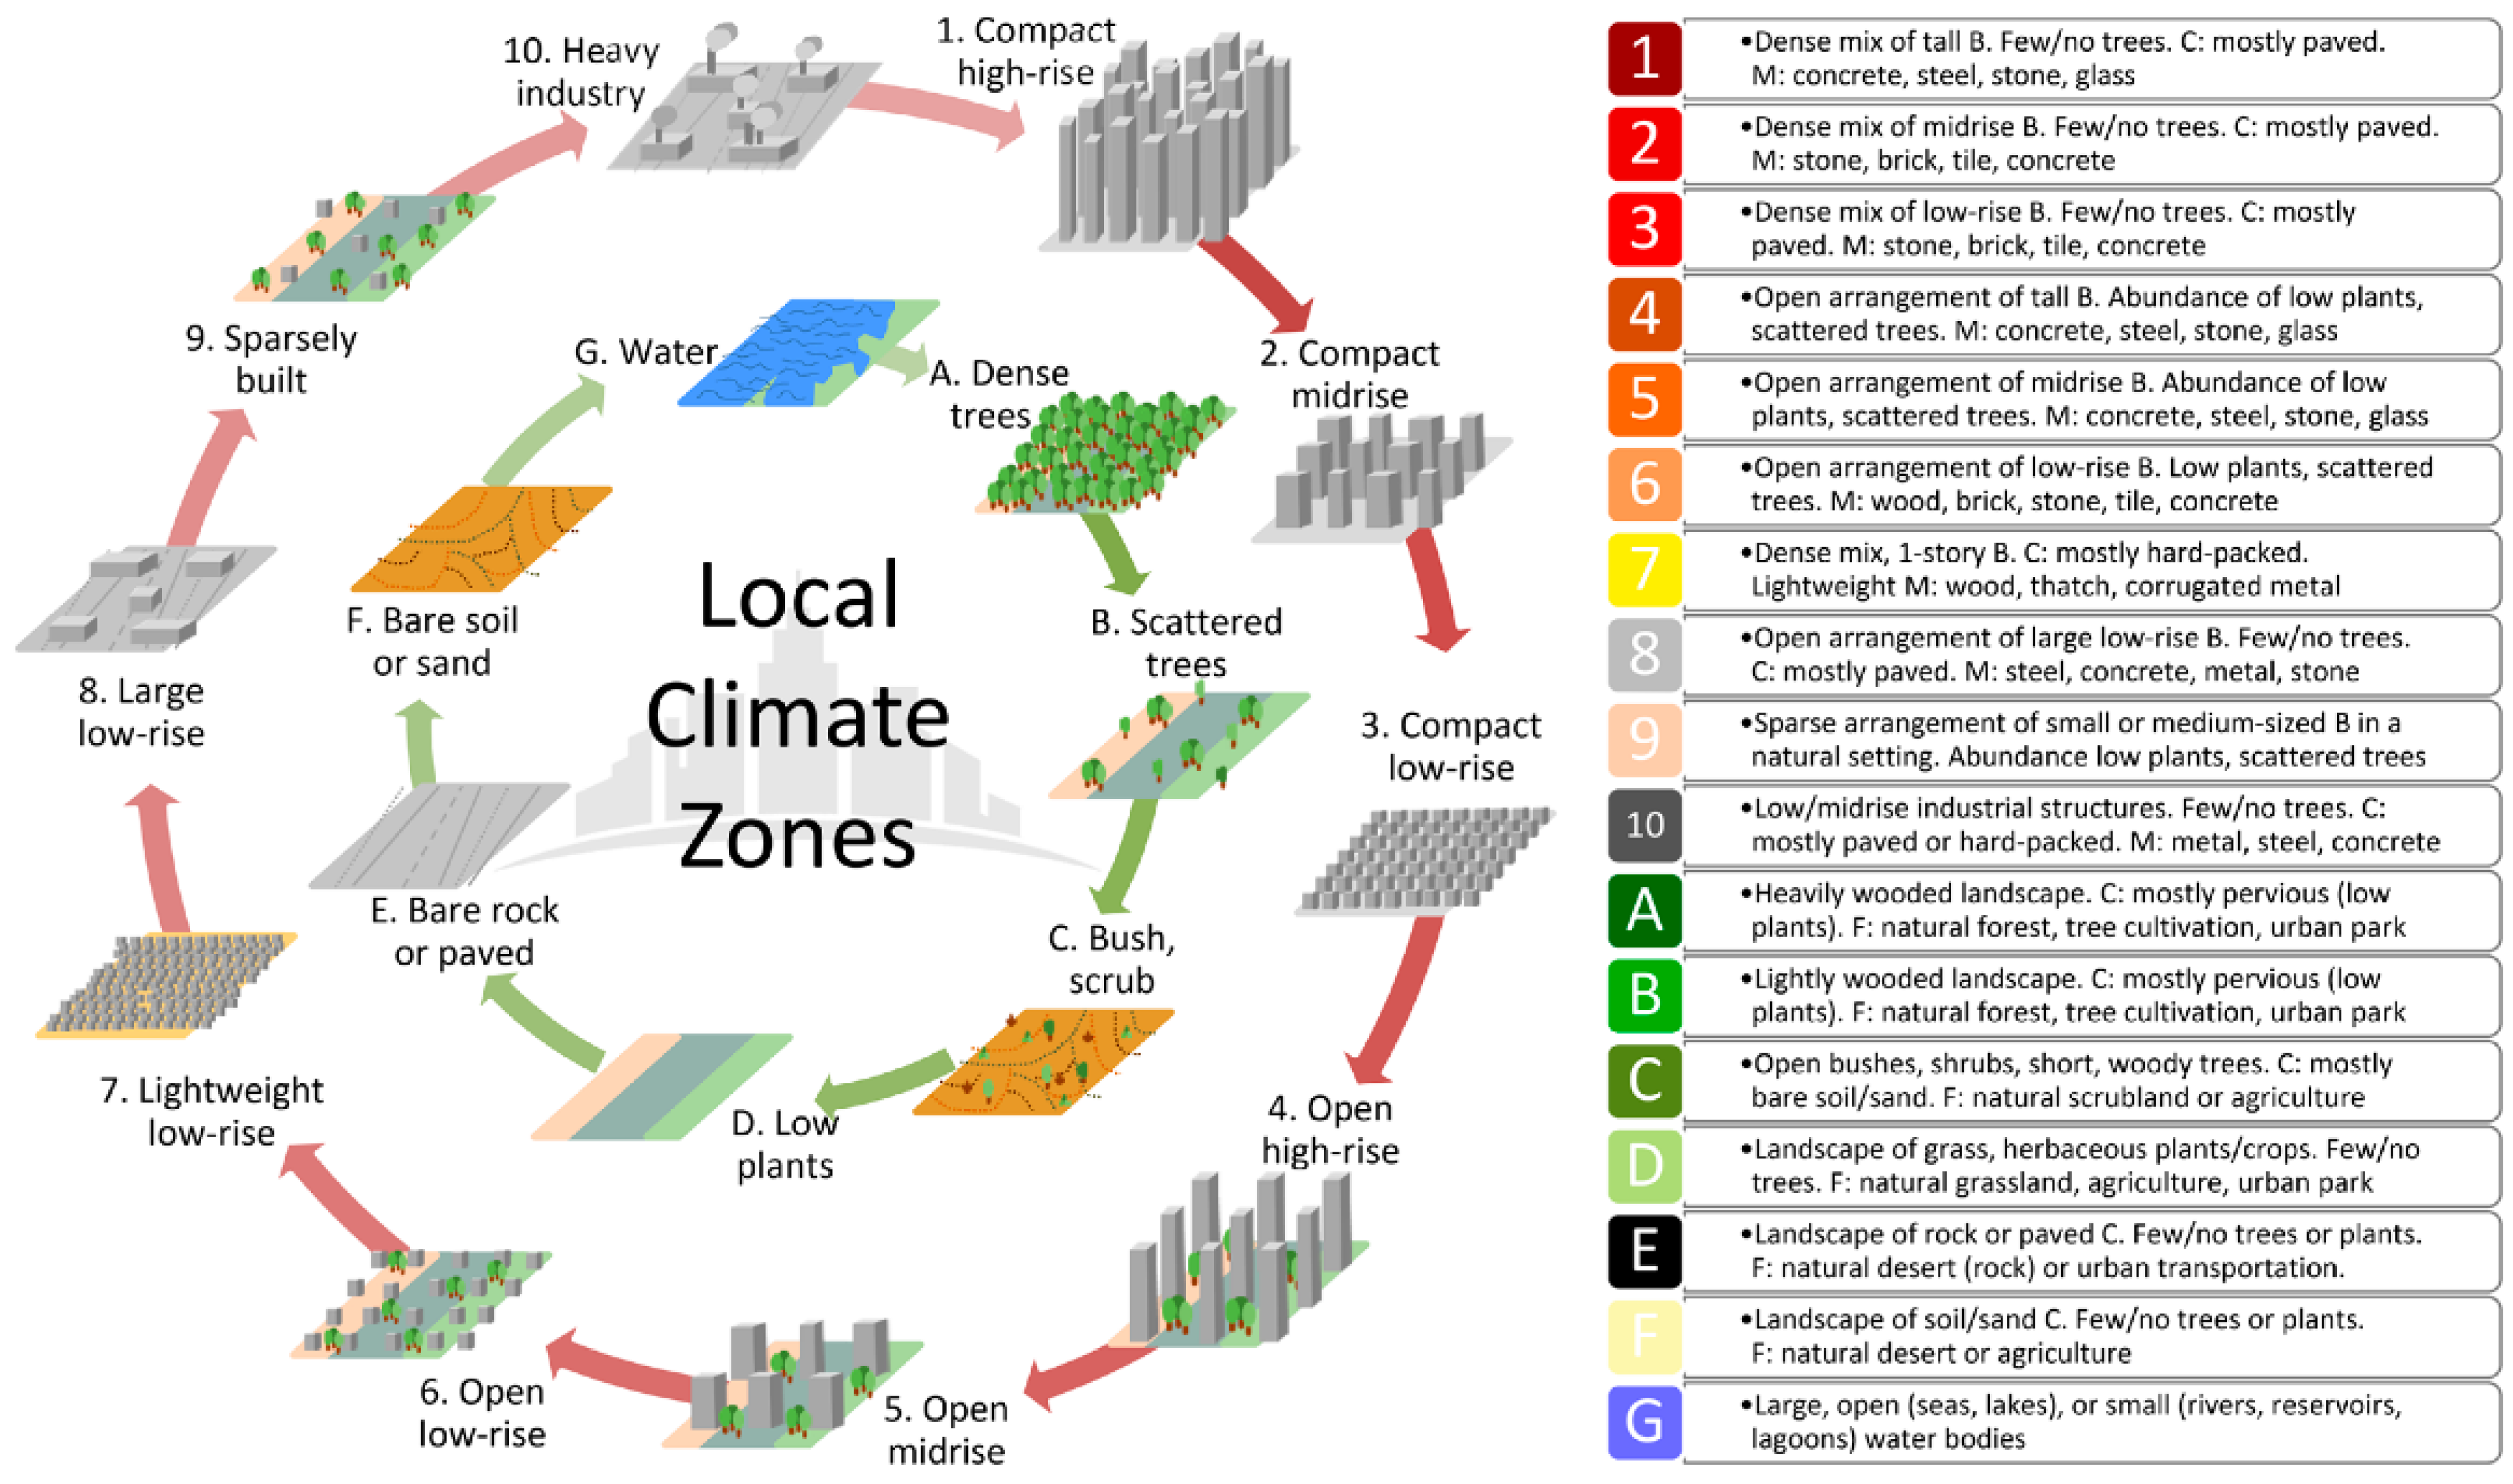
2.1. LCZ Map Generated in WUDAPT

Following the standard procedure formalized by Bechtel et al. [14] and adopted by the WUDAPT community project, an “off-line” workflow that integrates training areas (TAs, a set of LCZ labeled polygons) and Landsat 8 (L8) imagery within the SAGA software package [15] over a limited spatial domain of different cities is followed. More specifically, each TA is identified using Google Earth images aided by the visual and numerical information provided in Stewart and Oke [1]. The TAs dataset is used to extract spectral information from L8 images, which in turn is used in a supervised random forest classifier to categorize the entire region of interest into LCZ types. The LCZ Generator (https://lcz-generator.rub.de (accessed on 31 May 2022)) is employed to map the cities into LCZs, solely expecting a valid training area file and some metadata as input [16].

2.2. LCZ Map Based on Morphological Parameters Using GIS

For the detailed study of the parameters that constitute the LCZ classes, DEMs of the cities are used in combination with shape files representing the buildings. Using QGIS, the following parameters are calculated: mean building height, fractional area of buildings (λp), fraction of urban land use (λu), pervious surface fraction, aspect ratio and sky view factor. A detailed description of the parameters can be found in Grimmond and Oke [17] and Burian et al. [18]. These parameters are calculated as mean values for each 100 m × 100 m cell over the grid covering the city. The detailed LCZ map is based on the parameters dataset to fit the LCZ look-up table as defined by Stewart and Oke [1].

3. Results and Discussion

Here, as an example of application, preliminary results are shown for the city of Lecce.

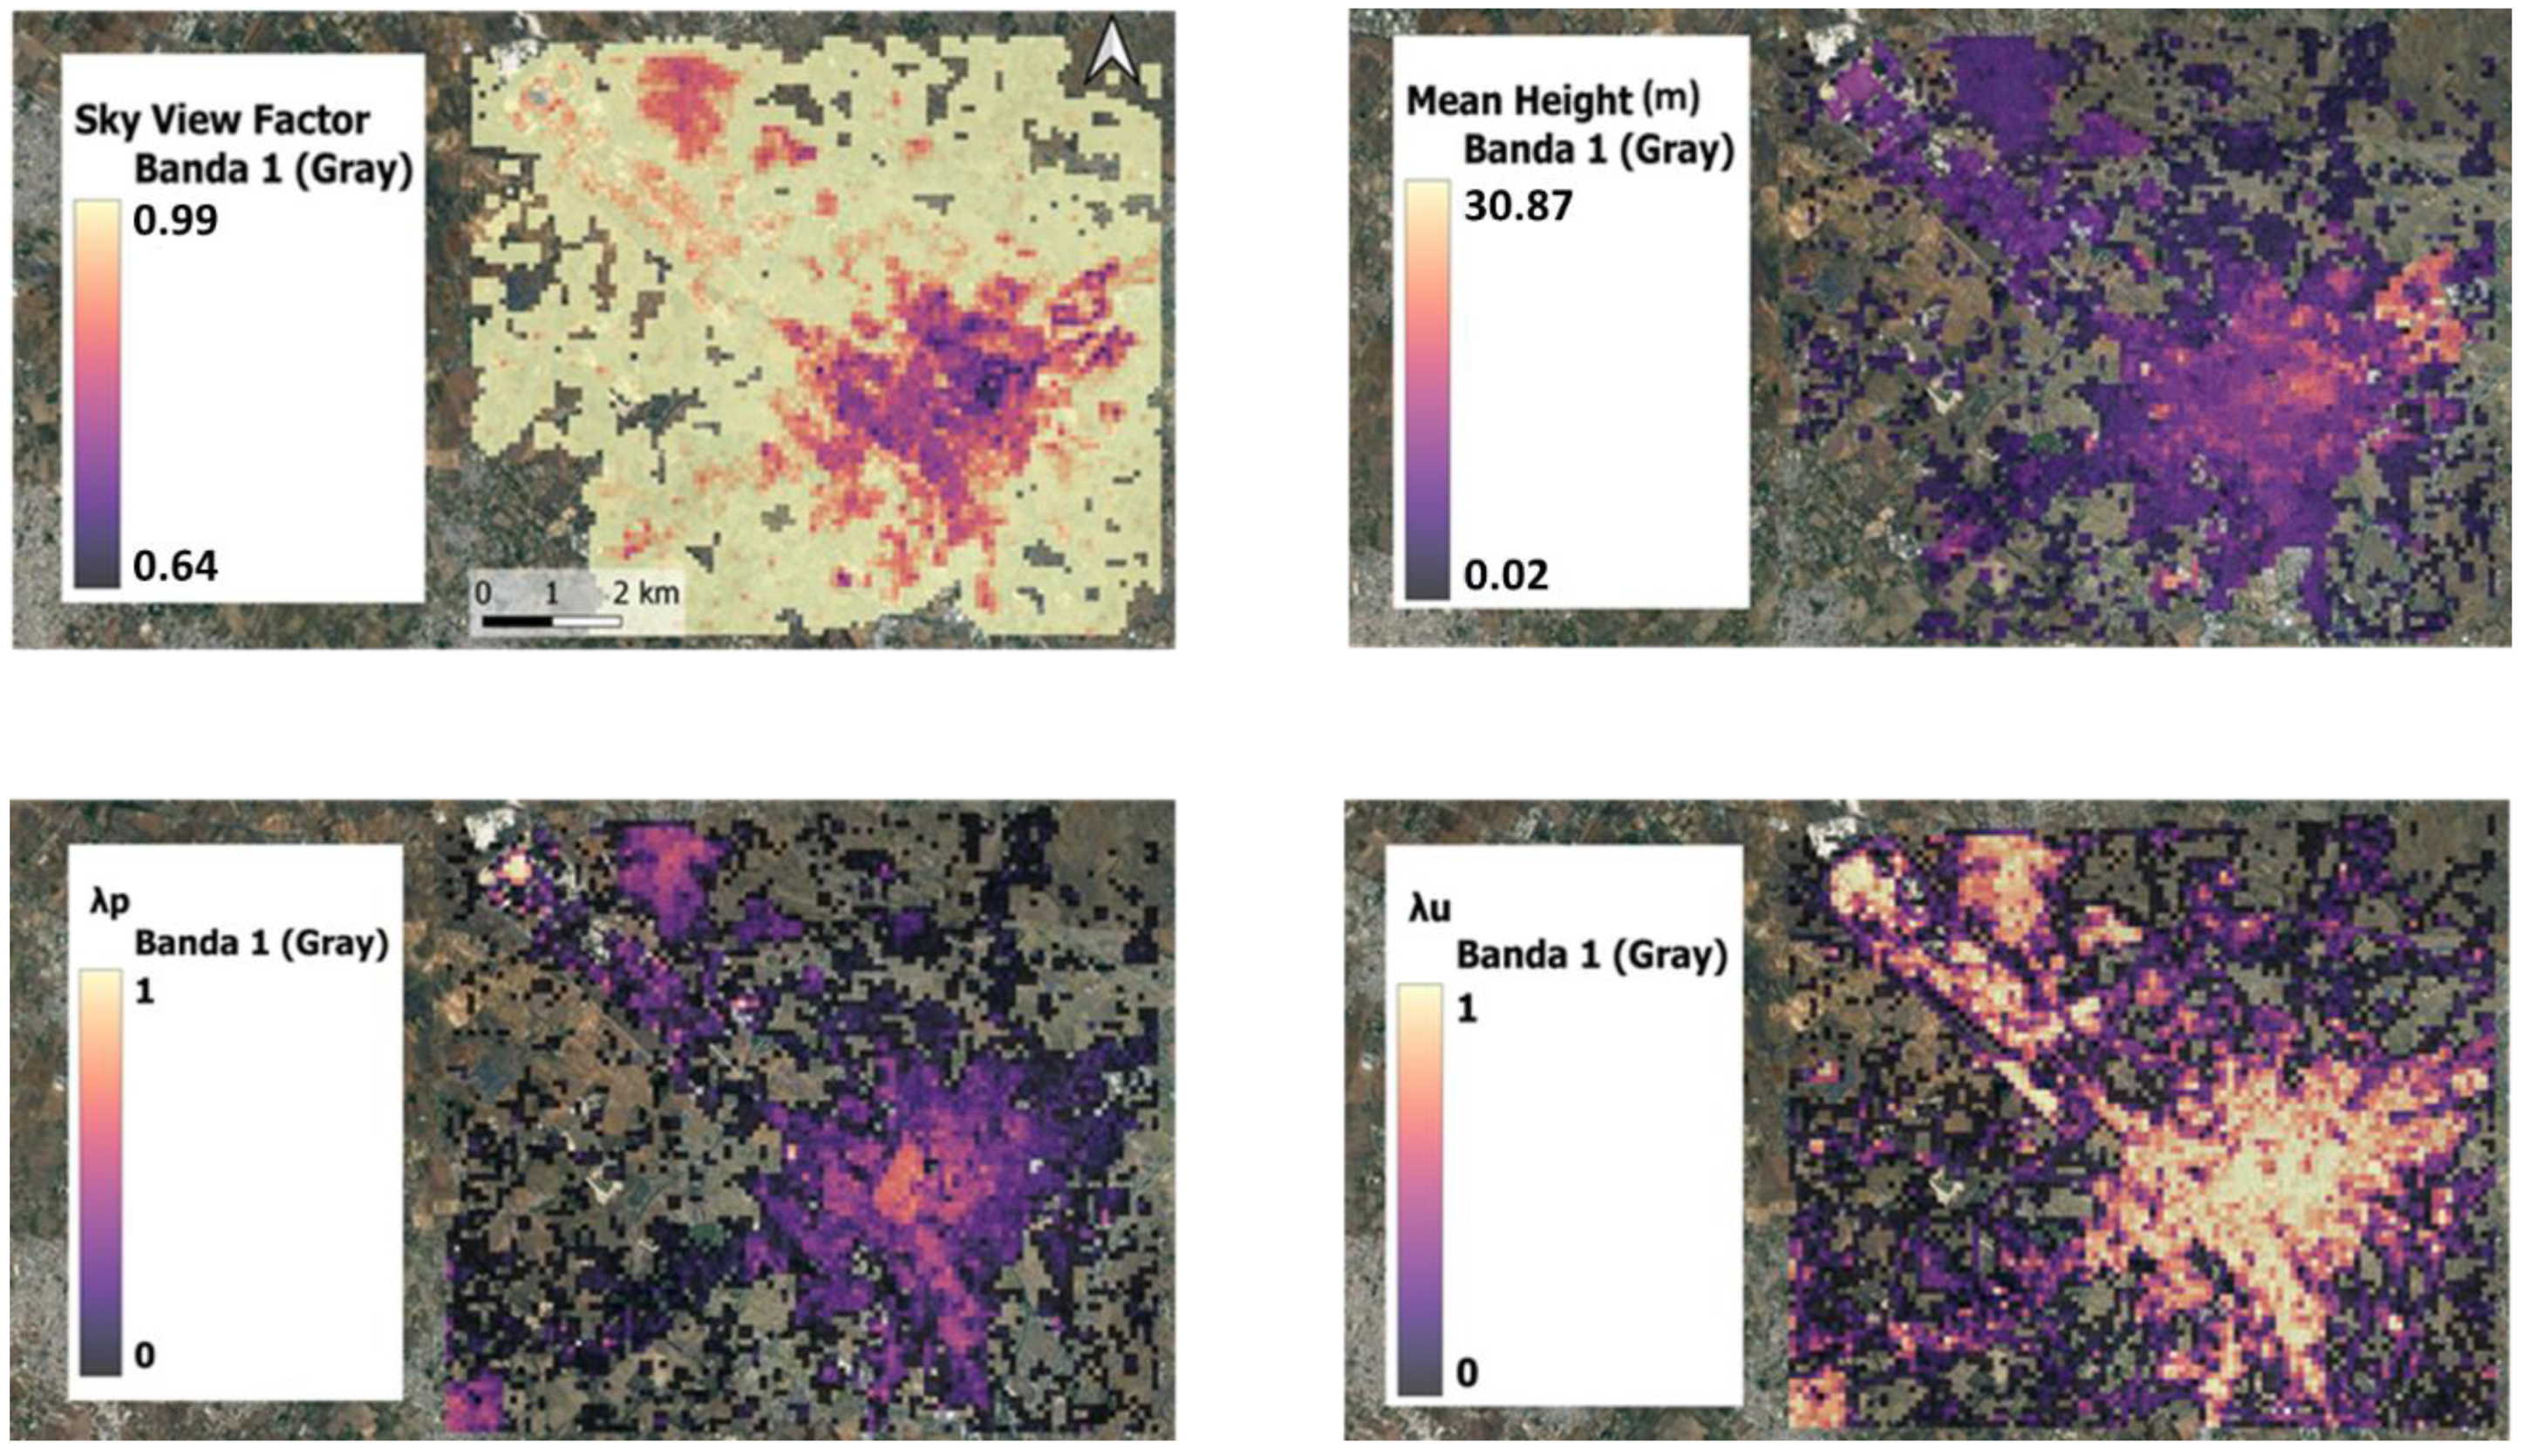
3.1. Morphological Analysis
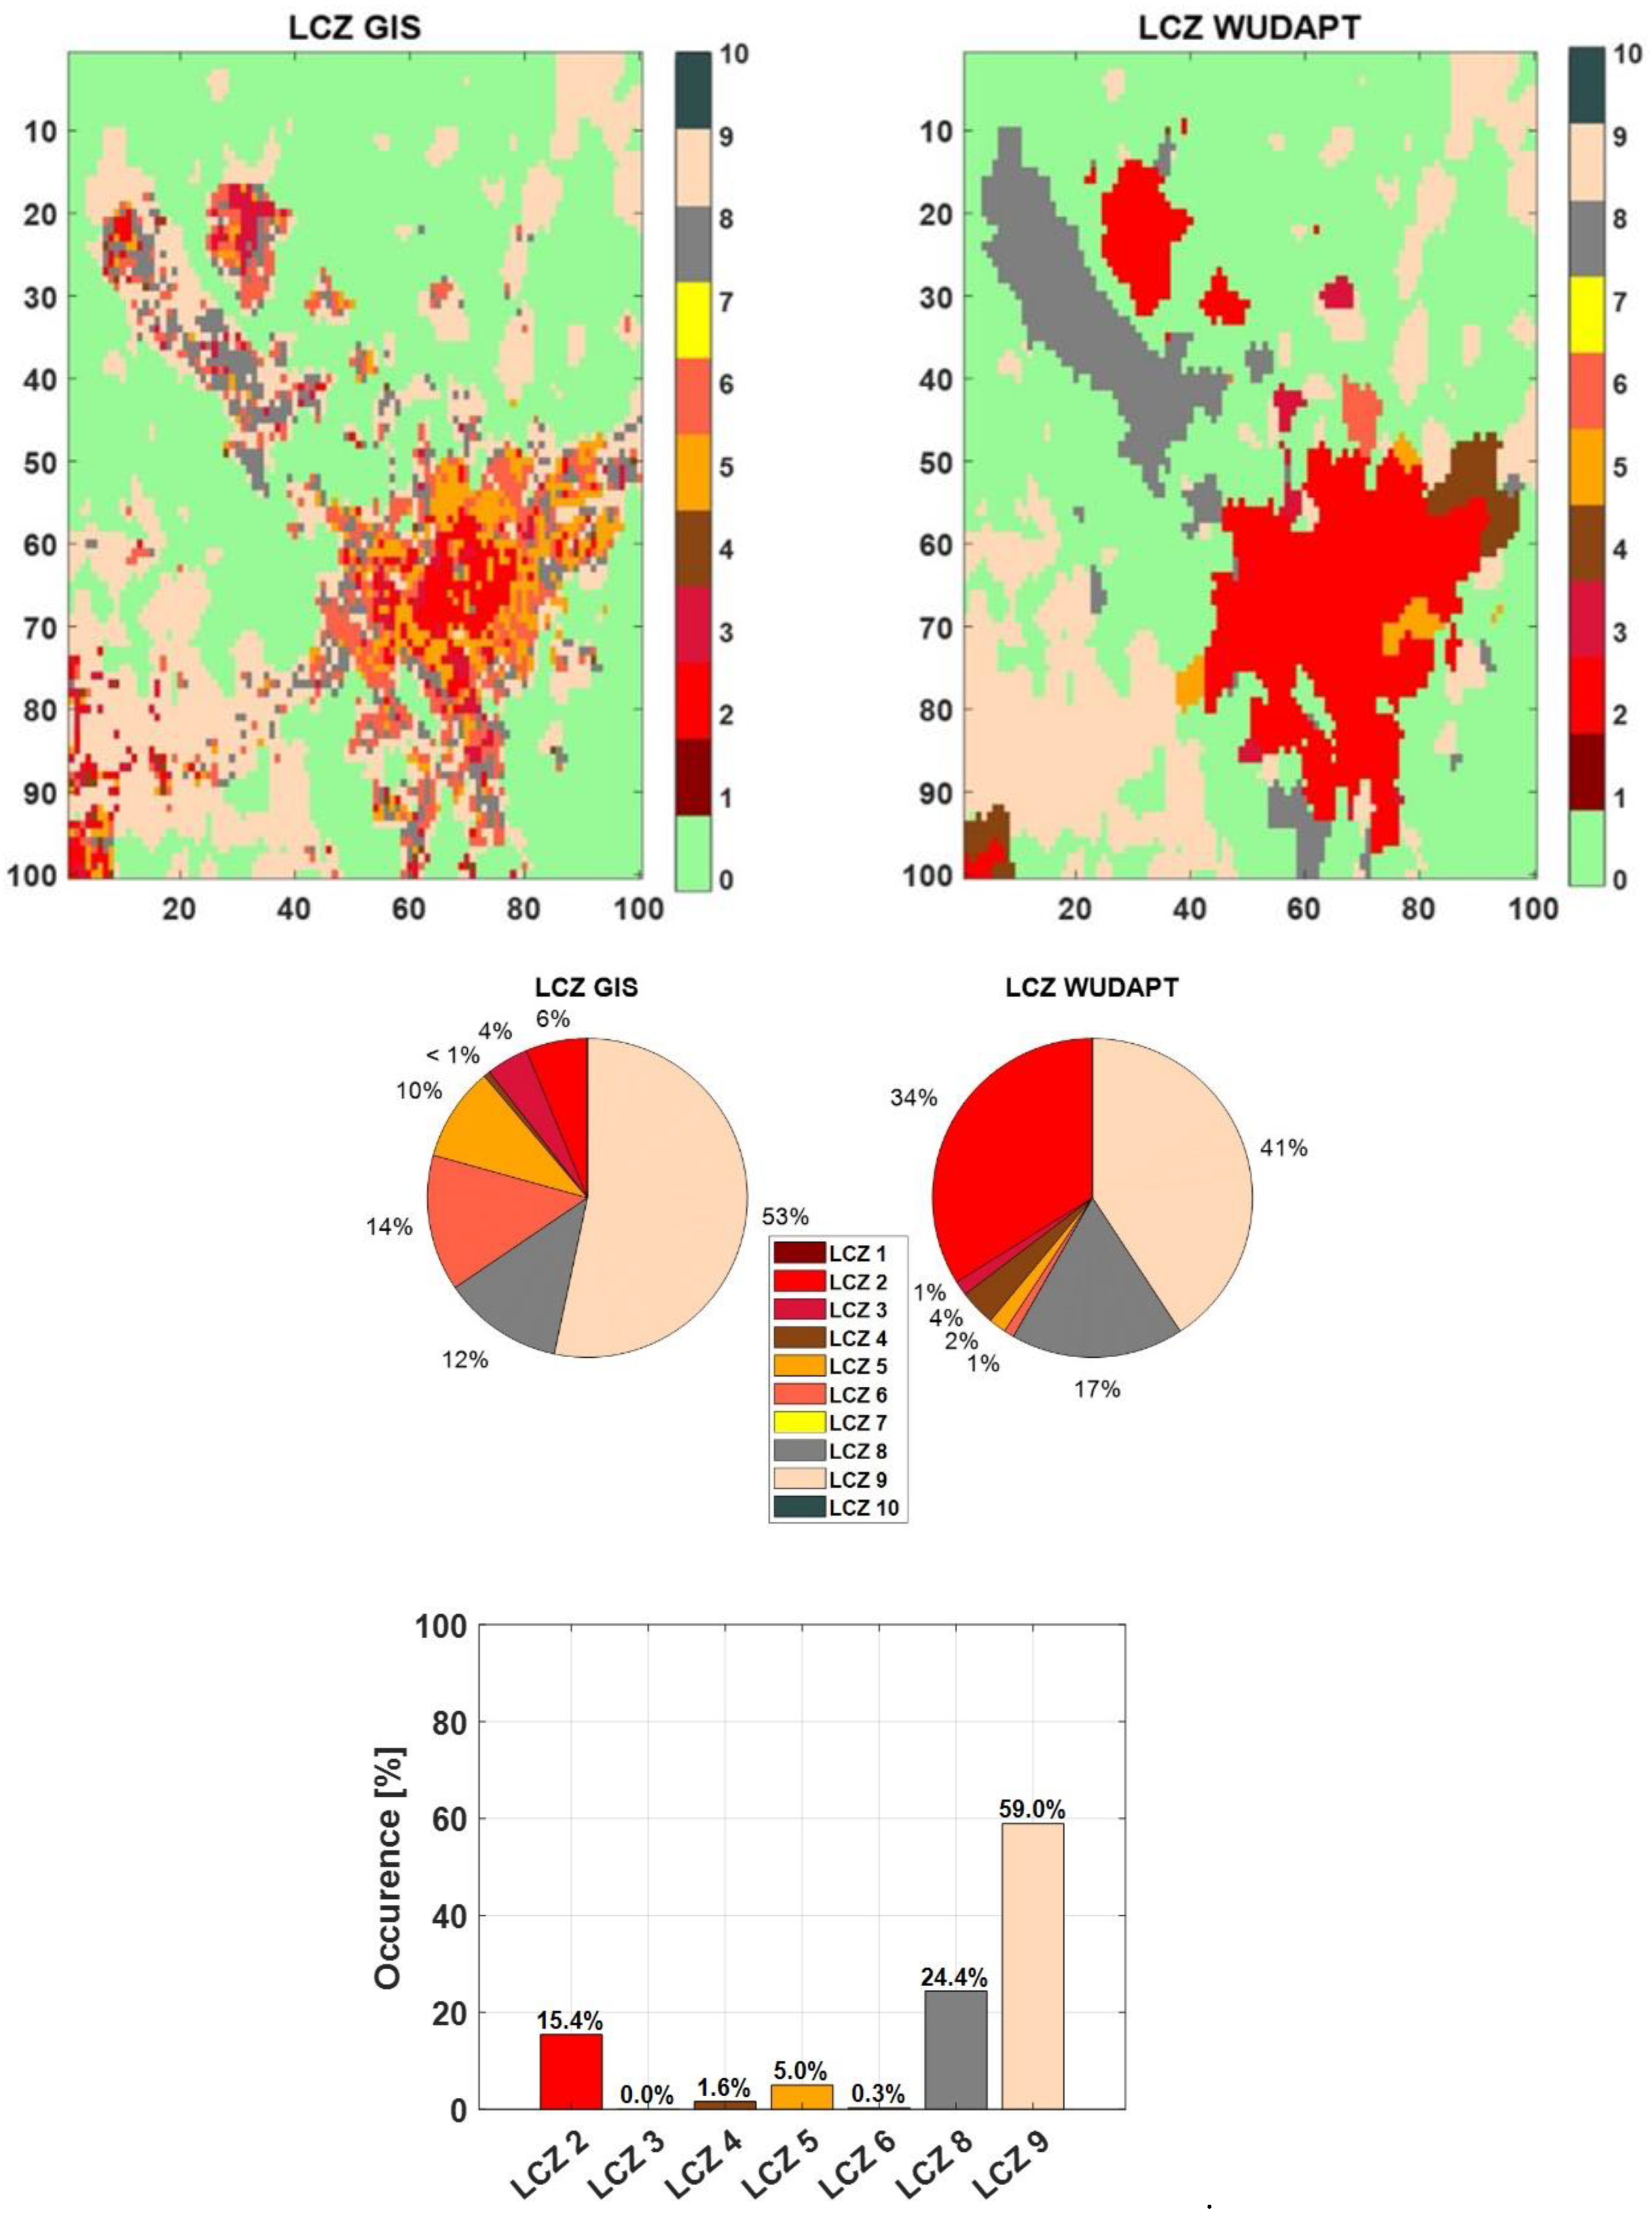
Figure 2 shows maps of some morphological parameters obtained from GIS for the city of Lecce. Looking at the sky view factor map, the lowest values are at a higher density/presence of buildings, and this is visible in the λp map where the highest values are in the center of the city. Regarding the average height, the highest values are in the north-eastern part of the city with an average value of approximately 30 m, whereas for λu, the highest values are in the most urbanized areas of the city.

3.2. LCZ Maps

Figure 3 shows the LCZ WUDAPT and LCZ GIS maps, as well as the percentage areas and the percentage occurrence for the different LCZ. For each LCZ class, the occurrence represents the amount of a class area of the LCZ WUDAPT that overlaps to that of the LCZ GIS map.
The LCZ WUDAPT map shows that LCZ 2 is the most abundant (34%), characterizing the city center, with a dense mix of midrise buildings 3–9 stories, few or no trees, land cover mostly paved and stone, brick, tile, and concrete construction materials. In the north-eastern part of the city there is the presence of the LCZ 4, while around the city there is the presence of LCZ 14 (also called LCZ D) and LCZ 9, both characterizing the rural and suburban parts. Additionally, in the north-western part of the city, there is the presence of LCZ 8, corresponding to the industrial/commercial zone of Lecce.
When compared with the LCZ GIS map, it can be noted that a smaller area of the city center belongs to the LCZ 2 class (6%), while moving towards the periphery open arrangements occur. It is noteworthy that the GIS-LCZ method provides a more detailed representation of the city center, reclassifying LCZ 2 into four LCZ classes. However, limitations in the description of LCZ 8 can be observed, as it appears scattered and widespread around the city. Further limitations in the description of LCZ 8 are represented by the presence of typically residential LCZ classes in the commercial/industrial area. The low percentage values of occurrence represent a broad reclassification of most LCZ GIS classes, except for LCZ9, which shows a high overlap (about 60%).

4. Conclusions

This work employs different Italian cities and compares maps generated in WUDAPT with those based on the direct calculation of morphological parameters using GIS over a grid of 100 m × 100 m cells. For the city of Lecce presented here, it is found that while the general spatial distribution patterns of different LCZ classes in the two LCZ maps are qualitatively similar, the GIS-LCZ method can improve the accuracy as the WUDAPT L0 method misclassified some LCZs, especially at the core urban cells, whereas wider matching is observed at the boundary between urban and rural areas. This is probably due to an inadequate description of urban canopy parameters and urban land use at the border between urban and rural areas, as reported in Pappaccogli et al. [19]. On the other hand, the WUDAPT method generates LCZ maps with a more homogeneous pattern than the GIS-based method. High-resolution remote sensing images or conducting remote sensing image fusion is expected to improve the quality of output of WUDAPT-LCZ classification and mapping.
Nevertheless, the GIS-LCZ method requires detailed environmental databases (i.e., digital elevation and surface models), which are not typically available for a larger number of cities in Europe, representing the main challenge for the operational use of this approach. Further work will be carried out to improve the GIS-LCZ method in classifying the zone properties using algorithms employed in the literature (e.g., the fuzzy logic algorithm adopted by Muhammad et al. [13] for Berlin). Findings from this work can provide a useful reference for researchers who are interested in LCZ classification and mapping work for their cities.

Author Contributions

Conceptualization, R.B. and A.E.; methodology, R.B.; software, A.E., G.P. and M.G.; formal analysis, A.E., G.P. and M.G.; investigation, A.E.; resources, R.B.; data curation, A.E. and G.P.; writing—original draft preparation, R.B.; writing—review and editing, A.D., A.M., J.L.S., G.M. and P.S.; visualization, A.E. and G.P.; supervision, R.B. and A.M. All authors have read and agreed to the published version of the manuscript.

Funding

A.E. acknowledges the PhD financial support of the Italian Ministry of University and Research (MUR) by the PON “Ricerca e Innovazione 2014-2020-Asse IV”-PhD course in “Scienze e Tecnologie Biologiche ed Ambientali”–XXXVII cycle-University of Salento. M.G. acknowledges the financial support of the Auvergne-Rhône-Alpes region, the French Ministry for Higher Education and Research and the Erasmus+ program to visit and work for her Master thesis in Italy at the University of Salento, Dipartimento di Scienze e Tecnologie Biologiche ed Ambientali.

Institutional Review Board Statement

Not applicable.

Informed Consent Statement

Not applicable.

Data Availability Statement

Not applicable.

Conflicts of Interest

The authors declare no conflict of interest.

References

  1. Stewart, I.D.; Oke, T.R. Local climate zones for urban temperature studies. Bull. Am. Meteorol. Soc. 2012, 93, 1879–1900. [Google Scholar] [CrossRef]
  2. Lehnert, M.; Savić, S.; Milošević, D.; Dunjić, J.; Geletič, J. Mapping Local Climate Zones and Their Applications in European Urban Environments: A Systematic Literature Review and Future Development Trends. ISPRS Int. J. Geo-Inf. 2021, 10, 260. [Google Scholar] [CrossRef]
  3. Bechtel, B.; Demuzere, M.; Sismanidis, P.; Fenner, D.; Brousse, O.; Beck, C.; Van Coillie, F.; Conrad, O.; Keramitsoglou, I.; Middel, A.; et al. Quality of Crowdsourced Data on Urban Morphology—The Human Influence Experiment (HUMINEX). Urban Sci. 2017, 1, 15. [Google Scholar] [CrossRef]
  4. Ching, J.; Mills, G.; Bechtel, B.; See, L.; Feddema, J.; Wang, X.; Ren, C.; Brousse, O.; Martilli, A.; Neophytou, M.; et al. World Urban Database and Access Portal Tools (WUDAPT), an urban weather, climate and environmental modeling infrastructure for the Anthropocene. Bull. Am. Meteorol. Soc. 2018, 99, 1907–1924. [Google Scholar] [CrossRef]
  5. Bechtel, B.; Alexander, P.J.; Beck, C.; Böhner, J.; Brousse, O.; Ching, J.; Demuzere, M.; Fonte, C.; Gál, T.; Hidalgo, J.; et al. Generating WUDAPT level 0 data—Current status of production and evaluation. Urban Clim. 2018, 27, 24–45. [Google Scholar] [CrossRef]
  6. Zheng, Y.; Ren, C.; Xu, Y.; Wang, R.; Ho, J.; Lau, K.; Ng, E. GIS-based mapping of Local Climate Zone in the high-density city of Hong Kong. Urban Clim. 2017, 24, 419–448. [Google Scholar]
  7. Wang, R.; Ren, C.; Xu, Y.; Lau, K.; Shi, Y. Mapping the local climate zones of urban areas by GIS-based and WUDAPT methods: A case study of Hong Kong. Urban Clim. 2018, 24, 567–576. [Google Scholar] [CrossRef]
  8. Kotharkar, R.; Bagade, A. Evaluating urban heat island in the critical local climate zones of an Indian city. Landsc. Urban Plan. 2018, 169, 92–104. [Google Scholar]
  9. Geletič, J.; Lehnert, M. GIS-based delineation of local climate zones: The case of medium-sized Central European cities. Morav. Geogr. Rep. 2016, 24, 2–12. [Google Scholar]
  10. Acero, J.A.; Arrizabalaga, J.; Kupski, S.; Katzschner, L. Deriving an Urban Climate Map in coastal areas with complex terrain in the Basque Country (Spain). Urban Clim. 2013, 4, 35–60. [Google Scholar] [CrossRef]
  11. Unger, J.; Lelovics, E.; Gál, T. Local Climate Zone mapping using GIS methods in Szeged. Hung. Geogr. Bull. 2014, 63, 29–41. [Google Scholar] [CrossRef]
  12. Perera, N.G.R.; Emmanuel, R. A “Local Climate Zone” based approach to urban planning in Colombo, Sri Lanka. Urban Clim. 2018, 23, 188–203. [Google Scholar] [CrossRef]
  13. Muhammad, F.; Xie, C.; Vogel, J.; Afshari, A. Inference of Local Climate Zones from GIS Data, and Comparison to WUDAPT Classification and Custom-Fit Clusters. Land 2022, 11, 747. [Google Scholar] [CrossRef]
  14. Bechtel, B.; Alexander, P.; Böhner, J.; Ching, J.; Conrad, O.; Feddema, J.; Mills, G.; See, L.; Stewart, I. Mapping Local Climate Zones for a Worldwide Database of the Form and Function of Cities. ISPRS Int. J. Geo-Inf. 2015, 4, 199–219. [Google Scholar] [CrossRef]
  15. Conrad, O.; Bechtel, B.; Bock, M.; Dietrich, H.; Fischer, E.; Gerlitz, L.; Wehberg, J.; Wichmann, V.; Böhner, J. System for Automated Geoscientific Analyses (SAGA) v. 2.1.4. Geosci. Model Dev. 2015, 8, 1991–2007. [Google Scholar] [CrossRef]
  16. Demuzere, M.; Kittner, J.; Bechtel, B. LCZ Generator: A Web Application to Create Local Climate Zone Maps. Front. Environ. Sci. 2021, 9, 637455. [Google Scholar] [CrossRef]
  17. Grimmond, C.S.B.; Oke, T.R. Aerodynamic properties of urban areas derived from analysis of surface form. J. Appl. Meteorol. 1999, 38, 1262–1292. [Google Scholar] [CrossRef]
  18. Burian, S.J.; Augustus, N.; Jeyachandran, I.; Brown, M.J. Development and Assessment of the Second Generation National Building Statistics Database; American Meteorological Society: Boston, MA, USA, 2007. [Google Scholar]
  19. Pappaccogli, G.; Giovannini, L.; Zardi, D.; Martilli, A. Assessing the ability of WRF-BEP + BEM in reproducing the wintertime building energy consumption of an Italian Alpine city. J. Geophys. Res. Atmos. 2021, 126, e2020JD033652. [Google Scholar] [CrossRef]
Figure 1. Urban (1–10) and natural (A–G) LCZ types and their characteristics and colour code used in the WUDAPT framework. B: buildings; C: cover; M: materials; F: function; Tall: >10 stories, Mid-rise: 3–9 stories, Low: 1–3 stories [3].
Environsciproc 19 00015 g001
Figure 2. Examples of morphological parameters obtained from GIS for the city of Lecce.
Environsciproc 19 00015 g002
Figure 3. LCZ maps obtained using morphological parameters (LCZ GIS) and generated in WUDAPT (LCZ WUDAPT) for the city of Lecce, with indication of percentage area and percentage occurrence for the different LCZ classes.
Environsciproc 19 00015 g003
Publisher’s Note: MDPI stays neutral with regard to jurisdictional claims in published maps and institutional affiliations.

