
Assessment of Urban Heat Islands and Land Cover Types in Relation to Vulnerable Populations

Urban and Regional Studies and Planning Program, L. Douglas Wilder School of Government and Public Affairs, Virginia Commonwealth University, Richmond, VA 23284, USA
Earth 2022, 3(2), 733-747; https://doi.org/10.3390/earth3020041
Submission received: 21 May 2022
/
Revised: 16 June 2022
/
Accepted: 17 June 2022
/
Published: 19 June 2022
Abstract
:This study aims to assess urban heat islands and land cover types in relation to vulnerable populations. The city of Richmond, Virginia was selected as the study area using the Census Block Group as the geographic unit of analysis. Regression analysis was carried out to examine the impacts of land cover types on ambient temperatures, while correlation analysis was used to assess the relationship between ambient temperature and vulnerable populations. Lastly, multivariate clustering analysis was performed to identify areas vulnerable to urban heat in the city. Findings suggest that: (1) impervious surfaces lead to higher ambient temperatures, while tree coverage has a cooling effect on urban heat; (2) vulnerable populations, except for older adults, tend to live in areas with higher ambient temperatures; and (3) vulnerable populations are spatially clustered in specific locations in the city. This study concludes with recommendations of mitigation measures to reduce the adverse effect of urban heat islands by applying high-albedo materials to urban surfaces and expanding tree coverage and green space.
1. Introduction
The concept of the urban heat island (UHI), that urban areas are warmer than its surrounding rural areas, and its effects were first observed and discussed by Luke Howard in the 19th century [1] (pp. 6–9). Since then, research on the UHI phenomenon has expanded to include temperature variations within a city [2,3,4,5,6,7]. A few human and natural factors contribute to the temperature variations forming urban heat islands. For instance, the UHI-inducing factors include reduced natural landscapes due to urbanization [4,8], heat-absorbing urban materials [9,10], dimensions and spacing of urban structures [11], heat generated from human activities [12], geographic location, and topography. With regards to the built environment, prior studies found that impervious surfaces greatly intensify ambient temperature [13], while tree canopy coverage can reduce it significantly [14,15].
The urban heat island effect is commonly associated with negative impacts concerning energy consumption, air quality, water quality, and human health [16]. Warmer ambient temperatures increase demand for air conditioning during hot summer months, which leads to increased demand for electricity [17]. When electricity is produced by fossil fuel power plants, air quality is affected because of increased air pollutants and greenhouse gas emissions [16]. Water quality is affected as well, because of the discharge of heated runoff caused by high temperatures of pavement and building surfaces [18], which negatively affects the health of aquatic ecosystems [16]. The UHI effect on human health arises due to the increased risk of developing heat-related illnesses or even death resulting from high temperatures [19]. The U.S. Environmental Protection Agency (EPA) lists the following population groups as having a greater risk for heat-related health impacts: older adults (65+ years); outdoor workers; people with existing medical conditions; children, infants, and pregnant women; athletes; people who live alone; people who are homeless; and people with limited personal resources to deal with extreme heat [20].
Many scholars have found that the risk of developing heat-related illnesses or deaths are greater among vulnerable populations, including those in poverty and people of color, who have fewer resources to mitigate heat and limited capacities to adapt to high temperatures [21,22,23,24,25]. In cooler urban areas with trees and green space, the literature indicates that places with a lower proportion of tree cover tends to be associated with a higher proportion of minority population, low-income residents, and renters [26,27,28]. It is important to note that UHI mitigation measures should specifically target those areas with higher temperatures and a higher proportion of vulnerable populations who are more susceptible to heat exposure [29].
There are generally two approaches to assess UHI, using: (1) satellite remote sensing data to derive surface temperatures [30,31,32,33], and (2) ground-based measurements of in situ temperatures [34,35,36]. However, each approach has its strengths and weaknesses. While satellite remote sensing data are more readily available and provide comprehensive spatial coverage, they generally suffer from relatively lower resolution compared to ground-based measurements [32,37]. On the other hand, ground-based measurements can deliver finer temperature measurements, but additional efforts are required to estimate temperatures for unmeasured locations in a given study area. To take advantage of the strengths of both approaches, this study utilized a city-wide dataset derived by integrating ground-based in situ temperature measurements and Sentinel-2 land use/land cover (LULC) data [37]. This dataset is further discussed in Section 2.1.
1.1. Study Aim and Scope
Following the trends in the UHI literature, this study assesses urban heat islands and land cover types in relation to vulnerable populations in the city of Richmond, Virginia. This study aims to:
- Investigate the impacts of land cover types on ambient temperatures;
- Examine the relationship between ambient temperatures and vulnerable populations;
- Identify specific locations with high ambient temperatures and high percentages of vulnerable populations;
- Recommend mitigation measures to reduce the adverse effect of urban heat islands.
While there is an extensive body of literature on the UHI and its relationship with land cover and vulnerable populations, UHI-related research about the city is rather sparse. In addition, the study utilizes a 10-m resolution ambient temperature dataset [37] and a one-meter resolution land cover dataset [38]. These high-resolution datasets deliver more precise results of the impacts of land cover types on ambient temperatures. More importantly, this study presents a novel approach using multivariate clustering analysis [39] to identify specific vulnerable areas where mitigation measures should be prioritized for implementation.
1.2. Study Area and Geographic Unit of Analysis
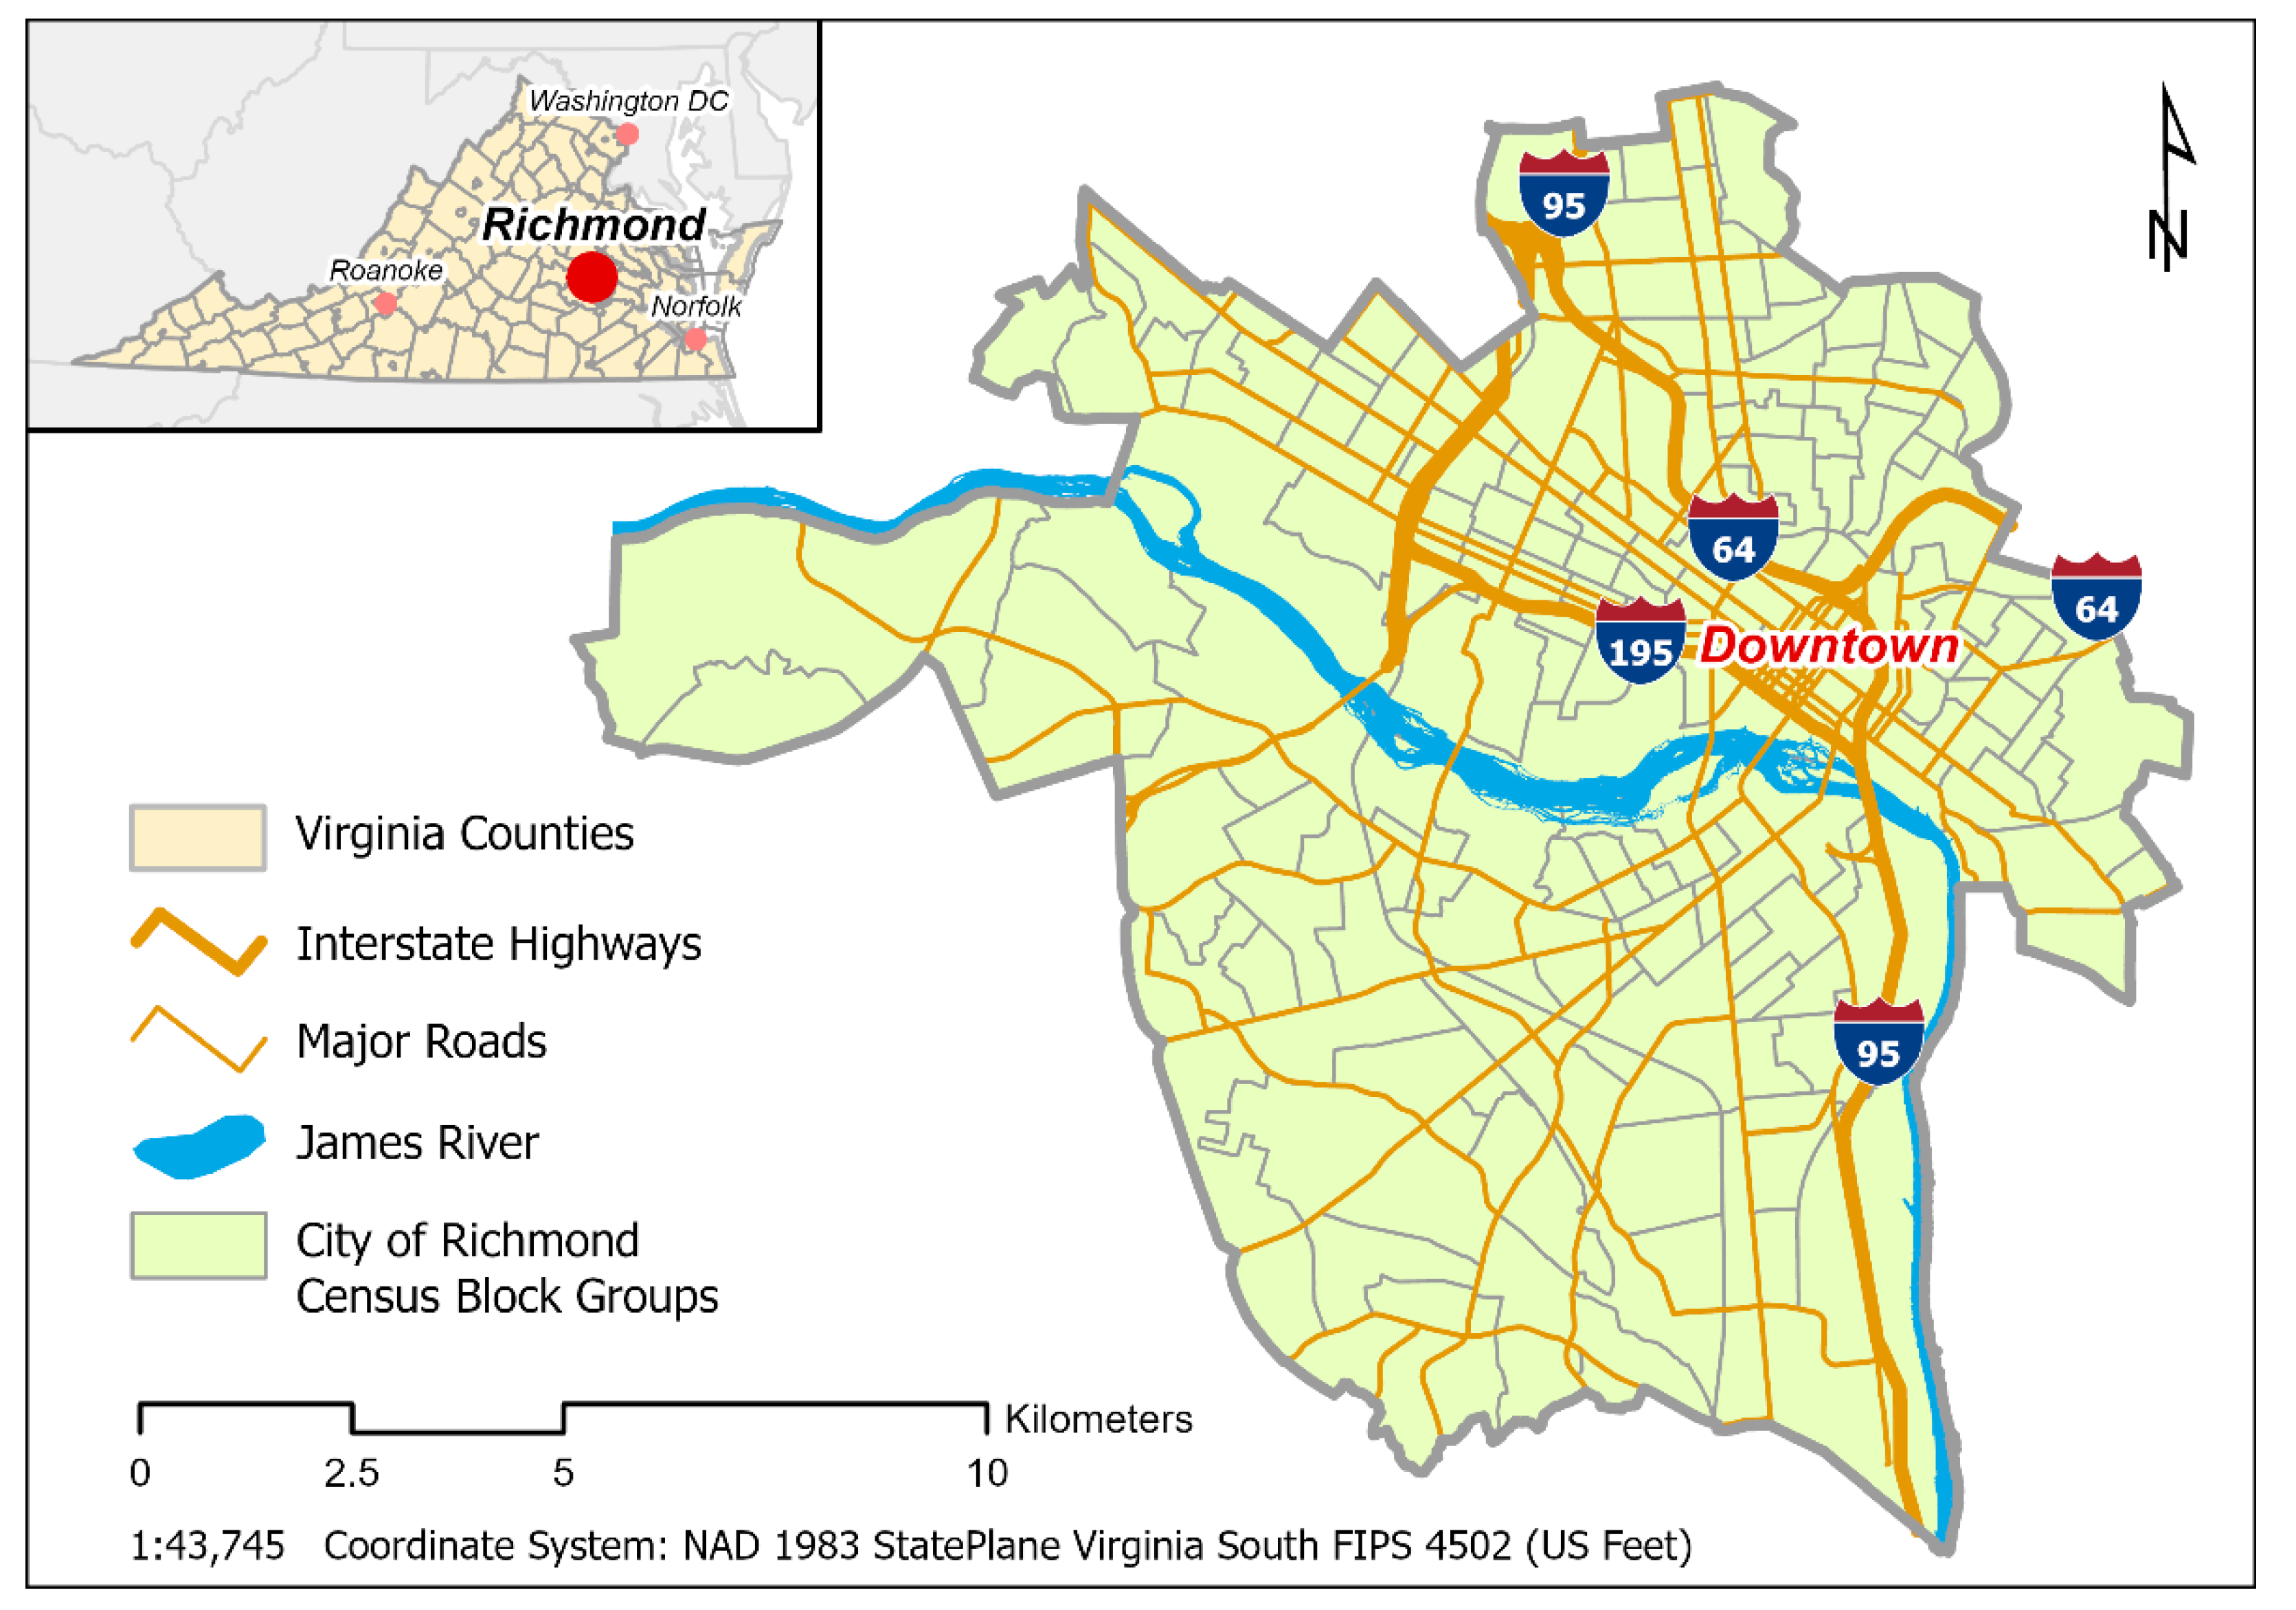
The city of Richmond, Virginia is selected as the study area (Figure 1). Situated in the mid-Atlantic region, Richmond is the state capital of Virginia, about 170 km south of Washington, D.C. Richmond has a population of 226,610 in 2020 [40] and an area of about 162 square kilometers. The city’s summer months are generally warm and humid, and the hottest month is July, with an average high temperature of 88 °F or 31.11 °C [41]. Like other urbanized areas, Richmond also experiences the UHI effect [42].
When it comes to the geographic unit of analysis, more details can be preserved if smaller geographic units are used. The smallest Census geographic feature is the Census Block, followed by Block Group and then Tract, but not all data are available at the Block level. For this reason, it was decided to use Census Block Group as the geographic unit of analysis in this study. Richmond has 161 Block Groups and data collected from different sources were aggregated to and analyzed at the Block Group level.
2. Materials and Methods
A comprehensive city-wide ambient temperature dataset is needed to assess urban heat islands and their associations with land cover types and vulnerable populations. Because the ambient temperature dataset was mainly derived from ground temperature measurements collected in 2017, care was taken to obtain other datasets published around the same time as the ambient temperature dataset. They include the Virginia land cover dataset released in 2016 by the Virginia Geographic Information Network (VGIN) and the 2017 American Community Survey (ACS) 5-year estimates concerning vulnerable populations. All three datasets are further described in the following sections.
2.1. Ambient Temperature
The ambient temperature dataset of Richmond was provided by Dr. Jeremy Hoffman of the Science Museum of Virginia. Dr. Hoffman and Dr. Eugene Maurakis, scientists with the Science Museum of Virginia, and Dr. Vivek Shandas, a professor of urban studies and planning at Portland State University, collaborated with Richmond community members, universities, and nonprofits to collect temperature data across the entire city at 6:00 a.m., 3:00 p.m., and 7:00 p.m. on 13 July 2017 [42]. Temperature measurements were collected at a one-second interval via vehicular traverses across the city using vehicle-mounted temperature sensors and GPS devices. All temperature and location data were further integrated with the Sentinel-2 satellite data to predict the city-wide ambient temperatures. According to Shandas et al., the integration of ground-based in situ temperature measurements and the Sentinel-2 land use/land cover (LULC) data was done by building a predictive model based on the relationship between observed in situ temperature values and their associated LULC attributes [37]. Areas where in situ temperatures were not measured could be predicted based on their LULC attributes. This model produced a city-wide ambient temperature dataset, which was provided by Dr. Jeremy Hoffman to support this study.
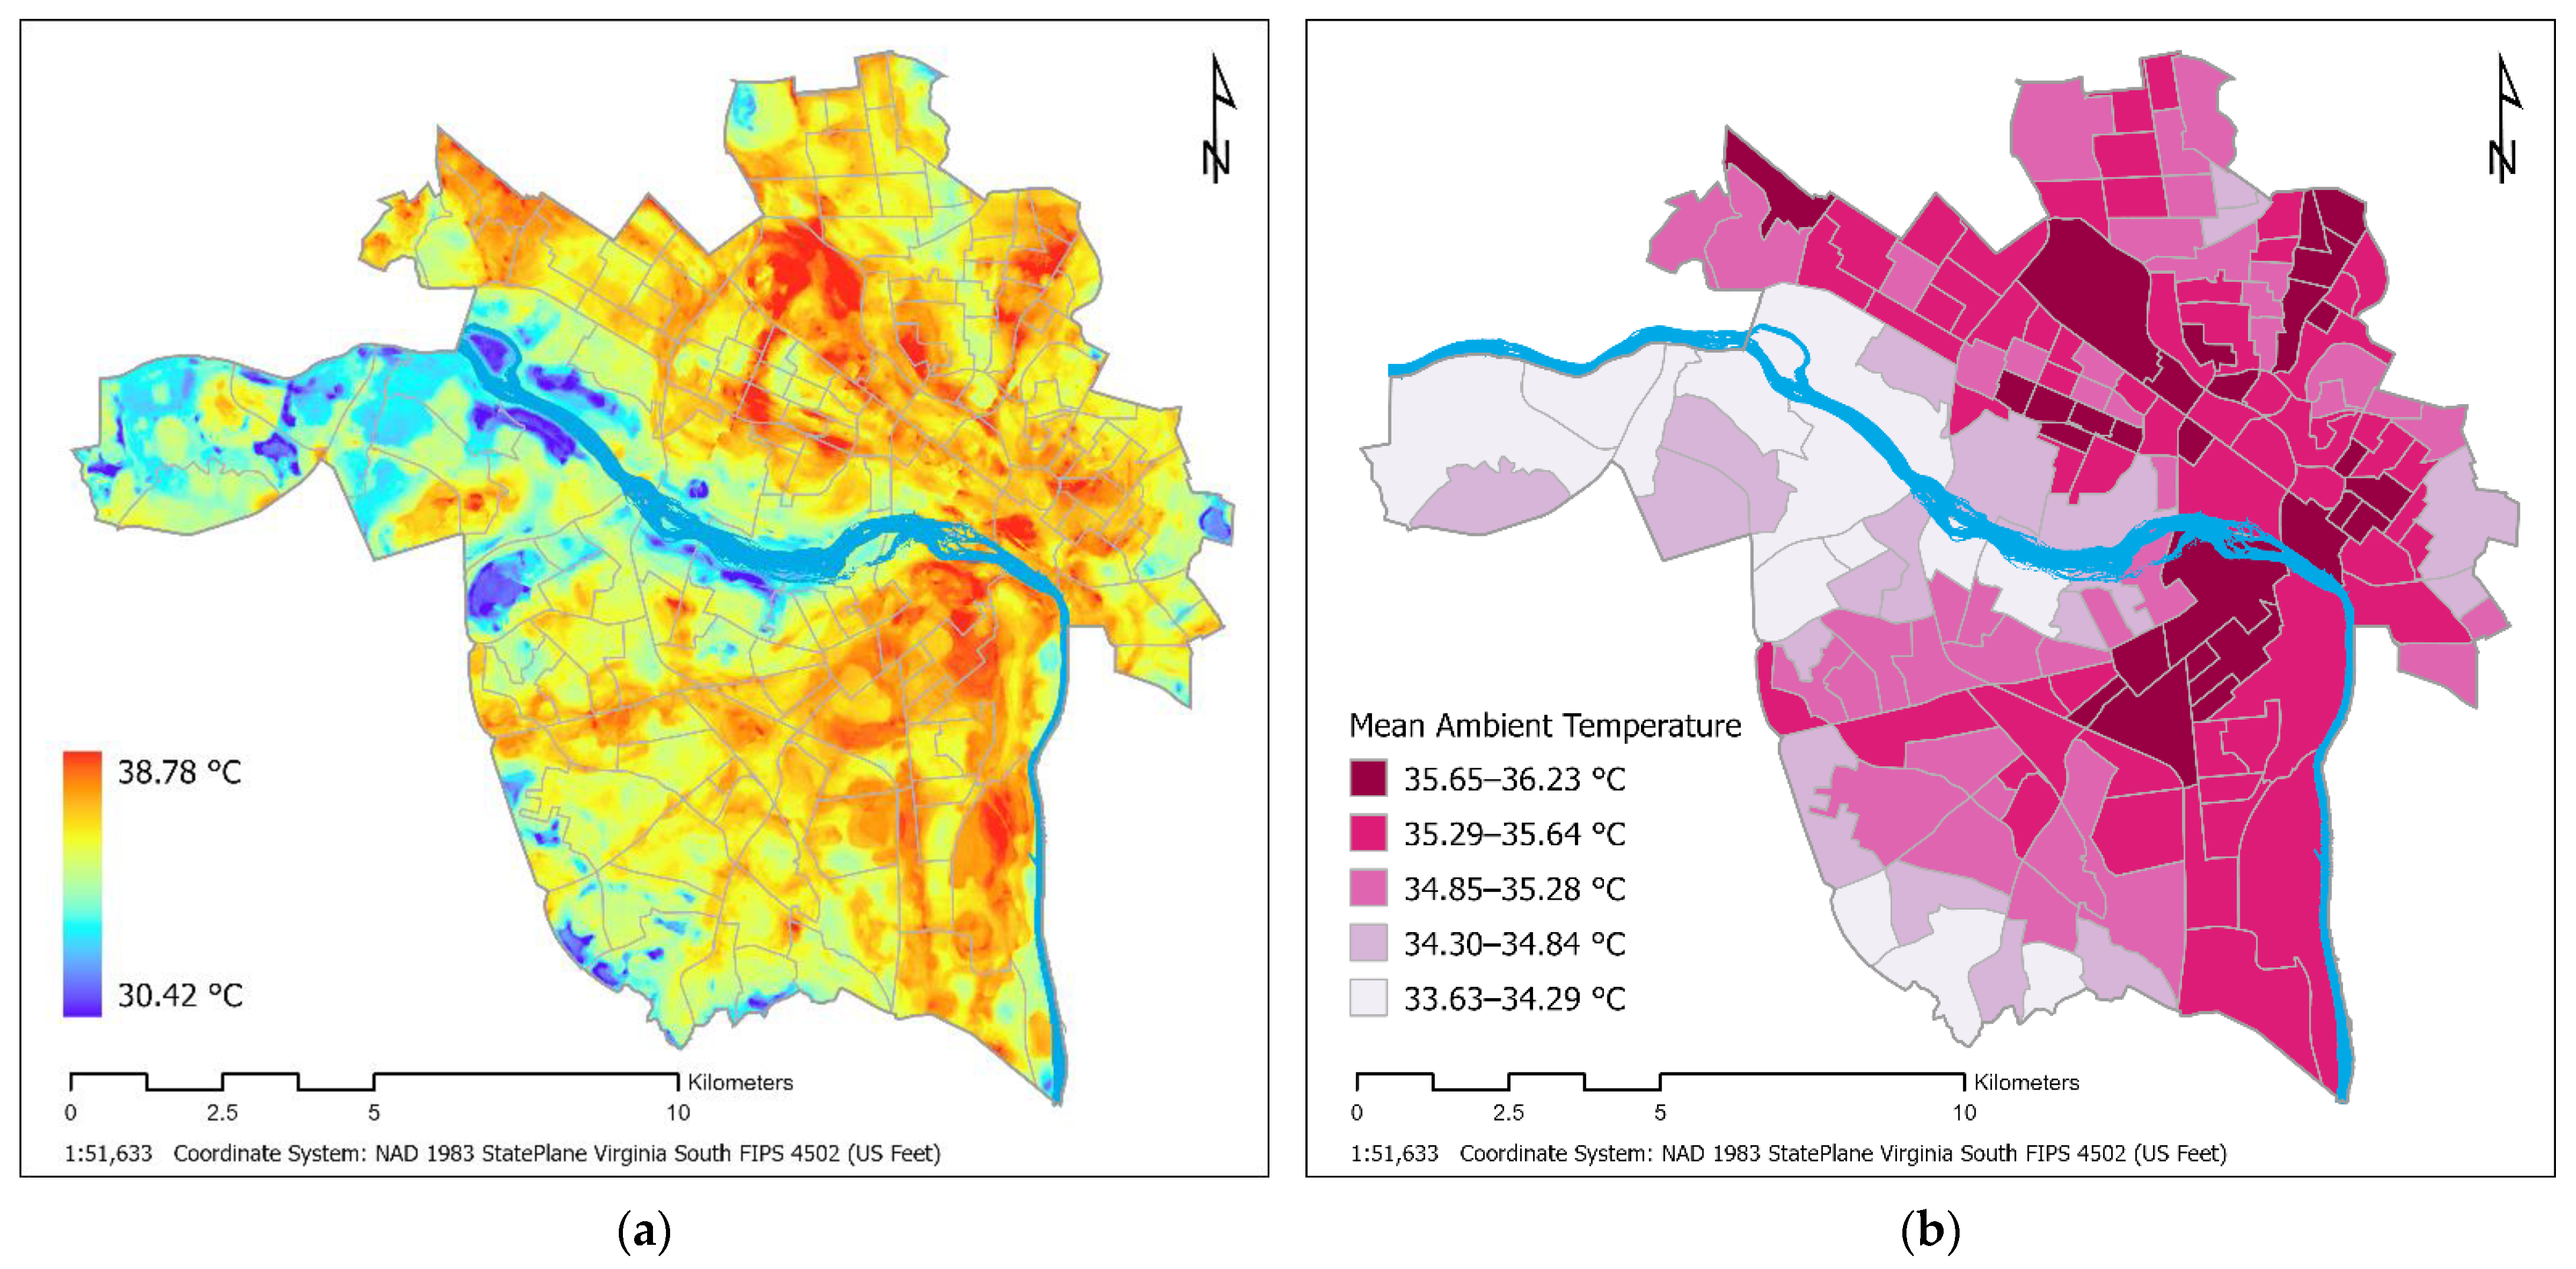
The resulting ambient temperature dataset contains three 10-m resolution raster layers of 6:00 a.m., 3:00 p.m., and 7:00 p.m. This study used the 3:00 p.m. version (Figure 2a) because it contains the highest temperatures, which depicted the urban heat islands more prominently. Given that the ambient temperature dataset is in raster format, Block Group level temperatures need to be aggregated from the temperature values stored in the raster grid cells. ArcGIS Pro’s “Zonal Statistics as Table” tool can summarize the values of a raster within the zones of another dataset and reports the results as a table [43]. Specifically, the following ArcGIS Pro parameters were used to compute the mean ambient temperatures at the Block Group level:
- Input zone data: Richmond Block Group layer;
- Zone field: Block Group ID (i.e., ID numbers of Block Groups);
- Input raster: city-wide ambient temperature raster layer (3:00 p.m.);
- Statistics type: mean.
Using ArcGIS Pro’s “Zonal Statistics as Table” tool, ambient temperatures associated with the raster grid cells inside a given Block Group were aggregated to compute the mean ambient temperature of that Block Group (Figure 2b). The Block Group mean ambient temperature, denoted as Ambient_temp in this study, serves as the proxy variable of UHI, as well as the dependent variable in the upcoming regression analysis (Section 3.1), which examines the impacts of land cover types on ambient temperatures.
2.2. Land Cover Types
The Virginia Geographic Information Network (VGIN) and its partners coordinated on the development of a statewide land cover dataset [38] that leverages the Virginia Base Mapping Program (VBMP) digital orthophotography to create a statewide one-meter resolution digital land cover classification. This dataset contains a total of 219 map tiles and became available to the public in 2016 [44]. Specifically, Richmond is partially covered by map tiles S13_76, S13_77, and S13_87. The aforementioned map tiles were downloaded and clipped with the Richmond city boundaries using ArcGIS Pro’s “Clip” tool [45]. This was done using the following “Clip” tool parameters:
- Input features: map tiles S13_76, S13_77, and S13_87 (they were clipped one at a time);
- Clip features: Richmond city boundaries.
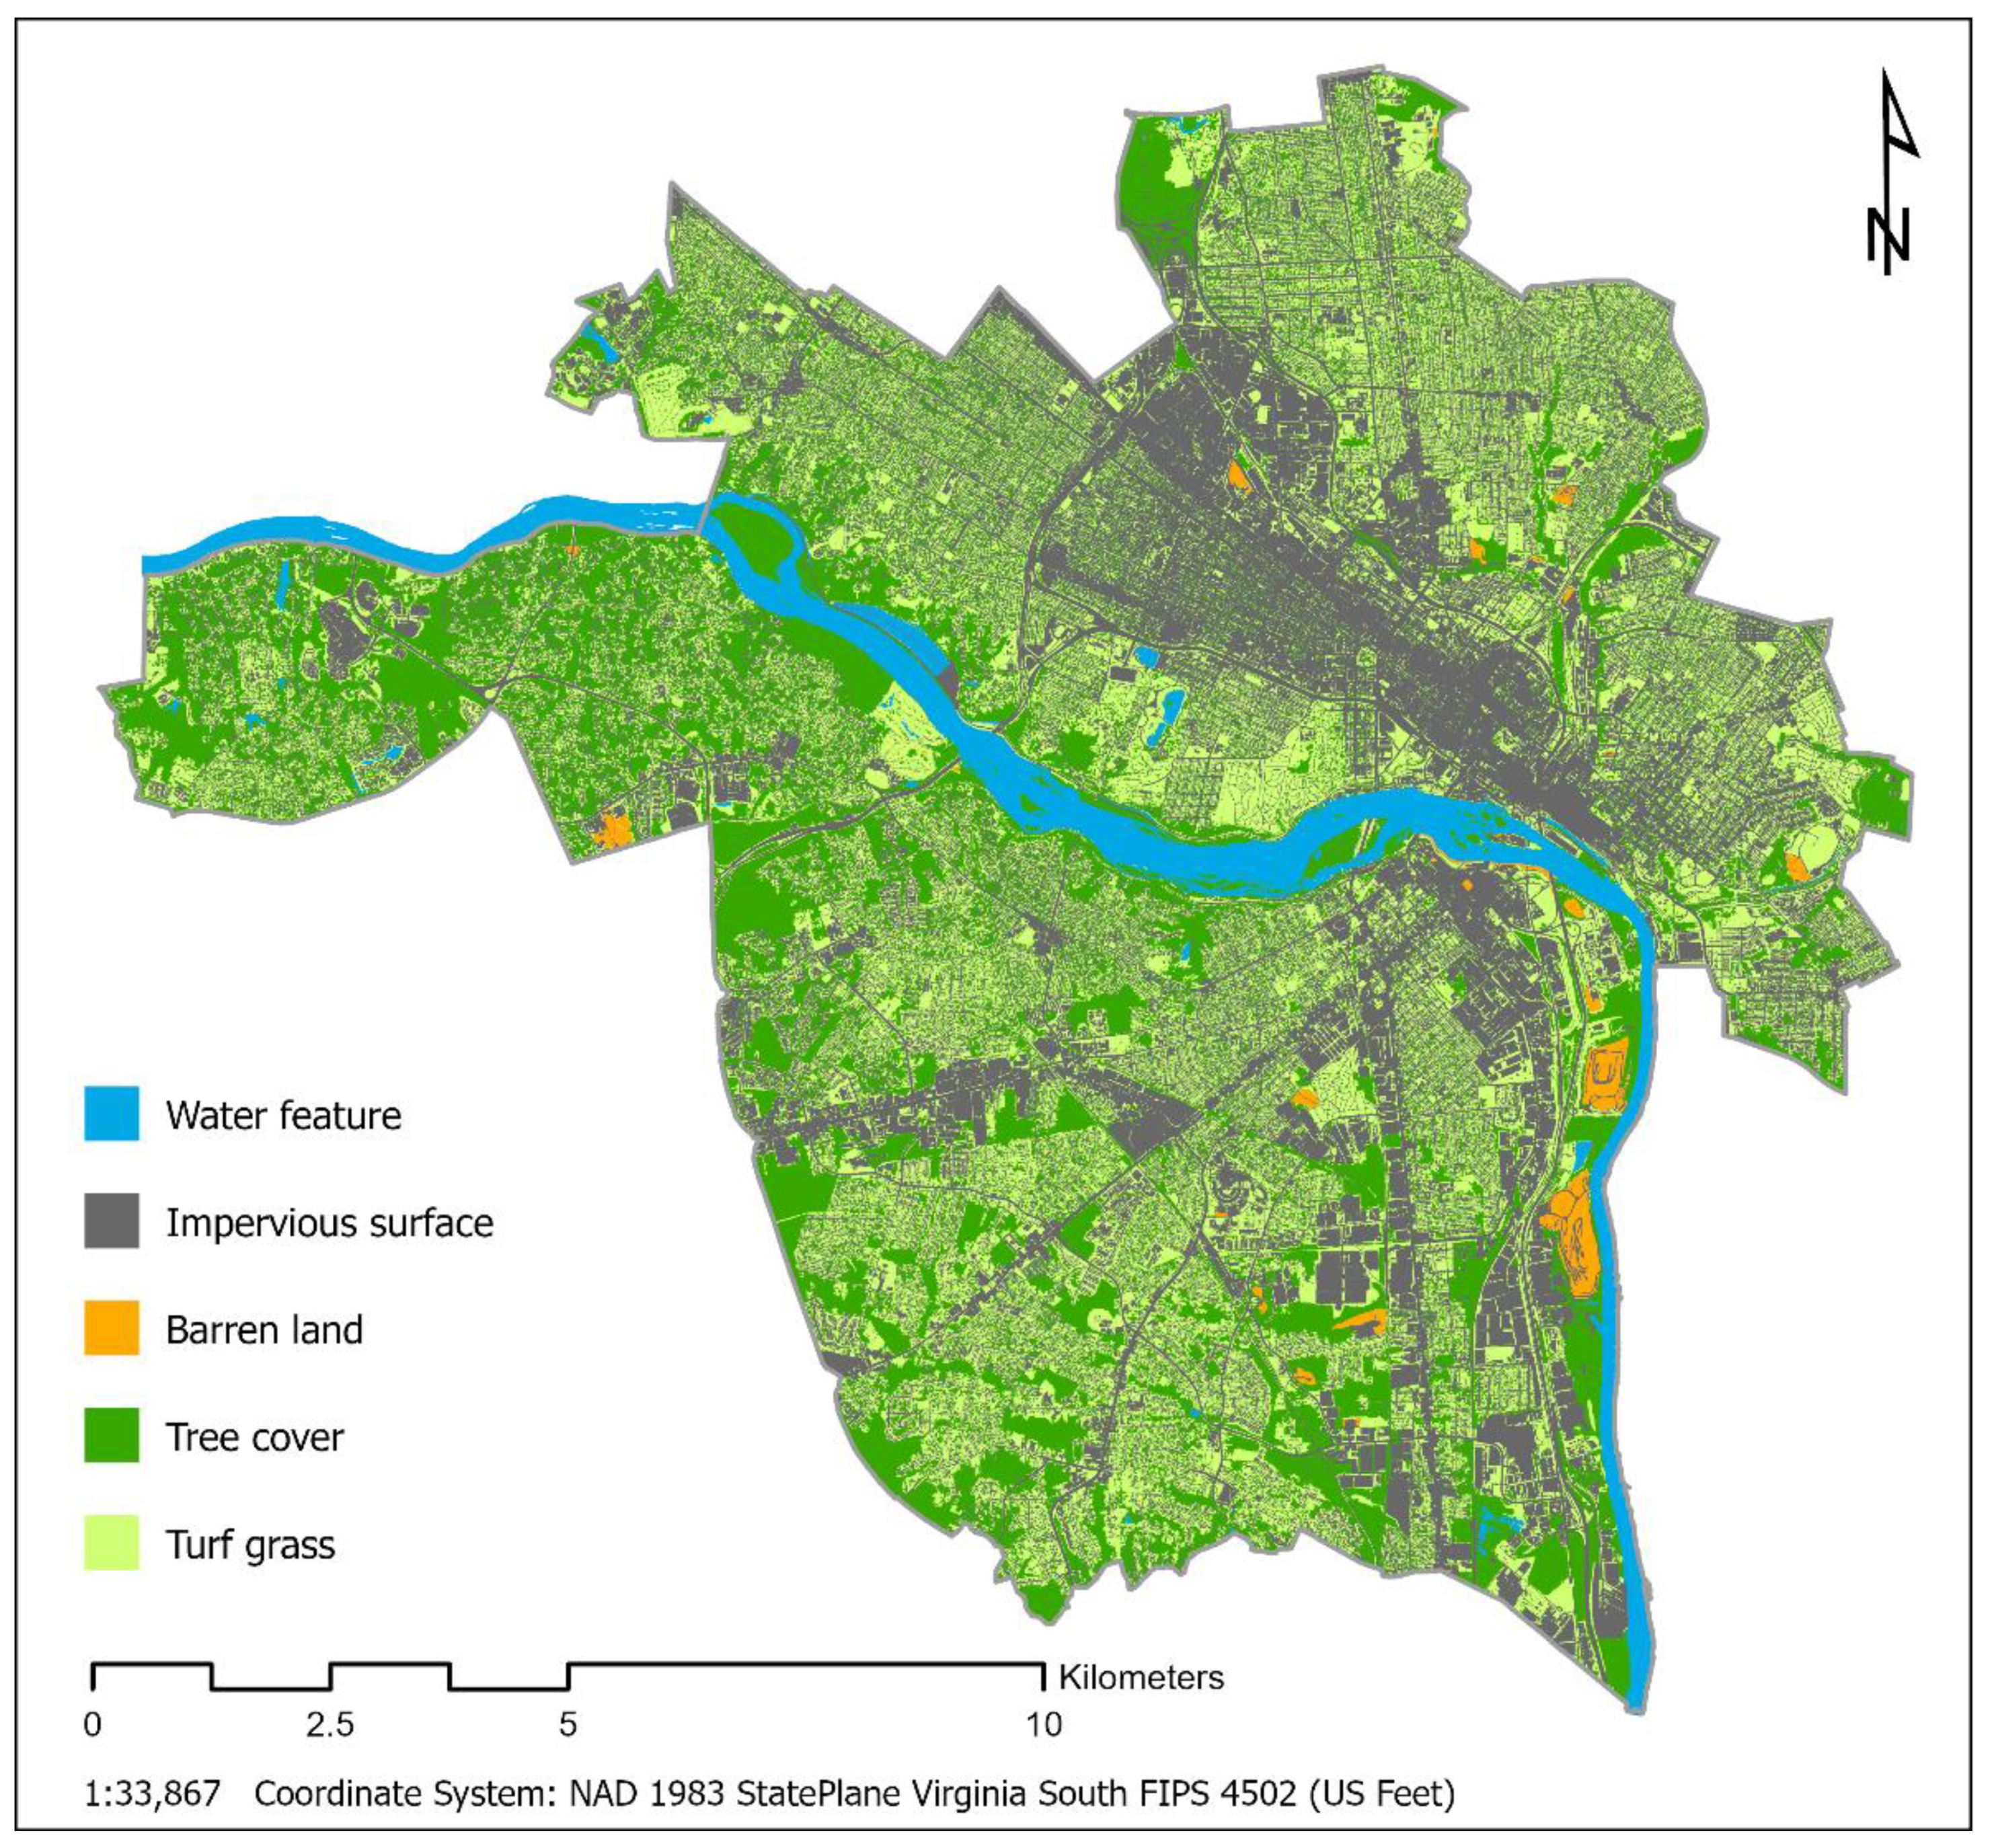
By specifying the clipped map tiles as input datasets in ArcGIS Pro’s “Append” tool [46], the clipped map tiles were appended together to produce a seamless land cover dataset of Richmond with the following land cover types: water feature, impervious surface, barren land, tree cover, and turf grass (Figure 3).
Similar to the ambient temperature, land cover data at the Block Group level need to be compiled from the land cover layer. ArcGIS Pro’s “Tabulate Intersection” tool can compute the intersection between two feature classes and cross-tabulate the area, length, or count of the intersecting features [47]. Specifically, the following ArcGIS Pro parameters were used to derive the area measurement of each land cover type at the Block Group level:
- Input zone features: Richmond Block Group layer;
- Zone field: Block Group ID (i.e., ID numbers of Block Groups);
- Input class features: land cover dataset;
- Class field: land cover ID (i.e., ID numbers of land cover types).
Using ArcGIS Pro’s “Tabulate Intersection” tool, the land cover layer was intersected with the Richmond Block Groups to derive the areas of land cover types within the Block Groups. Based on the land cover area measurements, the percentages of land cover types within a given Block Group were computed and described below.
- Water_pct: percentage of Block Group area covered by water features;
- Impervious_pct: percentage of Block Group area covered by impervious surfaces;
- Barren_pct: percentage of Block Group area covered by barren land;
- Tree_pct: percentage of Block Group area covered by trees;
- TurfGrass_pct: percentage of Block Group area covered by turf grass.
These percentages of land cover types serve as the independent variables in the upcoming regression analysis (Section 3.1) of the impacts of land cover types on ambient temperatures.
2.3. Vulnerable Populations
Datasets concerning vulnerable populations were obtained from the 2017 American Community Survey (ACS) 5-year estimates at the Block Group level. In specific, five vulnerable populations are investigated in this study. They are described below along with their associated ACS data tables.
- older_adults_pct: percentage of older adults 65 years and over (Data source: ACS table B01001);
- non-white_pct: percentage of non-white (i.e., minority) population (Data source: ACS table B02001);
- below_poverty_pct: Percentage of population with income below poverty level (Data source: ACS table B17021);
- disability_pct: Percentage of population 20–64 years with a disability (Data source: ACS table B23024);
- no_insurance_pct: Percentage of population with no health insurance coverage (Data source: ACS table B27010).
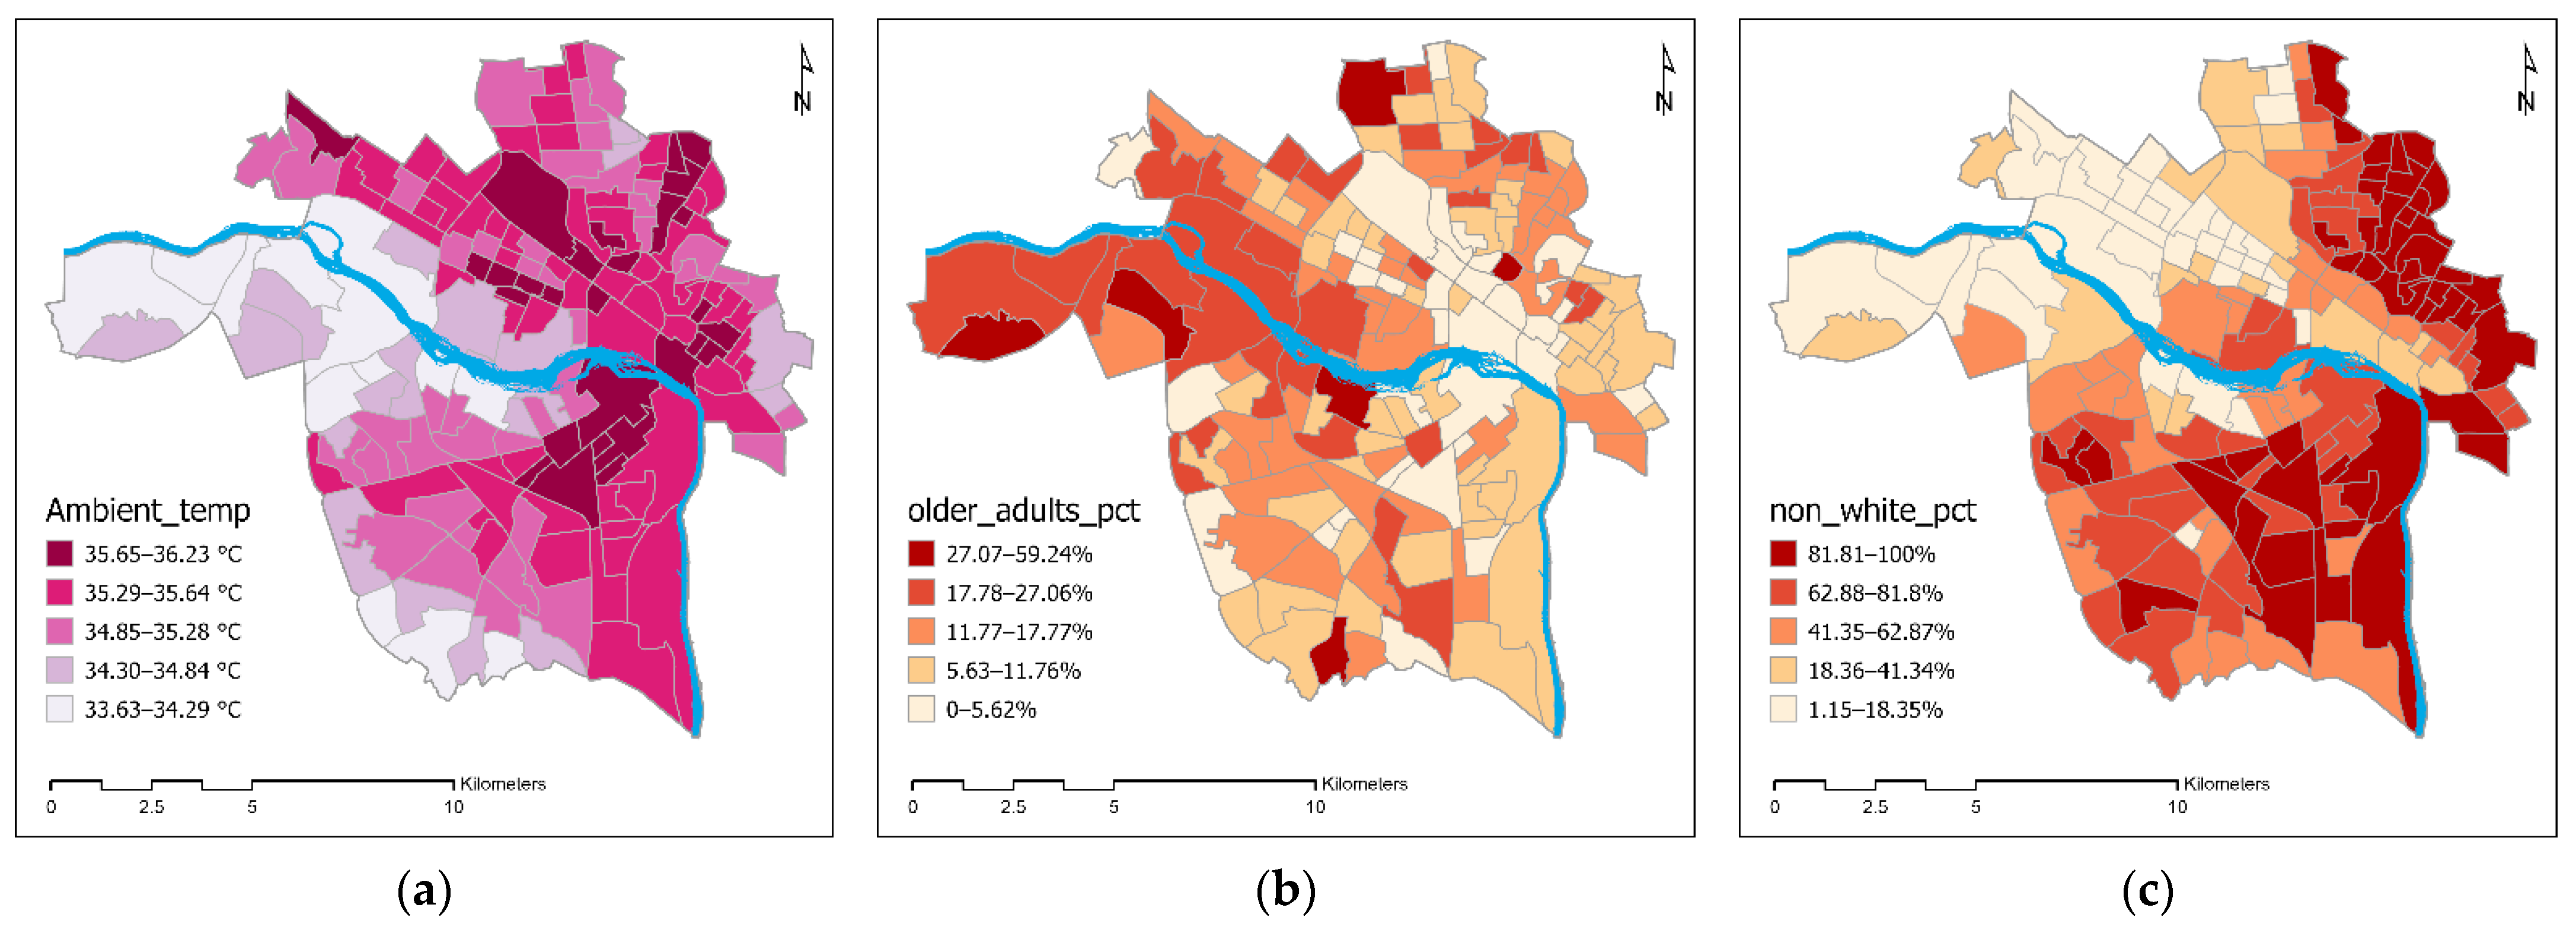
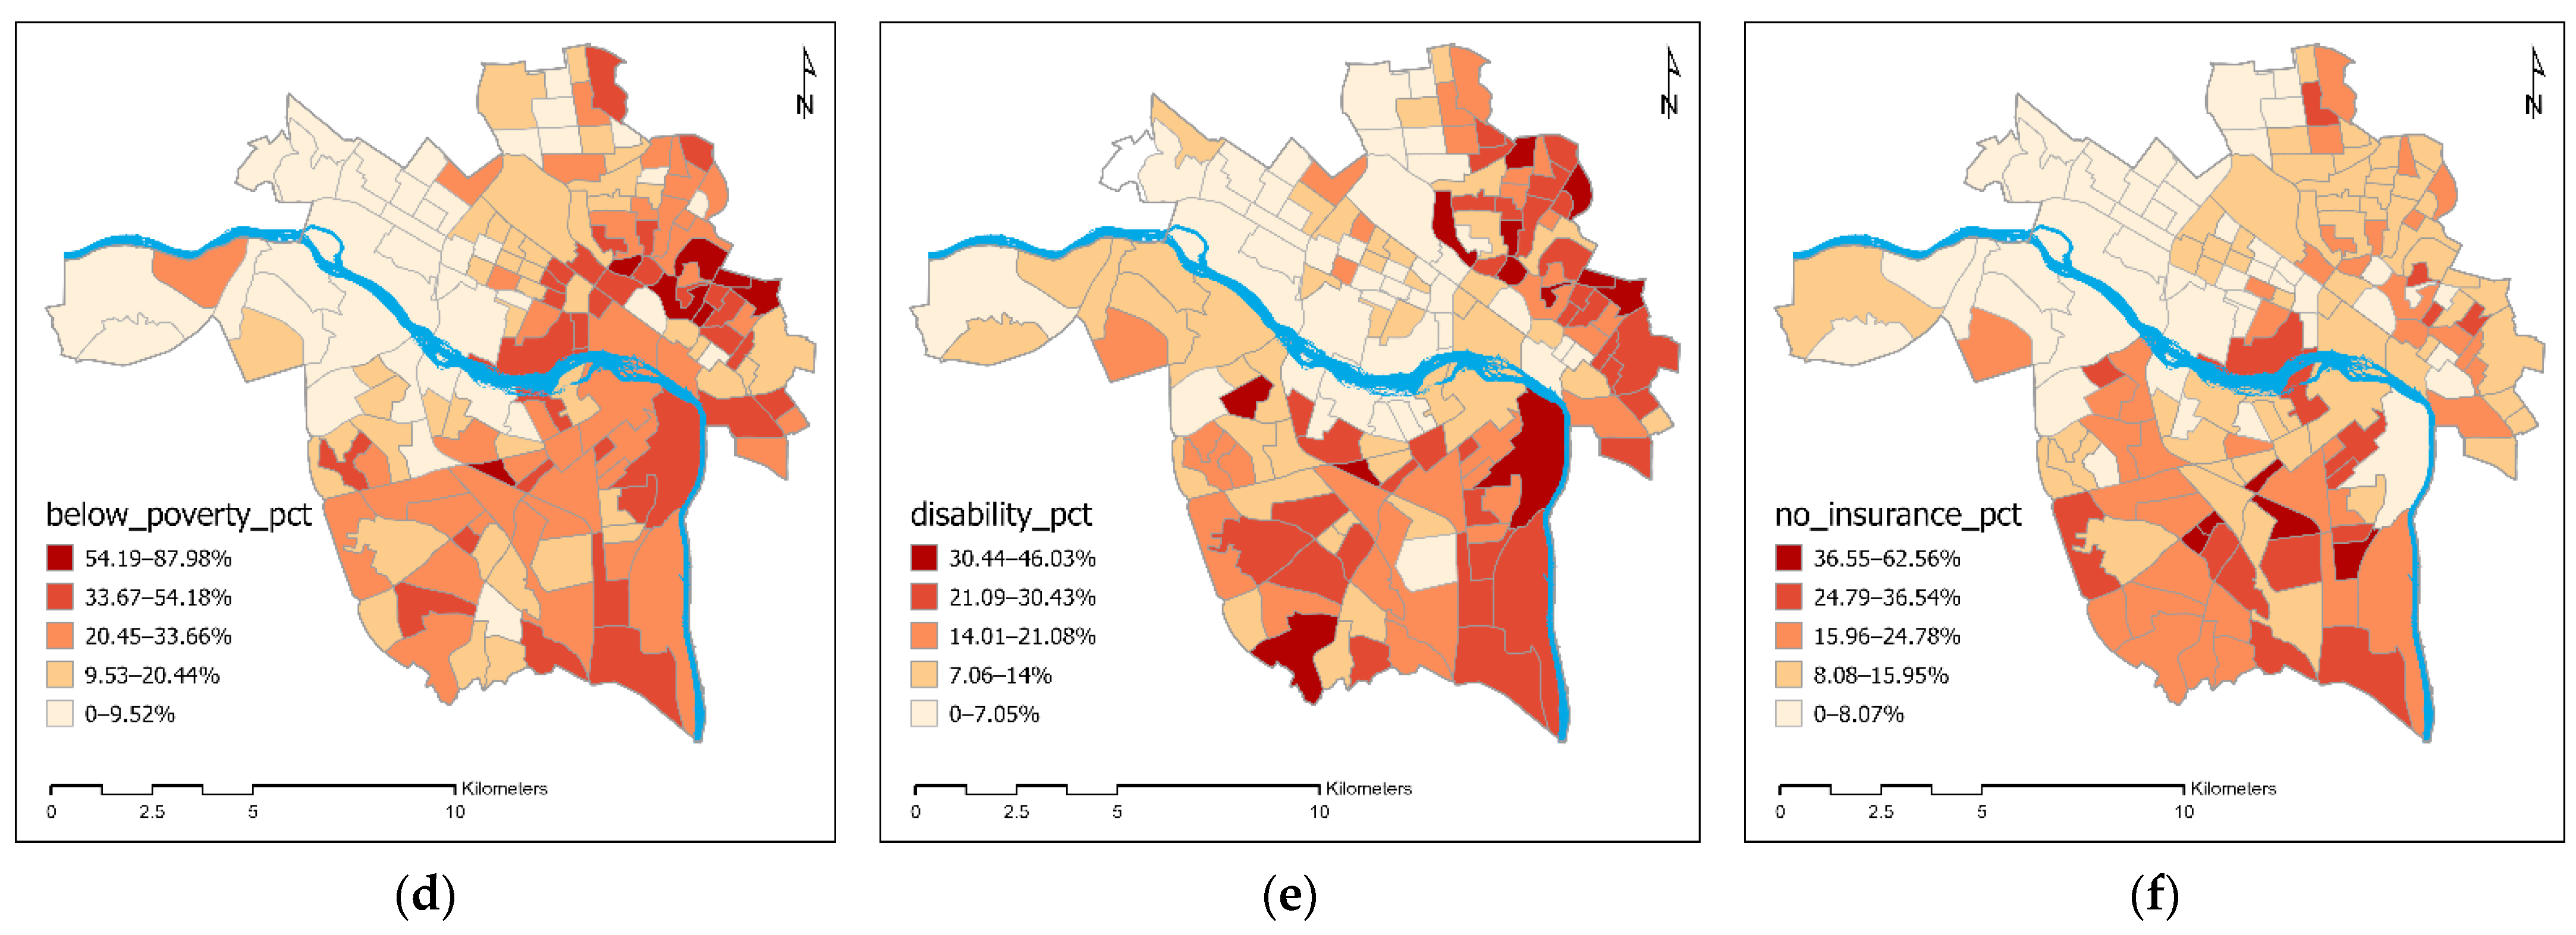
The above ACS tables were downloaded from the US Census Bureau website, joined to the Richmond Block Group layer, and visualized in ArcGIS Pro. The spatial distributions of vulnerable populations are presented in Figure 4. Mean ambient temperature at the Block Group level (Figure 4a) is shown again to provide a visual reference in comparison with the spatial patterns of vulnerable populations.
2.4. Methodology
A regression model was constructed to examine the impacts of land cover types on ambient temperatures. It sheds light on the direction and the strength of the influence of each land cover type on ambient temperatures. This provides insights on mitigating UHI effects by changing land cover types or modifying their thermal properties. The regression analysis was done using SPSS, where the ambient temperature is the dependent variable and the land cover types are the independent variables. This regression model is presented in Equation 1 and further discussed under Section 3.1.
As to the relationship between ambient temperature and vulnerable populations, correlation analysis can help examine how vulnerable populations are exposed to urban heat. The correlation analysis was also done using SPSS. Results of the correlation analysis are presented and discussed in Section 3.2.
In addition to the regression and correlation analyses carried out in SPSS, ArcGIS Pro’s “Multivariate Clustering” tool [39] can deliver an optimized solution where all the Block Groups within each cluster are as similar as possible, and all the clusters themselves are as different as possible [48]. In short, multivariate clustering can identify specific areas with higher ambient temperatures and higher percentages of vulnerable populations, where mitigation measures should be targeted. In this study, the following ArcGIS Pro parameters were used to carry out the multivariate clustering analysis:
- Input features: Richmond Block Group layer;
- Analysis fields: ambient temperature (Ambient_temp), percentage of non-white population (non_whte_pct), and percentage of population with income below poverty level (below_poverty_pct);
- Clustering method: K medoids (note: this option is more robust to noise and outliers in the input features);
- Initialization method: optimized seed locations (note: this option randomly selects the first seed and makes sure that the subsequent seeds selected represent features that are far away from each other in data space).
Findings of the regression, correlation, and multivariate clustering analyses are presented in the next section.
3. Results
3.1. Regression Analysis of Ambient Temperature and Land Cover Types
Based on the research hypothesis that ambient temperatures can be affected by land cover types, a regression model was constructed to examine the impacts of land cover types on ambient temperatures at the Block Group level. The regression model is expressed as:
Ambient_temp (predicted) = b0 + b1 × Water_pct + b2 × Impervious_pct + b3 × Barren_pct + b4 × Tree_pct + b5 × TurfGrass_pct
The dependent variable (Ambient_temp) is derived from the ambient temperature dataset described in Section 2.1. The independent variables (Water_pct, Impervious_pct, Barren_pct, Tree_pct, TurfGrass_pct) are based on the computed percentages of land cover types described in Section 2.2. Given the regression coefficients derived from the regression analysis (Table 1), the regression model can be written as:
Ambient_temp (predicted) = 33.687 − 0.002 × Water_pct + 0.023 × Impervious_pct + 0.092 × Barren_pct − 0.012 × Tree_pct + 0.023 × TurfGrass_pct
As shown in Table 1, the regression analysis generated many statistics that uncover the relationship between dependent and independent variables, as well as the explanatory power and influence of independent variables on the dependent variable. Starting with the F value, a statistic used to assess the statistical significance of the regression model, this regression model is statistically significant (F = 69.783, p < 0.001). It also exhibits a strong relationship between ambient temperature and land cover types (multiple R = 0.832). When it comes to the explanatory power of the independent variables, both R2 and adjusted R2 can be used to assess the percentage of variance in the dependent variable explained by the independent variables. Adjusted R2 is chosen because it takes into account the number of independent variables and observations, which help to increase the reliability of the regression model. Given an adjusted R2 of 0.682, land cover types explained over 68 percent of the variance in ambient temperature.
Collinearity among independent variables was also diagnosed within the regression analysis. If an independent variable is highly correlated with other independent variables, it should be excluded from the regression model to minimize redundancy. Specifically, two collinearity statistics are produced by the regression analysis: tolerance and variance inflation factor (VIF). Tolerance is computed by one minus the R2 of the regression model when a given independent variable is regressed by the rest of the independent variables. In other words, larger tolerance values are associated with smaller R2 values, which translate to less collinearity. VIF is the reciprocal of the tolerance; therefore, smaller VIF values are associated with larger tolerance values or less collinearity. Given that the tolerance values are relatively high (greater than 0.1), or the VIF values are relatively low (less than 10), the regression model does not have a concerning collinearity issue.
The standardized regression coefficients—the beta values—are derived from a regression analysis based on standardized variable values. They can be used to assess and compare the influence of independent variables on the dependent variable on a standard deviation basis. Independent variables with positive beta values have positive impacts on the dependent variable, while negative beta values indicate negative impacts. Absolute beta values can be used to assess the strength of the impacts of independent variables. Regarding the impacts of land cover types on ambient temperatures, the beta values indicate that impervious surface has the strongest impact (beta = 0.786), followed by turf grass (beta = 0.415), tree cover (beta = −0.201), barren land (beta = 0.180), and water feature (beta = −0.016). It is worth noting that impervious surface, turf grass, and barren land have positive beta values in the regression model, indicating that they all contribute to the increase in ambient temperatures. Respectively, tree cover and water feature have negative beta values and they have cooling effects on ambient temperatures. Lastly, the t value is a statistic used to evaluate the statistical significance of the impact of a given independent variable on the dependent variable. Among the independent variables, the only one that is not statistically significant is water feature (t = −0.278, p = 0.782), most likely due to the lack of it and its uneven distribution in the city.
3.2. Correlation Analysis of Ambient Temperature and Vulnerable Populations
A correlation analysis was performed to investigate the relationships between ambient temperature and vulnerable populations, and the resulting correlation coefficients are presented in Table 2. The only vulnerable population that has a negative relationship with ambient temperature is older adults (r = −0.3131), indicating that they are less susceptible to urban heat. In contrast, the other vulnerable populations are positively related to ambient temperature, suggesting that they have a greater health risk associated with urban heat. In specific, Block Groups with higher ambient temperatures tend to have higher percentages of non-white population (r = 0.2207), population with income below poverty level (r = 0.2477), population 20–64 years with a disability (r = 0.0649), and population with no health insurance coverage (r = 0.1067).
3.3. Multivariate Clustering Analysis
While the correlation analysis presented an overall picture of the relationships between ambient temperature and vulnerable populations, it did not take into account the location factor and the spatial distribution of ambient temperatures in association with the distribution of vulnerable populations. To overcome these shortcomings, ArcGIS Pro’s multivariate clustering analysis, as specified in Section 2.4, was carried out to identify unique spatial clusters based on ambient temperature (Ambient_temp), non-white population (non_white_pct), and population with income below poverty level (below_poverty_pct). The reasons why only non_white_pct and below_poverty_pct were included in the multivariate clustering analysis are as follows:
- They have a positive relationship with ambient temperature (Table 2), or a greater risk associated with urban heat;
- Their relationship with ambient temperature is statistically significant (p < 0.01).
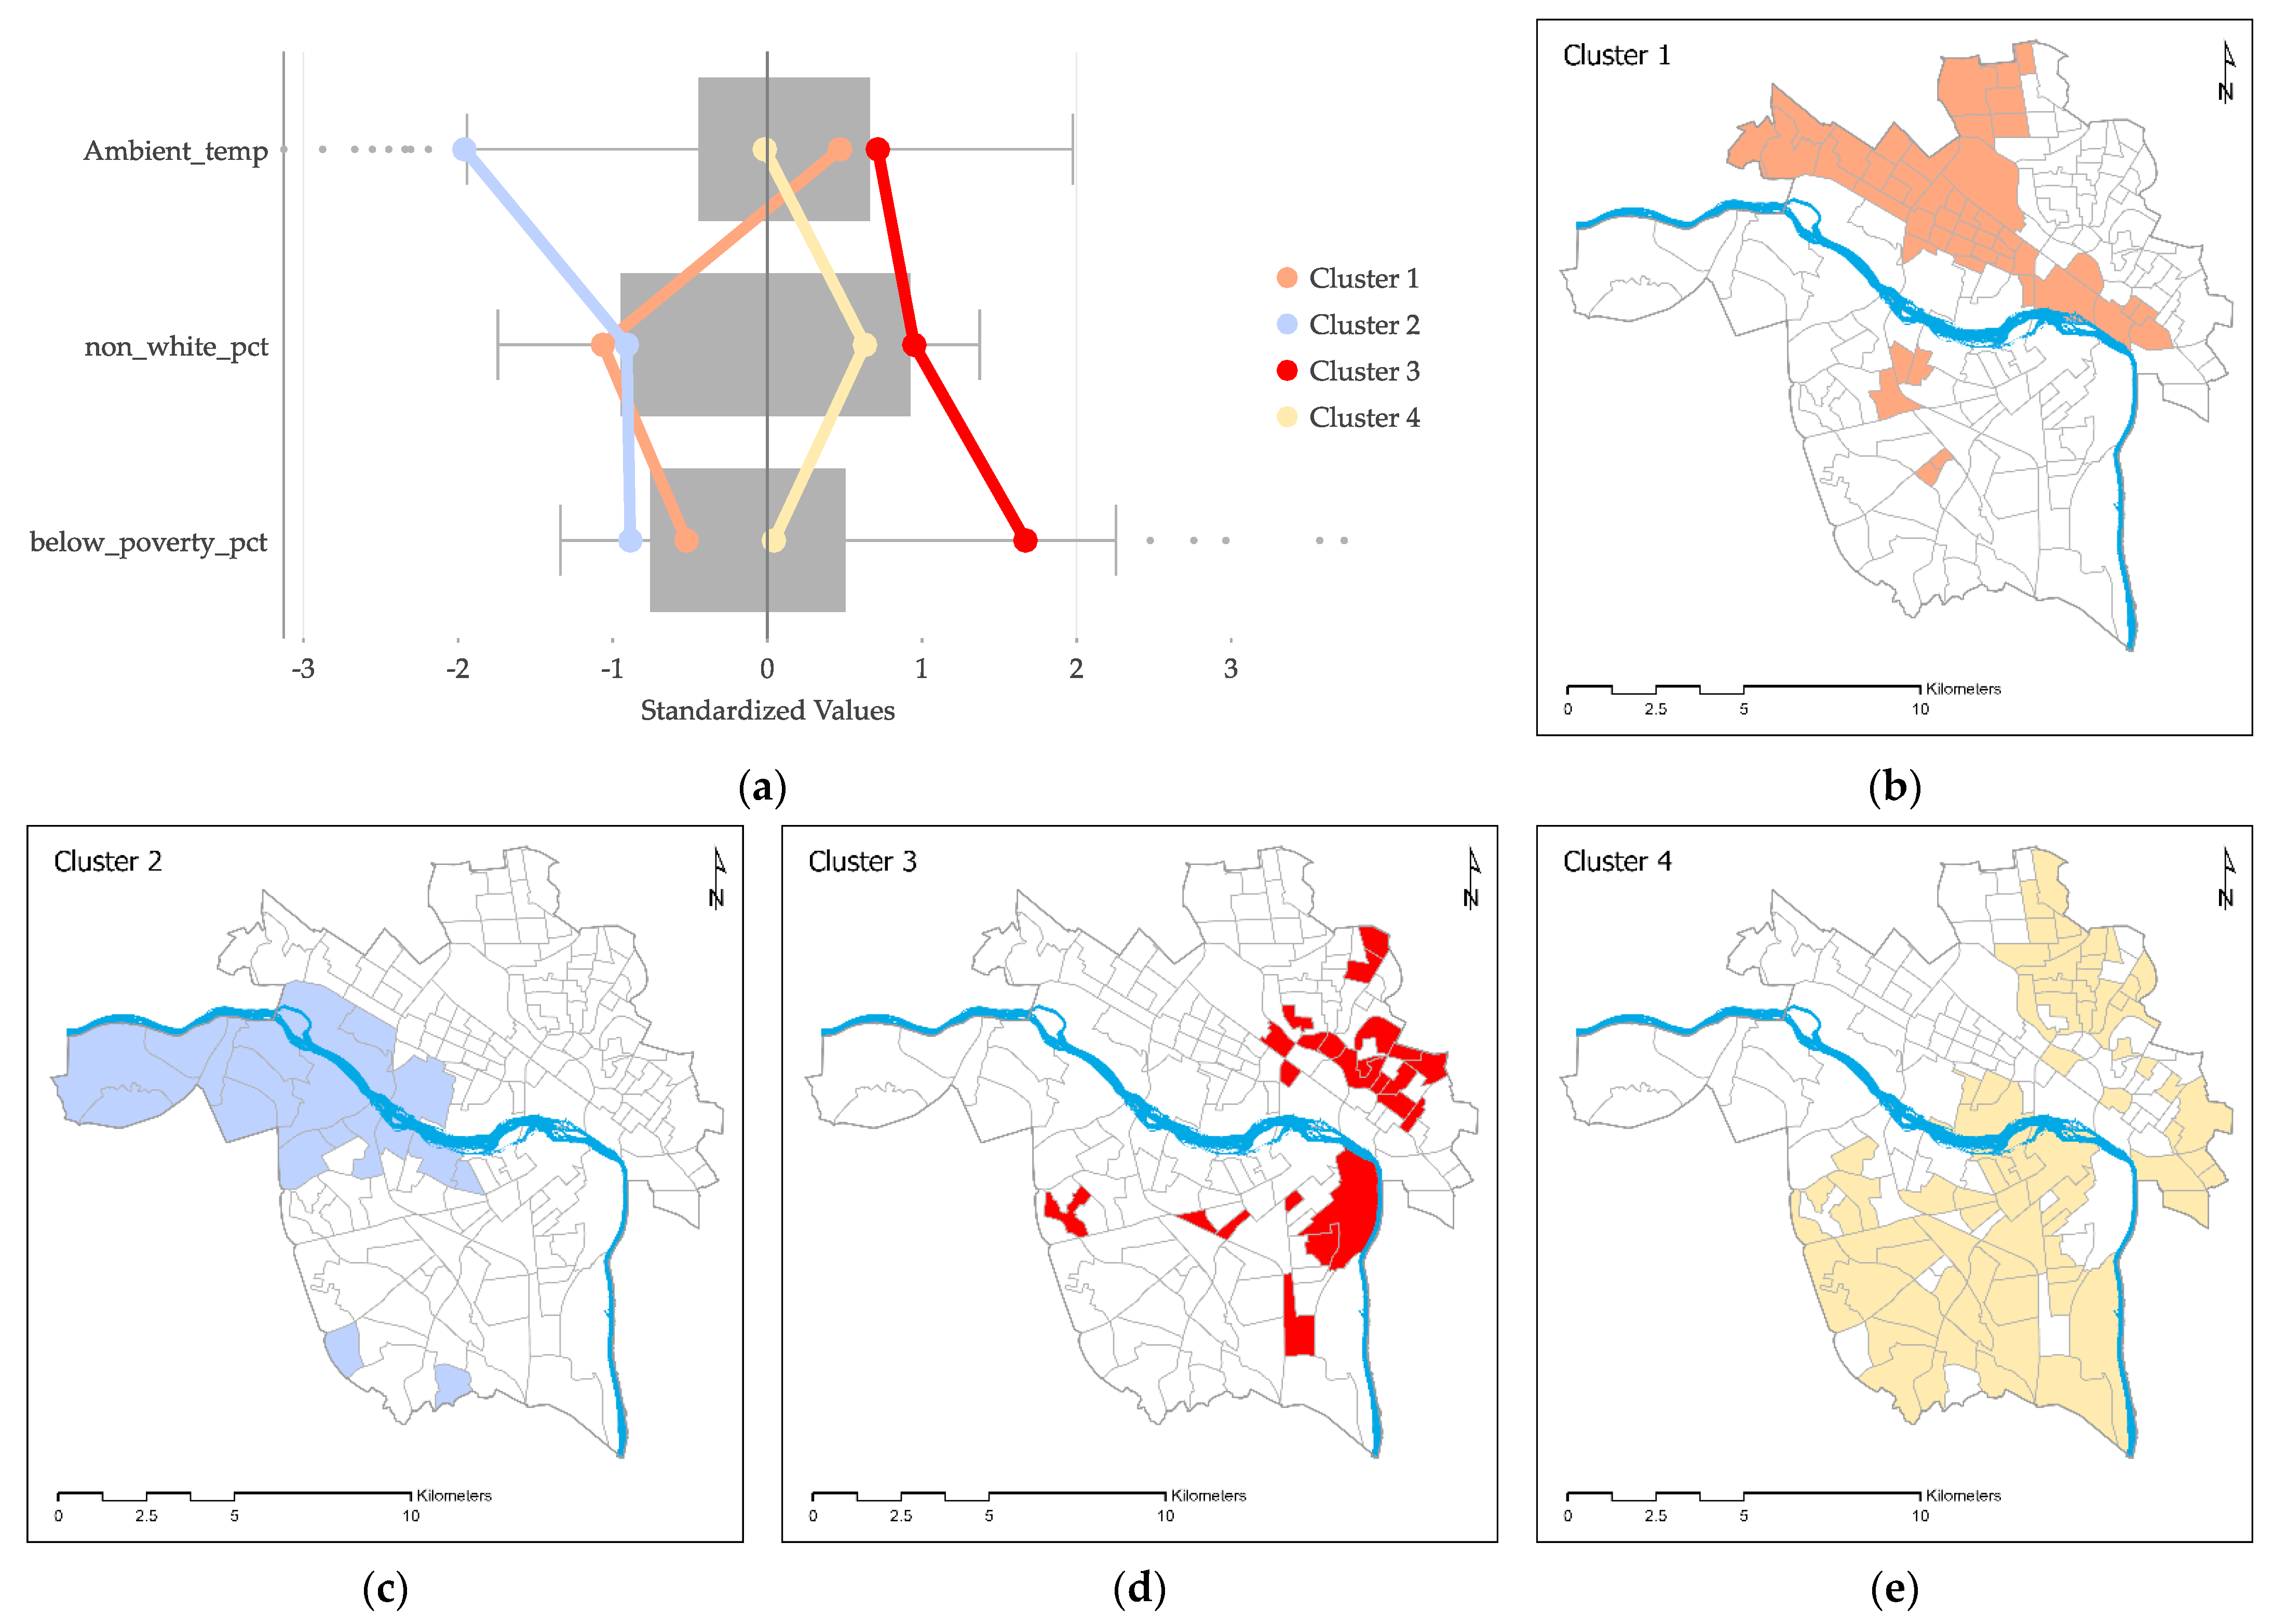
The multivariate clustering analysis produced box-plots (Figure 5a) illustrating the unique combinations of standardized variable values associated with different clusters. The horizontal axis in Figure 5a corresponds to the standardized values of ambient temperature (Ambient_temp), percentage of non-white population (non_whte_pct), and percentage of population with income below poverty level (below_poverty_pct). The standardized variable values are derived by standardizing the raw variable values so that the resulting dataset has a mean of 0 and a standard deviation of 1. Figure 5a also shows each cluster’s mean standardized values of Ambient_temp, non_whte_pct, and below_poverty_pct. The width of each box, shaded in gray, represents the interquartile range defined by the first and third quartiles (i.e., the 25th and 75th percentiles). Plotting the mean standardized variable values in relation to the interquartile ranges helps to visualize the extent of differences among clusters when comparing their Ambient_temp, non_whte_pct, and below_poverty_pct.
As shown in Figure 5, the multivariate clustering analysis derived four clusters, where Block Groups within each cluster share very similar attributes of ambient temperature, non-white population, and population with income below poverty level. According to the multivariate clustering box-plots (Figure 5a), Cluster 1 represents Block Groups with above average ambient temperature, but lower than average vulnerable populations. Cluster 2 represents Block Groups with the lowest ambient temperature and lower than average vulnerable populations. Cluster 4 represent Block Groups with average ambient temperature and population with income below poverty level, but above average non-white population. Among the clusters, Cluster 3 (Figure 5d) deserves the most attention, as it represents Block Groups with the highest ambient temperature and vulnerable populations compared to the other clusters.
4. Discussion
4.1. Ambient Temperature and Land Cover Types
The findings have affirmed that impervious surface contributes to higher ambient temperatures, while tree coverage has a cooling effect on urban heat (Table 1). Although this finding is by no means groundbreaking, the land cover dataset provided by the Virginia Geographic Information Network (VGIN) has a much finer one-meter resolution than satellite-based datasets; hence, a more precise result can be expected. In addition, it should be noted that turf grass (e.g., lawn, golf course) also contributes to higher ambient temperatures, even it is a type of vegetation. These findings are helpful in the context of mitigating UHI effect discussed in Section 4.3 below.
4.2. Ambient Temperature and Vulnerable Populations
This study finds that vulnerable populations, except for older adults, tend to live in areas with higher ambient temperatures (Table 2). This is especially true for the non-white population and population with income below poverty level. Furthermore, these vulnerable populations are spatially clustered in specific areas in the city (Figure 5d). These vulnerable populations have limited heat-adaptive capacities, putting them at increased risk of heat stress [24,27]. Being able to identify the specific Block Groups in the vulnerable cluster would help policy makers and stakeholders prioritize and target mitigation measures to those areas. These findings have important implications for public policies and environmental justice concerning equitable distribution of environmental resources [29,49], such as planting trees or building neighborhood parks.
4.3. UHI Mitigation Measures
Given that impervious surface and tree coverage are the two leading land cover types that have significant impacts on increasing or lowering ambient temperatures (Table 1), the vulnerable clusters should be prioritized for mitigation measures accordingly. Within the context of this study, implementing the following measures would help reduce the intensity of urban heat and its negative effect on health.
4.3.1. High-Albedo Materials
Urban surfaces such as street pavements, parking lots, building envelopes, and roofs absorb a large amount of solar radiation, which raises ambient temperatures and contributes to the forming of UHIs. Increasing the albedo of the built environment can help mitigate the UHI effect. For instance, cool pavement materials [50,51] and retro-reflective materials [52,53] can be used to reflect solar radiation away from various urban surfaces, which in turn would reduce the UHI effect in urban areas.
4.3.2. Tree Coverage and Green Space
In addition to applying high-albedo materials to urban surfaces, tree coverage and green space have major cooling effects on urban heat [14,15,25]. Expanding tree coverage and green space in urban areas can be accomplished by planting trees [54,55], creating parks and green space [56,57], and incorporating green roof and façade [58,59] into new building design and retrofitting them to existing buildings. These measures can effectively mitigate the UHI effect and beautify the urban environment.
4.4. Limitations and Future Research
While this study was a good exercise that provided some insights on the relationship and spatial association of vulnerable populations and urban heat islands, it has a few limitations, some of which are data-related and some of which methodological. Although these limiting factors require additional attention and effort beyond the scope of the current study, limitations do present themselves as future research opportunities and they are discussed here.
- As a case study of the city of Richmond, research findings have limited generalizability. However, methods and analyses utilized in the study are applicable to conduct similar studies in other cities. This presents a great opportunity for a comparative study to assess impacted populations and their vulnerabilities associated with urban heat islands in different cities;
- Although the American Community Survey (ACS) [60] provides vital information of vulnerable populations on a yearly basis, this study is limited by the available ambient temperature dataset derived from temperature measurements collected in 2017. If such city-wide ambient temperature datasets are available on a yearly basis, a longitudinal study would offer valuable insights on the changes of urban heat islands and their association with vulnerable populations over time;
- This study explored the relationship and identified the spatial association of ambient temperature and vulnerable populations. The findings can be enriched further by studying additional factors that can help explain the spatial distribution patterns of vulnerable populations in the city.
5. Conclusions
This study intends to assess urban heat islands and land cover types in relation to vulnerable populations. The city of Richmond, Virginia was selected as the study area using Census Block Group as the geographic unit of analysis. UHI was assessed by a city-wide ambient temperature dataset. The land cover dataset was compiled from land cover map tiles developed by VGIN. This study examined the impacts of land cover types on ambient temperatures using regression analysis. Correlation analysis was performed to assess the relationship between ambient temperature and vulnerable populations. Multivariate clustering analysis was carried out to identify specific vulnerable areas in the city where mitigation measures should be prioritized for implementation. Findings suggest that: (1) impervious surface leads to higher ambient temperatures, while tree coverage has a cooling effect on urban heat; (2) vulnerable populations, except for older adults, tend to live in areas with higher ambient temperatures; and (3) vulnerable populations are spatially clustered in specific areas in the city. These findings are in agreement with the UHI literature from a similar context. Applying high-albedo materials to urban surfaces and expanding tree coverage and green space can mitigate the effect of urban heat islands. As a case study, findings of the study are not generalizable beyond Richmond without additional research and validation. Nevertheless, the methodology developed in this study is transferrable and can be applied to study other localities to further our understanding of urban heat islands and land cover types in relation to vulnerable populations.
Funding
This research received no external funding.
Institutional Review Board Statement
Not applicable.
Informed Consent Statement
Not applicable.
Data Availability Statement
The 2017 Urban Heat Island dataset of Richmond, Virginia was provided by Jeremy Hoffman (jhoffman@smv.org) of the Science Museum of Virginia. The Virginia Land Cover Dataset released in 2016 by the Virginia Geographic Information Network (VGIN) is available at https://vgin.maps.arcgis.com/home/item.html?id=d3d51bb5431a4d26a313f586c7c2c848 (accessed on 14 April 2022). The 2017 American Community Survey (ACS) 5-Year Estimates Detailed Tables were downloaded from the US Census Bureau website at https://data.census.gov/cedsci/ (accessed on 22 April 2022).
Acknowledgments
The author is grateful to Jeremy Hoffman of the Science Museum of Virginia, who provided the 2017 Urban Heat Island dataset of Richmond, Virginia.
Conflicts of Interest
The author declares no conflict of interest.
References
- Howard, L. The Climate of London, IAUC ed.; International Association for Urban Climate: Dublin, Irland, 1833; pp. 6–9. Available online: http://urban-climate.org/documents/LukeHoward_Climate-of-London-V1.pdf (accessed on 28 March 2022).
- Kolokotroni, M.; Giridharan, R. Urban Heat Island Intensity in London: An Investigation of the Impact of Physical Characteristics on Changes in Outdoor Air Temperature during Summer. Sol. Energy 2008, 82, 986–998. [Google Scholar] [CrossRef] [Green Version]
- Giannopoulou, K.; Livada, I.; Santamouris, M.; Saliari, M.; Assimakopoulos, M.; Caouris, Y.G. On the Characteristics of the Summer Urban Heat Island in Athens, Greece. Sustain. Cities Soc. 2011, 1, 16–28. [Google Scholar] [CrossRef]
- Rinner, C.; Hussain, M. Toronto’s Urban Heat Island—Exploring the Relationship between Land Use and Surface Temperature. Remote Sens. 2011, 3, 1251–1265. [Google Scholar] [CrossRef] [Green Version]
- Busato, F.; Lazzarin, R.M.; Noro, M. Three Years of Study of the Urban Heat Island in Padua: Experimental Results. Sustain. Cities Soc. 2014, 10, 251–258. [Google Scholar] [CrossRef]
- Kikon, N.; Singh, P.; Singh, S.K.; Vyas, A. Assessment of Urban Heat Islands (UHI) of Noida City, India Using Multi-Temporal Satellite Data. Sustain. Cities Soc. 2016, 22, 19–28. [Google Scholar] [CrossRef]
- Zheng, T.; Qu, K.; Darkwa, J.; Calautit, J.K. Evaluating Urban Heat Island Mitigation Strategies for a Subtropical City Centre (a Case Study in Osaka, Japan). Energy 2022, 250, 123721. [Google Scholar] [CrossRef]
- Julius, S.; Maxwell, K.; Grambsch, A.; Kosmal, A.; Larson, L.; Sonti, N. Chapter 11: Built Environment, Urban Systems, and Cities. In Impacts, Risks, and Adaptation in the United States: Fourth National Climate Assessment, Volume II; U.S. Global Change Research Program: Washington, DC, USA, 2018; pp. 439–478. [Google Scholar]
- Solecki, W.; Rosenzweig, C.; Parshall, L.; Pope, G.; Clark, M.; Cox, J.; Wiencke, M. Mitigation of the Heat Island Effect in Urban New Jersey. Glob. Environ. Change Part B Environ. Hazards 2005, 6, 39–49. [Google Scholar] [CrossRef]
- Mohajerani, A.; Bakaric, J.; Jeffrey-Bailey, T. The Urban Heat Island Effect, Its Causes, and Mitigation, with Reference to the Thermal Properties of Asphalt Concrete. J. Environ. Manag. 2017, 197, 522–538. [Google Scholar] [CrossRef]
- Unger, J. Intra-Urban Relationship between Surface Geometry and Urban Heat Island: Review and New Approach. Clim. Res. 2004, 27, 253–264. [Google Scholar] [CrossRef] [Green Version]
- Rizwan, A.M.; Dennis, L.Y.C.; Liu, C. A Review on the Generation, Determination and Mitigation of Urban Heat Island. J. Environ. Sci. 2008, 20, 120–128. [Google Scholar] [CrossRef]
- Yuan, F.; Bauer, M.E. Comparison of Impervious Surface Area and Normalized Difference Vegetation Index as Indicators of Surface Urban Heat Island Effects in Landsat Imagery. Remote Sens. Environ. 2007, 106, 375–386. [Google Scholar] [CrossRef]
- Zhou, W.; Qian, Y.; Li, X.; Li, W.; Han, L. Relationships between Land Cover and the Surface Urban Heat Island: Seasonal Variability and Effects of Spatial and Thematic Resolution of Land Cover Data on Predicting Land Surface Temperatures. Landsc. Ecol. 2014, 29, 153–167. [Google Scholar] [CrossRef]
- Zhou, W.; Wang, J.; Cadenasso, M.L. Effects of the Spatial Configuration of Trees on Urban Heat Mitigation: A Comparative Study. Remote Sens. Environ. 2017, 195, 1–12. [Google Scholar] [CrossRef]
- U.S. Environmental Protection Agency. Heat Island Impacts. Available online: https://www.epa.gov/heatislands/heat-island-impacts (accessed on 19 May 2022).
- Santamouris, M. Recent Progress on Urban Overheating and Heat Island Research. Integrated Assessment of the Energy, Environmental, Vulnerability and Health Impact. Synergies with the Global Climate Change. Energy Build. 2020, 207, 109482. [Google Scholar] [CrossRef]
- Somers, K.A.; Bernhardt, E.S.; McGlynn, B.L.; Urban, D.L. Downstream Dissipation of Storm Flow Heat Pulses: A Case Study and Its Landscape-Level Implications. JAWRA J. Am. Water Resour. Assoc. 2016, 52, 281–297. [Google Scholar] [CrossRef]
- Sarofim, M.C.; Saha, S.; Hawkins, M.D.; Mills, D.M.; Hess, J.; Horton, R.; Kinney, P.; Schwartz, J.; Juliana, A.S. Chapter 2: Temperature-Related Death and Illness. In The Impacts of Climate Change on Human Health in the United States: A Scientific Assessment; U.S. Global Change Research Program: Washington, DC, USA, 2016; pp. 43–68. [Google Scholar]
- U.S. Environmental Protection Agency. Heat Islands and Equity. Available online: https://www.epa.gov/heatislands/heat-islands-and-equity (accessed on 20 May 2022).
- Reckien, D.; Creutzig, F.; Fernandez, B.; Lwasa, S.; Tovar-Restrepo, M.; Mcevoy, D.; Satterthwaite, D. Climate Change, Equity and the Sustainable Development Goals: An Urban Perspective. Environ. Urban. 2017, 29, 159–182. [Google Scholar] [CrossRef] [Green Version]
- Hamstead, Z.A.; Farmer, C.; McPhearson, T. Landscape-Based Extreme Heat Vulnerability Assessment. J. Extrem. Events 2018, 05, 1850018. [Google Scholar] [CrossRef]
- Huang, G.; Zhou, W.; Cadenasso, M.L. Is Everyone Hot in the City? Spatial Pattern of Land Surface Temperatures, Land Cover and Neighborhood Socioeconomic Characteristics in Baltimore, MD. J. Environ. Manag. 2011, 92, 1753–1759. [Google Scholar] [CrossRef]
- Voelkel, J.; Hellman, D.; Sakuma, R.; Shandas, V. Assessing Vulnerability to Urban Heat: A Study of Disproportionate Heat Exposure and Access to Refuge by Socio-Demographic Status in Portland, Oregon. Int. J. Environ. Res. Public Health 2018, 15, 640. [Google Scholar] [CrossRef] [Green Version]
- Zhou, W.; Huang, G.; Pickett, S.T.A.; Wang, J.; Cadenasso, M.L.; McPhearson, T.; Grove, J.M.; Wang, J. Urban Tree Canopy Has Greater Cooling Effects in Socially Vulnerable Communities in the US. One Earth 2021, 4, 1764–1775. [Google Scholar] [CrossRef]
- Landry, S.M.; Chakraborty, J. Street Trees and Equity: Evaluating the Spatial Distribution of an Urban Amenity. Environ. Plan A 2009, 41, 2651–2670. [Google Scholar] [CrossRef]
- Drescher, M. Urban Heating and Canopy Cover Need to Be Considered as Matters of Environmental Justice. Proc. Natl. Acad. Sci. USA 2019, 116, 26153–26154. [Google Scholar] [CrossRef] [PubMed]
- Riley, C.B.; Gardiner, M.M. Examining the Distributional Equity of Urban Tree Canopy Cover and Ecosystem Services across United States Cities. PLoS ONE 2020, 15, e0228499. [Google Scholar] [CrossRef] [PubMed] [Green Version]
- Harlan, S.L.; Brazel, A.J.; Prashad, L.; Stefanov, W.L.; Larsen, L. Neighborhood Microclimates and Vulnerability to Heat Stress. Soc. Sci. Med. 2006, 63, 2847–2863. [Google Scholar] [CrossRef]
- Jusuf, S.K.; Wong, N.H.; Hagen, E.; Anggoro, R.; Hong, Y. The Influence of Land Use on the Urban Heat Island in Singapore. Habitat Int. 2007, 31, 232–242. [Google Scholar] [CrossRef]
- Sobrino, J.A.; Oltra-Carrió, R.; Sòria, G.; Bianchi, R.; Paganini, M. Impact of Spatial Resolution and Satellite Overpass Time on Evaluation of the Surface Urban Heat Island Effects. Remote Sens. Environ. 2012, 117, 50–56. [Google Scholar] [CrossRef]
- Mirzaei, P.A. Recent Challenges in Modeling of Urban Heat Island. Sustain. Cities Soc. 2015, 19, 200–206. [Google Scholar] [CrossRef] [Green Version]
- Orusa, T.; Mondino, E.B. Landsat 8 Thermal Data to Support Urban Management and Planning in the Climate Change Era: A Case Study in Torino Area, NW Italy. In Proceedings of the Remote Sensing Technologies and Applications in Urban Environments IV., Strasbourg, France, 2 October 2019; Volume 11157, pp. 133–149. [Google Scholar] [CrossRef]
- Yokobori, T.; Ohta, S. Effect of Land Cover on Air Temperatures Involved in the Development of an Intra-Urban Heat Island. Clim. Res. 2009, 39, 61–73. [Google Scholar] [CrossRef]
- Makido, Y.; Shandas, V.; Ferwati, S.; Sailor, D. Daytime Variation of Urban Heat Islands: The Case Study of Doha, Qatar. Climate 2016, 4, 32. [Google Scholar] [CrossRef] [Green Version]
- Voelkel, J.; Shandas, V. Towards Systematic Prediction of Urban Heat Islands: Grounding Measurements, Assessing Modeling Techniques. Climate 2017, 5, 41. [Google Scholar] [CrossRef] [Green Version]
- Shandas, V.; Voelkel, J.; Williams, J.; Hoffman, J. Integrating Satellite and Ground Measurements for Predicting Locations of Extreme Urban Heat. Climate 2019, 7, 5. [Google Scholar] [CrossRef] [Green Version]
- Virginia Geographic Information Network (VGIN). Virginia Land Cover Dataset—Overview. Available online: https://vgin.maps.arcgis.com/home/item.html?id=d3d51bb5431a4d26a313f586c7c2c848 (accessed on 15 May 2022).
- ESRI. Multivariate Clustering, ArcGIS Pro Documentation. Available online: https://pro.arcgis.com/en/pro-app/latest/tool-reference/spatial-statistics/multivariate-clustering.htm (accessed on 19 May 2022).
- U.S. Census Bureau. 2020 Census. Available online: https://www.census.gov/2020census (accessed on 15 May 2022).
- Weather Spark. Richmond Climate, Weather by Month, Average Temperature (Virginia, United States). Available online: https://weatherspark.com/y/20906/Average-Weather-in-Richmond-Virginia-United-States-Year-Round (accessed on 20 May 2022).
- Hoffman, J. Where Do We Need Shade? Mapping Urban Heat Islands in Richmond, Virginia. Available online: https://www.climate.gov/news-features/climate-case-studies/where-do-we-need-shade-mapping-urban-heat-islands-richmond (accessed on 15 May 2022).
- ESRI. Zonal Statistics as Table, ArcGIS Pro Documentation. Available online: https://pro.arcgis.com/en/pro-app/latest/tool-reference/spatial-analyst/zonal-statistics-as-table.htm (accessed on 19 May 2022).
- Virginia Geographic Information Network (VGIN). Land Cover Dataset Download Application. Available online: https://vgin.maps.arcgis.com/apps/View/index.html?appid=d3d51bb5431a4d26a313f586c7c2c848 (accessed on 15 May 2022).
- ESRI. Clip, ArcGIS Pro Documentation. Available online: https://pro.arcgis.com/en/pro-app/latest/tool-reference/analysis/clip.htm (accessed on 14 June 2022).
- ESRI. Append, ArcGIS Pro Documentation. Available online: https://pro.arcgis.com/en/pro-app/latest/tool-reference/data-management/append.htm (accessed on 14 June 2022).
- ESRI. Tabulate Intersection, ArcGIS Pro Documentation. Available online: https://pro.arcgis.com/en/pro-app/latest/tool-reference/analysis/tabulate-intersection.htm (accessed on 19 May 2022).
- ESRI. How Multivariate Clustering Works, ArcGIS Pro Documentation. Available online: https://pro.arcgis.com/en/pro-app/latest/tool-reference/spatial-statistics/how-multivariate-clustering-works.htm (accessed on 16 May 2022).
- Jesdale, B.M.; Morello-Frosch, R.; Cushing, L. The Racial/Ethnic Distribution of Heat Risk–Related Land Cover in Relation to Residential Segregation. Environ. Health Perspect 2013, 121, 811–817. [Google Scholar] [CrossRef] [PubMed] [Green Version]
- Carnielo, E.; Zinzi, M. Optical and Thermal Characterisation of Cool Asphalts to Mitigate Urban Temperatures and Building Cooling Demand. Build. Environ. 2013, 60, 56–65. [Google Scholar] [CrossRef]
- Qin, Y. A Review on the Development of Cool Pavements to Mitigate Urban Heat Island Effect. Renew. Sustain. Energy Rev. 2015, 52, 445–459. [Google Scholar] [CrossRef]
- Rossi, F.; Pisello, A.L.; Nicolini, A.; Filipponi, M.; Palombo, M. Analysis of Retro-Reflective Surfaces for Urban Heat Island Mitigation: A New Analytical Model. Appl. Energy 2014, 114, 621–631. [Google Scholar] [CrossRef]
- Qin, Y.; Liang, J.; Tan, K.; Li, F. A Side by Side Comparison of the Cooling Effect of Building Blocks with Retro-Reflective and Diffuse-Reflective Walls. Sol. Energy 2016, 133, 172–179. [Google Scholar] [CrossRef]
- Takebayashi, H.; Kimura, Y.; Kyogoku, S. Study on the Appropriate Selection of Urban Heat Island Measure Technologies to Urban Block Properties. Sustain. Cities Soc. 2014, 13, 217–222. [Google Scholar] [CrossRef]
- Ziter, C.D.; Pedersen, E.J.; Kucharik, C.J.; Turner, M.G. Scale-Dependent Interactions between Tree Canopy Cover and Impervious Surfaces Reduce Daytime Urban Heat during Summer. Proc. Natl. Acad. Sci. USA 2019, 116, 7575–7580. [Google Scholar] [CrossRef] [Green Version]
- Bowler, D.E.; Buyung-Ali, L.; Knight, T.M.; Pullin, A.S. Urban Greening to Cool Towns and Cities: A Systematic Review of the Empirical Evidence. Landsc. Urban Plan. 2010, 97, 147–155. [Google Scholar] [CrossRef]
- Gago, E.J.; Roldan, J.; Pacheco-Torres, R.; Ordóñez, J. The City and Urban Heat Islands: A Review of Strategies to Mitigate Adverse Effects. Renew. Sustain. Energy Rev. 2013, 25, 749–758. [Google Scholar] [CrossRef]
- Wonorahardjo, S.; Sutjahja, I.M.; Mardiyati, Y.; Andoni, H.; Achsani, R.A.; Steven, S.; Thomas, D.; Tunçbilek, E.; Arıcı, M.; Rahmah, N.; et al. Effect of Different Building Façade Systems on Thermal Comfort and Urban Heat Island Phenomenon: An Experimental Analysis. Build. Environ. 2022, 217, 109063. [Google Scholar] [CrossRef]
- Wang, X.; Li, H.; Sodoudi, S. The Effectiveness of Cool and Green Roofs in Mitigating Urban Heat Island and Improving Human Thermal Comfort. Build. Environ. 2022, 217, 109082. [Google Scholar] [CrossRef]
- U.S. Census Bureau. About the American Community Survey. Available online: https://www.census.gov/programs-surveys/acs/about.html (accessed on 17 May 2022).
Figure 1.
Study area and its location—the city of Richmond, Virginia.

Figure 2.
(a) Ambient temperatures of Richmond, Virginia. (Data source: ground temperature measurements were collected through vehicular traverses at 3:00 p.m. on 13 July 2017 and integrated with the Sentinel-2 satellite data to predict the city-wide ambient temperatures [37]); (b) mean ambient temperature at the Block Group level.

Figure 3.
Land cover types of Richmond, Virginia. (Data source: land cover data were downloaded using the Land Cover Dataset Download application developed by the Virginia Geographic Information Network (VGIN) [44]).
Figure 3.
Land cover types of Richmond, Virginia. (Data source: land cover data were downloaded using the Land Cover Dataset Download application developed by the Virginia Geographic Information Network (VGIN) [44]).

Figure 4.
City of Richmond ambient temperature and vulnerable populations at the Block Group level: (a) mean ambient temperature; (b) percentage of older adults 65 years and over; (c) percentage of non-white population; (d) percentage of population with income below poverty level; (e) percentage of population 20–64 years with a disability; (f) percentage of population with no health insurance coverage.


Figure 5.
Multivariate clustering analysis of ambient temperature (Ambient_temp), percentage of non-white population (non_whte_pct), and percentage of population with income below poverty level (below_poverty_pct): (a) box-plots; (b) Cluster 1; (c) Cluster 2; (d) Cluster 3; (e) Cluster 4.
Figure 5.
Multivariate clustering analysis of ambient temperature (Ambient_temp), percentage of non-white population (non_whte_pct), and percentage of population with income below poverty level (below_poverty_pct): (a) box-plots; (b) Cluster 1; (c) Cluster 2; (d) Cluster 3; (e) Cluster 4.


Table 1.
Regression analysis of ambient temperature and land cover types (N = 161).
| Collinearity Statistics | |||||||
|---|---|---|---|---|---|---|---|
| Independent Variables | Coefficient | Std. Error | Beta | t | Sig. | Tolerance | VIF |
| Constant | 33.687 | 0.278 | 121.176 | <0.001 | |||
| Water_pct | −0.002 | 0.006 | −0.016 | −0.278 | 0.782 | 0.630 | 1.587 |
| Impervious_pct | 0.023 | 0.003 | 0.786 | 8.094 | <0.001 | 0.211 | 4.747 |
| Barren_pct | 0.092 | 0.024 | 0.180 | 3.783 | <0.001 | 0.881 | 1.135 |
| Tree_pct | −0.012 | 0.005 | −0.201 | −2.633 | 0.009 | 0.339 | 2.951 |
| TurfGrass_pct | 0.023 | 0.003 | 0.415 | 6.561 | <0.001 | 0.495 | 2.020 |
| Dependent Variable: | Ambient_temp: Ambient temperature of Richmond, Virginia at 3 p.m. on 13 July 2017. | ||||||
| Independent Variables: | Water_pct: Percentage of Block Group area covered by water feature. | ||||||
| Impervious_pct: Percentage of Block Group area covered by impervious surface. | |||||||
| Barren_pct: Percentage of Block Group area covered by barren land. | |||||||
| Tree_pct: Percentage of Block Group area covered by tree. | |||||||
| TurfGrass_pct: Percentage of Block Group area covered by turf grass. | |||||||
| Multiple R = 0.832; R2 = 0.692; Adjusted R2 = 0.682; F = 69.783 (p < 0.001) | |||||||
Table 2.
Correlation analysis of ambient temperature and vulnerable populations (N = 161).
| Variable | Ambient_temp | older_adults_pct | non_white_pct | below_poverty_pct | disability_pct | no_insurance_pct |
|---|---|---|---|---|---|---|
| Ambient_temp | 1 | |||||
| older_adults_pct | −0.3131 ** | 1 | ||||
| non_white_pct | 0.2207 ** | −0.1194 | 1 | |||
| below_poverty_pct | 0.2477 ** | −0.3098 ** | 0.5268 ** | 1 | ||
| disability_pct | 0.0649 | −0.0222 | 0.6793 ** | 0.4973 ** | 1 | |
| no_insurance_pct | 0.1067 | −0.3061 ** | 0.3744 ** | 0.3237 ** | 0.2316 ** | 1 |
| ** Correlation is significant at the 0.01 level (2-tailed). | ||||||
| Ambient_temp: Ambient temperature of Richmond, Virginia at 3 p.m. on 13 July 2017. | ||||||
| older_adults_pct: Percentage of older adults 65 years and over. | ||||||
| non-white_pct: Percentage of non-white population. | ||||||
| below_poverty_pct: Percentage of population with income below poverty level. | ||||||
| disability_pct: Percentage of population 20–64 years with a disability. | ||||||
| no_insurance_pct: Percentage of population with no health insurance coverage. | ||||||
Publisher’s Note: MDPI stays neutral with regard to jurisdictional claims in published maps and institutional affiliations. |
© 2022 by the author. Licensee MDPI, Basel, Switzerland. This article is an open access article distributed under the terms and conditions of the Creative Commons Attribution (CC BY) license (https://creativecommons.org/licenses/by/4.0/).
Share and Cite
MDPI and ACS Style
Suen, I.-S. Assessment of Urban Heat Islands and Land Cover Types in Relation to Vulnerable Populations. Earth 2022, 3, 733-747. https://doi.org/10.3390/earth3020041
AMA Style
Suen I-S. Assessment of Urban Heat Islands and Land Cover Types in Relation to Vulnerable Populations. Earth. 2022; 3(2):733-747. https://doi.org/10.3390/earth3020041
Chicago/Turabian StyleSuen, I-Shian. 2022. "Assessment of Urban Heat Islands and Land Cover Types in Relation to Vulnerable Populations" Earth 3, no. 2: 733-747. https://doi.org/10.3390/earth3020041