
Development and Application of Water and Land Resources Degradation Index (WLDI)

 ,
,  ,
,  ,
,  , , ,
, , , 
Abstract
:1. Introduction
2. Materials and Methods
2.1. Study Area
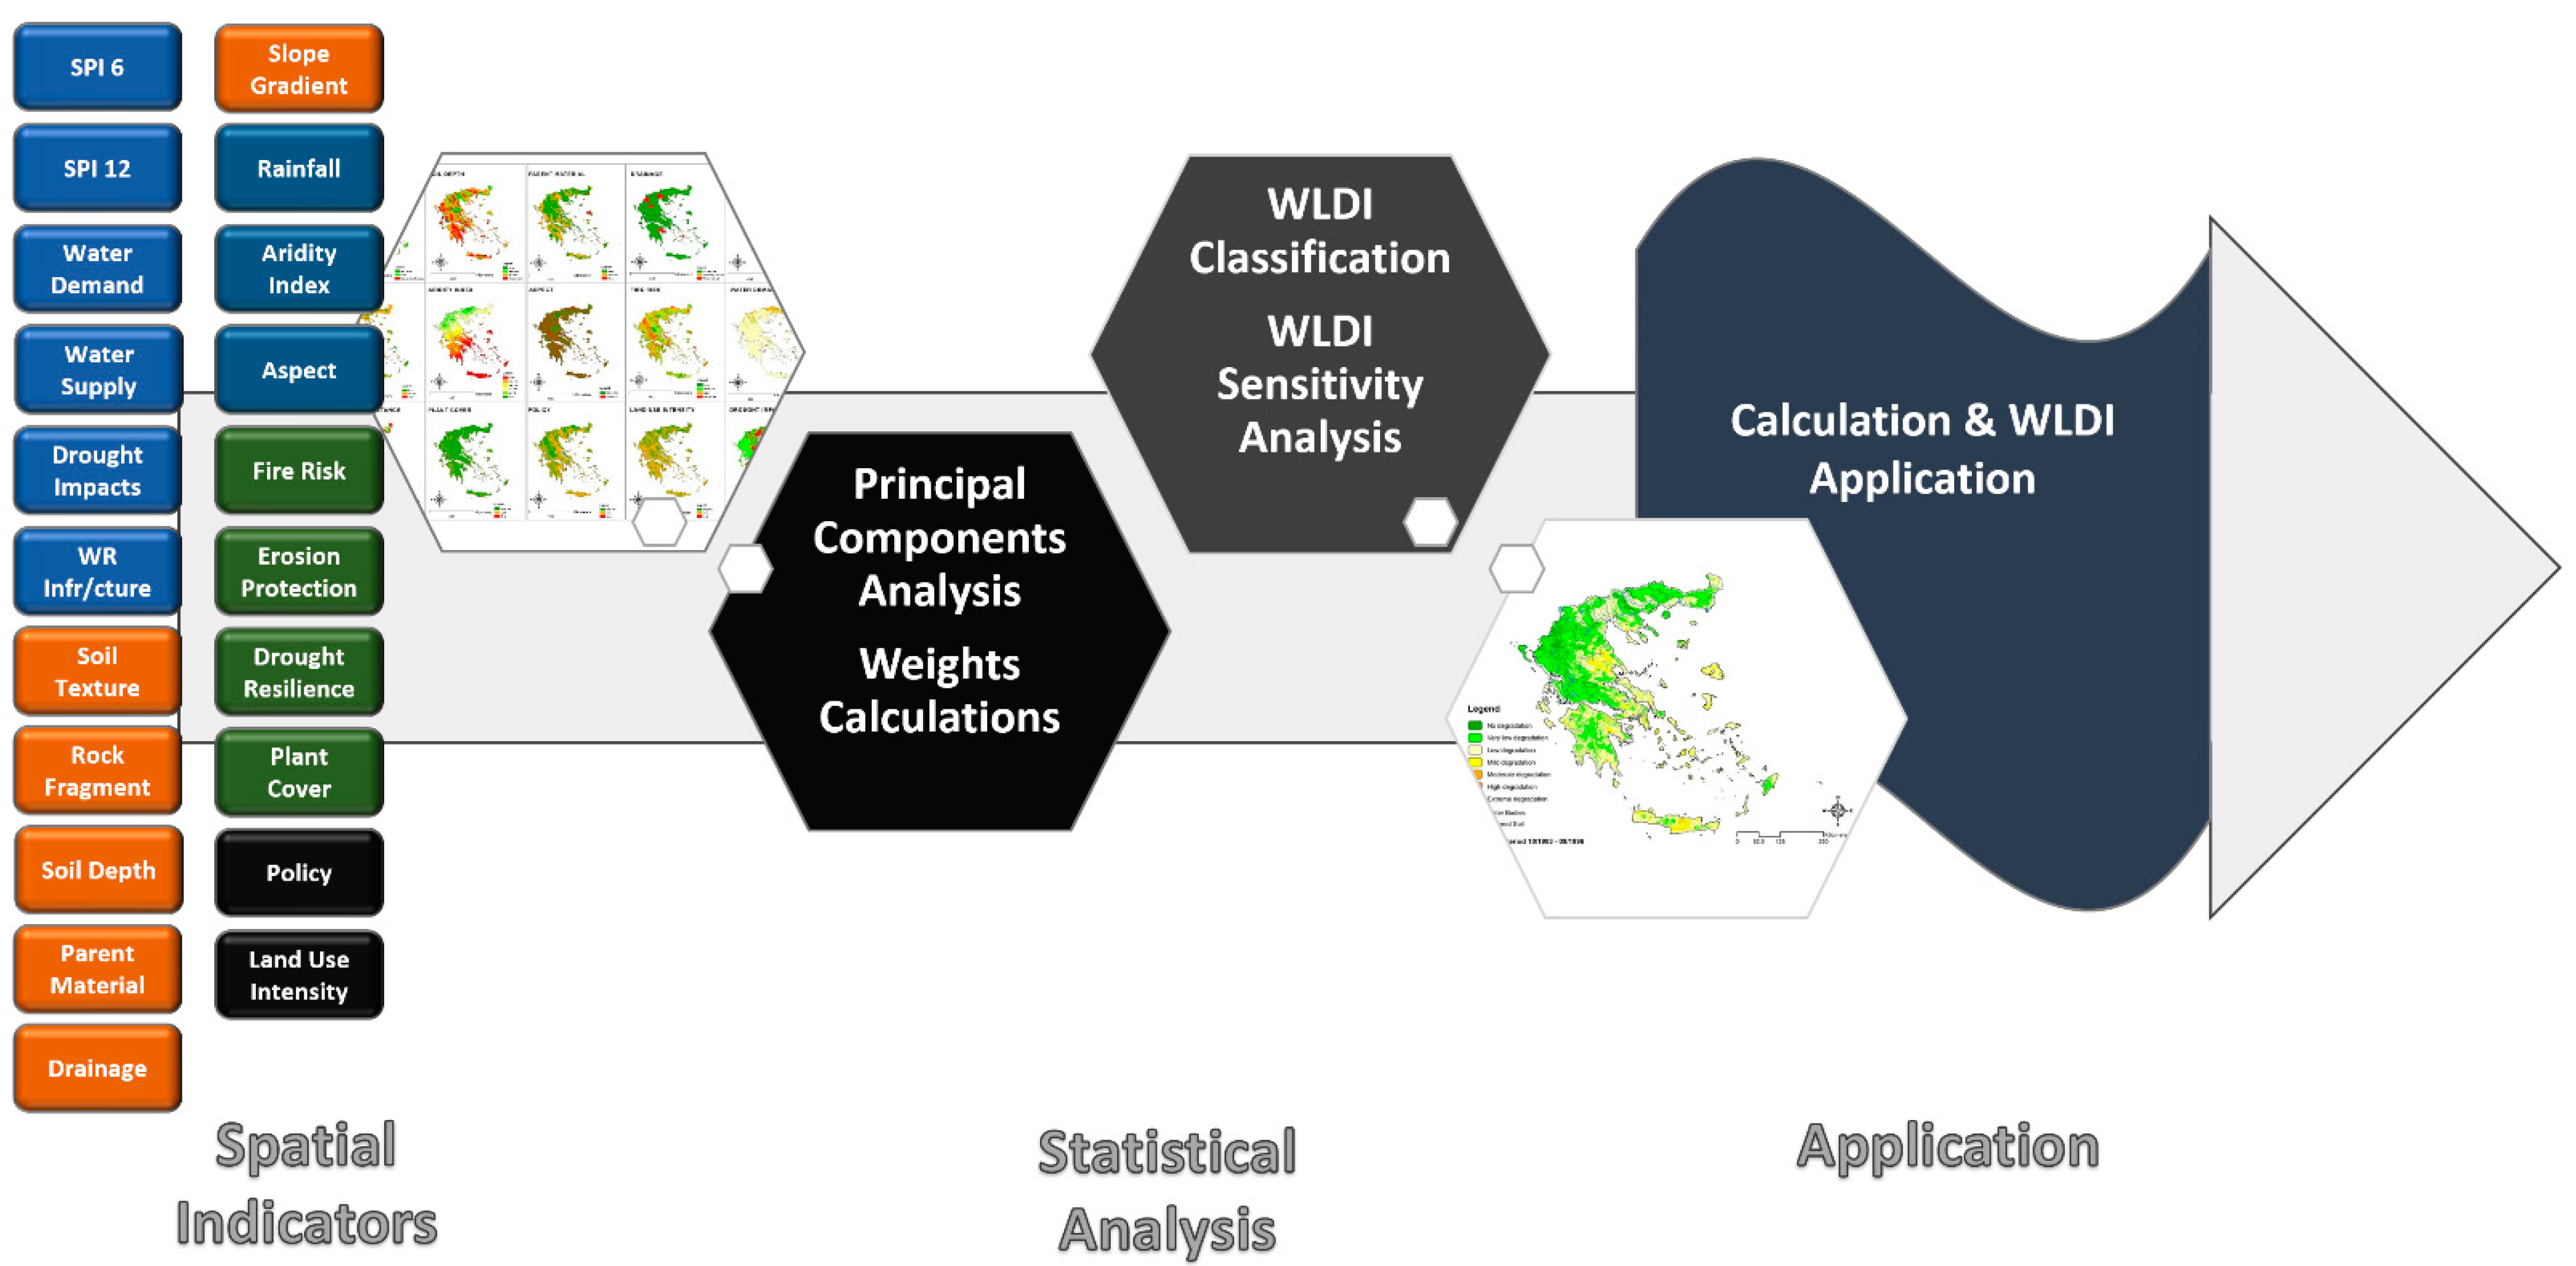
2.2. Methodology

| Indicators | Description | Value | |
|---|---|---|---|
| Soil Texture | L, SCL, SL, LS, CL | 1.0 | |
| SC, SiL, SiCL | 1.2 | ||
| Si, C, SiC | 1.6 | ||
| S | 2.0 | ||
| Parent Material | Shale, schist, basic, ultra-basic, conglomerates, unconsolidated, clays | 1.0 | |
| Marl with natural vegetation | 1.7 | ||
| Limestone, marble, granite, rhyolite, ignibrite, gneiss, siltstone, sandstone, dolomite marl, pyroclastics | 2.0 | ||
| Rocky fragments (%) | >60 | 1.0 | |
| 20–60 | 1.3 | ||
| <20 | 2.0 | ||
| Soil depth (cm) | Deep (>75) | 1.0 | |
| Moderate (30–75) | 2.0 | ||
| Shallow (15–30) | 3.0 | ||
| Very shallow (<15) | 4.0 | ||
| Drainage | Well drained | 1.0 | |
| Imperfectly drained | 1.2 | ||
| Poorly drained | 2.0 | ||
| Slope (%) | <6 | 1.0 | |
| 6–18 | 1.2 | ||
| 18–35 | 1.5 | ||
| >35 | 2.0 | ||
| Rainfall (mm/year) | >650 | 1.0 | |
| 280–650 | 2.0 | ||
| <280 | 4.0 | ||
| Slope aspect (class) | North, NW, NE, plain | 1.0 | |
| South, SW, SE | 2.0 | ||
| Vegetation cover (%) | >40 | 1.0 | |
| 40–10 | 1.8 | ||
| <10 | 2.0 | ||
| Fire risk (class) | Bare soils, bedrocks; almonds, orchards, grapevines, olive groves, irrigated annual crops (maize, tobacco, sunflower), horticulture | 1.0 | |
| Perennial grasslands, pastures, cereals, annual grasslands, deciduous forests, evergreen forests (with Quercus ilex), shrublands, very low vegetated areas | 1.3 | ||
| Mediterranean maquis | 1.6 | ||
| Coniferous forests | 2.0 | ||
| Soil erosion protection | vergreen forest (except conifers), mixed Mediterranean maquis, evergreen forests (with Quercus ilex), bedrocks | 1.0 | |
| Mediterranean mquis, coniferous forests, perennial grasslands, pastures; olive groves, shrubland | 1.3 | ||
| Deciduous forests | 1.6 | ||
| Almonds, orchards | 1.8 | ||
| Grapevines, annual crops (cereals, maize, rice, oats, barley, grasslands), low vegetated areas, bare ground | 2.0 | ||
| Vegetation resistance to drought | Evergreen forest (except conifers), Mediterranean maquis, evergreen forests (with Quercus ilex), bedrocks, bare ground | 1.0 | |
| Coniferous and deciduous forests, olive groves | 1.2 | ||
| Almonds, orchards, grapevines | |||
| Perennial grasslands, pastures, shrubland | 1.7 | ||
| Annual crops (annual grassland, cereals, maize, tobacco, sunflower), low vegetated area | 2.0 | ||
| Land use intensity | Cropland | Low land use intensity (LLUI) | 1.0 |
| Medium land use intensity (MLUI) | 1.5 | ||
| High land use intensity (HLUI) | 2.0 | ||
| Pasture | ASR < SSR | 1.0 | |
| ASR = SSR to 1.5 × SSR) | 1.5 | ||
| A/S ≥ 1 | 2.0 | ||
| Natural areas | A/S = 0 | 1.0 | |
| A/S < 1 | 1.2 | ||
| A/S ≥ 1 | 2.0 | ||
| Mining areas | Adequate erosion control measures | 1.0 | |
| Moderate control against soil erosion | 1.5 | ||
| Poor measures against soil erosion | 2.0 | ||
| Recreational areas | A/P < 1 | 1.0 | |
| 1 < A/P < 2.5 | 1.5 | ||
| A/P > 2.5 | 2.0 | ||
| Policy Enforcement | Complete (>75% of the area under protection) | 1.0 | |
| Partial (25–75% of the area under protection) | 1.5 | ||
| Incomplete (<25% of the area under protection) | 2.0 | ||
| SPI 6 | Wet: ≥1.50 | 0.0 | |
| Quite Wet: 0.00–1.49 | 1.0 | ||
| Quite Dry: 0.00–−1.49 | 2.0 | ||
| Dry: ≤−1.49 | 3.0 | ||
| SPI 12 | Wet: ≥1.50 | 0.0 | |
| Quite Wet: 0.00–1.49 | 1.0 | ||
| Quite Dry: 0.00–−1.49 | 2.0 | ||
| Dry: ≤−1.49 | 3.0 | ||
| Water Supply | No Deficits | 0.0 | |
| 15% Deficits | 1.0 | ||
| 16–50% Deficits | 2.0 | ||
| >50% Serious Deficits | 3.0 | ||
| Water Demand | No Deficits | 0.0 | |
| 15% Deficits | 1.0 | ||
| 16–50% Deficits | 2.0 | ||
| >50% Serious Deficits | 3.0 | ||
| Drought Impacts | None | 0.0 | |
| 15% Losses | 1.0 | ||
| 16–50% Losses | 2.0 | ||
| >50% Losses | 3.0 | ||
| Water Resources Infrastructure | Complete | 0.0 | |
| 15% Deficiency | 1.0 | ||
| 16–50% Deficiency | 2.0 | ||
| >50% Deficiency | 3.0 | ||
3. Results
- Aridity Index,
- Water Demand,
- Drought Impacts,
- Drought Resilience,
- Infrastructure on Water Resources,
- Land use intensity,
- Parent material,
- Plant cover,
- Rainfall,
- Slope, and
- Soil texture.
4. Discussion
- Problems of water management and depletion of aquifers.
- Significant delay in surface water exploitation projects, but also projects for the protection of rivers, streams, and watercourses.
- Negative balance of water resources, with significant problems of degradation of aquifers and inadequate and irrational use of water resources, and by not following the guidelines of Directive 2000/60/EC and existing national legislation.
- Pressures on land use and the environment (mainly spatial).
- Degradation of water and soil from their intensive exploitation and the use of pesticides.
- Shortages in infrastructure, such as sewerage networks, wastewater treatment, solid waste treatment, etc.
5. Conclusions
Author Contributions
Funding
Institutional Review Board Statement
Informed Consent Statement
Data Availability Statement
Conflicts of Interest
References
- Kessler, W.B.; Salwasser, H.; Cartwright, C.W.; Caplan, J.A. New Perspectives for Sustainable Natural Resources Management. Ecol. Appl. 1992, 2, 221–225. [Google Scholar] [CrossRef]
- Alexander, G.G.; Allan, J.D. Ecological Success in Stream Restoration: Case Studies from the Midwestern United States. Environ. Manage. 2007, 40, 245–255. [Google Scholar] [CrossRef]
- Kajanus, M.; Leskinen, P.; Kurttila, M.; Kangas, J. Making Use of MCDS Methods in SWOT Analysis—Lessons Learnt in Strategic Natural Resources Management. For. Policy Econ. 2012, 20, 1–9. [Google Scholar] [CrossRef]
- Kalogeropoulos, K.; Chalkias, C. Modelling the Impacts of Climate Change on Surface Runoff in Small Mediterranean Catchments: Empirical Evidence from Greece: Modelling the Impacts of Climate Change on Surface Runoff. Water Environ. J. 2013, 27, 505–513. [Google Scholar] [CrossRef]
- Stathopoulos, N.; Kalogeropoulos, K.; Polykretis, C.; Skrimizeas, P.; Louka, P.; Karymbalis, E.; Chalkias, C. Introducing Flood Susceptibility Index Using Remote-Sensing Data and Geographic Information Systems: Empirical Analysis in Sperchios River Basin, Greece. In Remote Sensing of Hydrometeorological Hazards; CRC Press: Boca Raton, FL, USA, 2017; pp. 381–400. [Google Scholar]
- Kalogeropoulos, K.; Karalis, S.; Karymbalis, E.; Chalkias, C.; Chalkias, G.; Katsafados, P. Modeling Flash Floods in Vouraikos River Mouth, Greece. In Proceedings of the 10th Global Congress on ICM: Lessons Learned to Address New Challenges, EMECS 2013—MEDCOAST 2013 Joint Conference, Mugla, Turkey, 30 October–3 November 2013; Volume 2, pp. 1135–1146. [Google Scholar]
- Kalogeropoulos, K.; Stathopoulos, N.; Psarogiannis, A.; Pissias, E.; Louka, P.; Petropoulos, G.P.; Chalkias, C. An Integrated GIS-Hydro Modeling Methodology for Surface Runoff Exploitation via Small-Scale Reservoirs. Water 2020, 12, 3182. [Google Scholar] [CrossRef]
- Tsatsaris, A.; Kalogeropoulos, K.; Stathopoulos, N.; Louka, P.; Tsanakas, K.; Tsesmelis, D.E.; Krassanakis, V.; Petropoulos, G.P.; Pappas, V.; Chalkias, C. Geoinformation Technologies in Support of Environmental Hazards Monitoring under Climate Change: An Extensive Review. ISPRS Int. J. Geo-Inf. 2021, 10, 94. [Google Scholar] [CrossRef]
- Ricart, S.; Villar-Navascués, R.A.; Hernández-Hernández, M.; Rico-Amorós, A.M.; Olcina-Cantos, J.; Moltó-Mantero, E. Extending Natural Limits to Address Water Scarcity? The Role of Non-Conventional Water Fluxes in Climate Change Adaptation Capacity: A Review. Sustainability 2021, 13, 2473. [Google Scholar] [CrossRef]
- Zhang, D.; Sial, M.S.; Ahmad, N.; Filipe, A.J.; Thu, P.A.; Zia-Ud-Din, M.; Caleiro, A.B. Water Scarcity and Sustainability in an Emerging Economy: A Management Perspective for Future. Sustainability 2021, 13, 144. [Google Scholar] [CrossRef]
- Tsanakas, K.; Gaki-Papanastassiou, K.; Kalogeropoulos, K.; Chalkias, C.; Katsafados, P.; Karymbalis, E. Investigation of Flash Flood Natural Causes of Xirolaki Torrent, Northern Greece Based on GIS Modeling and Geomorphological Analysis. Nat. Hazards 2016, 84, 1015–1033. [Google Scholar] [CrossRef]
- Kalogeropoulos, K.; Chalkias, C.; Pissias, E.; Karalis, S. Application of the SWAT model for the investigation of reservoirs creation. In Advances in the Research of Aquatic Environment: Volume 2; Environmental Earth Sciences; Lambrakis, N., Stournaras, G., Katsanou, K., Eds.; Springer: Berlin/Heidelberg, Germany, 2011; pp. 71–79. ISBN 978-3-642-24076-8. [Google Scholar]
- Kolimenakis, A.; Solomou, A.D.; Proutsos, N.; Avramidou, E.V.; Korakaki, E.; Karetsos, G.; Maroulis, G.; Papagiannis, E.; Tsagkari, K. The Socioeconomic Welfare of Urban Green Areas and Parks; A Literature Review of Available Evidence. Sustainability 2021, 13, 7863. [Google Scholar] [CrossRef]
- El-Kholy, O. The World Environment 1972–1992: Two Decades of Challenge; Springer Science & Business Media: Heidelberg, Germany, 2012; ISBN 978-94-011-2280-1. [Google Scholar]
- Pahl-Wostl, C.; Hare, M. Processes of Social Learning in Integrated Resources Management. J. Community Appl. Soc. Psychol. 2004, 14, 193–206. [Google Scholar] [CrossRef]
- Karavitis, C.A. Regional Water Transfers and Drought Management Strategies. In Transboundary Water Resources Management; Nato ASI Series; Ganoulis, J., Duckstein, L., Literathy, P., Bogardi, I., Eds.; Springer: Berlin/Heidelberg, Germany, 1996; pp. 451–457. ISBN 978-3-642-64843-4. [Google Scholar]
- Rijsberman, F.R. Water Scarcity: Fact or Fiction? Agric. Water Manag. 2006, 80, 5–22. [Google Scholar] [CrossRef] [Green Version]
- Goudriaan, J.; Unsworth, M.H. Implications of Increasing Carbon Dioxide and Climate Change for Agricultural Productivity and Water Resources. Impact of Carbon Dioxide, Trace Gases, and Climate Change on Global Agriculture. ASA Special Publications. 1990, pp. 111–130. Available online: https://acsess.onlinelibrary.wiley.com/doi/abs/10.2134/asaspecpub53.c8 (accessed on 15 August 2021). [CrossRef] [Green Version]
- Molden, D.; Sakthivadivel, R. Water Accounting to Assess Use and Productivity of Water. Int. J. Water Resour. Dev. 1999, 15, 55–71. [Google Scholar] [CrossRef]
- Biswas, A.K. Integrated Water Resources Management: A Reassessment. Water Int. 2004, 29, 248–256. [Google Scholar] [CrossRef]
- Stålnacke, P.; Gooch, G.D. Integrated Water Resources Management. Irrig. Drain. Syst. 2010, 24, 155–159. [Google Scholar] [CrossRef] [Green Version]
- Karavitis, C.A.; Tsesmelis, D.E.; Skondras, N.A.; Stamatakos, D.; Alexandris, S.; Fassouli, V.; Vasilakou, C.G.; Oikonomou, P.D.; Gregorič, G.; Grigg, N.S.; et al. Linking Drought Characteristics to Impacts on a Spatial and Temporal Scale. Water Policy 2014, 16, 1172–1197. [Google Scholar] [CrossRef]
- Karavitis, C. Drought Management Strategies for Urban Water Supplies: The Case of Metropolitan Athens. Ph.D. Dissertation, Department of Civil Engineering, Colorado State University, Fort Collins, CO, USA, 1992. [Google Scholar]
- Oikonomou, P.D.; Karavitis, C.A.; Tsesmelis, D.E.; Kolokytha, E.; Maia, R. Drought Characteristics Assessment in Europe over the Past 50 Years. Water Resour. Manag. 2020. [Google Scholar] [CrossRef]
- Grigg, N.S.; Vlachos, E.C. Drought Water Management. In Proceedings of the a National Workshop, Washington, DC, USA, 1–2 November 1988. [Google Scholar]
- Karavitis, C.A. Drought and Urban Water Supplies: The Case of Metropolitan Athens. Water Policy 1998, 1, 505–524. [Google Scholar] [CrossRef]
- AghaKouchak, A.; Feldman, D.; Hoerling, M.; Huxman, T.; Lund, J. Water and Climate: Recognize Anthropogenic Drought. Nat. News 2015, 524, 409. [Google Scholar] [CrossRef] [Green Version]
- Ciais, P.; Reichstein, M.; Viovy, N.; Granier, A.; Ogée, J.; Allard, V.; Aubinet, M.; Buchmann, N.; Bernhofer, C.; Carrara, A.; et al. Europe-Wide Reduction in Primary Productivity Caused by the Heat and Drought in 2003. ResearchGate 2005, 437, 529–533. [Google Scholar] [CrossRef]
- Karavitis, C.A. Decision Support Systems for Drought Management Strategies in Metropolitan Athens. Water Int. 1999, 24, 10–21. [Google Scholar] [CrossRef]
- Karavitis, C.A.; Alexandris, S.; Tsesmelis, D.E.; Athanasopoulos, G. Application of the Standardized Precipitation Index (SPI) in Greece. Water 2011, 3, 787–805. [Google Scholar] [CrossRef]
- Karavitis, C.A.; Chortaria, C.; Alexandris, S.; Vasilakou, C.G.; Tsesmelis, D.E. Development of the Standardised Precipitation Index for Greece. Urban Water J. 2012, 9, 401–417. [Google Scholar] [CrossRef]
- Pedro-Monzonís, M.; Ferrer, J.; Solera, A.; Estrela, T.; Paredes-Arquiola, J. Key Issues for Determining the Exploitable Water Resources in a Mediterranean River Basin. Sci. Total Environ. 2015, 503–504, 319–328. [Google Scholar] [CrossRef] [PubMed] [Green Version]
- Pedro-Monzonís, M.; Solera, A.; Ferrer, J.; Estrela, T.; Paredes-Arquiola, J. A Review of Water Scarcity and Drought Indexes in Water Resources Planning and Management. J. Hydrol. 2015, 527, 482–493. [Google Scholar] [CrossRef] [Green Version]
- Cancelliere, A.; Mauro, G.D.; Bonaccorso, B.; Rossi, G. Drought Forecasting Using the Standardized Precipitation Index. Water Resour. Manag. 2007, 21, 801–819. [Google Scholar] [CrossRef]
- Priscoli, J.D. Keynote Address: Clothing the IWRM Emperor by Using Collaborative Modeling for Decision Support. JAWRA J. Am. Water Resour. Assoc. 2013, 49, 609–613. [Google Scholar] [CrossRef]
- Salas, J.D.; Fu, C.; Cancelliere, A.; Dustin, D.; Bode, D.; Pineda, A.; Vincent, E. Characterizing the Severity and Risk of Drought in the Poudre River, Colorado. J. Water Resour. Plan. Manag. 2005, 131, 383–393. [Google Scholar] [CrossRef]
- Tannehill, I.R. Drought,: Its Causes and Effects, 1st ed.; Princeton University Press: Princeton, NJ, USA, 1947. [Google Scholar]
- Yevjevich, V.; da Cunha, L.; Vlachos, E. Coping with Droughts; Water Resources Publications: Littleton, CO, USA, 1983. [Google Scholar]
- Bordi, I.; Fraedrich, K.; Petitta, M.; Sutera, A. Large-Scale Assessment of Drought Variability Based on NCEP/NCAR and ERA-40 Re-Analyses. Water Resour. Manag. 2006, 20, 899–915. [Google Scholar] [CrossRef] [Green Version]
- Eriyagama, N.; Smakhtin, V.; Gamagen, N. IWMI Research Report-133; IWMI. International Water Management Institute: Colombo, Sri Lanka, 2009. [Google Scholar]
- Grigg, N.S. Water Resources Management. In Water Encyclopedia; John Wiley & Sons, Inc.: Hoboken, NJ, USA, 1996; ISBN 978-0-471-47844-7. [Google Scholar]
- Bond, N.R.; Lake, P.S.; Arthington, A.H. The Impacts of Drought on Freshwater Ecosystems: An Australian Perspective. Hydrobiologia 2008, 600, 3–16. [Google Scholar] [CrossRef] [Green Version]
- Tilman, D.; Downing, J.A. Biodiversity and Stability in Grasslands. In Ecosystem Management; Springer: New York, NY, USA, 1996; pp. 3–7. ISBN 978-0-387-94667-2. [Google Scholar]
- Tyree, M.T.; Kolb, K.J.; Rood, S.B.; Patiño, S. Vulnerability to Drought-Induced Cavitation of Riparian Cottonwoods in Alberta: A Possible Factor in the Decline of the Ecosystem? Tree Physiol. 1994, 14, 455–466. [Google Scholar] [CrossRef]
- Konikow, L.F.; Kendy, E. Groundwater Depletion: A Global Problem. Hydrogeol. J. 2005, 13, 317–320. [Google Scholar] [CrossRef]
- Tallaksen, L.M.; van Lanen, H.A. Hydrological Drought: Processes and Estimation Methods for Streamflow and Groundwater; Elsevier: Amsterdam, The Netherlands, 2004; ISBN 978-0-444-51767-8. [Google Scholar]
- Cushman, R.M. Review of Ecological Effects of Rapidly Varying Flows Downstream from Hydroelectric Facilities. N. Am. J. Fish. Manag. 1985, 5, 330–339. [Google Scholar] [CrossRef]
- Soulis, K.X.; Manolakos, D.; Anagnostopoulos, J.; Papantonis, D. Development of a Geo-Information System Embedding a Spatially Distributed Hydrological Model for the Preliminary Assessment of the Hydropower Potential of Historical Hydro Sites in Poorly Gauged Areas. Renew. Energy 2016, 92, 222–232. [Google Scholar] [CrossRef]
- Stone, R. Severe Drought Puts Spotlight on Chinese Dams. Science 2010, 327, 1311. [Google Scholar] [CrossRef] [PubMed]
- Fassouli, V.P.; Karavitis, C.A.; Tsesmelis, D.E.; Alexandris, S.G. Factual Drought Index (FDI): A Composite Index Based on Precipitation and Evapotranspiration. Hydrol. Sci. J. 2021. [Google Scholar] [CrossRef]
- Freeze, R.A.; Witherspoon, P.A. Theoretical Analysis of Regional Groundwater Flow: 2. Effect of Water-Table Configuration and Subsurface Permeability Variation. Water Resour. Res. 1967, 3, 623–634. [Google Scholar] [CrossRef]
- Gamvroula, D.; Alexakis, D.; Stamatis, G. Diagnosis of Groundwater Quality and Assessment of Contamination Sources in the Megara Basin (Attica, Greece). Arab. J. Geosci. 2013, 6, 2367–2381. [Google Scholar] [CrossRef]
- Giordano, M. Global Groundwater? Issues and Solutions. Annu. Rev. Environ. Resour. 2009, 34, 153–178. [Google Scholar] [CrossRef]
- Petalas, C.P.; Diamantis, I.B. Origin and Distribution of Saline Groundwaters in the Upper Miocene Aquifer System, Coastal Rhodope Area, Northeastern Greece. Hydrogeol. J. 1999, 7, 305–316. [Google Scholar] [CrossRef]
- Karavitis, C.A.; Alexandris, S.; Oikonomou, P.D.; Tsesmelis, D.E.; Fassouli, V.; Chortaria, C.; Kerkides, P.; Kosmas, C. Technical Support of the Central Water Resources Agency for the Preparation of Drought Management Strategies and Short Term Drought Response Plan in Greece; Agricultural University of Athens: Athens, Greece, 2008. [Google Scholar]
- Stathopoulos, N.; Skrimizeas, P.; Kalogeropoulos, K.; Louka, P.; Tragaki, A. Statistical Analysis and Spatial Correlation of Rainfall in Greece for a 20-Year Time Period. In Proceedings of the EasyChair Preprints; EasyChair: Manchester, UK, 2018. [Google Scholar] [CrossRef]
- Hellenic National Meteorological Service. Available online: http://www.hnms.gr/emy/en/ (accessed on 18 November 2018).
- National Observatory of Athens. Available online: http://www.noa.gr/index.php?option=com_content&view=article&id=160:to-e-a-a-78&catid=21:2013-02-15-09-21-41&Itemid=173&lang=el (accessed on 18 November 2018).
- YPEKA. Water Resources Management Plans of the River Basins of Greece. 2021. Available online: http://wfdver.ypeka.gr/en/management-plans-en/approved-management-plans-en/ (accessed on 15 August 2021).
- Kosmas, C.; Kirkby, M.; Geeson, N. Manual on Key Indicators of Desertification and Mapping Environmentally Sensitive Areas to Desertification. European Commission, 1999. Available online: http://www.comap.ca/kmland/display.php?ID=253&DISPOP=VRCPR (accessed on 15 August 2021).
- Ferrara, A.; Salvati, L.; Sateriano, A.; Nolè, A. Performance Evaluation and Cost Assessment of a Key Indicator System to Monitor Desertification Vulnerability. Ecol. Indic. 2012, 23, 123–129. [Google Scholar] [CrossRef]
- Tsesmelis, D.E.; Oikonomou, P.D.; Vasilakou, C.G.; Skondras, N.A.; Fassouli, V.; Alexandris, S.G.; Grigg, N.S.; Karavitis, C.A. Assessing Structural Uncertainty Caused by Different Weighting Methods on the Standardized Drought Vulnerability Index (SDVI). Stoch. Environ. Res. Risk Assess. 2019, 33, 515–533. [Google Scholar] [CrossRef]
- Oikonomou, P.D.; Tsesmelis, D.E.; Waskom, R.M.; Grigg, N.S.; Karavitis, C.A. Enhancing the Standardized Drought Vulnerability Index by Integrating Spatiotemporal Information from Satellite and In Situ Data. J. Hydrol. 2019, 569, 265–277. [Google Scholar] [CrossRef]
- DMCSEE. Summary of the Result of the DMCSEE Project, Co-Financed by the South East Europe Transnational Cooperation Programme; Drought Management Centre for South-East Europe—DMCSEE: Slovenia, 2012; Available online: https://www.met.hu/doc/DMCSEE/DMCSEE_final_publication.pdf (accessed on 15 August 2021).
- Hair, J. Multivariate Data Analysis; Prentice Hall: Upper Saddle River, NJ, USA, 2009. [Google Scholar]
- Abdi, H.; Valentin, D. Multiple Correspondence Analysis. Encycl. Meas. Stat. 2007, 2, 651–657. [Google Scholar]
- Kaiser, H.F. The Application of Electronic Computers to Factor Analysis. Educ. Psychol. Meas. 1960, 20, 141–151. [Google Scholar] [CrossRef]
- Tu, B.; Zhang, Z.; Wang, S.; Qian, H. Making Fisher Discriminant Analysis Scalable. In Proceedings of the 31st international Conference on Machine Learning, Beijing, China, 21–26 January 2014; pp. 964–972. [Google Scholar]
- Kosmas, C.S.; Danalatos, N.G. Climate Change, Desertification and the Mediterranean Region. In Soil Responses to Climate Change; Rounsevell, M.D.A., Loveland, P.J., Eds.; Springer: Berlin/Heidelberg, Germany, 1994; pp. 25–38. ISBN 978-3-642-79220-5. [Google Scholar]
- Kosmas, C.S.; Danalatos, N.G.; Moustakas, N.; Tsatiris, B.; Kallianou, C.; Yassoglou, N. The Impacts of Parent Material and Landscape Position on Drought and Biomass Production of Wheat under Semi-Arid Conditions. Soil Technol. 1993, 6, 337–349. [Google Scholar] [CrossRef]
- Kosmas, C.; Tsara, M.; Moustakas, N.; Kosma, D.; Yassoglou, N. Environmentally Sensitive Areas and Indicators Of Desertification. In Desertification in the Mediterranean Region. A Security Issue; Kepner, W.G., Rubio, J.L., Mouat, D.A., Pedrazzini, F., Eds.; Kluwer Academic Publishers: Dordrecht, The Netherlands, 2006; Volume 3, pp. 525–547. ISBN 978-1-4020-3758-0. [Google Scholar]
- Kosmas, C.; Tsara, M.; Moustakas, N.; Karavitis, C. Identification of Indicators for Desertification. Ann. Arid Zone 2003, 42, 393–416. [Google Scholar]
- Kosmas, C.; Danalatos, N.G.; Gerontidis, S. The Effect of Land Parameters on Vegetation Performance and Degree of Erosion under Mediterranean Conditions. CATENA 2000, 40, 3–17. [Google Scholar] [CrossRef]
- Tsesmelis, D.E. Development, implementation and evaluation of drought and desertification risk indicators for the Integrated Management of Water Resources. Ph.D. Dissertation, Department of Natural Resources Management & Agricultural Engineering, Agricultural University of Athens, Athens, Greece, February 2017. [Google Scholar]
- Skondras, N. Decision Making in Water Resources Management: Development of a Composite Indicator for the Assessment of the Social-Environmental Systems in Terms Resilience and Vulnerability to Water Scarcity and Water Stress. Ph.D. Dissertation, Department of Natural Resources Management and Agricultural Engineering, Agricultural University of Athens, Athens, Greece, 2015. [Google Scholar]
- Skondras, N.A.; Karavitis, C.A.; Gkotsis, I.I.; Scott, P.J.B.; Kaly, U.L.; Alexandris, S.G. Application and Assessment of the Environmental Vulnerability Index in Greece. Ecol. Indic. 2011, 11, 1699–1706. [Google Scholar] [CrossRef]
- Tsesmelis, D.E.; Skondras, N.A.; Khan, S.Y.A.; Kolokytha, E.; Karavitis, C.A. Water, Sanitation and Hygiene (WASH) Index: Development and Application to Measure WASH Service Levels in European Humanitarian Camps. Water Resour. Manag. 2020, 34, 2449–2470. [Google Scholar] [CrossRef]


| Aridity Index | Water Demand | Vegetation Drought Resilience | Drought Impacts | Land Use Intensity | Plant Cover | Rainfall | Soil Texture | Infrastructure on Water Resources | Parent Material | Slope | |
|---|---|---|---|---|---|---|---|---|---|---|---|
| Aridity Index | 1 | −0.022 | −0.016 | −0.024 | −0.026 | 0.005 | 0.36 | 0.015 | 0.013 | 0.03 | −0.06 |
| Water Demand | −0.022 | 1 | −0.048 | 0.216 | −0.002 | 0.026 | −0.079 | −0.04 | −0.113 | −0.039 | 0.086 |
| Vegetation Drought Resilience | −0.016 | −0.048 | 1 | −0.067 | 0.204 | 0.117 | 0.077 | −0.003 | 0.221 | 0.024 | −0.054 |
| Drought Impacts | −0.024 | 0.216 | −0.067 | 1 | −0.008 | 0.028 | −0.085 | −0.036 | −0.137 | −0.078 | 0.1 |
| Land use intensity | −0.026 | −0.002 | 0.204 | −0.008 | 1 | 0.51 | −0.04 | −0.022 | −0.001 | −0.014 | 0.005 |
| Plant cover | 0.005 | 0.026 | 0.117 | 0.028 | 0.51 | 1 | −0.045 | −0.019 | −0.028 | −0.007 | 0.019 |
| Rainfall | 0.36 | −0.079 | 0.077 | −0.085 | −0.04 | −0.045 | 1 | 0.02 | 0.05 | 0.01 | −0.076 |
| Soil texture | 0.015 | −0.04 | −0.003 | −0.036 | −0.022 | −0.019 | 0.02 | 1 | 0.007 | −0.039 | −0.008 |
| Infrastructure on Water Resources, | 0.013 | −0.113 | 0.221 | −0.137 | −0.001 | −0.028 | 0.05 | 0.007 | 1 | 0.062 | −0.001 |
| Parent material | 0.03 | −0.039 | 0.024 | −0.078 | −0.014 | −0.007 | 0.01 | −0.039 | 0.062 | 1 | −0.04 |
| Slope | −0.06 | 0.086 | −0.054 | 0.1 | 0.005 | 0.019 | −0.076 | −0.008 | −0.001 | −0.04 | 1 |
| Indicators | Weights |
|---|---|
| Aridity Index | 18.2 |
| Drought Resilience | 6.8 |
| Rainfall | 7.6 |
| Land Use Intensity | 8.0 |
| Drought Impacts | 7.2 |
| Water Demand | 11.0 |
| Slope | 9.4 |
| Parent Material | 7.7 |
| Soil Texture | 4.1 |
| Infrastructure on Water Resources | 9.4 |
| Plant Cover | 10.6 |
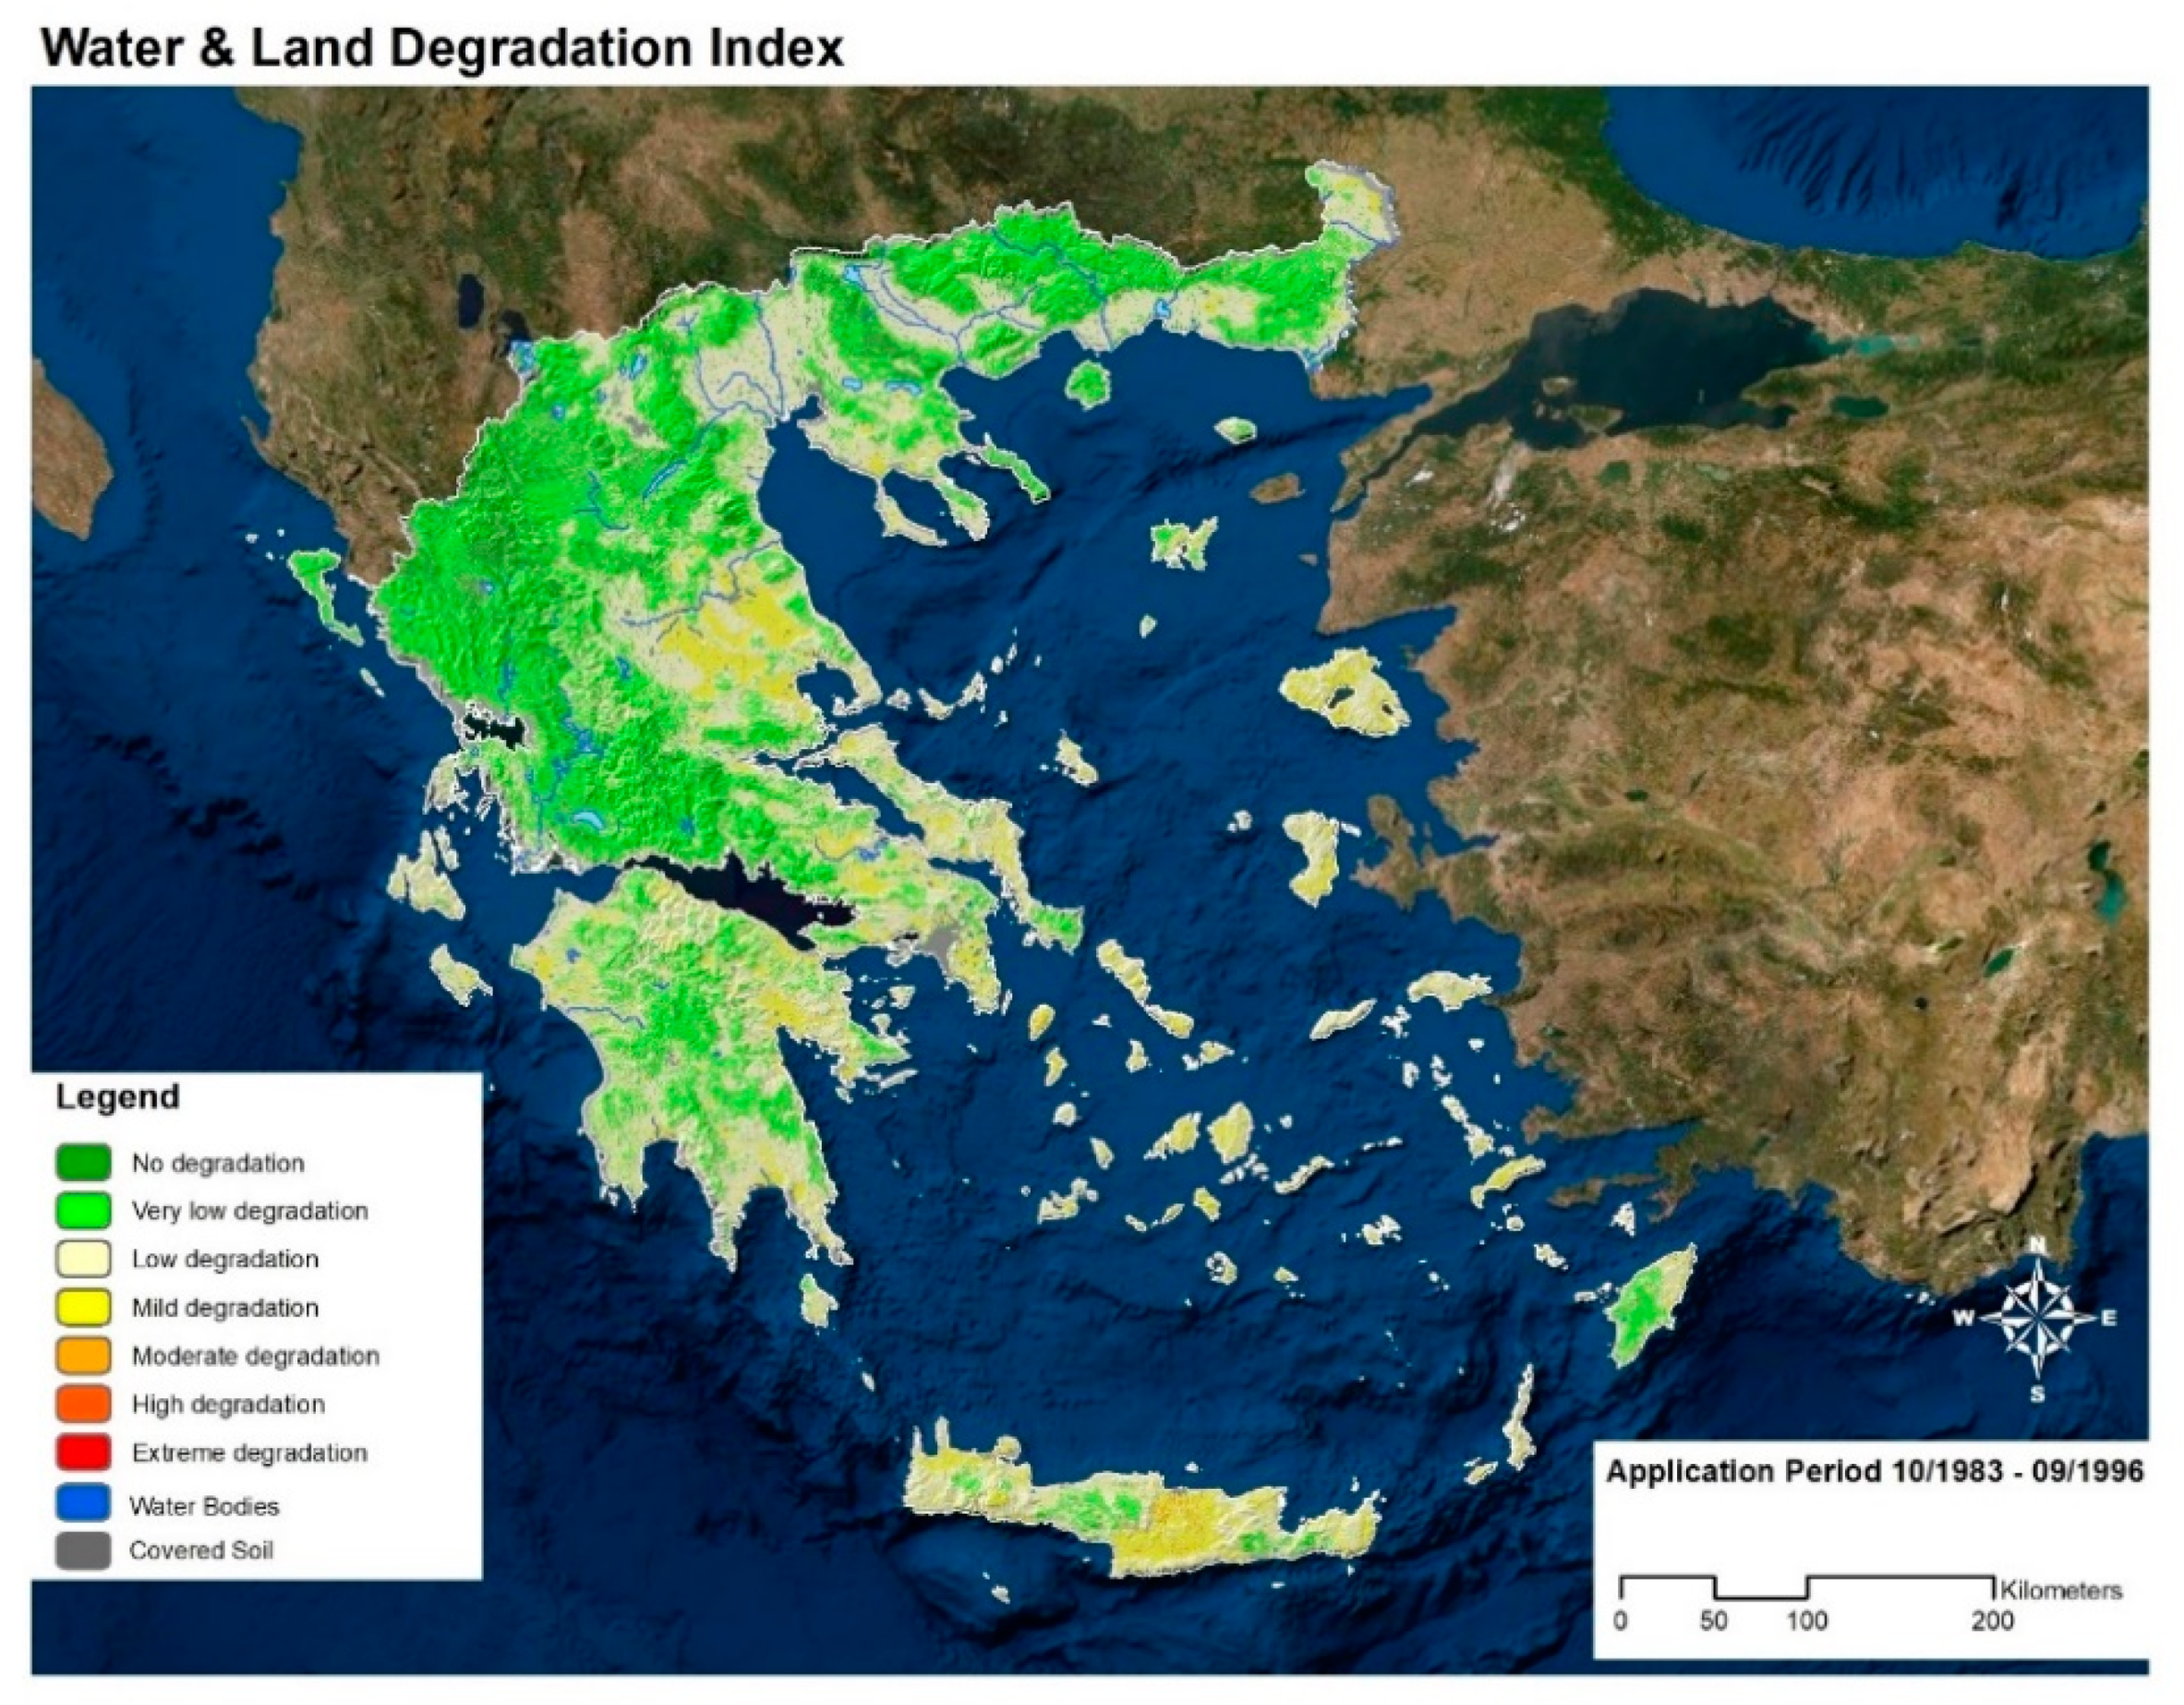
| Classes | Values | Description |
|---|---|---|
| 1 | <94 | No degradation |
| 2 | 94–118 | Very Low Degradation |
| 3 | 118–142 | Low Degradation |
| 4 | 142–167 | Mild Degradation |
| 5 | 167–191 | Moderate Degradation |
| 6 | 191–215 | High Degradation |
| 7 | >215 | Extreme Degradation |
| Descriptive Statistics | WLDI |
|---|---|
| Mean | 118.78 |
| Median | 117.75 |
| Std deviation | 17.943 |
| Range | 121.8 |
| Min | 59.7 |
| Max | 181.5 |
Publisher’s Note: MDPI stays neutral with regard to jurisdictional claims in published maps and institutional affiliations. |
© 2021 by the authors. Licensee MDPI, Basel, Switzerland. This article is an open access article distributed under the terms and conditions of the Creative Commons Attribution (CC BY) license (https://creativecommons.org/licenses/by/4.0/).
Share and Cite
Tsesmelis, D.E.; Karavitis, C.A.; Kalogeropoulos, K.; Tsatsaris, A.; Zervas, E.; Vasilakou, C.G.; Stathopoulos, N.; Skondras, N.A.; Alexandris, S.G.; Chalkias, C.; et al. Development and Application of Water and Land Resources Degradation Index (WLDI). Earth 2021, 2, 515-531. https://doi.org/10.3390/earth2030030
Tsesmelis DE, Karavitis CA, Kalogeropoulos K, Tsatsaris A, Zervas E, Vasilakou CG, Stathopoulos N, Skondras NA, Alexandris SG, Chalkias C, et al. Development and Application of Water and Land Resources Degradation Index (WLDI). Earth. 2021; 2(3):515-531. https://doi.org/10.3390/earth2030030
Chicago/Turabian StyleTsesmelis, Demetrios E., Christos A. Karavitis, Kleomenis Kalogeropoulos, Andreas Tsatsaris, Efthimios Zervas, Constantina G. Vasilakou, Nikolaos Stathopoulos, Nikolaos A. Skondras, Stavros G. Alexandris, Christos Chalkias, and et al. 2021. "Development and Application of Water and Land Resources Degradation Index (WLDI)" Earth 2, no. 3: 515-531. https://doi.org/10.3390/earth2030030