1. Introduction
The transportation sector accounts for the emission of greenhouse gases responsible for global warming due to the use of fossil fuels. The increasing use of electric vehicles (EVs) reduces the emission of carbon dioxide when the electricity comes from clean and renewable energy sources [
1,
2,
3,
4]. The sale of EVs increased by 43% globally and 137% in the European Union in 2020 [
5]. During December 2020, almost half of the new passenger cars registered in Sweden were fully electric or plug-in hybrid [
6]. The increase in the share of electric vehicles will increase EV charging in distribution networks.
This increase will result in an expected increase in energy and peak power consumption [
2,
7]. The former is a challenge for the power generation side, while the latter is a challenge for the power distribution side. The increase in peak power consumption and other changes in consumption patterns will depend strongly on the charging pattern, which remains one of the unknowns [
1,
8]. The largest impact on the power consumption will occur when there is simultaneous charging of multiple EVs.
An alternative approach, independent of the actual charging pattern, is to estimate how much charging is possible as a function of days, weeks, and years. This amount of charging is referred to as the hosting capacity (HC). The hosting capacity is generally defined as the amount of new power consumption or generation that does not risk other customers’ reliability or power quality [
9,
10,
11]. This paper applies the hosting capacity approach to new power consumption, specifically simultaneous EV charging in distribution networks.
EV charging can be single-phase or three-phase. Larger penetration of EV charging can affect the distribution networks in different ways [
12,
13]. An increase in power demand beyond the thermal capacity of cables, lines, or transformers will cause an overload [
2,
14], which can result in accelerated ageing, component failure, or customers’ supply fuse to blow. Other impacts caused by single-phase or three-phase chargers include harmonics, voltage unbalance, undervoltage, flicker or fast voltage fluctuations, and overvoltage in rare cases of single-phase chargers [
2,
13,
14].
There are similarities concerning grid impact between EV charging and solar photovoltaic (PV) units. Both solar PV and EV charging were not initially planned by the distribution network operators (DSOs). Designing distribution grids that can cope with large amounts of solar PV and EV charging is technically possible, but such grids will be significantly more expensive than existing grids. Both solar PV and EV charging show fast and largely unpredictable growth, especially at a local level. The rapid growth and uncertainty result in several challenges to DSOs [
12,
13,
14,
15]. There is a need to determine the ability of the distribution network to cope with further growth [
12,
15], in this case growth in consumption due to EV charging. All impacts caused by EV charging on the distribution network should be considered to estimate the hosting capacity [
15].
EVs can be charged at the home (residential charging), workplace, or public charging stations [
16,
17]. The charging behaviour will be a determining factor for the impact of EV charging on the distribution grid. The most common time of charging for residential customers is before work, around 8 am, and typically around 6 pm after arriving home from work [
18]. This increased charging of EVs at home will impact the distribution network [
19].
The uncertainties in EV charging have been addressed in hosting capacity studies by using a stochastic or time-series method. A Monte Carlo based simulation for EV charging assessment is proposed because of the stochastic elements it contains [
20]. A Monte Carlo based stochastic approach was used for solar PV hosting capacity estimation in [
21]. The method proposed and used in [
21] is adapted for EV charging in this paper. The resulting approach is applied to obtain the hosting capacity for EV charging of a number of existing low-voltage networks in Sweden. The contributions and innovations of the study presented in this paper are as follows:
A stochastic method is proposed for estimating the hosting capacity of the distribution grid for EV charging.
The development of models to quantify the uncertainties associated with hosting capacity estimation for EV charging.
The proposed method is non-specific and is applicable for estimating the EV charge hosting capacity for any time of the day, week, and year. None or only limited information of the charging pattern is needed to estimate the hosting capacity.
The planning risk taken is one of the inputs to the method. This allows the method to be used in the trade-off between the risk of insufficient investment and the risk of overinvestment (stranded assets).
Application of the method to a number of existing distribution networks.
The paper is divided into six sections.
Section 1 introduces the paper, and
Section 2 presents the state of the art in stochastic hosting capacity estimations.
Section 3 presents the adaptation of the PV-HC stochastic method for EV charging estimation.
Section 4 presents the results, and their discussion is given in
Section 5. Finally, the conclusion is presented in
Section 6.
2. Review on EV Stochastic Hosting Capacity
The hosting capacity estimation for EV can be performed using a deterministic, stochastic, or time-series method [
19]. Simple deterministic methods can be used to assess the impact of either mean or maximum power consumption [
14]. In addition, stochastic and time-series models can be used to include some of the uncertainties associated with EV charging and its grid impact [
3,
14,
19].
Several EV charge hosting capacity methods using stochastic methods have been proposed, including some of the uncertainties [
3,
7,
10,
12,
16,
17,
19,
20,
21,
22]. There are two types of uncertainties, aleatory, and epistemic uncertainties [
22]. Being aware of the difference between these is important; A detailed description of these two types of uncertainties and their application to solar PV hosting capacity is given in [
21].
A study was undertaken to quantify power quality problems due to EV charging in [
3]. A 3.7 kW EV was used with a Gaussian model for the harmonic currents. In [
14], a method was implemented using survey and measurement data. The voltage and congestion indicators were applied for the charging cycle, mostly occurring between 6 pm and 10 pm. The hosting capacity for EVs was evaluated by considering the random distribution of EVs among households in [
23]. Single-phase charging power of 3.7 kW and 7.4 kW was used for the study. Experimental results were applied in [
19] with smart charging aspects, considering phenomena including undervoltage. The stochastic analysis is recommended to correctly quantify the likelihood and severity of EV charging in distribution networks [
19]. The approach in [
24,
25] quantifies the risk of overloading by modelling the EV and customer loading with Poisson and Gaussian models. The presence of solar PV was considered in that study as well. In [
9], combined EV charging and solar PV is considered with smart charging. It was shown that there is a small positive correlation between EV charging and production from solar PV. A stochastic model for EV charging was developed in [
26]. In [
27], a kernel distribution is applied to destination surveys. It was shown that the charging location was the most critical variable and that EV hosting capacity is very much restricted by the minimum voltage [
27]. Charging time was modelled with a uniform distribution and occurring between 6 pm and 9 pm in [
27]. None of the above-mentioned publications identifies the aleatory and epistemic uncertainties. Characterisation of the probability distribution function from measurements was also not addressed in any of the previous studies. Moreover, none of the studies develop a stochastic approach for EV charge hosting capacity from a successful approach for solar PV. These gaps motivated the approach to estimating EV charge hosting capacity presented in this paper.
Brief Description of Aleatory and Epistemic Uncertainties
The aleatory uncertainties emerge from the variables’ natural randomness and built-in variability. Information on aleatory uncertainties can be obtained by statistical analysis of measurement data. The uncertainty of the variables can be characterised by means of probabilities or a probability distribution function [
21,
28]. Those can in turn be used as input in stochastic studies where aleatory uncertainties affect the outcome.
The epistemic uncertainties emerge from the lack of knowledge or information on a variable. The modelling of the variable is performed with either interval analysis or possibilistic and evidence theory. Gathering more information or built-up knowledge on the variable can reduce the variability [
28]. Obtaining the data for the epistemic uncertainty may take a long time and obtaining statistical information from measurements is often not possible.
The application of the two types of uncertainties begins with recognizing them and their influence. By distinguishing between the aleatory from the epistemic, appropriate models can be developed and used for the stochastic hosting capacity approach.
In the context of EV charging, aleatory uncertainties are the voltage and consumption before the connection of EV charging. Examples of epistemic uncertainties are the number of customers that will charge their car simultaneously, their charging power, and the phase to which the charger is connected.
3. Stochastic EV Charge Hosting Capacity Approach
The hosting capacity method used in this paper is adapted from the stochastic approach developed and applied in [
21]. In [
21], the approach was used to estimate the hosting capacity of distribution networks for solar PV. The stochastic model used to estimate the hosting capacity in [
18] used a probability distribution of the highest voltage during the hours of the day and year with high production from solar PV. This paper’s approach instead uses a probability distribution of the lowest voltage resulting during those hours that EV charging is most likely to occur.
In [
21], the method evaluated the combination of epistemic and aleatory uncertainties during the time-of-day (ToD) from 10 am to 2 pm and the time-of-year (ToY) with the highest solar PV power production. The obtained voltage rise leading to an overvoltage was due to solar power production during the sunny hours of the day and the year. EV charging can take place at any time of the day, week, or year. Contrary to solar PV, there is no defined ToD and ToY with EV charging. The approach developed for solar PV in [
21] contributes to the probability distribution of a voltage rise compared to the “highest background voltage”. The “background voltage” is the voltage with the customer in a low-voltage distribution network for zero local consumption and zero local production [
29,
30]. The background voltage used in the stochastic hosting capacity method for solar PV is the highest background that can be expected during the sunny hours of the day and year. The method adapted and applied to EVs causes a decrease compared to the lowest background voltage. When applied to EV charge hosting capacity, the ‘background voltage’ to be used in the stochastic hosting capacity method is the lowest value during the time of highest consumption, and when EV charging is expected to take place [
31].
Both methods, the one in this paper and [
20], include uncertainties in estimating the hosting capacity. Both epistemic and aleatory uncertainties associated with EV charging are considered. The probability distribution of the worst-case voltage due to a magnitude drop resulting from single-phase or three-phase EV charging is obtained.
3.1. Overall Stochastic Approach
The approach applied in this paper, treating aleatory and epistemic uncertainties differently as in [
21], is used to obtain the worst-case undervoltage values as a probability distribution function (pdf). The worst-case undervoltage values are the minimum values of the voltage calculations described in
Section 3.2.
The fundamental assumption for the aleatory uncertainties entails that the probability distribution functions (pdf) must be considered when there is high EV charging. High charging occurs when many customers with EVs are charging. The likelihood of an undervoltage occurring is highest for a combination of low background voltage and high consumption.
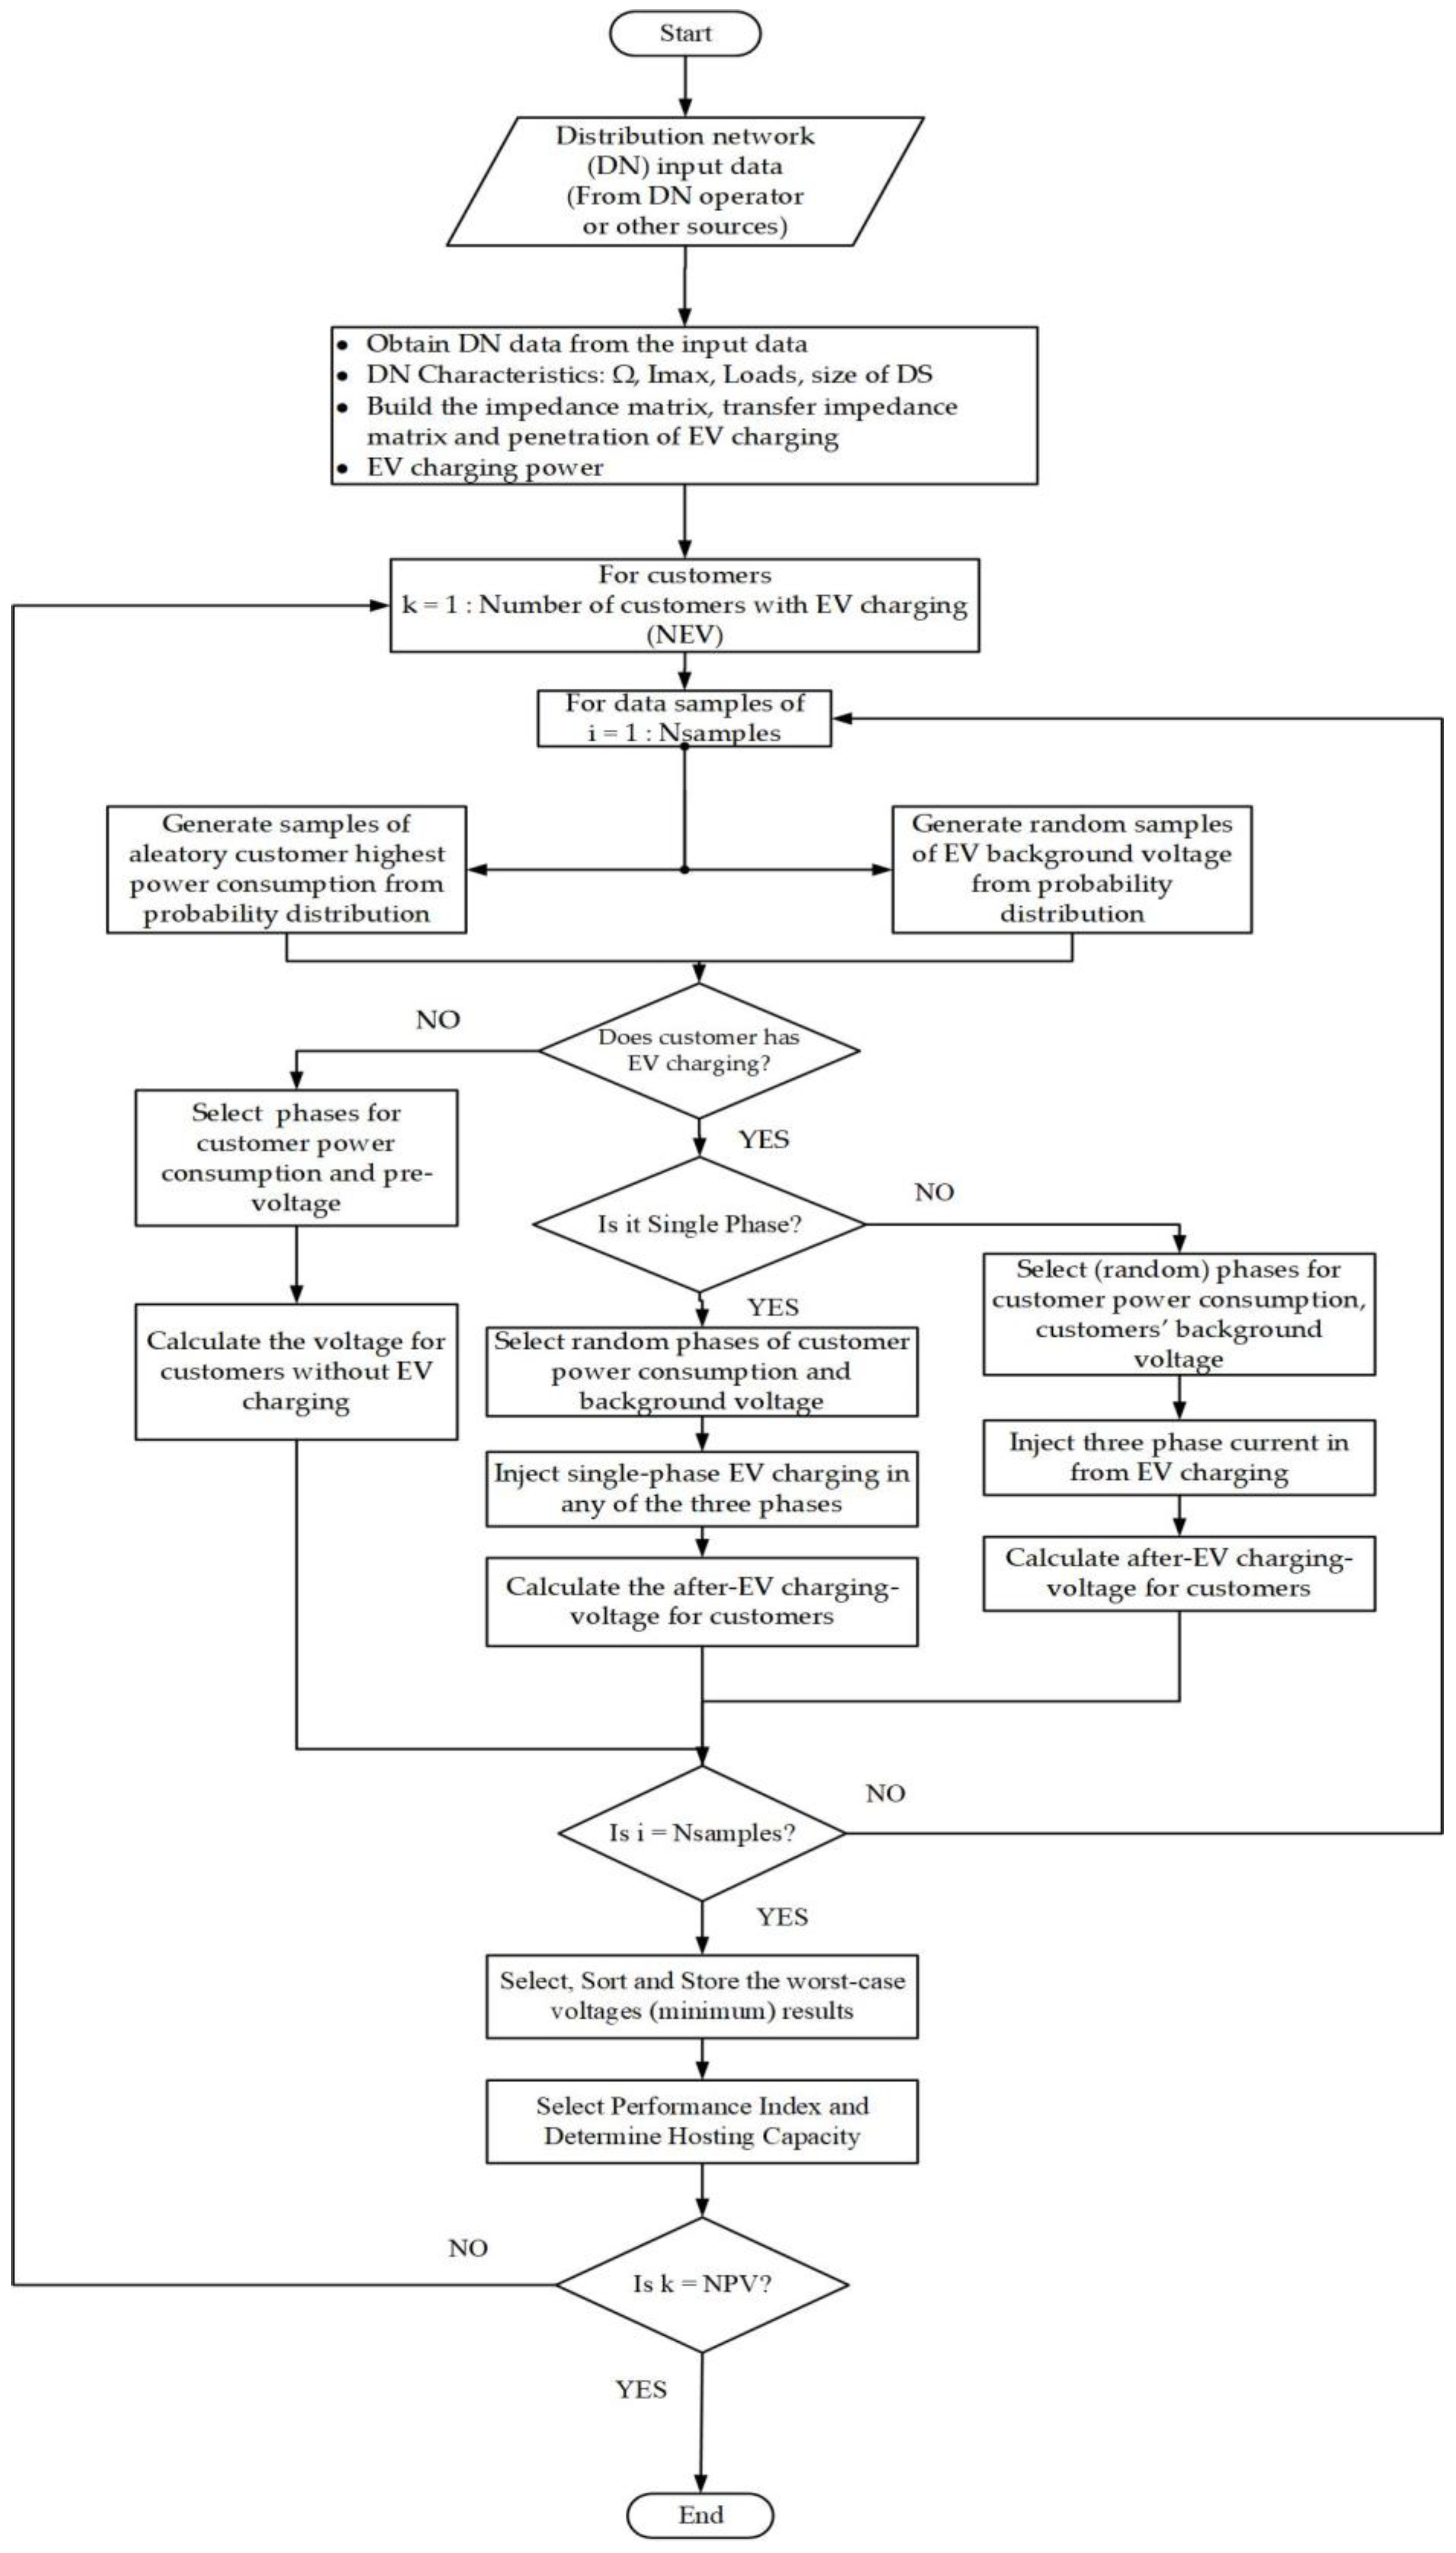
The severe impact of epistemic uncertainties on the hosting capacity is underlined by how many customers will purchase EVs, their charging location, and their charging pattern. None of these is known beforehand. The possible locations and interval range of EV charging for customers are evaluated in this paper. The overall approach is summarised in the flow chart shown in
Figure 1.
3.2. Lowest Background Voltage and Undervoltage
The voltage magnitude in three-phase low-voltage networks with a contribution of solar PV was given in [
21]. The customers’ lowest consumption and solar PV injection were used in [
21] to obtain the voltage rise. Using the equations in [
21], Equation (1) is formulated to estimate the voltage at location a due to a customer power consumption and EV charging at location b [
21].
where
is the lowest background voltage,
is the transfer impedance,
is the current at the customer during the highest consumption, and
is the current due to
EV charging.
In Equation (1), the highest customer consumption and
EV charging power are added. It is also important to determine the lowest voltage occurring at the customer. In a distribution network with multiple customers, simultaneous
EV charging at more than one location is possible. All the contributions of
EV charging are superimposed, resulting in Equation (2).
Equation (2) is used in this study to obtain the probability distribution of the lowest voltage due to EV charging. The obtained voltage, applying Equation (2) which is an extension of Equation (1), is the worst-case undervoltage distribution for the customers.
3.3. Uncertainties
In this paper, the adapted stochastic approach similar to [
21] considers both aleatory and epistemic uncertainties.
The aleatory uncertainties considered are the background voltage and highest customer power consumption. They are modelled with their probability distribution functions (pdf). The difference with those applied in [
21] is what matters most and how they are obtained. The background voltage obtained is the distribution of the lowest value during the time of highest consumption. The distribution of such values is characterised and a goodness-fit-applied to obtain the pdf, in a similar way as in [
26].
The epistemic uncertainties considered are phase-type and connection (single-phase or three-phase), EV charger size, customer location with EV charging, and the number of customers charging simultaneously. Models are applied to estimate future occurrences. The data needed are obtained based on the possibilities, interval, or evidence of the occurrence. The possible future cases, possibilities, and interval ranges that can occur are applied in the stochastic approach.
3.4. EV Charging Power Size
The hosting capacity is first estimated for the charging power of 3.7 kW single-phase and 11 kW three-phase, corresponding to a 16-A fuse. The 3.7 kW and 11 kW are mentioned in [
32] as the most popular charging power sizes and are also used in [
9,
32].
Other single-phase charging power sizes of 4.6, 5.75, 8, and 9.2 kW have been studied. The three-phase charging power sizes of 13.8, 17.3, 24.2, and 27.6 kW are applied too. The two sets of single-phase and three-phase charging power sizes correspond to 20, 25, 35, and 40-A fuse.
3.5. Study Distribution Networks
Two illustrative distribution networks have been used in this paper, with 6 and 83 customers. A 100 kVA, 10/0.4 kV, and Dyn11 (vector group) transformer with a 4% impedance supplies power to the 6-customer network [
33]. The 83 customers are supplied by a 500 kVA, 10/0.4 kV, Dyn11 transformer with a 4.9% impedance [
21].
The customers in both distribution networks are supplied with three-phase cables, including the 10-mm2 service cable between the last cable cabinet and the customer. The service cable can supply 13 kW single-phase and 38 kW three-phase power.
3.6. Applied Highest Consumption and Lowest Background Voltage
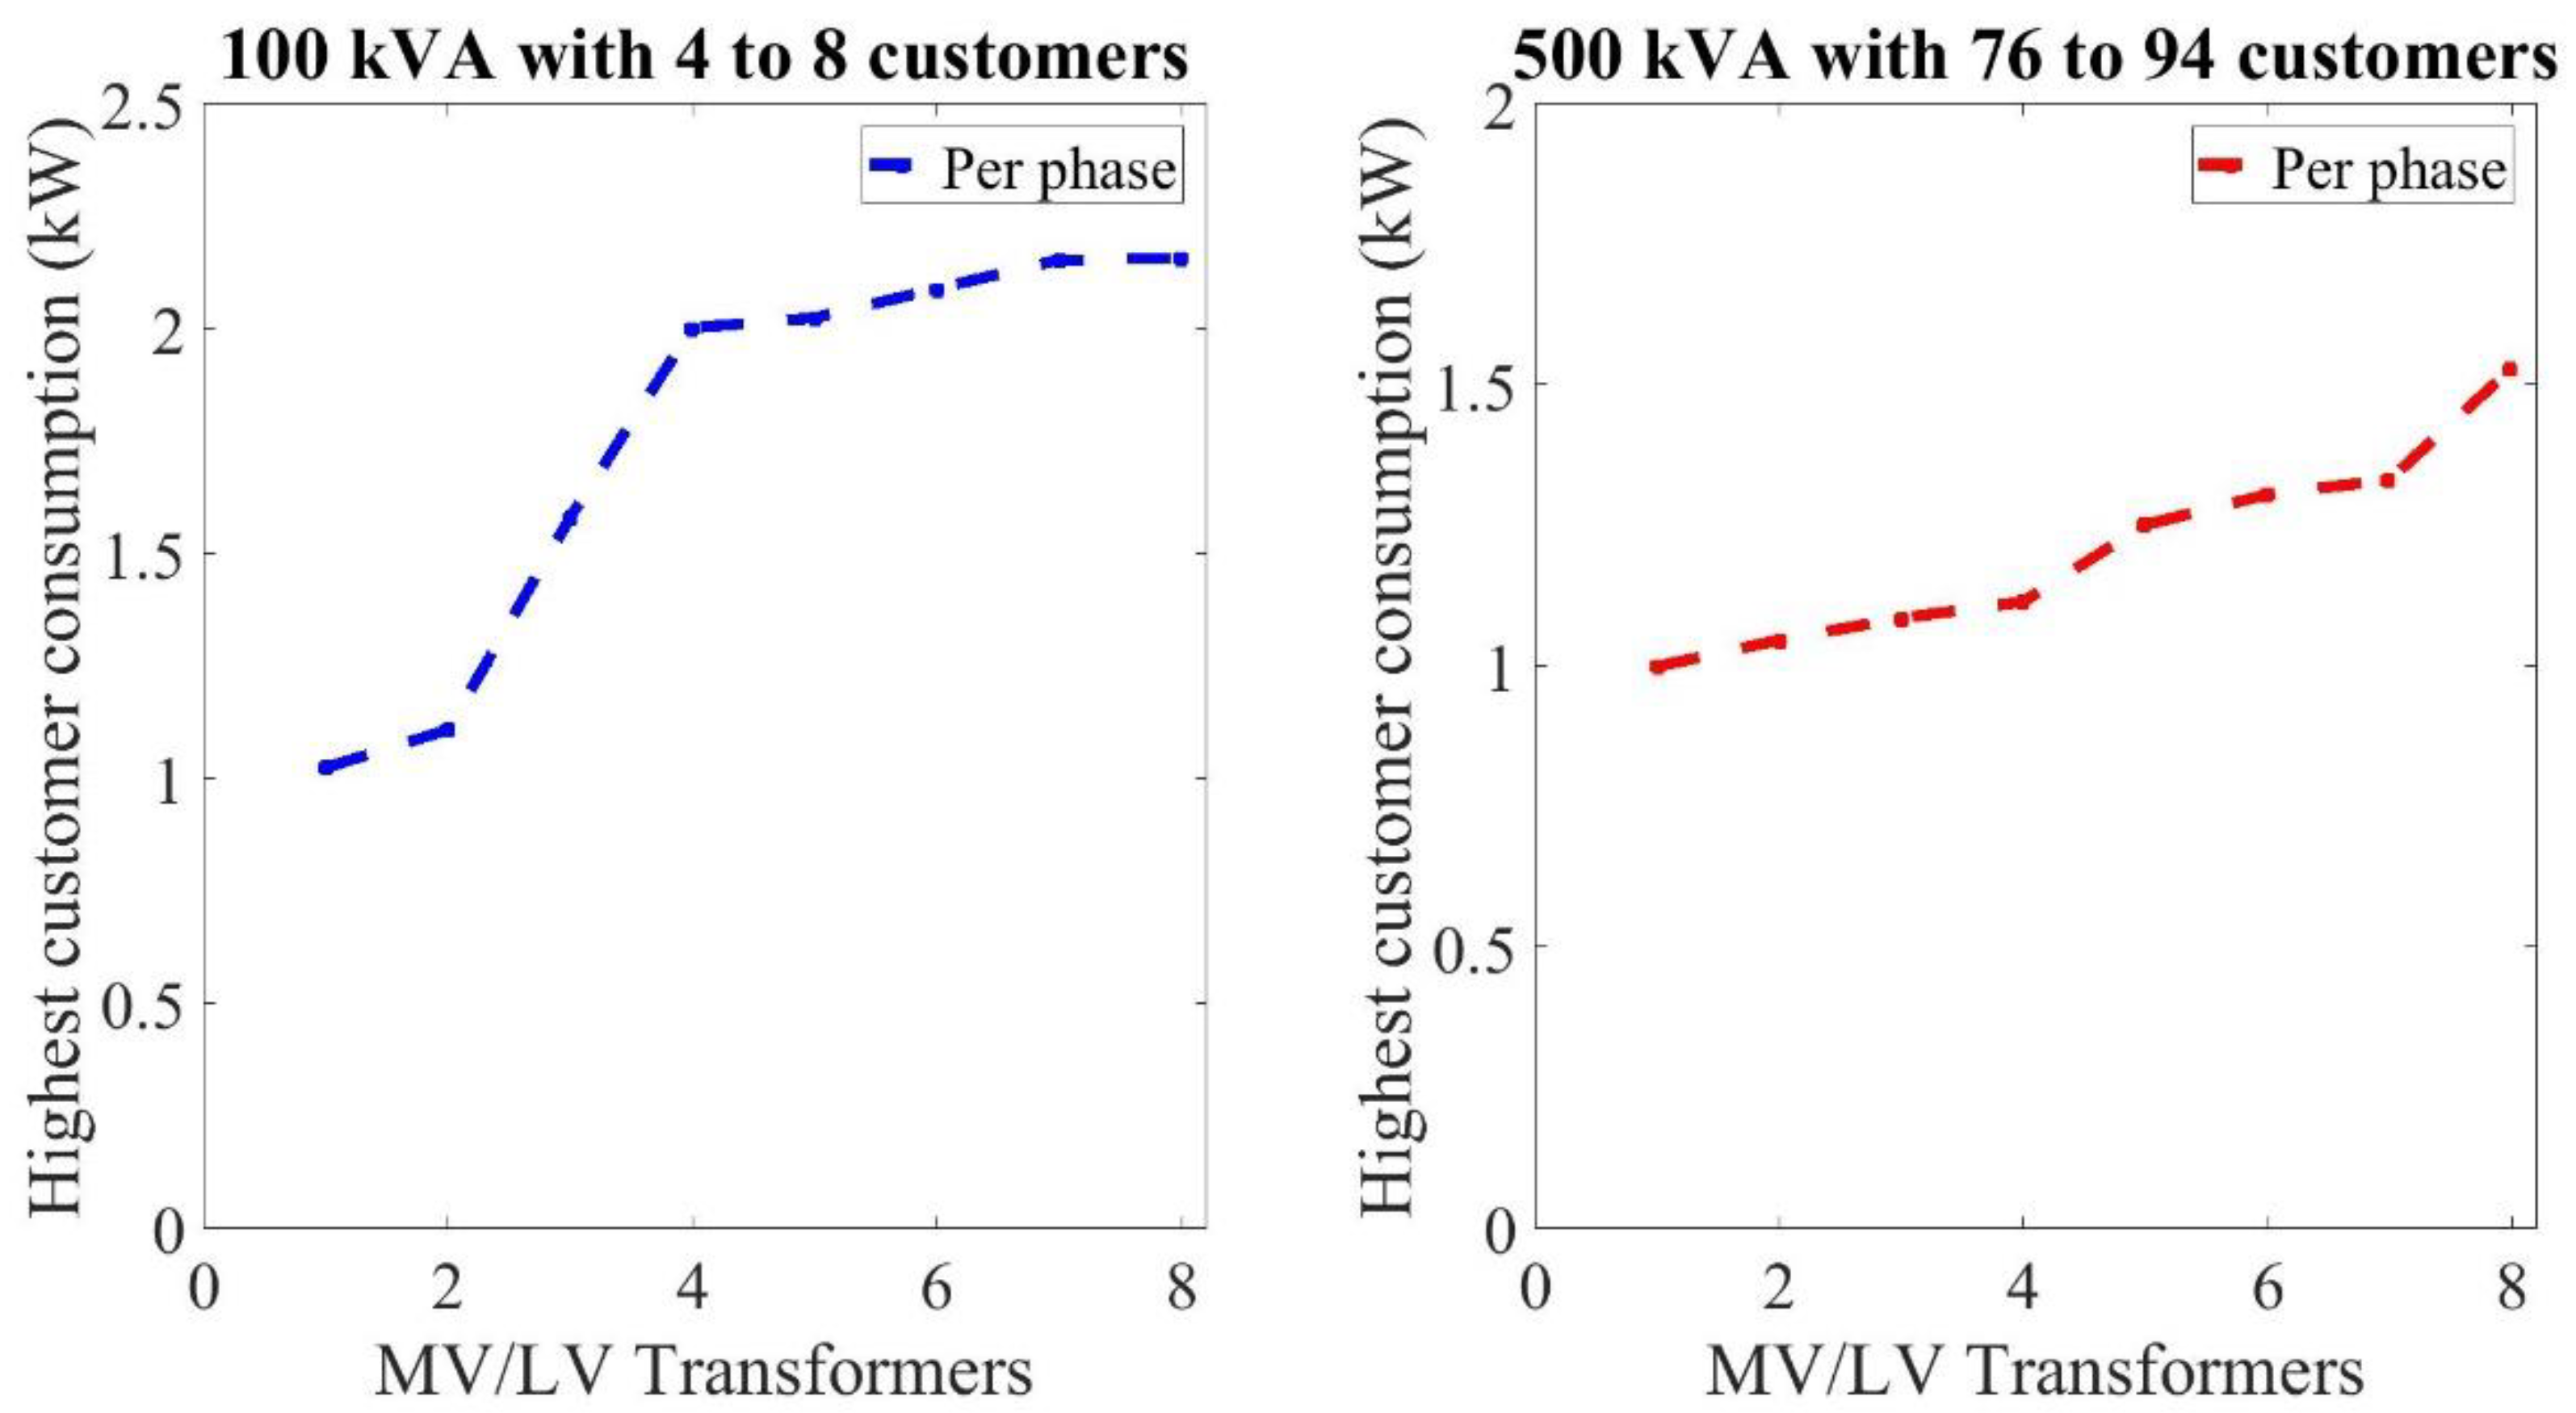
The approach requires the input of the highest customer consumption and lowest background voltages. Measurements and DSO given data on consumption used in [
29,
34] have been applied in this paper. Measurements from 8 distribution transformers were used to obtain a distribution of the highest consumption per customer: transformers with 4–8 customers for 100 kVA and 76–94 customers for 500 kVA. The obtained probability distribution of the highest consumption per customer is shown in
Figure 2.
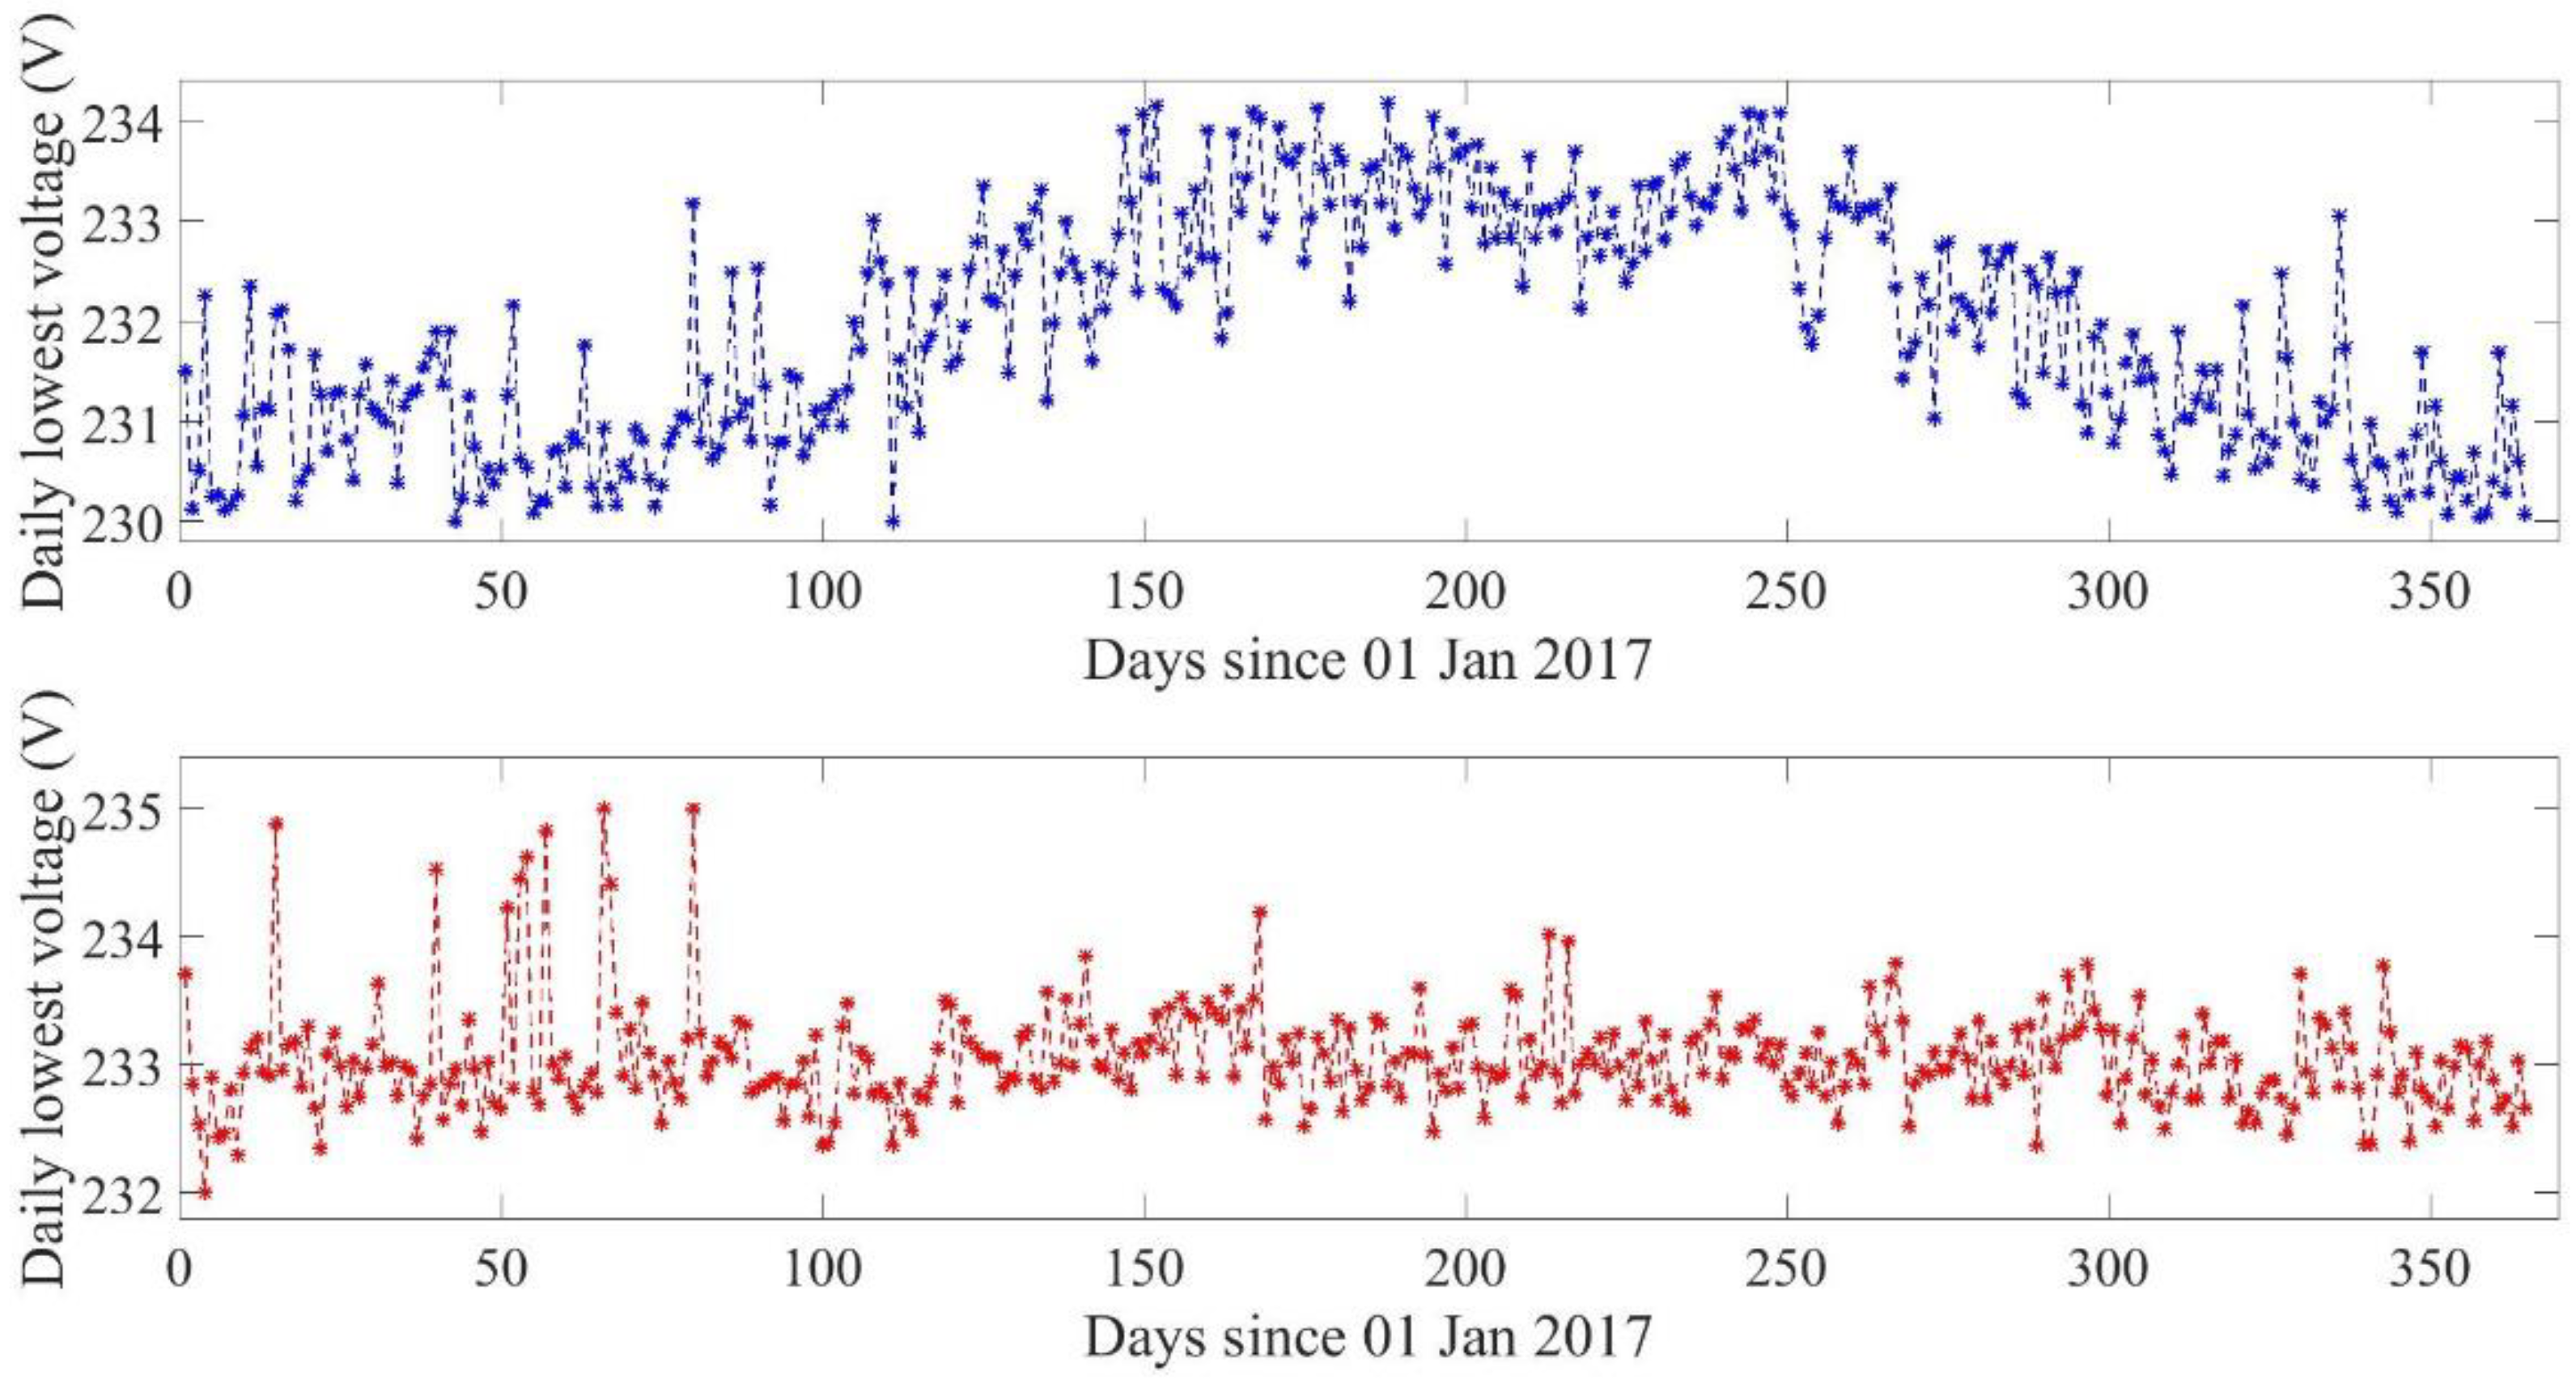
The lower value obtained for both transformer sizes is 1 kW per phase. The upper value is higher for the 100-kVA transformer. The lower and upper limits of each transformer size are applied as input data for the hosting capacity estimation. The highest consumption per customer obtained and applied for the 6-customer network is in the range of 1–2.2 kW. It is 1–1.5 kW for the 83-customer distribution network. An approach is applied to the voltage measurements for the distribution network in Northern Sweden, also used in [
29]. The daily lowest 10-min voltage measurement is obtained for a distribution network with 6 customers and one with 83 customers. These are voltages as measured at the low-voltage side of the distribution transformer. The results for 365 days of measurements during 2017 are shown in
Figure 3.
The daily lowest voltages for the 6-customer distribution network show higher values during the summer and lower values in winter. The 83-customer network shows a few higher values in winter. In addition, the lowest values for an additional 31 transformers were obtained. The method used in [
26] for the characterization of probability distribution functions was also applied to all the obtained measurements. The generalised extreme value (GEV) distribution was the one that most often fitted best to the background voltage that should be used for EV charging. The same was observed for the background voltage used for solar PV in [
29]. The obtained lowest background voltage for the 6-customer distribution network is in the range of 230–234 V and the range of 232–235 V for the 83-customer distribution network. The parameters for the GED distribution used for the background voltage in the hosting-capacity estimation of the networks presented in
Section 3.5 are shown in
Table 1.
In
Table 1,
k is the shape parameter of the GEV distribution. The value of
k also describes any of the three types (Type 1: Gumbel, Type 2: Fréchet, or Type 3: Weibull) of a GEV distribution. The GEV in
Table 1 is a Weibull distribution function. Sigma (
σ) describes the scale parameter (standard deviation), and mu (
μ) describes the location parameter of the GEV distribution (mean). The general representation of the GEV with location parameter (
), scale parameter (
), and the shape parameter (
) is given by Equation (3).
The GEV is described as a Gumbel distribution for a zero value of
k, Fréchet for
k greater than zero, and Weibull for
k less than zero [
35].
3.7. Hosting Capacity Calculation, Limit and Performance Index
The EV hosting capacity in this paper refers to the number of customers connected to an LV distribution network that can charge their EV simultaneously without causing the voltage magnitude to go below the undervoltage limit. The hosting capacity is exceeded when at least one of the customers’ voltages is below the limit.
The stochastic approach initially results in a probability distribution of each customer’s worst-case voltage magnitude. To estimate the hosting capacity, a performance index and a limit are needed. The 10th percentile of the worst-case voltage distribution is used in this paper as a performance index, and 90% of the nominal voltage is used as a limit.
Distribution network operators often consider planning risk in one way or another for their networks. What is typically not explicitly known is the percentage risk they take, which, in mathematical terms, would be a percentile. The 10th percentile voltage values are used in this paper to estimate the hosting capacity for EV. This corresponds to what could be called a “planning risk” of 10%. An illustration of the approach described in
Section 3.1,
Section 3.2,
Section 3.3,
Section 3.4,
Section 3.5 and
Section 3.6 is shown in
Figure 4 and
Figure 5 for a 6-customer distribution network. The implementation is done with the following:
The 6-customer distribution network input data and source impedance.
The obtained background voltage of 230–234 V obtained in
Figure 3 and GEV pdf was applied (k = −0.3228, sigma = 1.1491, mu = 231.55).
The EV charging power of 4.6 kW single-phase [
31].
The highest power consumption per phase of 1–2.2 kW and its pdf (uniform).
The interval and the possible number of customers with EV chargers applied. The interval range is from 1 to 6 customers (the total number of customers).
All possible combinations and locations from 1 customer to 6 customers are assessed.
The customers can install the charger in any of the three phases.
Monte-Carlo is applied (100,000 to 1,000,000). The probability distribution of the customers’ voltage magnitude is obtained.
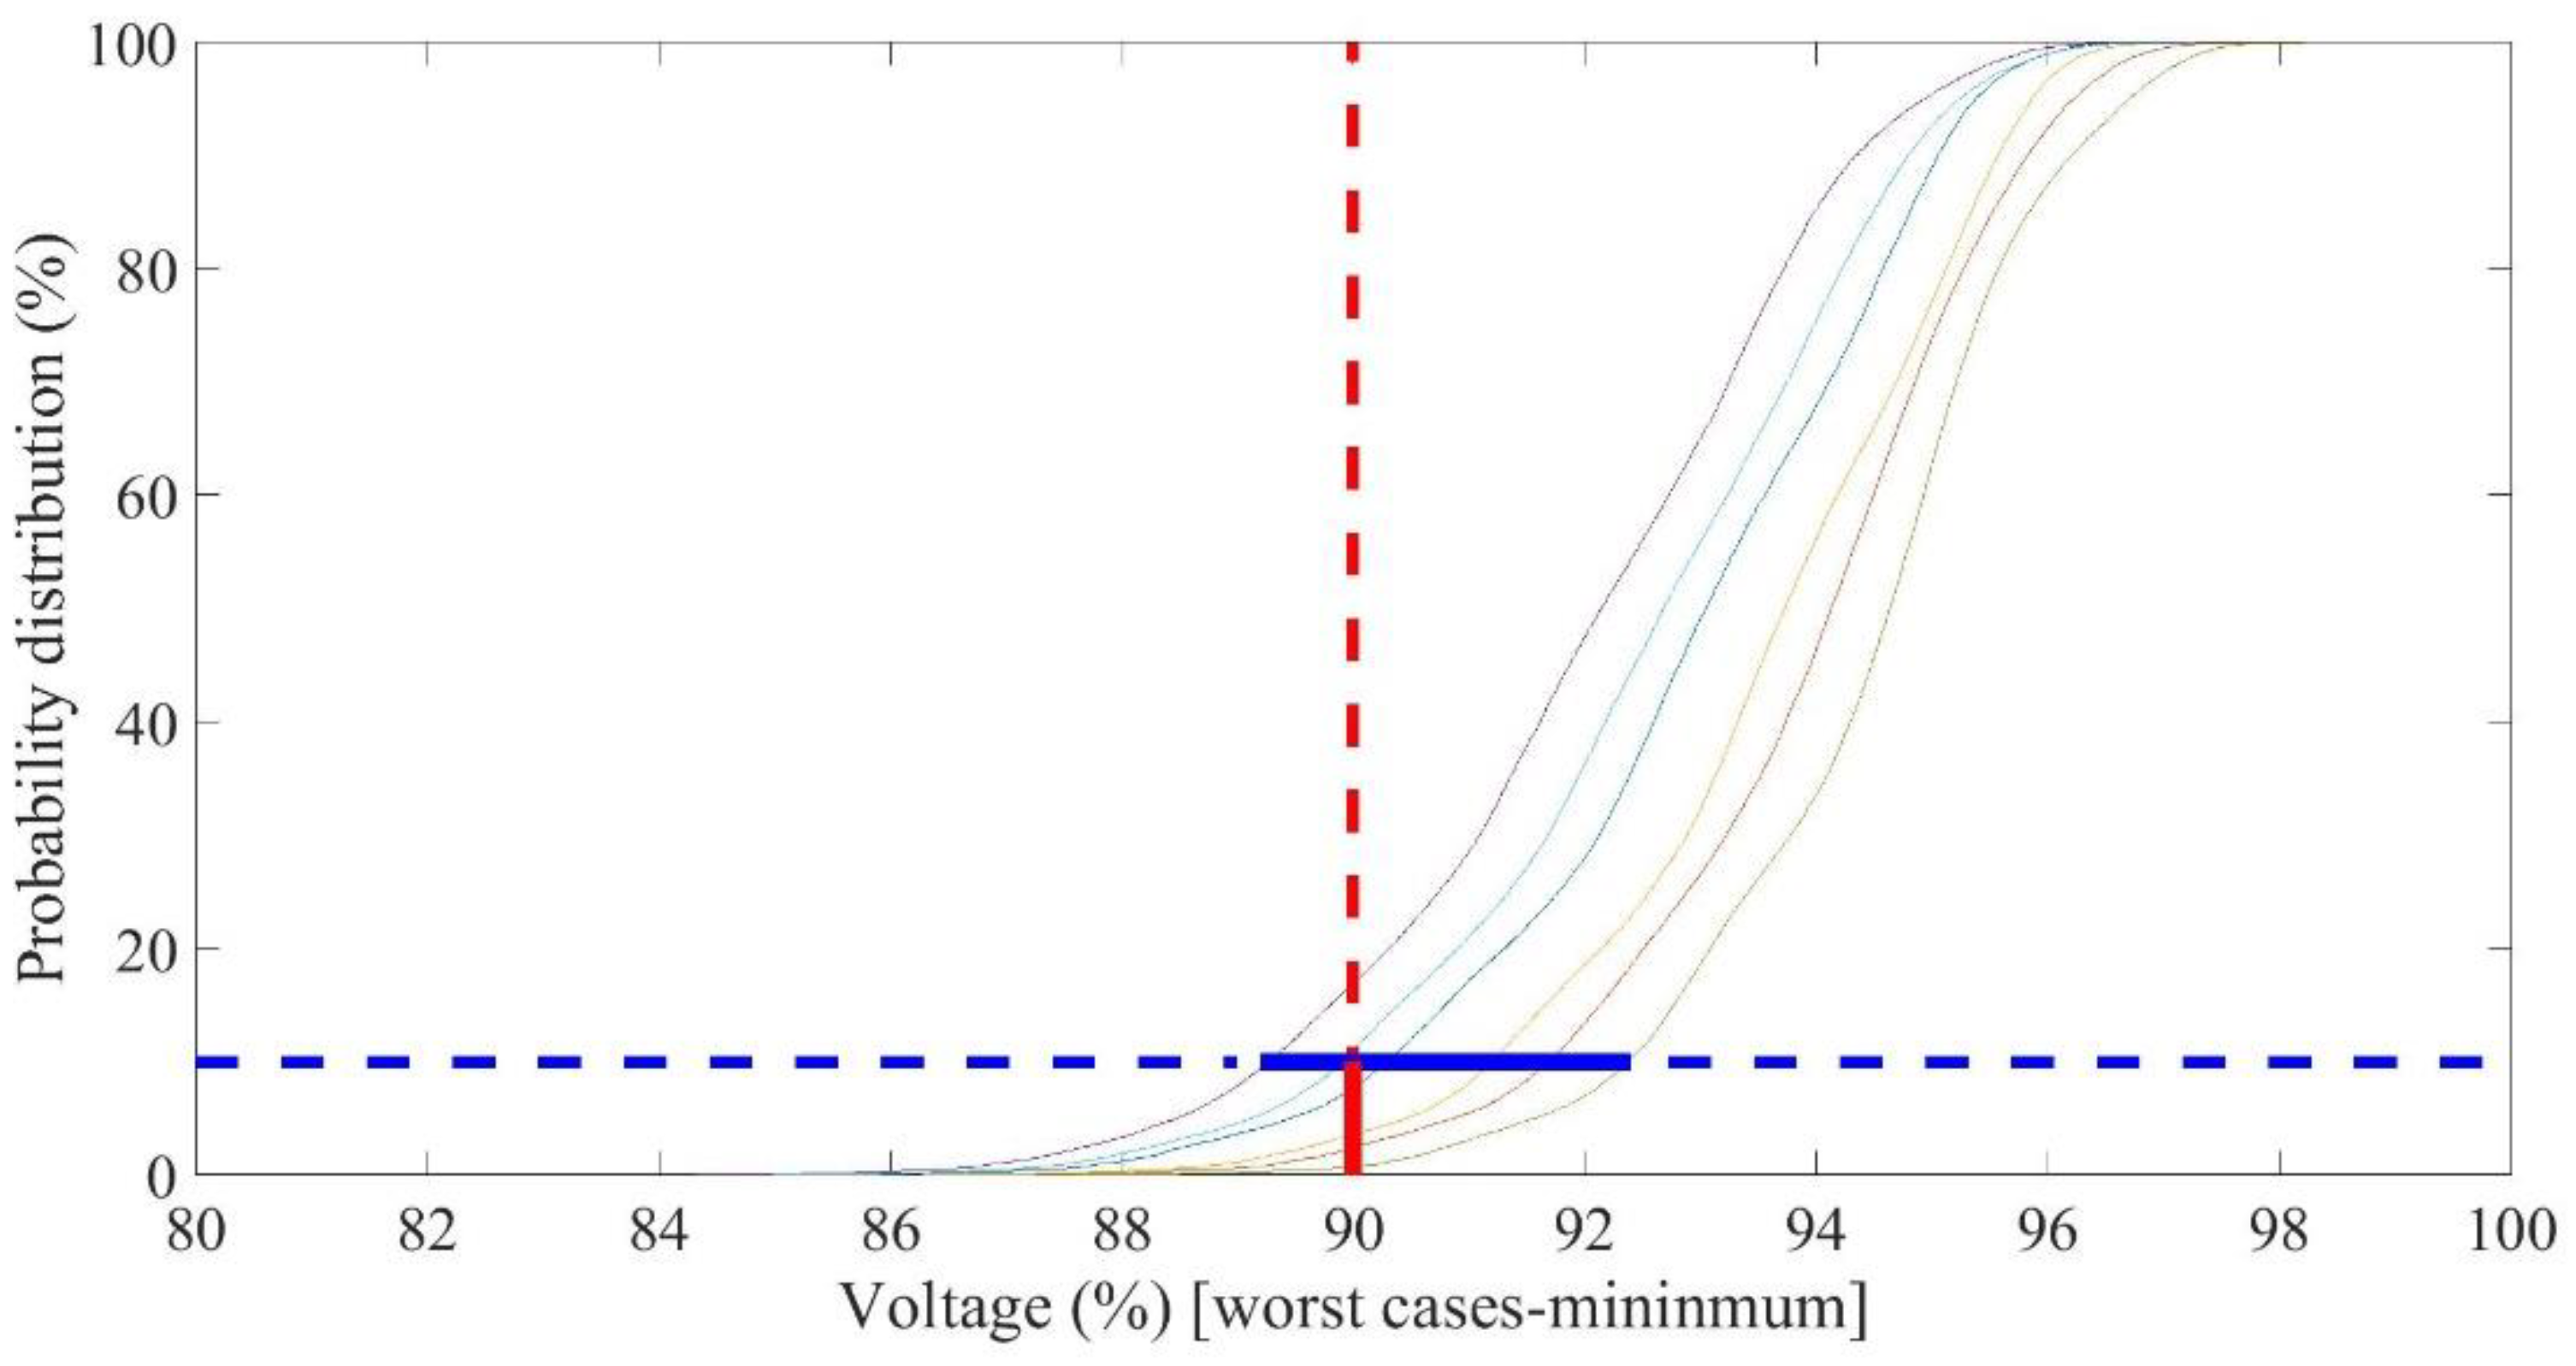
The probability distributions for the voltage with the customers in the 6-customer network with EV chargers are shown in
Figure 4.
In
Figure 4, the horizontal blue line (solid and dotted) crossing the distributions indicates the 10th percentile. The vertical red line crossing the distributions indicates the probability that the voltage is less than the 90% undervoltage limit. Estimating the hosting capacity involves repeating the calculation of
Figure 4 from one customer to the maximum (six). The 10th percentiles of the voltage (the performance index used), as obtained from
Figure 4, and the limit are used to obtain
Figure 5.
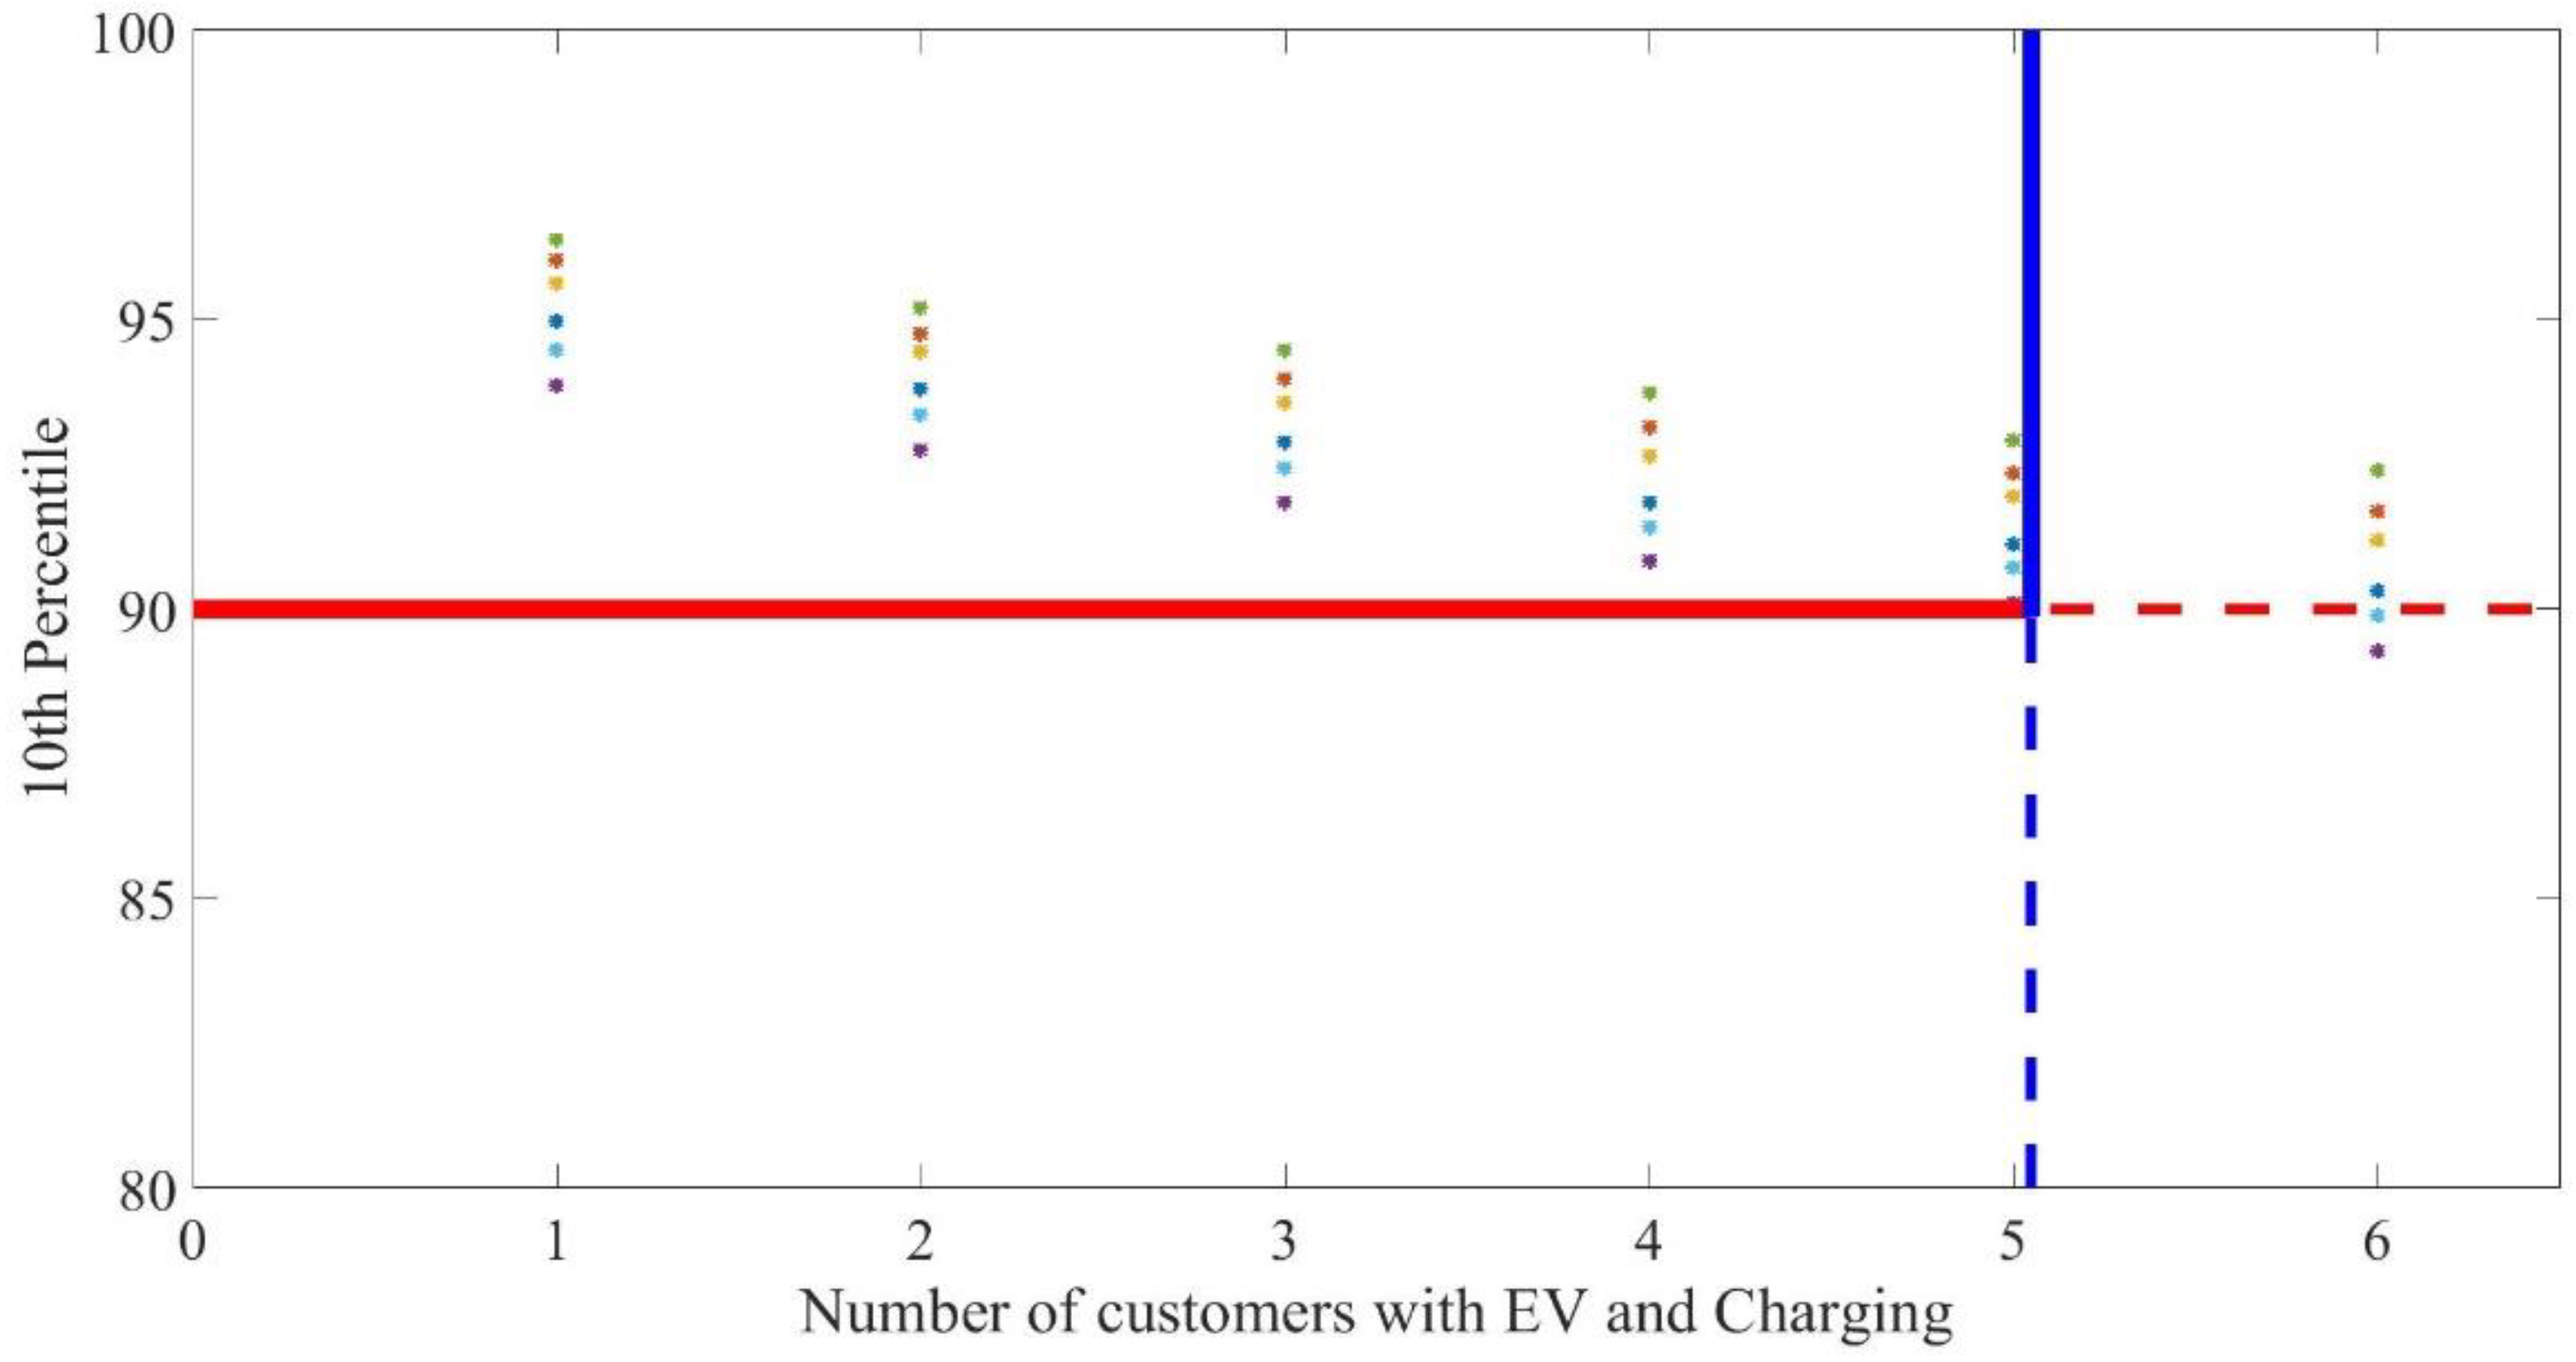
The results in
Figure 5 include the possibilities of having 1 customer charging an EV up to all the customers (6) charging simultaneously. The blue vertical lines (solid and dotted) in
Figure 5 show the highest number of customers charging simultaneously without any of the voltages falling below the undervoltage limit.
When one customer is charging, the 10th percentile values of the customers are above 90%. The index does not violate the limit. The increase in the number of customers charging shows the 10th percentile approaching 90%. The undervoltage limit is violated for 6-customer charging. At most, 5 customers can charge without the limit being violated. The hosting capacity in this case is 5 customers (83% of the total number of customers). The estimation procedure has been repeated for different distribution networks and different charging powers. The results are shown in
Section 4.
4. EV Hosting Capacity Results
The approach in
Section 3 and the steps outlined were applied to the six-customer and 83-customer distribution networks described in
Section 3.
In the first step, the hosting capacity for single-phase EV simultaneous charging was assessed. In the second step, the assessment was performed for three-phase EV charging. Furthermore, the influence of the background voltage, highest customer power consumption, and the planning risk on the hosting capacity were also evaluated. The results obtained for the stochastic hosting capacity results applied to EVs are given in this section.
4.1. Single-Phase Hosting Capacity
The capacity of the six-customer and 83-customer distribution networks for single-phase EV charging of different power is shown in
Figure 6.
The results in
Figure 6a show that for EV charging power of 9.2 and 11.5 kW, none of the six customers can charge their EV. The hosting capacity is zero customers. The hosting capacity is one customer for 8.05 kW charging power and becomes six customers when the charging power is 3.7 kW.
In
Figure 6b, only a few customers can charge simultaneously with 11.5 kW. The hosting capacity is 5% (four customers). The hosting capacity increases to 8% at 9.2 kW charging power. It is 52% for the charging power of 3.7 kW. Over half the customers can have single-phase EV chargers with 3.7 kW.
4.2. Three-Phase Hosting Capacity
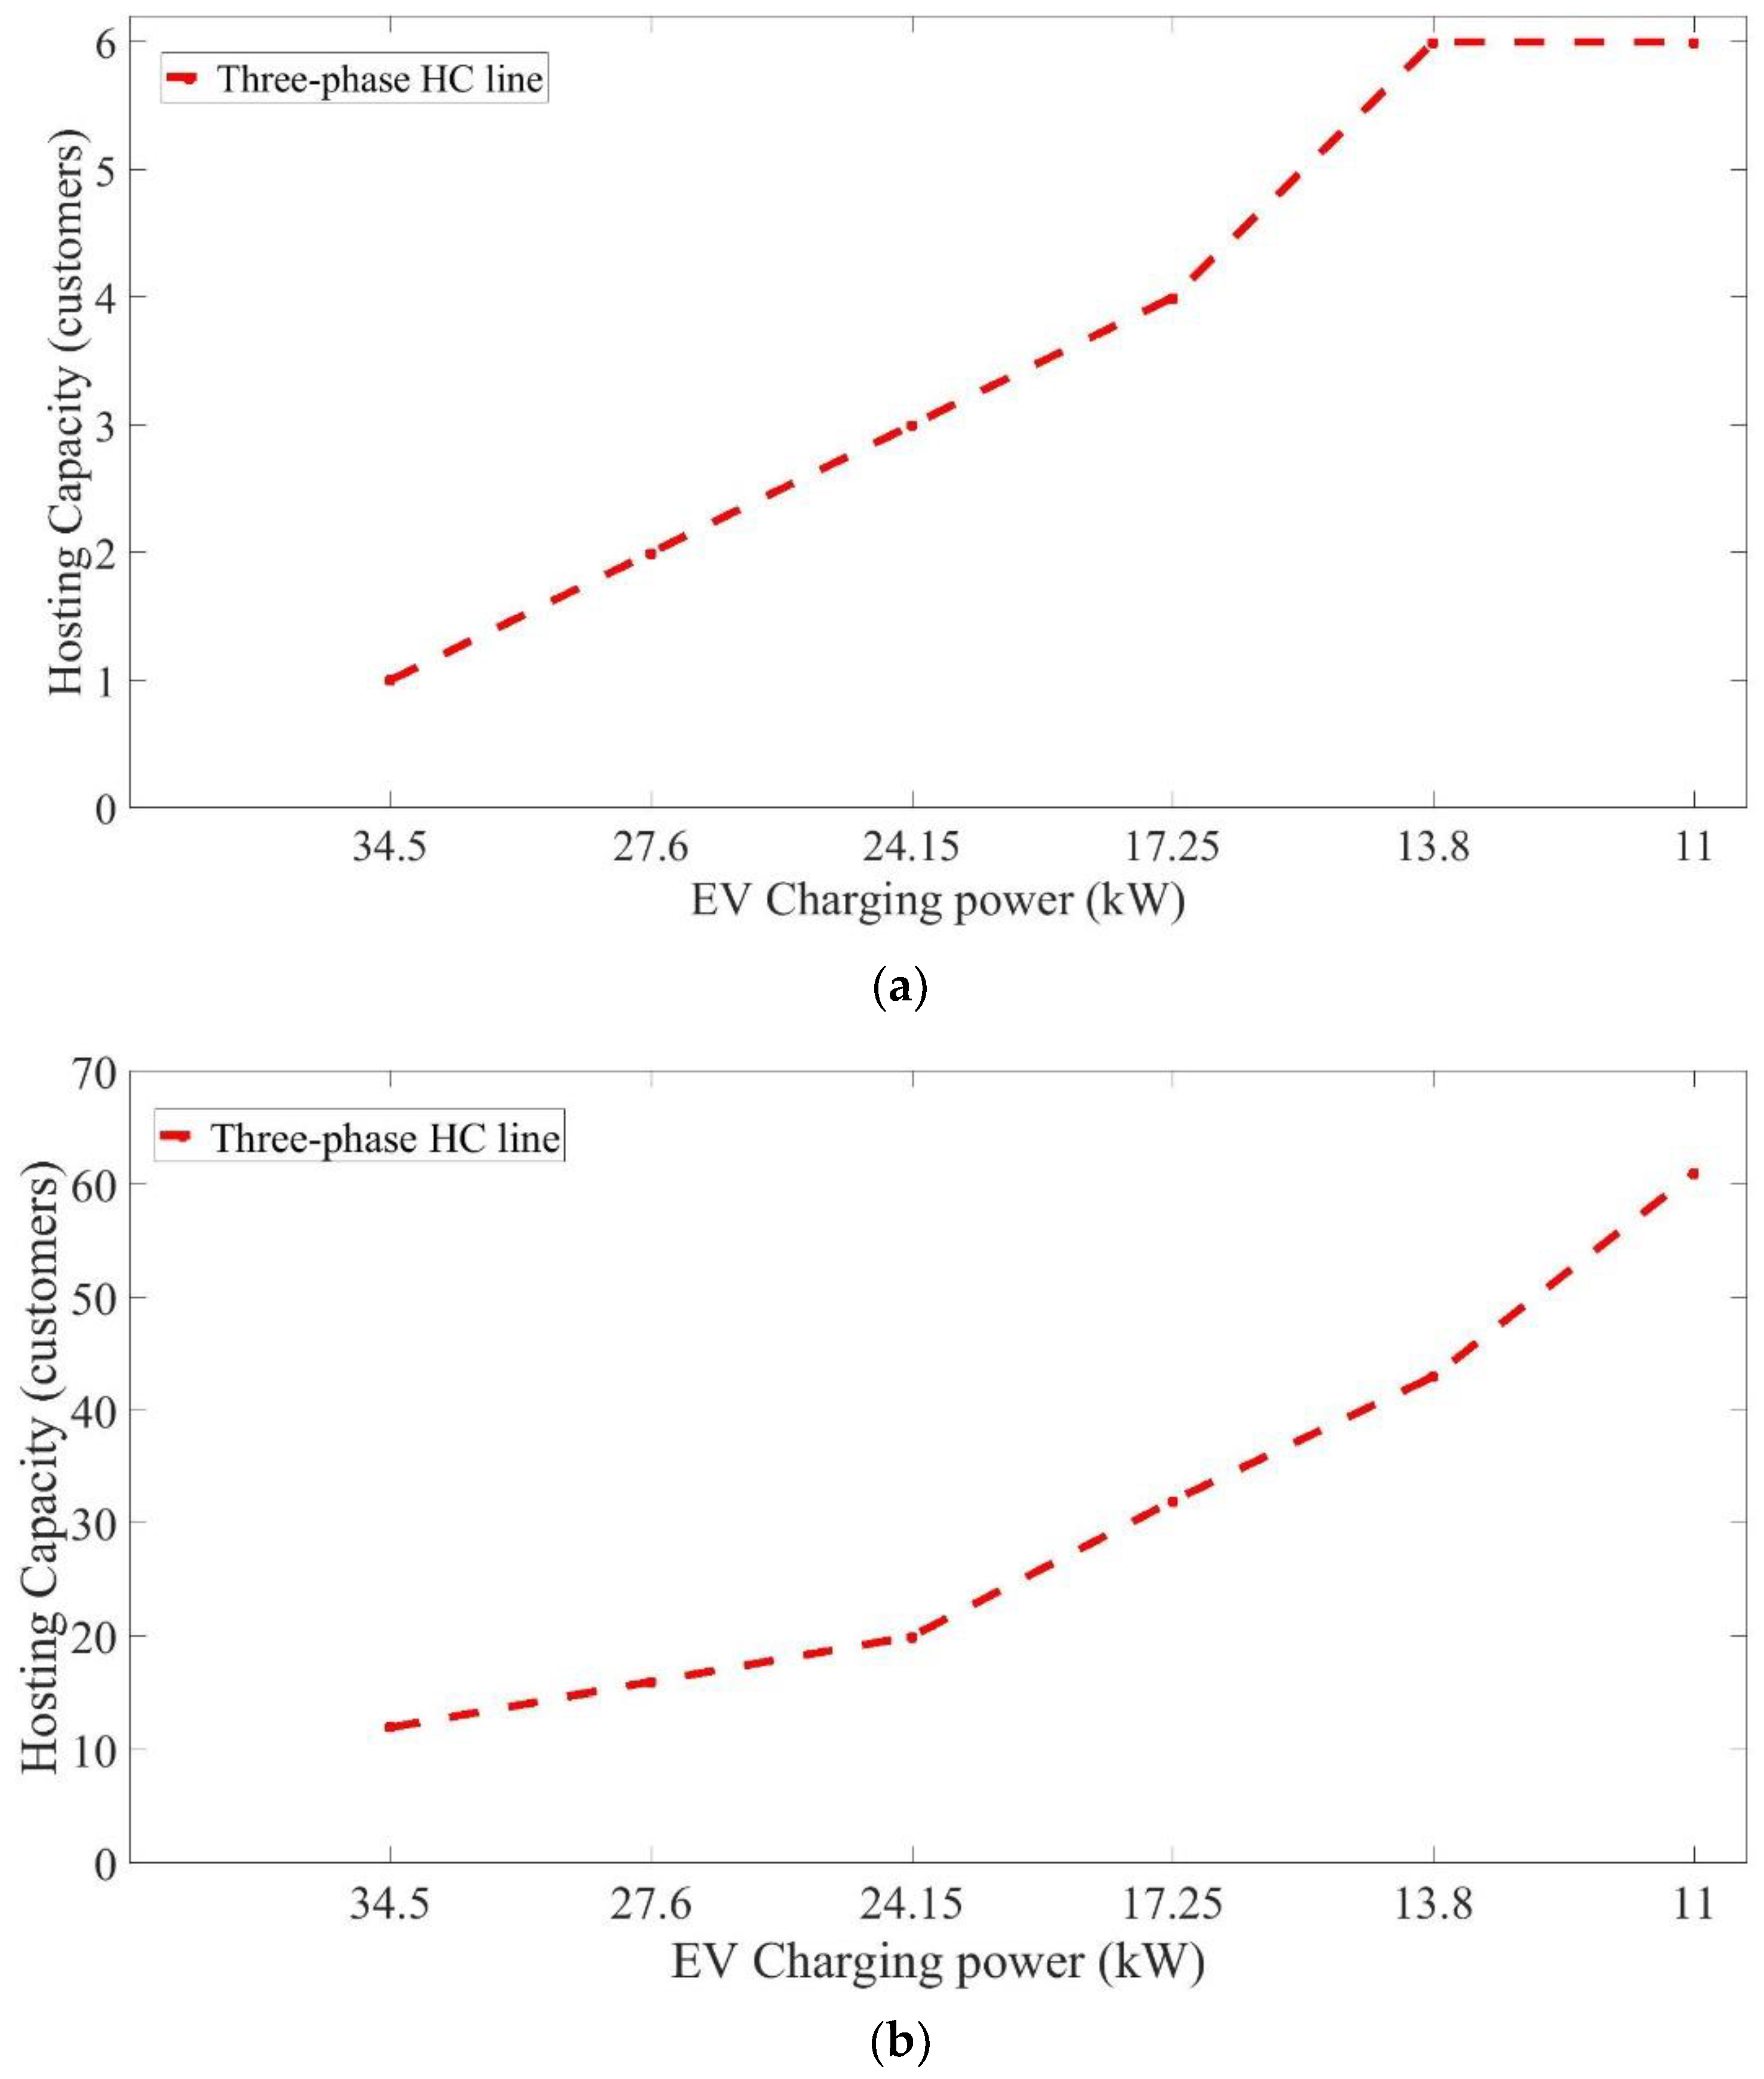
The three-phase hosting capacity for the six-customer and 83-customer distribution networks considering different EV charging powers are shown in
Figure 7.
The results in
Figure 7 show a similar pattern for single-phase charging, whereby more customers can simultaneously charge for smaller charging power per customer. The current per phase is the same for the single-phase and three-phase charging powers considered, but the hosting capacity is generally higher for three-phase charging. However, there is no clear relation between the two. Separate calculations are needed for single-phase and three-phase charging. The three-phase hosting capacity is one-sixth for the six-customer distribution network, at 34.5 kW of charging power needed. It is 14% (12 customers) for the 83-customer distribution network. In the six-customer distribution network, all customers can charge their EV simultaneously for 13.8 kW and below power needs. The hosting capacity for the 83-customer distribution network is 73% for the 11 kW three-phase charging power need.
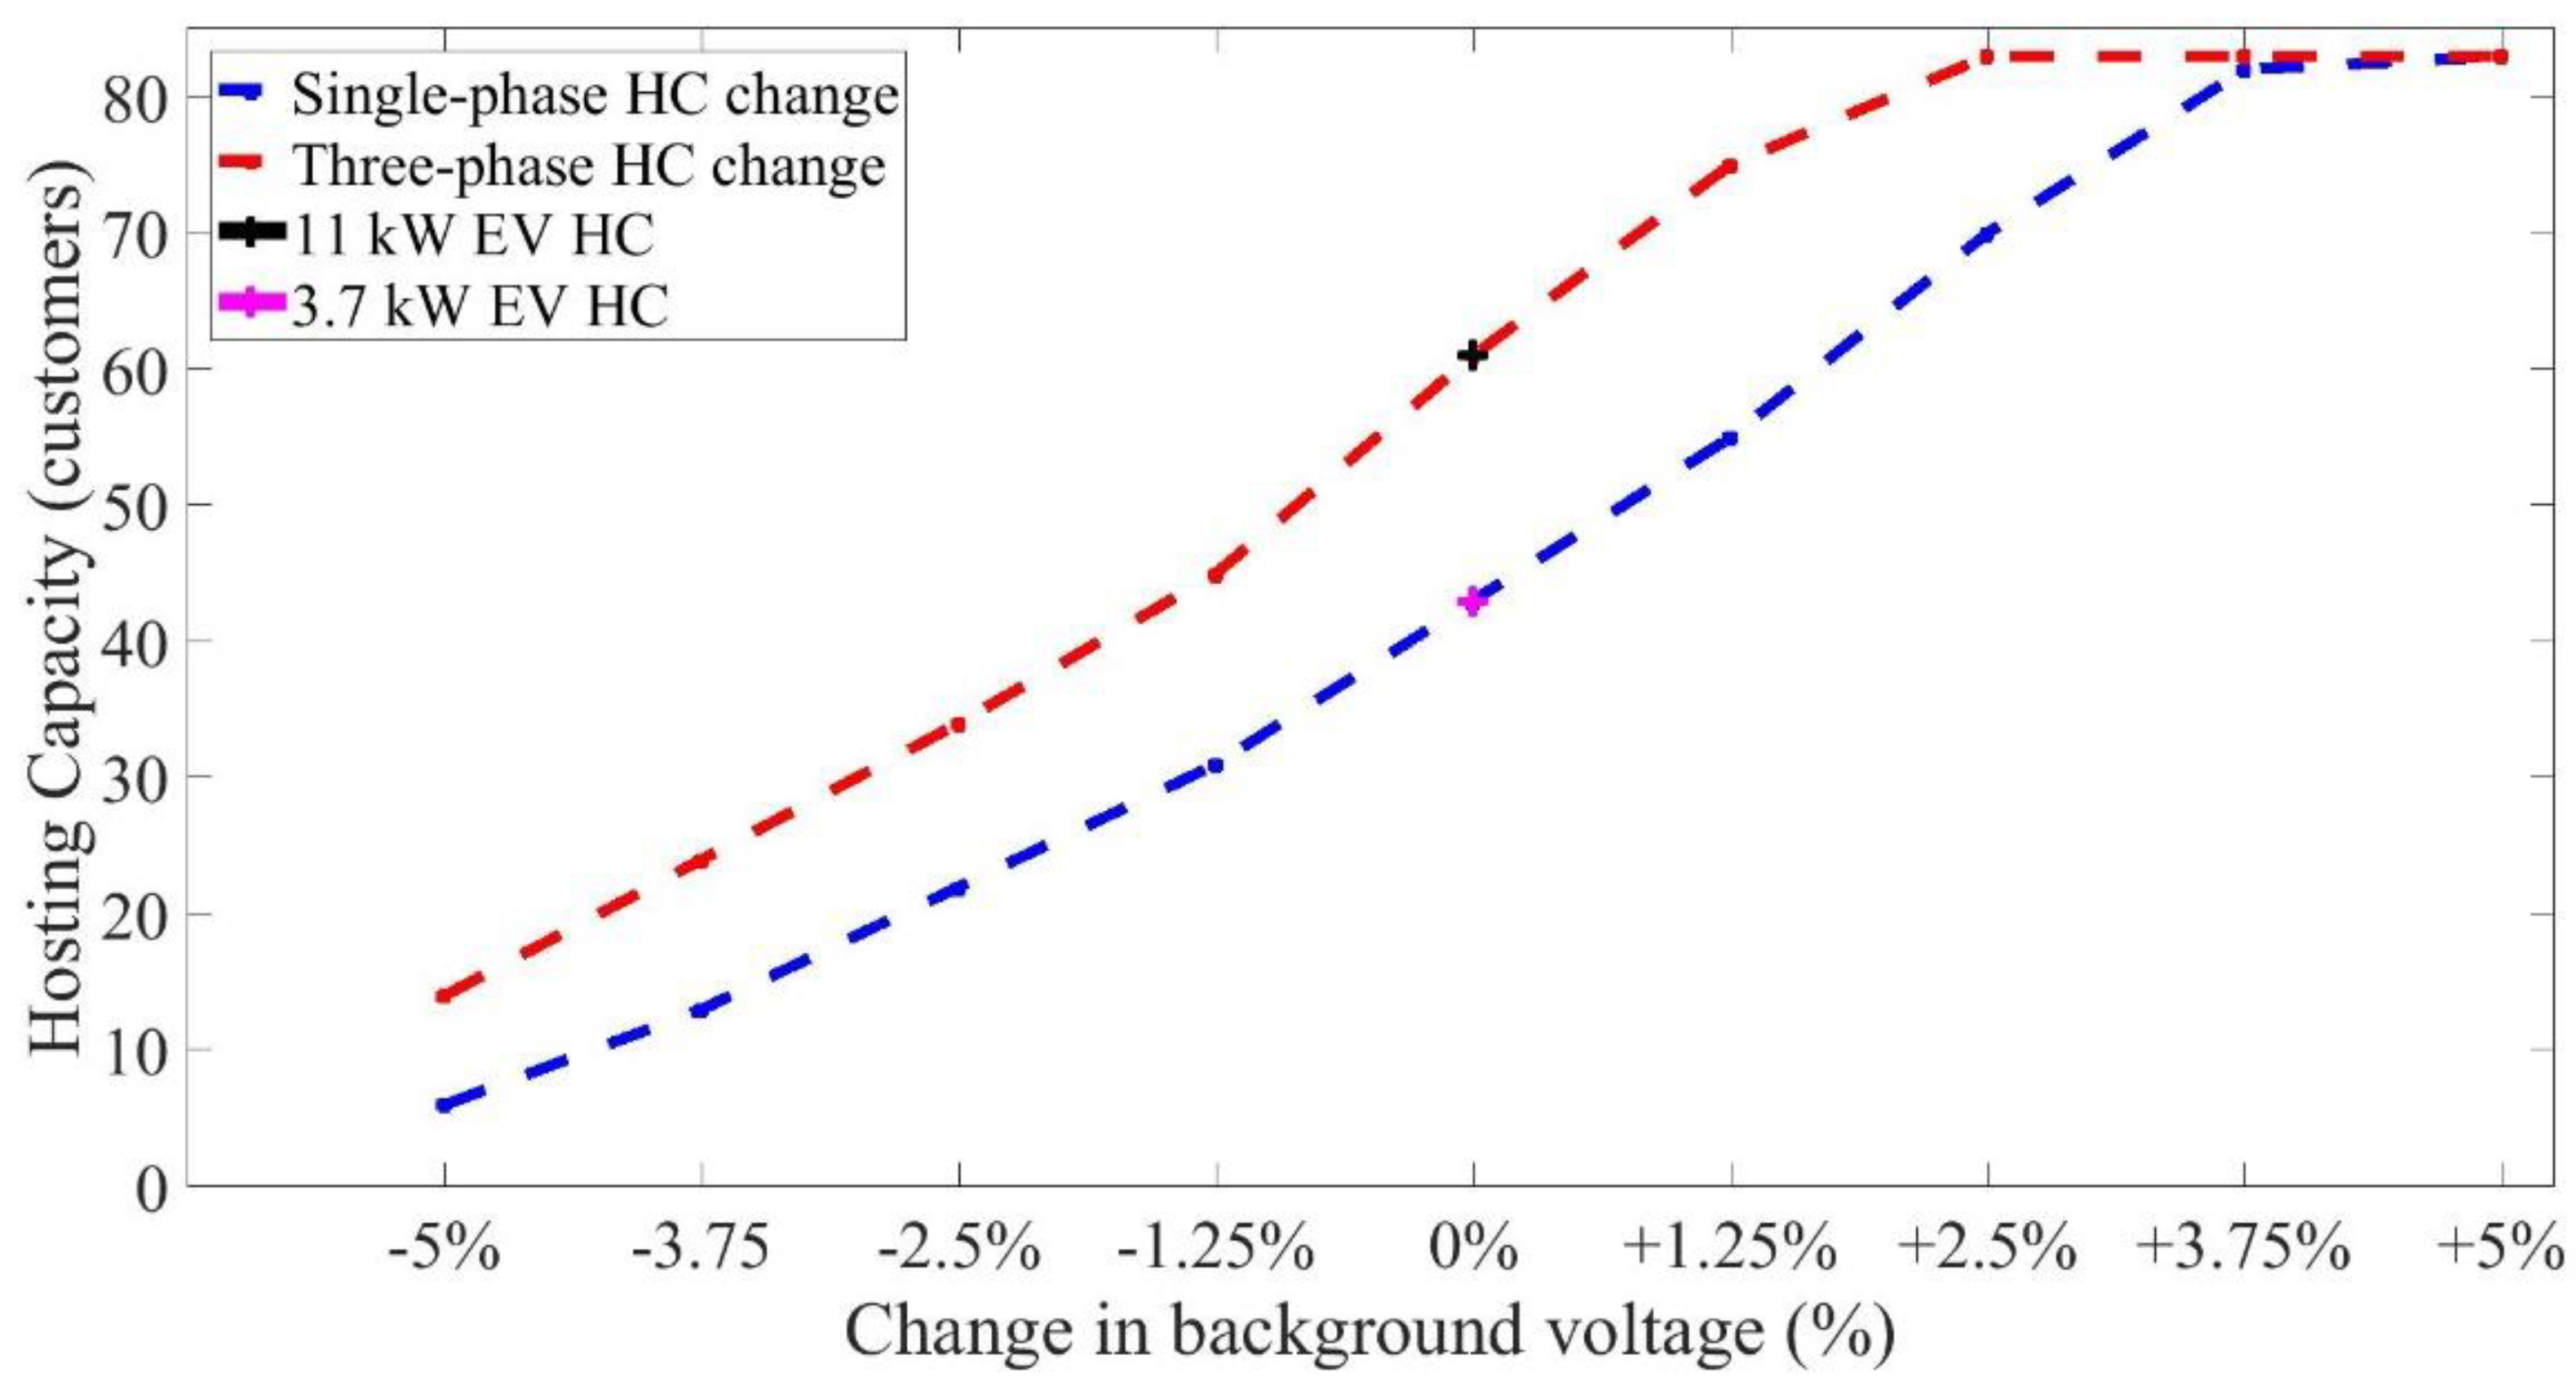
4.3. Influence of Lowest Background Voltage
The obtained measured background voltage has been changed by 1.25%, 2.5%, 3.75%, and 5% of the nominal voltage. The GEV distribution function, which characterised measurements, was fitted to the increased voltage measurements. The input lowest background voltages applied to assess their influence on the hosting capacity are given in
Table 2.
The stochastic hosting capacity assessment, performed for the different background voltages shown in
Table 2, resulted in
Figure 8.
Again, the behaviour is similar for single-phase and three-phase charging, with the hosting capacity being generally higher for three-phase charging. Compared to the reference case, a decrease of 5% in the lowest background voltage results in a large decrease in hosting capacity. A similar increase in background voltage results in the hosting capacity reaching 100% of customers for both single-phase and three-phase charging.
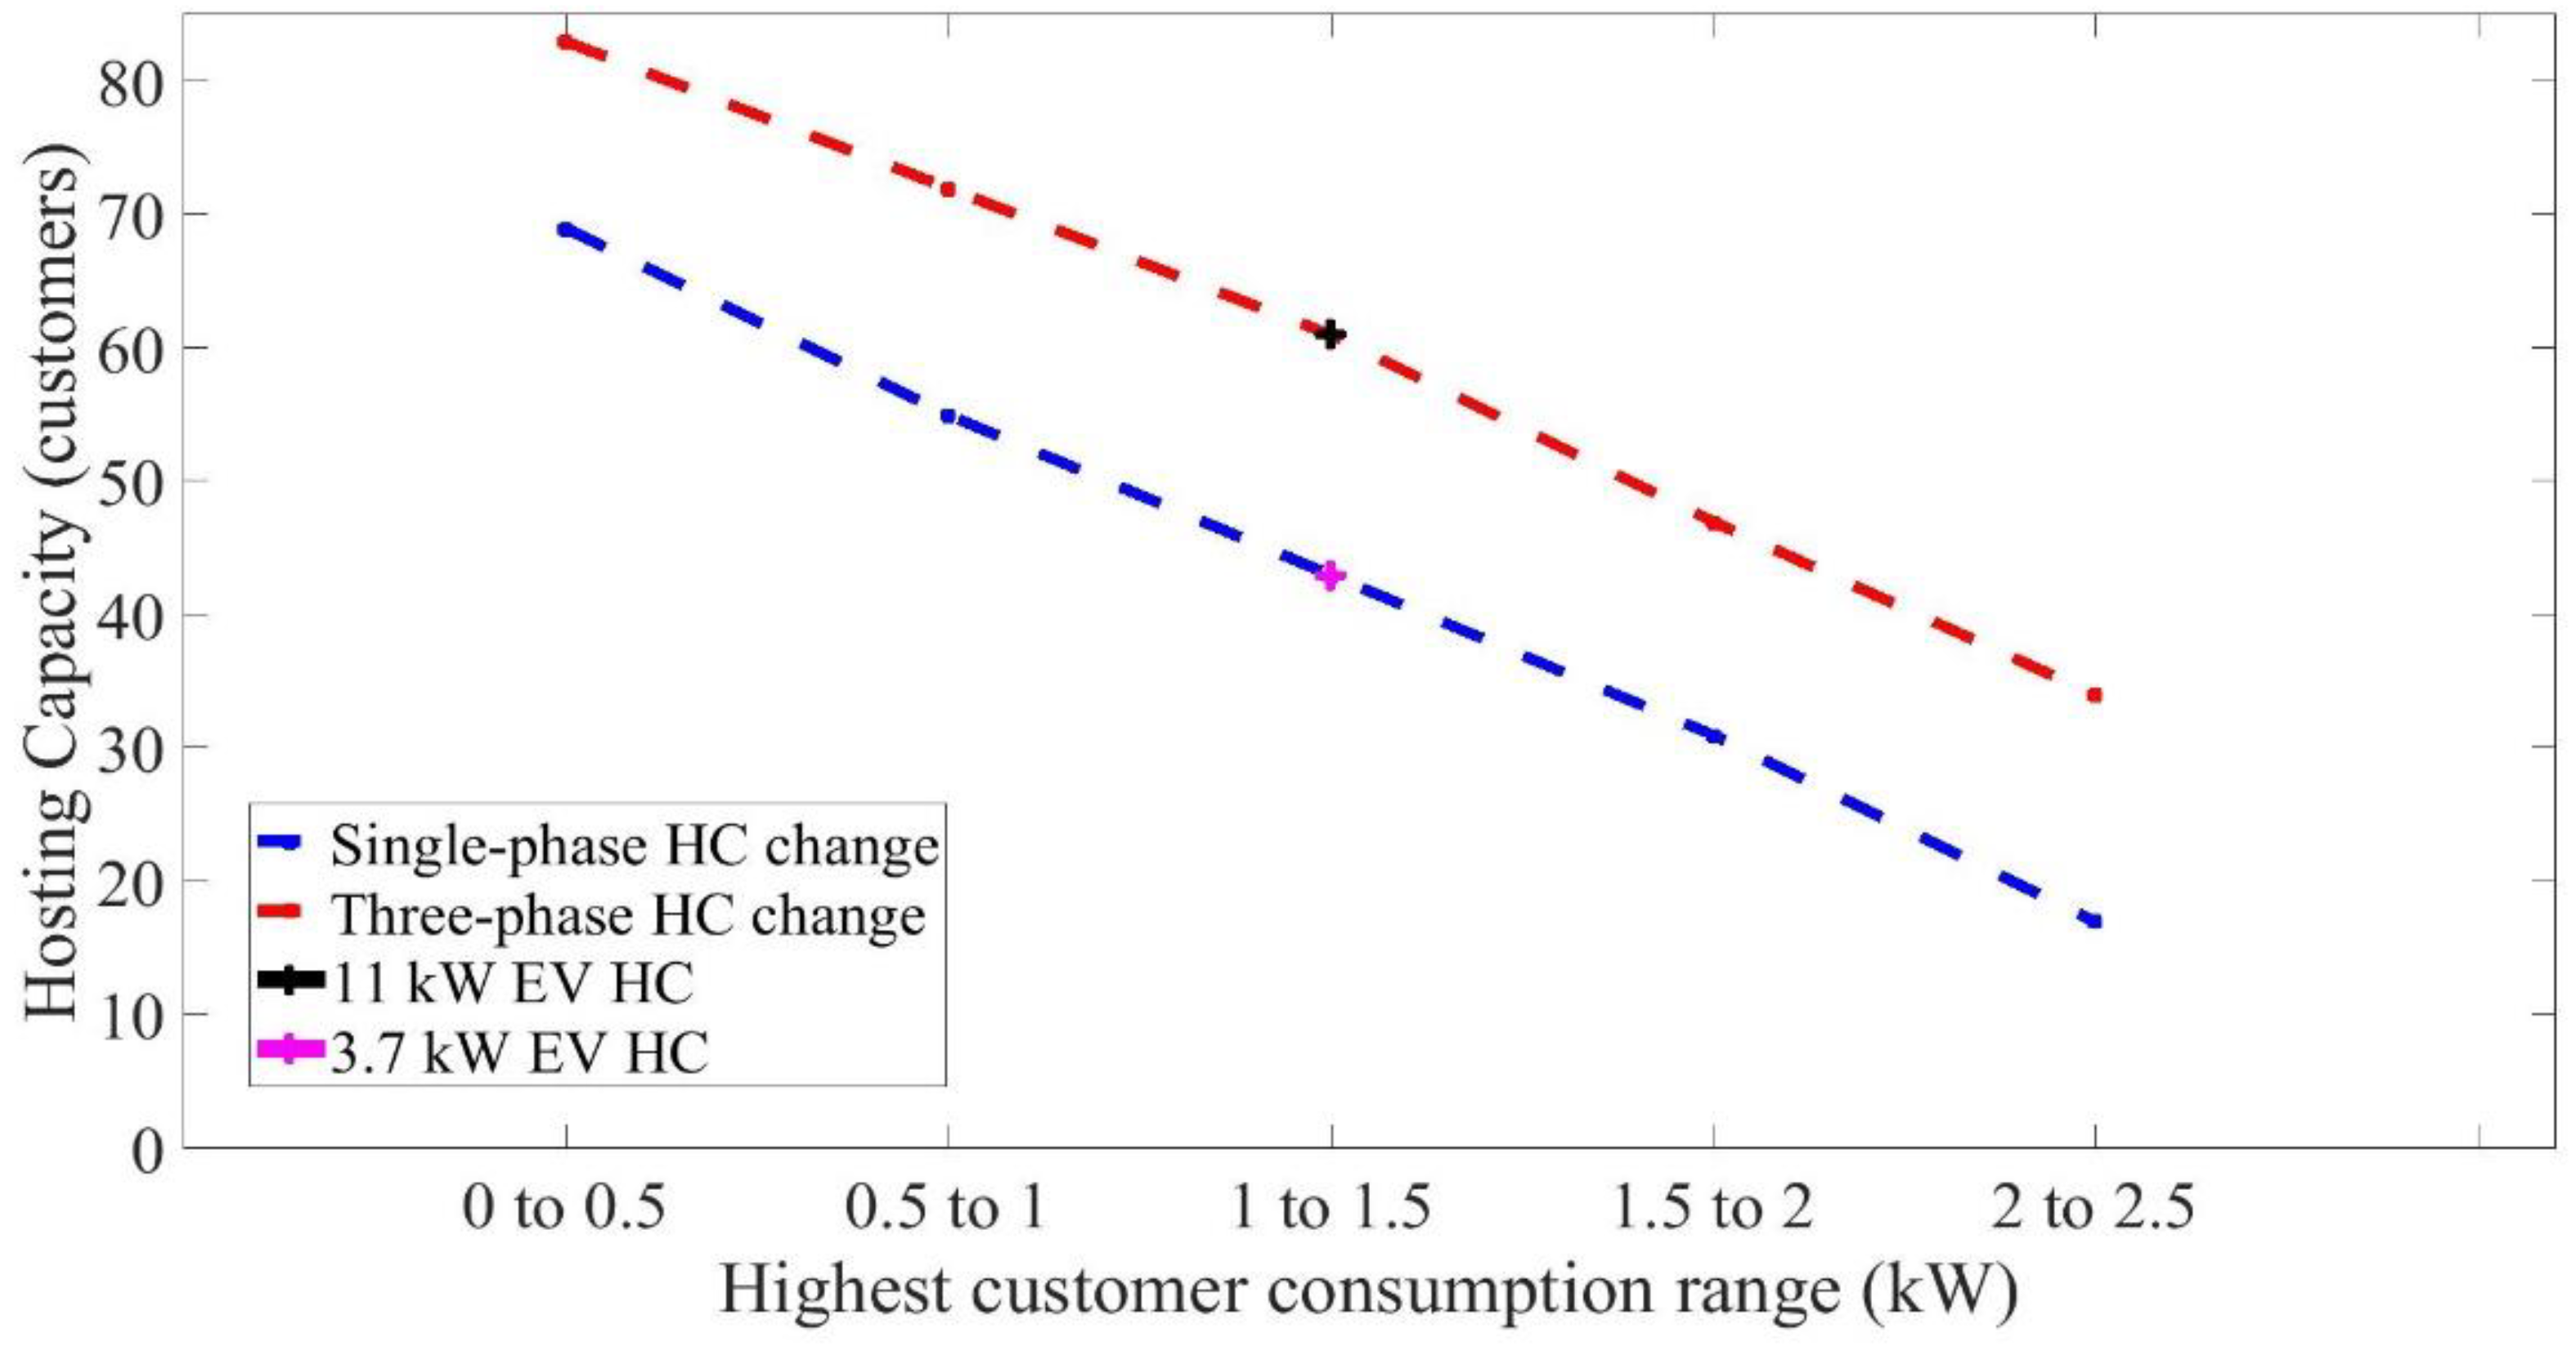
4.4. Influence of Customer Highest Consumption
The highest customer consumption is changed for the 83-customer distribution network. The consumption ranges of 0–0.5, 0.5–1, 1.5–2, and 2–2.5 kW are applied. A stochastic approach is applied for each consumption range in addition to the reference case of 1–1.5 kW for single-phase and three-phase EV charging. The results are shown in
Figure 9.
The customers’ highest consumption also has a significant impact on the hosting capacity. The smallest consumption range of 0–500 W in
Figure 9 caused an increase in the hosting capacity by 36% for three-phase and 65% for single-phase EV charging. As the highest consumption is increased, there is a corresponding decrease in the hosting capacity. The hosting capacity decreases by 69% for single-phase EV charging and 44% for three-phase EV charging.
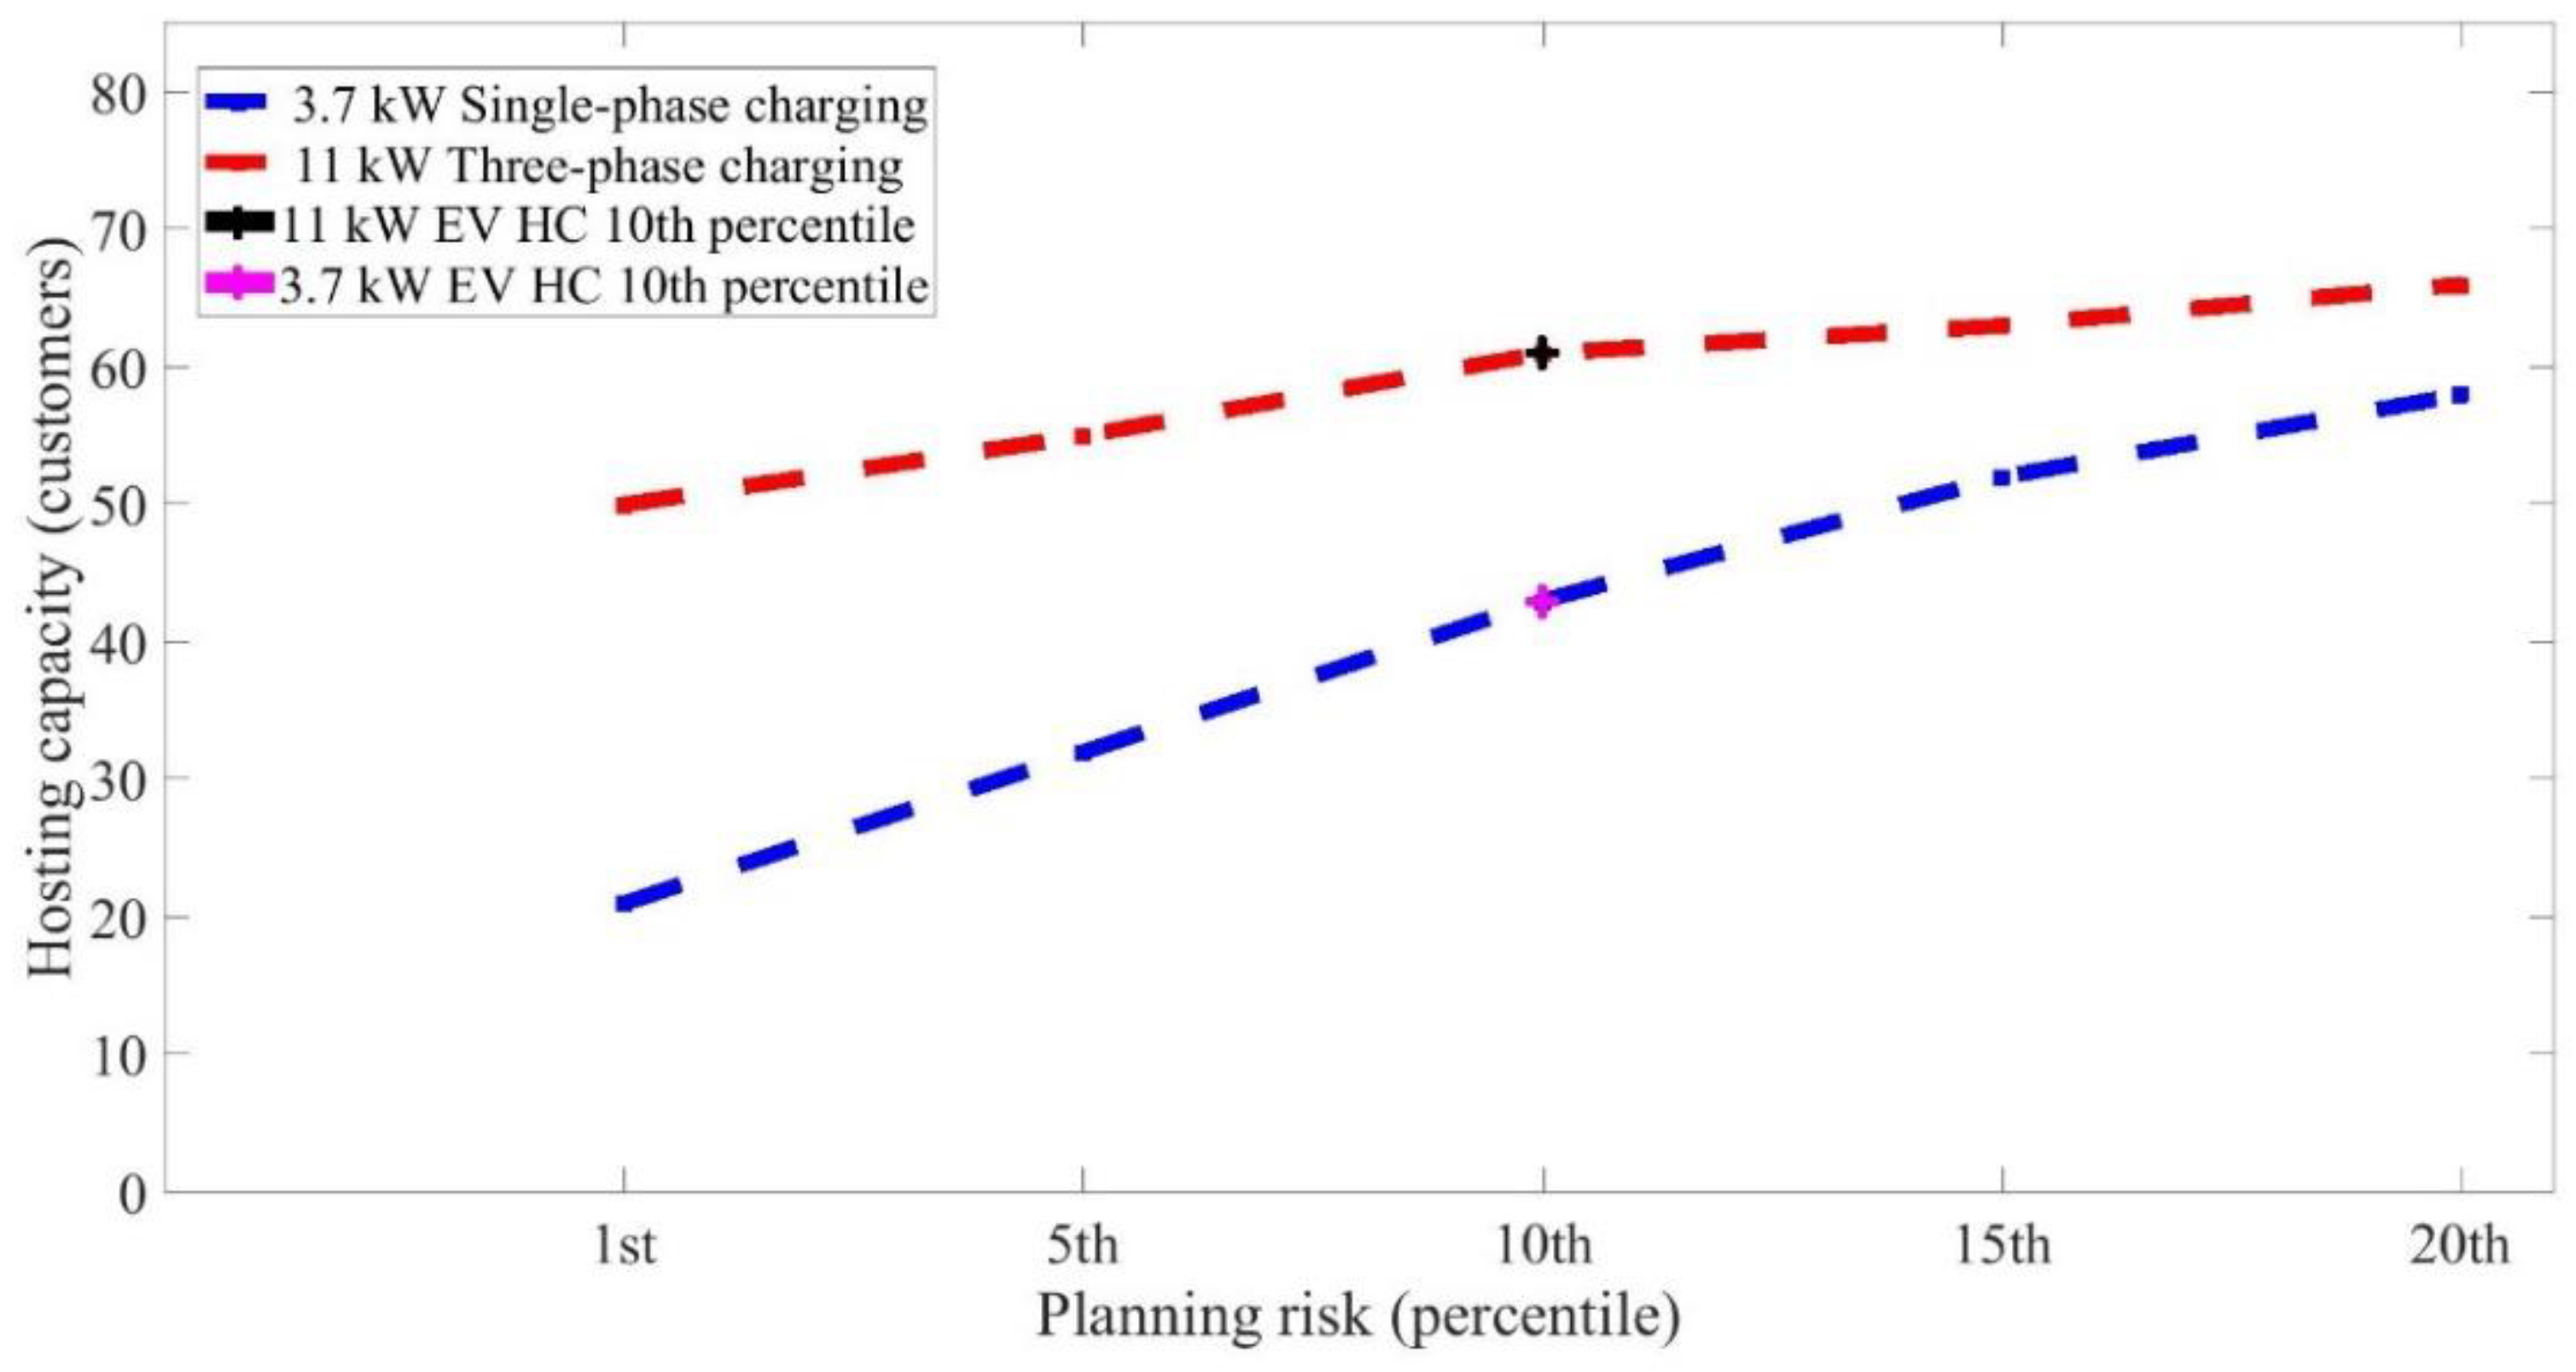
4.5. Influence of Planning Risk
The study applied before used the 10th percentile of the lowest voltage as a performance indicator. This can be interpreted as a 10% planning risk. The effect of selecting the 1st, 5th, 15th, or 20th percentiles on the hosting capacity for EV charging was studied. The results for single-phase (3.7 kW) and three-phase (11 kW) charging power is shown in
Figure 10.
The 10th percentile in
Figure 10 is the reference case. The figure clearly shows that stricter planning risk decreases the hosting capacity. There is an 18% and 49% decrease in the EV hosting capacity for three-phase and single-phase when the planning is reduced from 10% to 1%. Higher planning risk increases hosting capacity, but the effect is lower than for lower-risk, especially three-phase charging.
The planning risk has a bigger influence on the single-phase hosting capacity (blue line).
5. Discussion
The EV charge hosting capacity in
Section 4 estimates how many simultaneous customers can charge in a distribution network, considering undervoltage as the limiting factor. The method is applicable for any period of interest for the DSO and can bring out the bottlenecks for EV charging that could instill investment for future growth. The method presented can be utilized for making planning decisions regarding estimated hosting capacity without detailed knowledge of the charging patterns of the customers. DSOs typically take a certain risk when planning distribution networks. The method can also be used with varying planning risks shown in this paper, to make a trade-off between the risk of bad voltage quality (insufficient investment) and stranded assets (too much investment). The planning risk is essential, and efforts are needed to ascertain what the DSOs apply or a range of values to streamline the approach.
The presented results show that, for both example networks, the hosting capacity is higher for three-phase than for single-phase charging. It was also found to vary a lot for the range of the charging powers expected to appear in the coming years. There is a need to extend the studies to more distribution networks to verify the observations in this paper. The adapted PV hosting capacity method has been applied to two illustrative distribution networks. More distribution networks should be studied to obtain more general trends.
The method can be applied as an extension for calculating the hosting capacity as a function of time of day, week, or year. There is a need to apply the method for such other applications. In that way, the best periods for charging can be identified and used in designing smart charging mechanisms.
There are some challenges with the method and uncertainties in the output (not to be mixed up with the uncertainties in input). The results are stochastic, and their interpretation can often lead to uncertainties. It was also shown that both background voltage and consumption have a big impact on the hosting capacity. However, these are often not known and require detailed measurements. Data collection becomes important in order to estimate the hosting capacity accurately.
Fast charging in public with electric buses and trucks has not been assessed in this study. These are expected to be connected to the MV network and will have their main impact there. Further studies are needed for fast (public) charging, charging of electric buses and electric trucks. However, similar methods as applied in this paper can be applied for such studies.
The approach in this paper has considered the undervoltage phenomenon. Stochastic methods for estimating the hosting capacity of transformer and feeder overload are also needed. Their addition to the method proposed in this paper can inform the DSO of the two phenomena that are most likely to limit EV charging penetration in distribution networks.
6. Conclusions
A stochastic approach has been proposed and applied to evaluate distribution networks’ hosting capacity for EV charging. An important application of the approach is relevant to future planning and investment decisions in distribution networks. The approach is non-specific and can be used for any time of day, week, or year, without detailed knowledge of the charging patterns.
The results obtained by applying the method to two existing low-voltage networks showed that the EV charge hosting capacity is sensitive to the lowest background voltage, highest power consumption, and planning risk. It is recommended to apply the method to more distribution networks, including medium-voltage networks, and to commence data collection to obtain input for stochastic hosting capacity studies.


