Article

A Study of Real-Time and Satellite Data of Atmospheric Pollutants during Agricultural Crop Residue Burning at a Downwind Site in the Indo-Gangetic Plain

Department of Chemistry, Faculty of Science, Dayalbagh Educational Institute, Agra 282005, India
*
Author to whom correspondence should be addressed.
Pollutants 2023, 3(1), 166-180; https://doi.org/10.3390/pollutants3010013
Submission received: 31 December 2022 / Revised: 23 February 2023 / Accepted: 5 March 2023 / Published: 7 March 2023

Abstract

:
Crop residue burning emits a variety of air pollutants that drastically affect air quality, both locally and regionally. To study the impact of crop residue burning, in the present study, concentrations of particulate matter (PM2.5), trace gases (tropospheric ozone (O3), nitrogen oxides (NOx), carbon monoxide (CO), and volatile organic compounds (VOCs)) were recorded in Agra, a suburban downwind site. The study was conducted during the pre-harvest (15 September to 5 October 2021) and post-harvest periods (6 October to 10 November 2021). During the post-harvest period, PM2.5 concentrations were recorded to be three to four times higher than the NAAQ Standards (35 µg/m3), while O3 and VOC concentrations showed an increment of 16% and 30.4%, respectively. NOx and CO concentrations also showed higher levels (19.7 ± 7.5 ppb and 1498.5 ± 1077.5 ppb) during this period. Moderate resolution imaging spectroradiometer (MODIS), along with air mass backward trajectory analysis (HYSPLIT Model), were used to detect fire hotspots that suggested that the enhanced pollutant levels may be due to the burning of crop residue in agricultural fields over the northwest Indo-Gangetic Plain (NW-IGP). Field emission scanning electron microscopy with energy dispersive X-ray spectroscopy (FESEM-EDX) analysis showed high K concentrations during the post-harvest period, which may be attributed to crop residue burning or biomass combustion.

1. Introduction

Air quality deterioration and associated health risks are a major concern. Air pollutants at any place have a natural, anthropogenic, or mixed origin. Natural sources are forest fires, volcanic eruptions, dust, sea-salt spray, and volatile organic compounds (VOCs) from plants, while anthropogenic sources are industries, exhaust emissions from vehicles and thermal power plants. Their release in the atmosphere enhances pollutant levels [1,2]. Further, crop residue burning also increases pollutant levels as farmers do not have any economic methods for the disposal of crop residue; hence, they prefer its burning, which is the easiest and most cost-effective option for farmers [3,4,5]. In rural areas, crop residue burning activities are common and occur seasonally, in turn significantly influencing the urban air quality, leading to severe air pollution episodes such as smog and haze events [6,7]. The smoke plumes which originate from agricultural crop residue burning transport particulate matter (PM), carbon dioxide (CO2), nitrogen oxides (NOx), carbon monoxide (CO), and VOCs [8,9].
Crop residue and biomass burning events have globally caused significant impact on human health, the environment, and ultimately, climate change [10,11,12]. Crop residue burning emissions were estimated from field surveys and combustion experiments by Han et al. [13] to assess the impact of crop residue burning on particulate matter over South Korea. They calculated that crop residue burning emissions contribute 9514, 8089, 4002, 2010, 172,407, 7675, 33, and 5053 Mg year−1 for PM10, PM2.5, OC, EC, CO, NOx, SO2, and NH3, respectively. Huang et al. [14] reported total VOCs and NOx emissions from open crop straw burning in 2018 at 798.8 Gg and 80.6 Gg, respectively, with high emissions in northeast China (31.7%) and north China (23.7%).
Crop residue burning is practiced to clear land for the next crop. Major burning activities (biomass burning) occur in the tropics—largely in Southeast Asia, especially India and China, and in South American forests [15,16,17,18]. Ravindra et al. [10] reported that in 2017, India generated 488 Mt of total crop residue, which led to the release of an enormous amount of particulate matter (PM2.5; 824 Gg), elemental carbon (EC; 58 Gg) and organic carbon (OC; 239 Gg).
In India, the Indo-Gangetic Plain (IGP) is a hotspot of seasonal crop residue burning activities and immense air pollution, which cause adverse effects on human health, visibility, air quality and climate [19,20]. Severe deterioration of air quality was reported in the Indian capital city of Delhi in 2016 and 2017, due to emissions from excessive crop residue burning events (50% to 70%) in the states of Punjab and Haryana, along with emissions that originated from other sources, such as vehicles, industries, and fossil fuel burning [19,21]. Vijayakumar et al. [22] reported that massive crop residue burning formed a thick haze over the IGP and worsened regional air quality.
The oxidative capacity of the various trace gases is influenced by emissions in the atmosphere [11,12]. This may be due to the reaction of OH and NO radicals leading to the formation of ozone and other photo-oxidants [23]. Particulate matter causes the formation of CCN (cloud condensation nuclei) by the absorption and scattering of solar radiation [24]. Smoke released during crop residue burning affects human health by causing skin disorders, cough, asthma, bronchitis, and conjunctivitis [25]. The relationship between morbidity and mortality with biomass burning has been reported in various toxicological and epidemiological studies [26].
Regional transport of air pollutants and seasonal crop residue burning activities in rural areas cause harmful effects on human health and worsen the air quality. Long-term and short-term exposure to particulate matter (PM) has been consistently associated with several adverse health effects, including respiratory disorders, cardiovascular diseases, neurological disorders, adverse birth outcomes, and increased lung cancer risk [27,28].
There is a lack of reliable data on the impact of crop residue burning in Agra, a site downwind of the major crop burning states of Punjab and Haryana. To fill this void, the present study was planned to investigate the concentrations of air pollutants (PM2.5, O3, NOx, CO and VOCs: benzene, toluene, ethylbenzene and xylenes (BTEX)), along with satellite data during crop residue burning to better understand its impact on air quality. The influence of long-range transport was also studied using the HYSPLIT model. The findings of the current study will be helpful in the identification and comparison of air pollutant variation at a site (Agra, downwind from the fire active region and approximately 600 km southeast of Punjab) during the crop residue burning period. It will enable us to develop proper planning and policies for comprehensive air quality improvement strategies to reduce air pollutant levels.

2. Materials and Methods

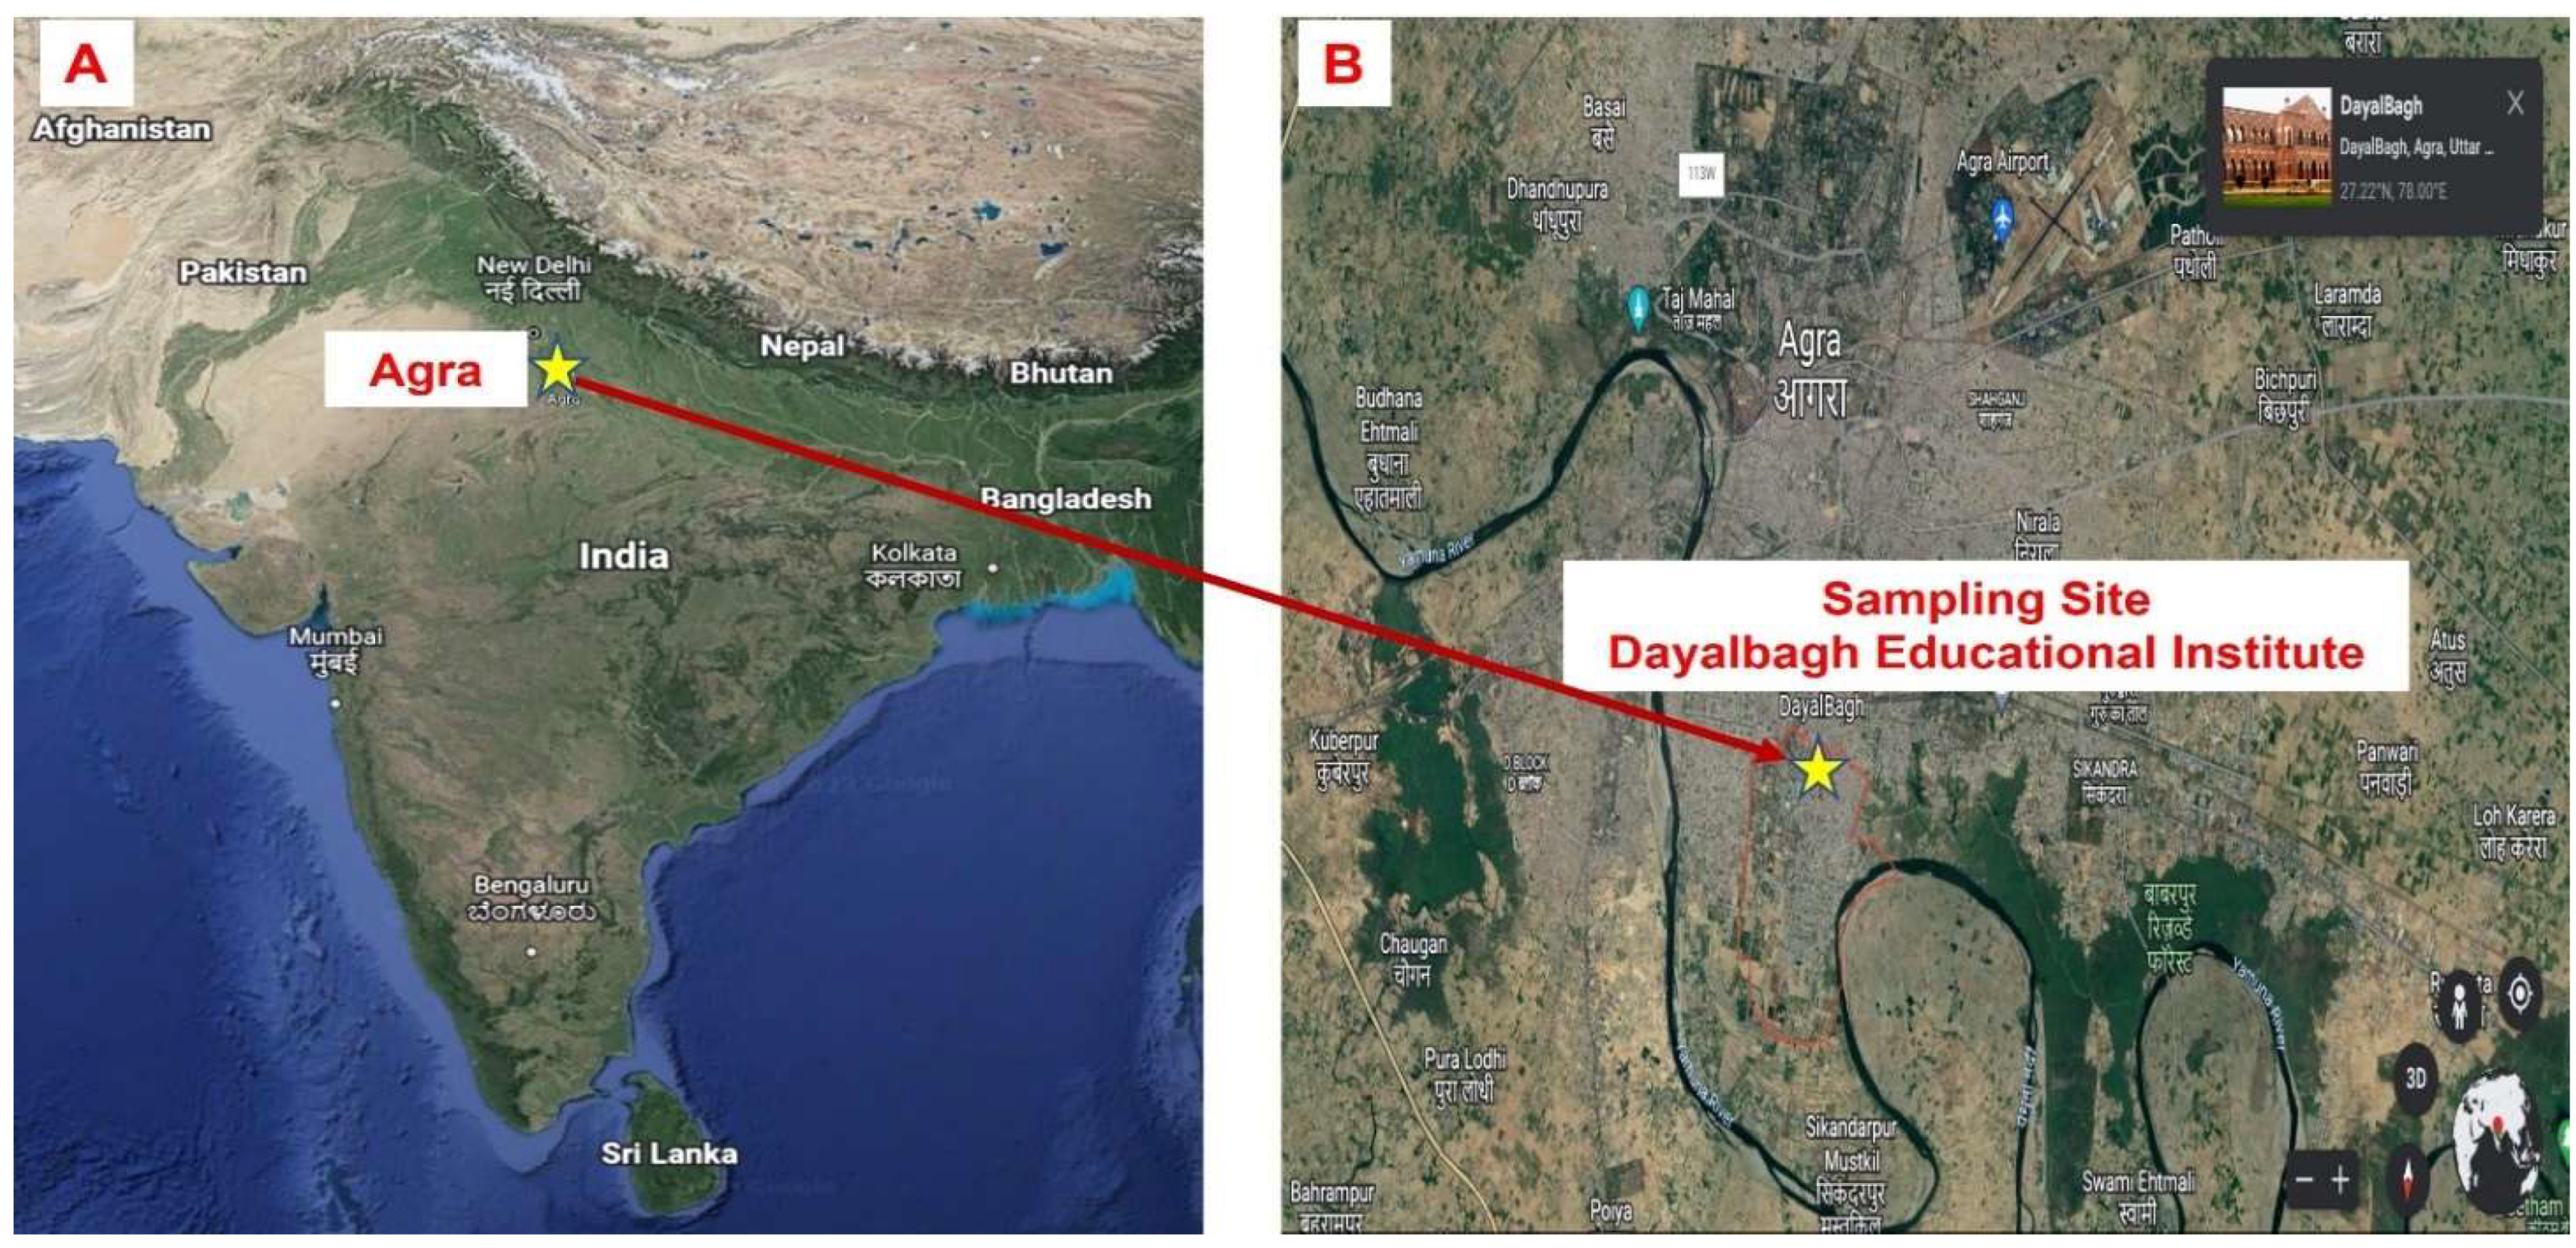
2.1. Sampling Location

Agra, a downwind site, is located in the north-central part of India, approximately 200 km southeast of Delhi, and lies in the center of the Indo-Gangetic Plain. Sampling was carried out at Dayalbagh Educational Institute (DEI), Dayalbagh (a suburban site), Agra (Figure 1) along with monitoring of satellite data, simultaneously for two time periods: the pre- harvest period (15 September to 5 October 2021), and the post-harvest period (6 October to 10 November 2021).
Agra’s climate is hot and dry during summer and cold in winter. Rainfall is scanty, with 90% received during the monsoon season. In the winter season, calm and stable conditions are observed, while during the summer and monsoon, strong surface winds blow. In the summer season, high temperatures (25 to 45 °C) and low relative humidity (14 to 50%) are recorded, while in the winter season, low temperatures (3 to 20 °C) and high relative humidity (56 to 90%) are observed (shown in Table S1) [6]. There is no industrial activity around the sampling site as the main city is approximately 6 km south. The National Highway is approximately 2 km and Mathura oil refinery approximately 45 km away from the study site.

2.2. Instrumentation and Analysis

2.2.1. Sampling and Measurement of Trace Gases (O3, NOx and CO)

The concentration of surface O3, NOx and CO was measured through continuously operating O3 (Thermo Fisher Scientific Model 49i), NOx (Thermo Fisher Scientific Model 42i) and CO (Teledyne T300) analyzers, respectively. The analyzers record concentrations on an average time of 1 min using ENVIDAS software; the 1 min average concentrations are further integrated to obtain 1 h average concentration. A detailed description of the measurement and calibration of the instrument are discussed elsewhere [6,26,27,28,29,30]. The calibration of the analyzers was performed using a dynamic gas calibrator and zero air generator (Teledyne, T700) weekly and monthly, using NIST standards [6,30].
Meteorological parameters (wind speed, wind direction, temperature, relative humidity and solar radiation) were recorded using a data logger (WM271, an automatic weather station) installed on the roof of the sampling site at 1 h intervals.
The PM2.5 concentrations were taken from the Central Pollution Control Board (CPCB) website (https://app.cpcbccr.com/ccr/#/caaqm-dashboard-all/caaqm-landing/data, accessed on 30 December 2022) for the station Sanjay Place, Agra, Uttar Pradesh. In addition, a few representative PM2.5 samples were collected at the Dayalbagh Educational Institute using a Fine Particulate Sampler (Envirotech APM 550) operated at a constant flow of 16.6 L per minute on pre-weighed 47 mm quartz fiber filters (Pallflex, Tissuquartz). In order to eliminate organic impurities, filters were desiccated for 24 h after being pre-treated in a muffle furnace for 4 h at 800 °C. To reduce the impact of humidity on gravimetric mass, filters were weighed on an electronic microbalance after equilibrating in a desiccator for 1 day (Mettler Toledo). By comparing the filter weights, PM mass concentrations were determined.

2.2.2. Sampling and Analysis of Benzene, Toluene, Ethylbenzene and Xylenes (BTEX)

Sampling of benzene, toluene, ethylbenzene and xylenes (BTEX) was carried out using an activated charcoal tube with a SKC pump (Model 224-PCXR8) at a flow rate of 100 mL/min for 1 h. Samples were collected six times a day and thrice a week by following the National Institute for Occupational Safety and Health (NIOSH) 1003 and 1501 methods. In order to study the diurnal variation, one-hour samples (30) were collected, at an interval of four hours. A detailed description about the sampling and storing procedure is reported in Kumari et al. [26] and Verma et al. [29]. Analysis of the desorbed samples was carried out by a 5977B gas chromatography mass selective detector/flame ionization detector (GC-MSD/FID, Agilent Technologies, USA). The GC oven was programmed as: 3 min hold at 50 °C and first ramp to 140 °C at a rate of 10 °C/min with 1 min hold, and second ramp to 240 °C at a rate of 20 °C/min with 1 min hold. The selective ion monitoring (SIM) mode was considered in MSD for the detection of BTEX.
The external calibration standard mixture (MISA non-halogenated volatiles group 17 mix) procured from Sigma-Aldrich was used for calibration. Six dilutions of standard solution (1000 ppm) in methanol were used to obtain a calibration curve. The standards of BTEX were prepared in the range of 0.05 to 25 ppm.
In order to ensure high quality data, appropriate control measures were followed in the laboratory during the operation of the instruments (NOx, CO, O3 analyzers and GC-MS). Unexposed charcoal tubes were run without sampling following the same extraction method as for the samples. The samples were run thrice to check the repeatibility and recoveries were estimated to be 90% to 99%. Analytical errors were calculated in terms of relative error and relative standard deviation. The relative errors of benzene, toluene, ethylbenzene, m, p-xylene and o-xylene measurements were 1.2%, 4.7%, 5.9%, 4.0% and 4.5%, respectively. The relative standard deviation of benzene, toluene, ethylbenzene, m, p-xylene and o-xylene measurements were 1.9%, 5.9%, 7.0%, 4.9% and 4.2%, respectively. Calibration of the O3 analyzer was done weekly by an in-built ozonator and multipoint calibrator (Teledyne T700); however, NOx and CO were calibrated with a multi point calibrator using NIST certified standards (40 ppm) [30].

2.2.3. Field Emission Scanning Electron Microscopy with Energy Dispersive X-ray Spectroscopy (FESEM-EDX) Analysis

Field emission scanning electron microscope (FESEM, JSM-7610F Plus, JEOL, Tokyo, Japan) equipped with an energy dispersive X-ray spectrometer (EDX, Oxford Instruments, Oxford, UK) working with AZTEC software was employed to study the elemental composition, morphology, and optical properties of the collected particles. The sample filter papers were cut into 1 mm2 pieces and fixed with carbon tape mounted on electron microprobe stubs. After this, samples were sputter-coated with platinum in an auto-fine platinum coater (JEC-3000 FC, JEOL, Tokyo, Japan). The working conditions were set at a magnification power of 10,000X and accelerating voltage 5 to 15 kV for the analysis.

2.2.4. MODIS Active Fire Locations

The moderate resolution imaging spectroradiometer (MODIS) onboard Aqua and Terra satellite data was used from the Fire Information for Resource Management Service (FIRMS) website (https://firms.modaps.eosdis.nasa.gov, accessed on 30 December 2022) [31]. The major agricultural area (26° to 33° N and 72° to 80° E), including the states of Haryana and Punjab, was included in the area chosen to monitor crop residue burning activities.

2.2.5. Trajectory Analysis

The air mass back trajectories were simulated from the National Oceanic and Atmospheric Administration (NOAA) Hybrid Single-Particle Lagrangian Integrated Trajectory (HYSPLIT) model which is based on the GDAS Meteorological Data [9]. The trajectories were set up at 500 m above ground level and run for 72 h.

3. Results and Discussion

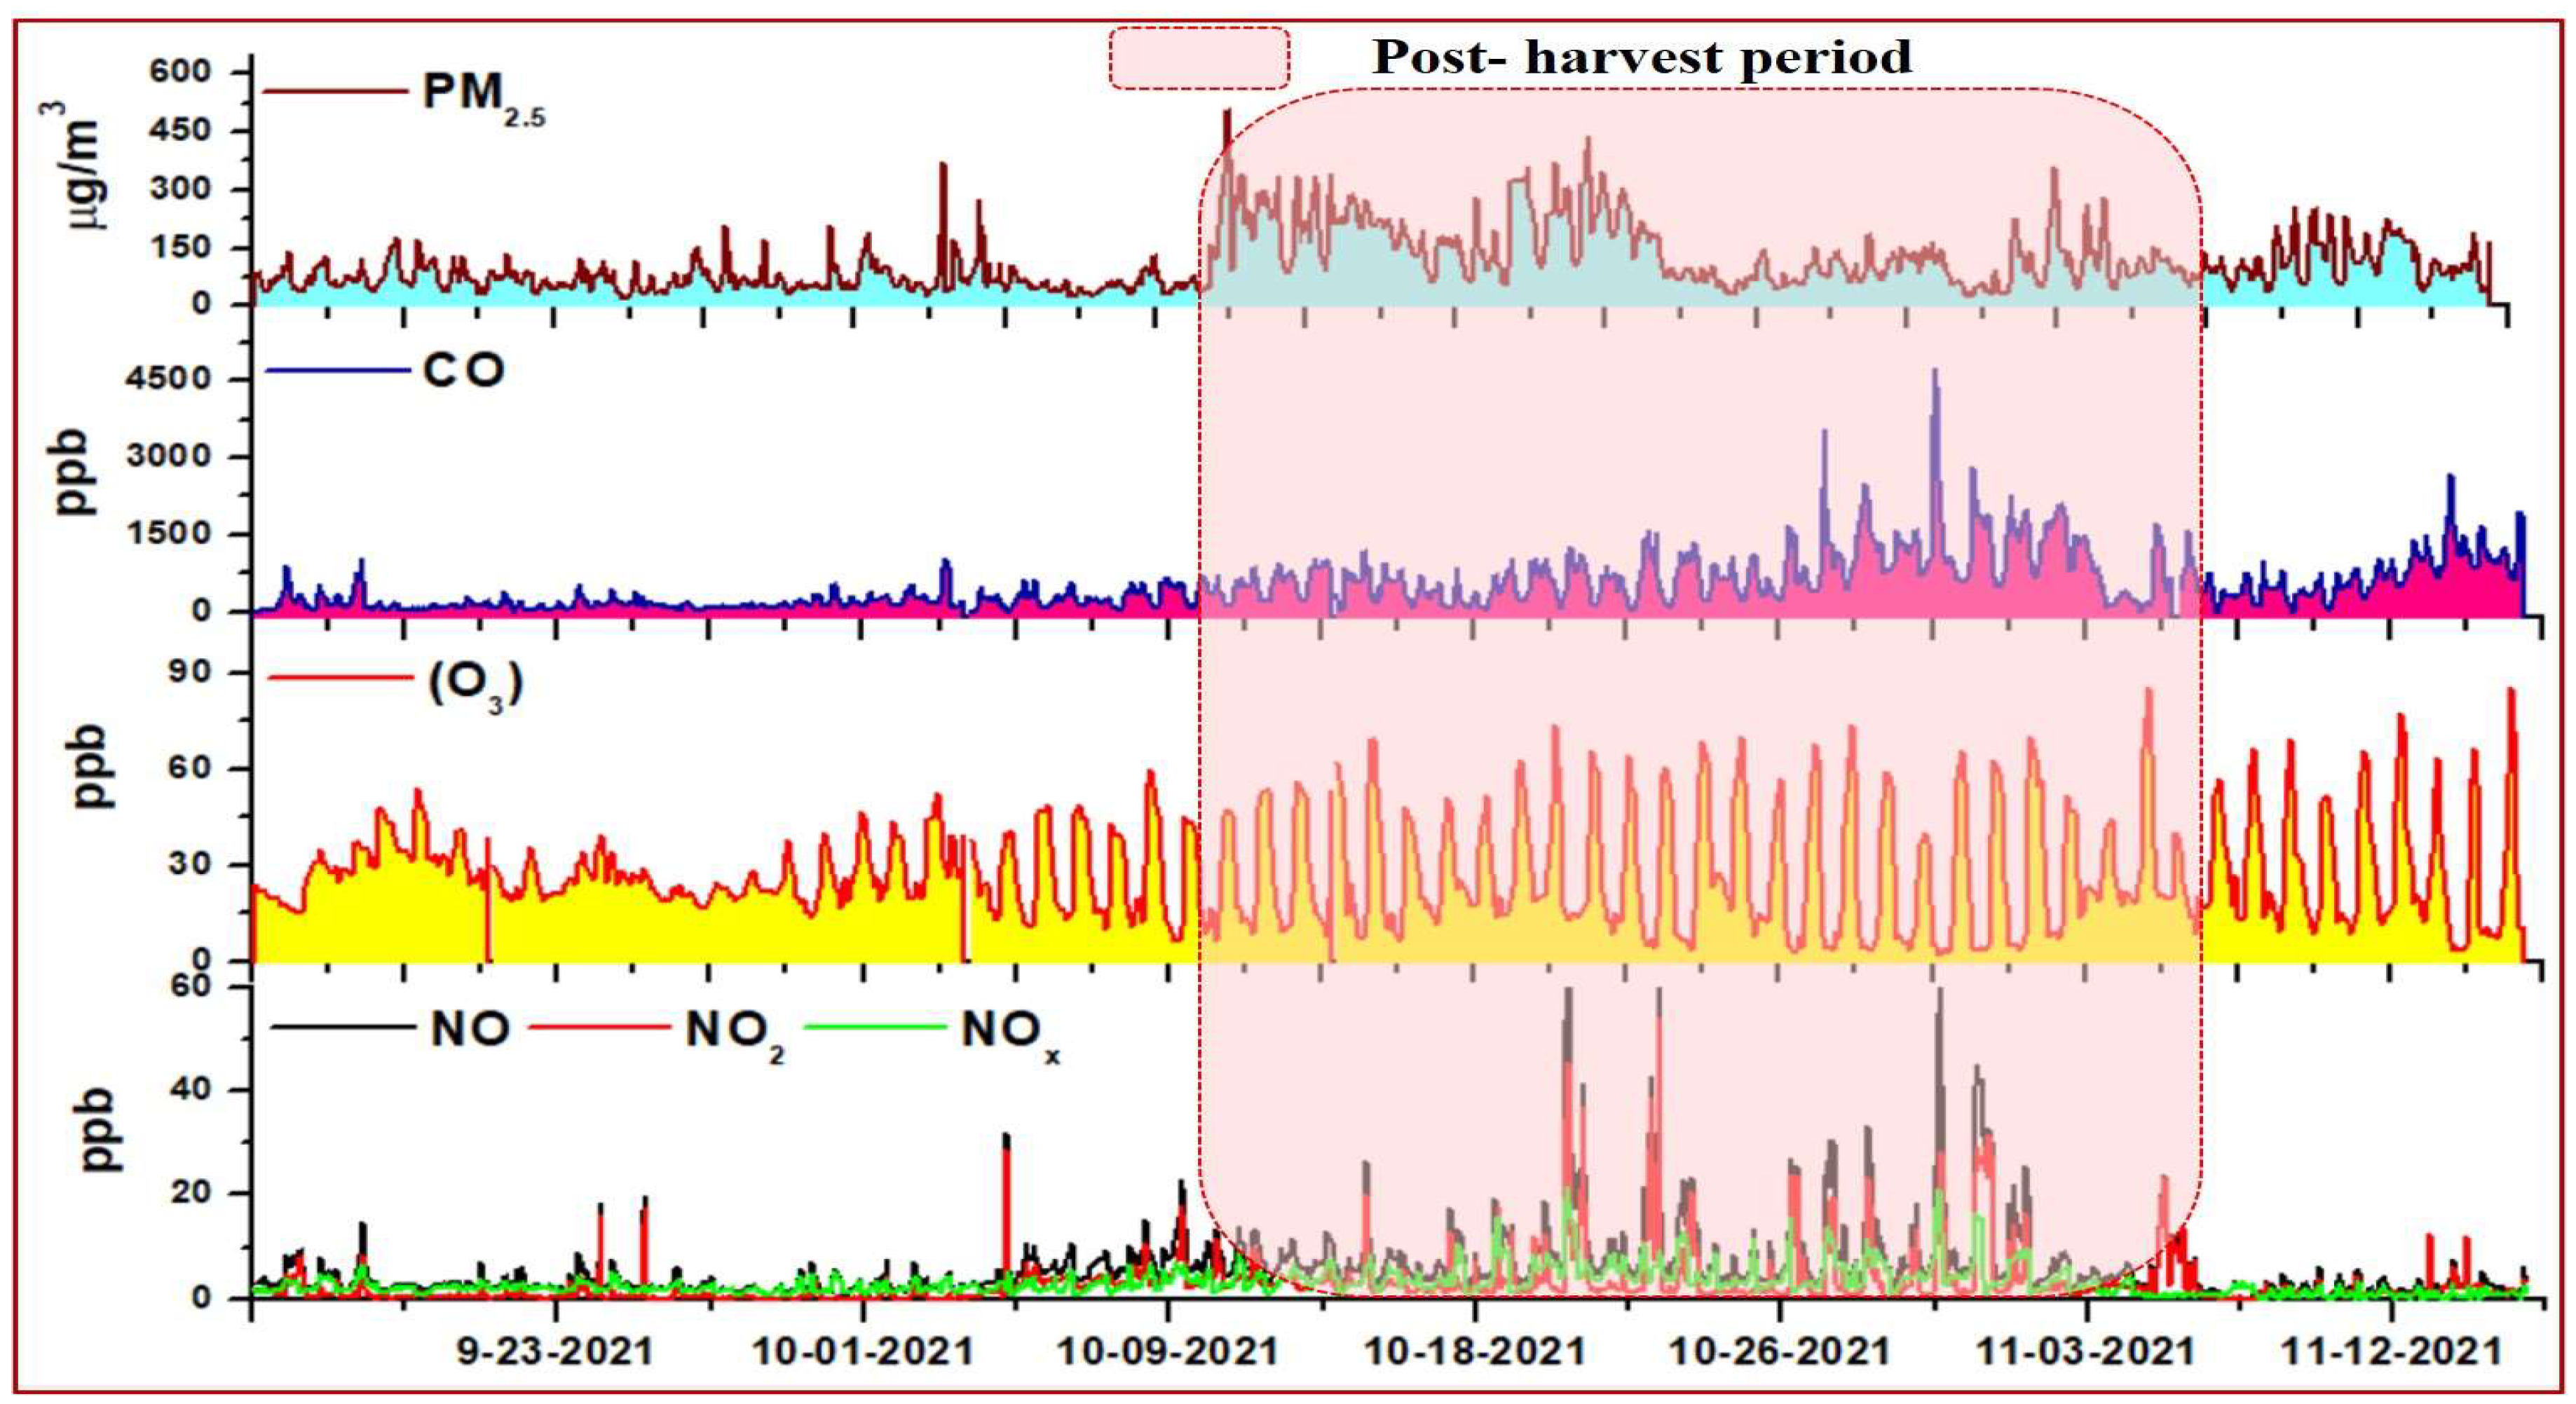
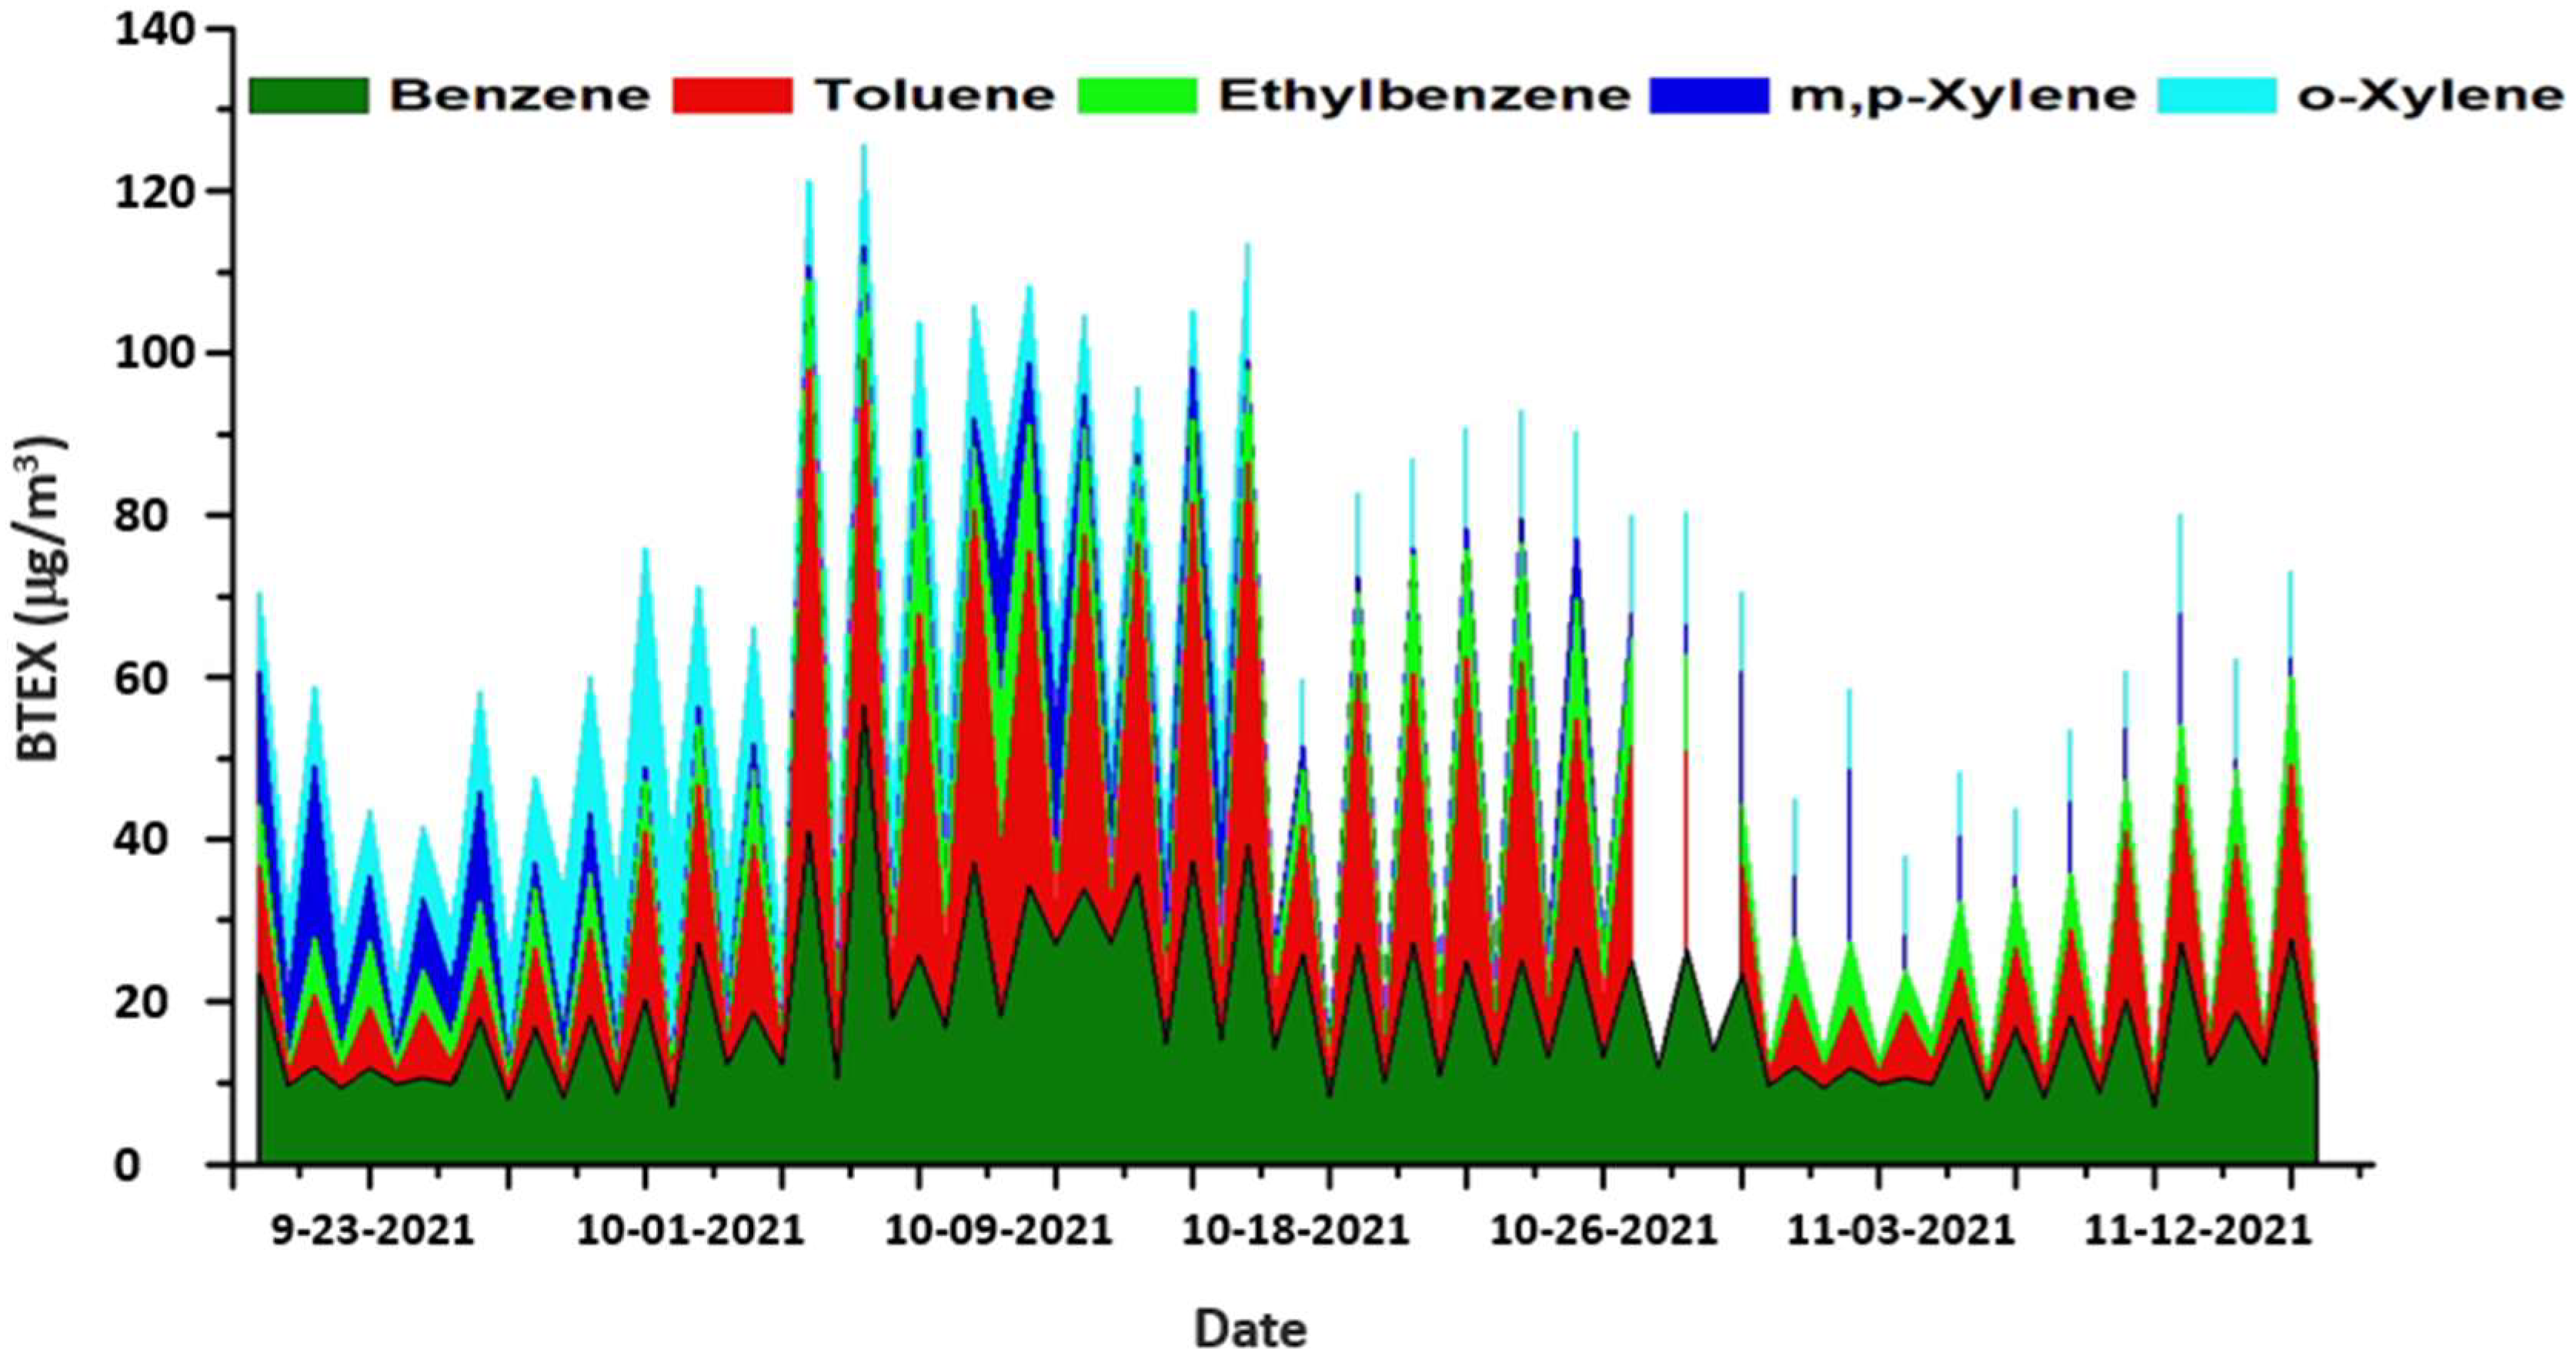
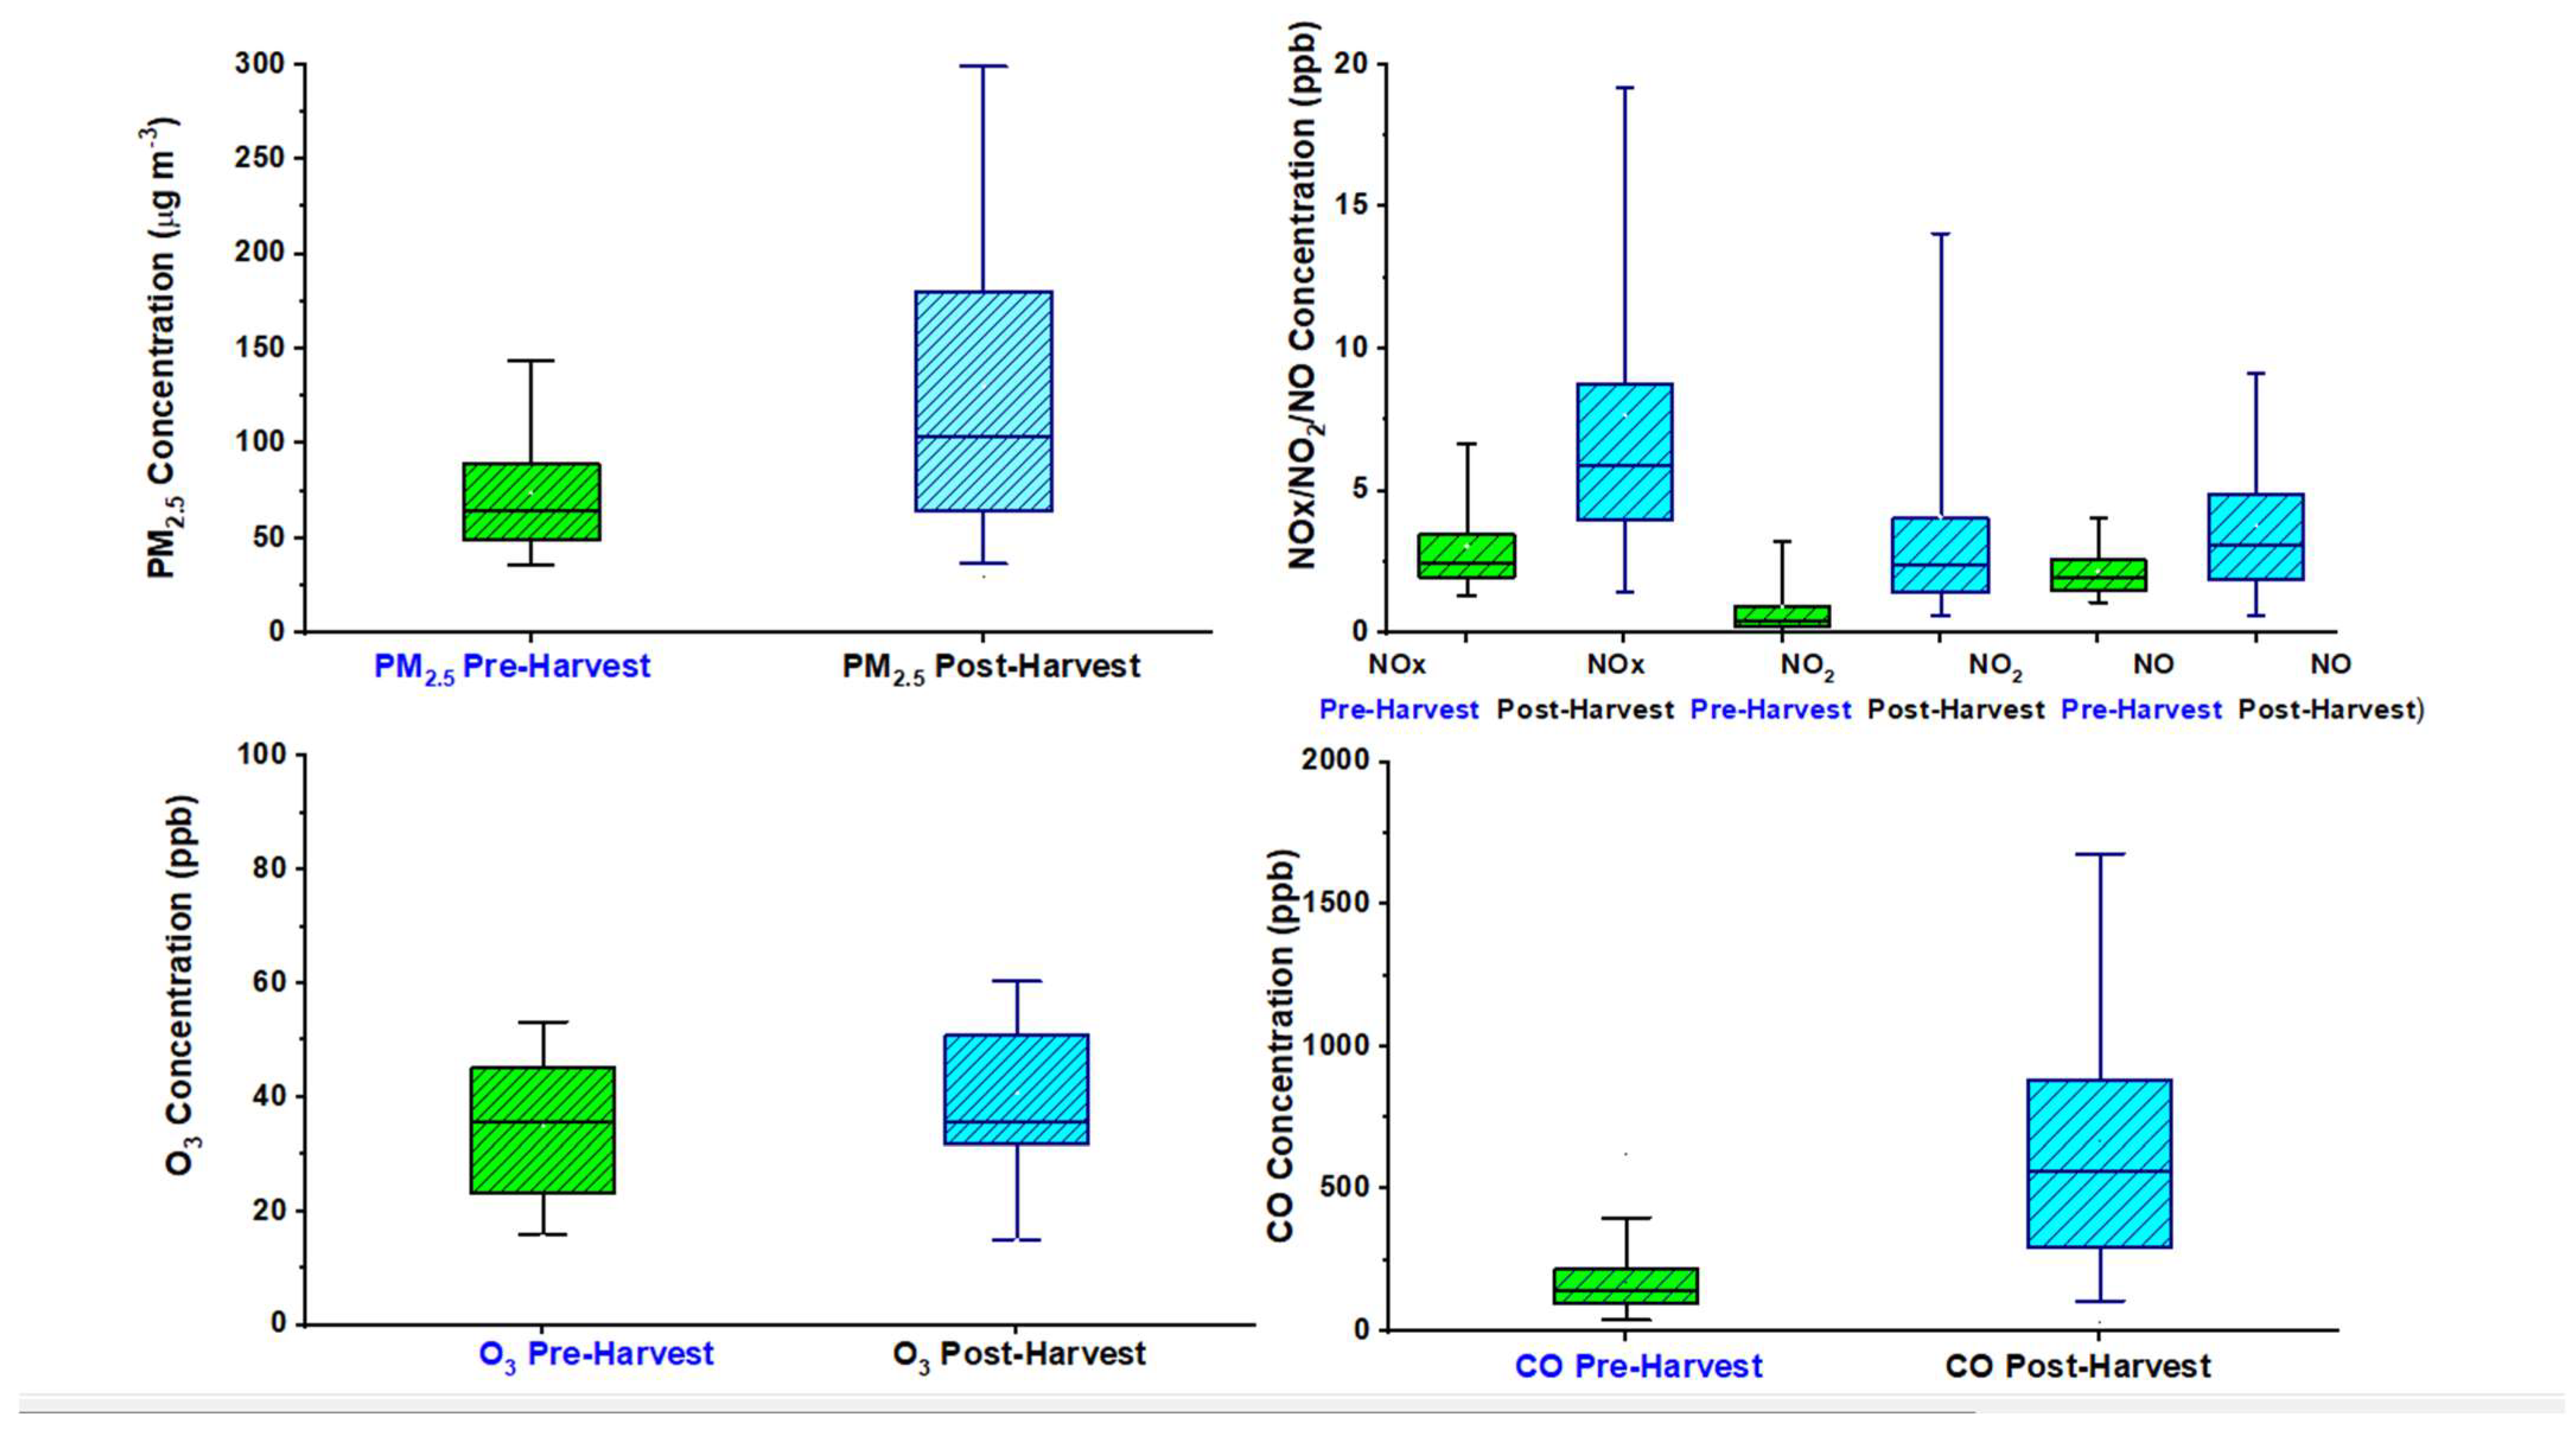
3.1. Concentration of Pollutants (PM2.5, Trace Gases and VOCs)

The quantity of trace substances released when crop residue is burnt depends on the type of crop, the moisture content of the crop, and the burning environment, including the ambient temperature, humidity, and wind speed [32]. The incomplete combustion of crop residue emits different kinds of pollutants such as PM2.5, NOx, CO and VOCs [33]. Trace gases, VOCs and aerosols modulate the atmospheric chemistry, causing a bad impact on air quality at local and regional levels.
During the pre-harvest period, the hourly average concentration of NOx ranged from 4.3 to 15.6 ppb with an average concentration of 10.4 ± 5.3 ppb, while during the post-harvest period, it ranged from 11.7 to 58.5 ppb with an average concentration of 19.7 ± 7.5 ppb (Figure 2). There were statistically significant differences in the NOx concentrations (p = 0.01) of the pre- and post-harvest periods. In order to compare NO2 concentrations with the satellite data, the tropospheric NO2 column data product (OMNO2) estimated for this study is based on the ground, as well as aircraft, measurements [34].
Figure 3 shows tropospheric columnar NO2 gridded at 0.25° × 0.25° during pre-harvest period and post-harvest periods, indicating the higher NO2 value during the post-harvest period, as observed by the tropospheric monitoring instrument (TROPOMI) aboard the Sentinel-5 Precursor satellite. The satellite data conforms with the measured concentrations and shows similar results [35].
CO is regarded as a tracer of biomass burning and long-range transport [26,36]. During the pre-harvest period, the hourly average concentration of CO ranged from 225.0 to 998.6 ppb with an average concentration of 709.4 ± 481.7 ppb; during the post-harvest period, it ranged from 856.8 to 1980.5 ppb, with an average concentration of 1498.5 ± 1077.5 ppb (Figure S1). CO concentrations showed statistically significant differences (p = 0.01) during pre- and post-harvest periods. Kumari et al. [6] also reported CO enhancement from 458.9 ppbv in pre-harvest to 644.8 ppbv in the post-harvest period over Agra. Satellite observation further corroborated the existence of high surface CO greater than 300 ppbv during a severe air pollution episode (1–7 November 2016) over Delhi [37]. In addition, in the central Himalayas, a high-altitude station experienced enhanced CO concentrations by 26 to 117 ppbv (15–76%) and NOy by 246 to 1375 pptv (35–51%) due to biomass burning during the spring season in 2009–2011. This led to CO and NOy levels up to 1300 ppbv and 8000 pptv, respectively [38]. At Dehradun, Yarragunta et al. [39] reported CO enhancement (34–56%) and NOx (32–52%) from forest fire events through model simulations over the Himalaya foothills during the spring season. Satellite observations during such events showed increased CO concentration (60–124 ppbv) in the upper troposphere. Extremely high CO levels up to 19 mg m−3 (~8700 ppbv) were also observed in November 2017 over the IGP (including the cities of Delhi, Agra, Kanpur, Lucknow, Patna and Kolkata) [40].
During the post-harvest period, O3 also showed a higher concentration similar to CO and NOx, as compared to the pre-harvest period. In the present study, an enhancement of 16% in ozone concentrations was observed during the post-harvest period (p = 0.04). A 39% increase in O3 levels was reported by Tang et al. [41] due to crop residue burning in Jiangdu, China. while a 34% increase in O3 levels was reported by Kumar et al. [42] due to biomass burning at Nainital in the northwest Indo-Gangetic Plain (NW-IGP). Similar O3 enhancement at this site was observed in the noontime which may be due to the higher emissions of primary pollutants (PM, NOx and VOCs) from the northwest direction (the direction of crop residue burning from Punjab and Haryana) (Figure 2). These pollutants further undergo photochemical reactions and form surface ozone. Ojha et al. [43] also reported the springtime maximum O3 (39.3 ± 18.9 ppbv) over Pantnagar, a semi-urban site in the IGP that was influenced by Haryana-Punjab crop residue burning. Such a photochemical build-up of O3 depends on the amount of precursor gases and available solar isolation.
The average BTEX concentration for pre-harvest period was 76.6 ± 27.1 μg/m3, which increased to 110 ± 77.1 μg/m3 in the post-harvest period. The variation of BTEX concentration during pre-harvest and post-harvest period is presented in Figure 4. Among BTEX, toluene (30.3 ± 8.4 μg/m3) and benzene (34.3 ± 10.6 μg/m3) were the most abundant species during post-harvest at the study site. The total percentage increase of BTEX during the post-harvest period was 43.6%. The release of VOCs during crop residue burning may be associated with the accumulation of volatile constituents in the tissues and leaves of plants [44]. Biogenic VOCs are thus chiefly emitted due to increased temperature and wounding during burning [45].
Very few studies have reported the impact of VOCs on crop residue burning. Chandra and Sinha [17] reported average concentrations of 2.51 ± 0.28 ppb and 3.72 ± 0.41 ppb of benzene and toluene, respectively, during the post-harvest period in the NW-IGP region, roughly 1.5 times higher than their annual average concentrations at Mohali. Pandey et al. [46] also reported that agricultural residue burning is the most dominant source, among the several biomass burning sources, contributing 72% of toluene. Venkataraman et al. [47] estimated 1818–6767 Gg/year non-methane volatile organic compound (NMVOC) emissions from the crop residue burning all over India. Jain et al. [19] reported emissions of 1.46 Mt NMVOC and 0.65 Mt of NMHC in the state-wise inventory prepared for crop residue burning in India for the year 2008–2009.
The average PM2.5 levels during the pre-harvest period were 58.9 ± 19.3 μg/m3, which increased to 145 ± 39.5 μg/m3, showing an increase of 146.2% during the post-harvest period and a statistically significant difference (p = 0.01). After the harvest period, the PM2.5 concentration slowly decreased, and the average concentration decreased to 75.3 ± 29.5 μg/m3.
The National Ambient Air Quality Standards (NAAQS) for PM2.5 annually and 24 h over India are 40 μg/m3 and 60 μg/m3, respectively. During the post-harvest period, PM2.5 concentration increased by 3–4 times than the NAAQ Standards of PM2.5 (24 h average). The cities of Delhi and Chandigarh, located in the NW-IGP, reported 7–20% and 8% increases, respectively, in PM2.5 from crop burning [2,48,49]. At Chandigarh, PM2.5 levels (191.1 μg/m3) were 3.5 times higher than the prescribed levels by the NAAQS. During the post-monsoon season, average PM2.5 concentrations increased in 2016 (571.9 μg/m3) compared to concentrations in 2015 (229.2 μg/m3) in Delhi [18]. Another study in Delhi also reported PM2.5 concentrations to vary from 17.2 to 1294.5 μg/m3 (mean and standard deviation of 212.4 ± 202.4 μg/m3) during the post-monsoon period (2016) [50]. The change in concentration of PM2.5 in Delhi may be attributed to crop residue burning activity that occurred in Punjab and Haryana during the post-monsoon season.

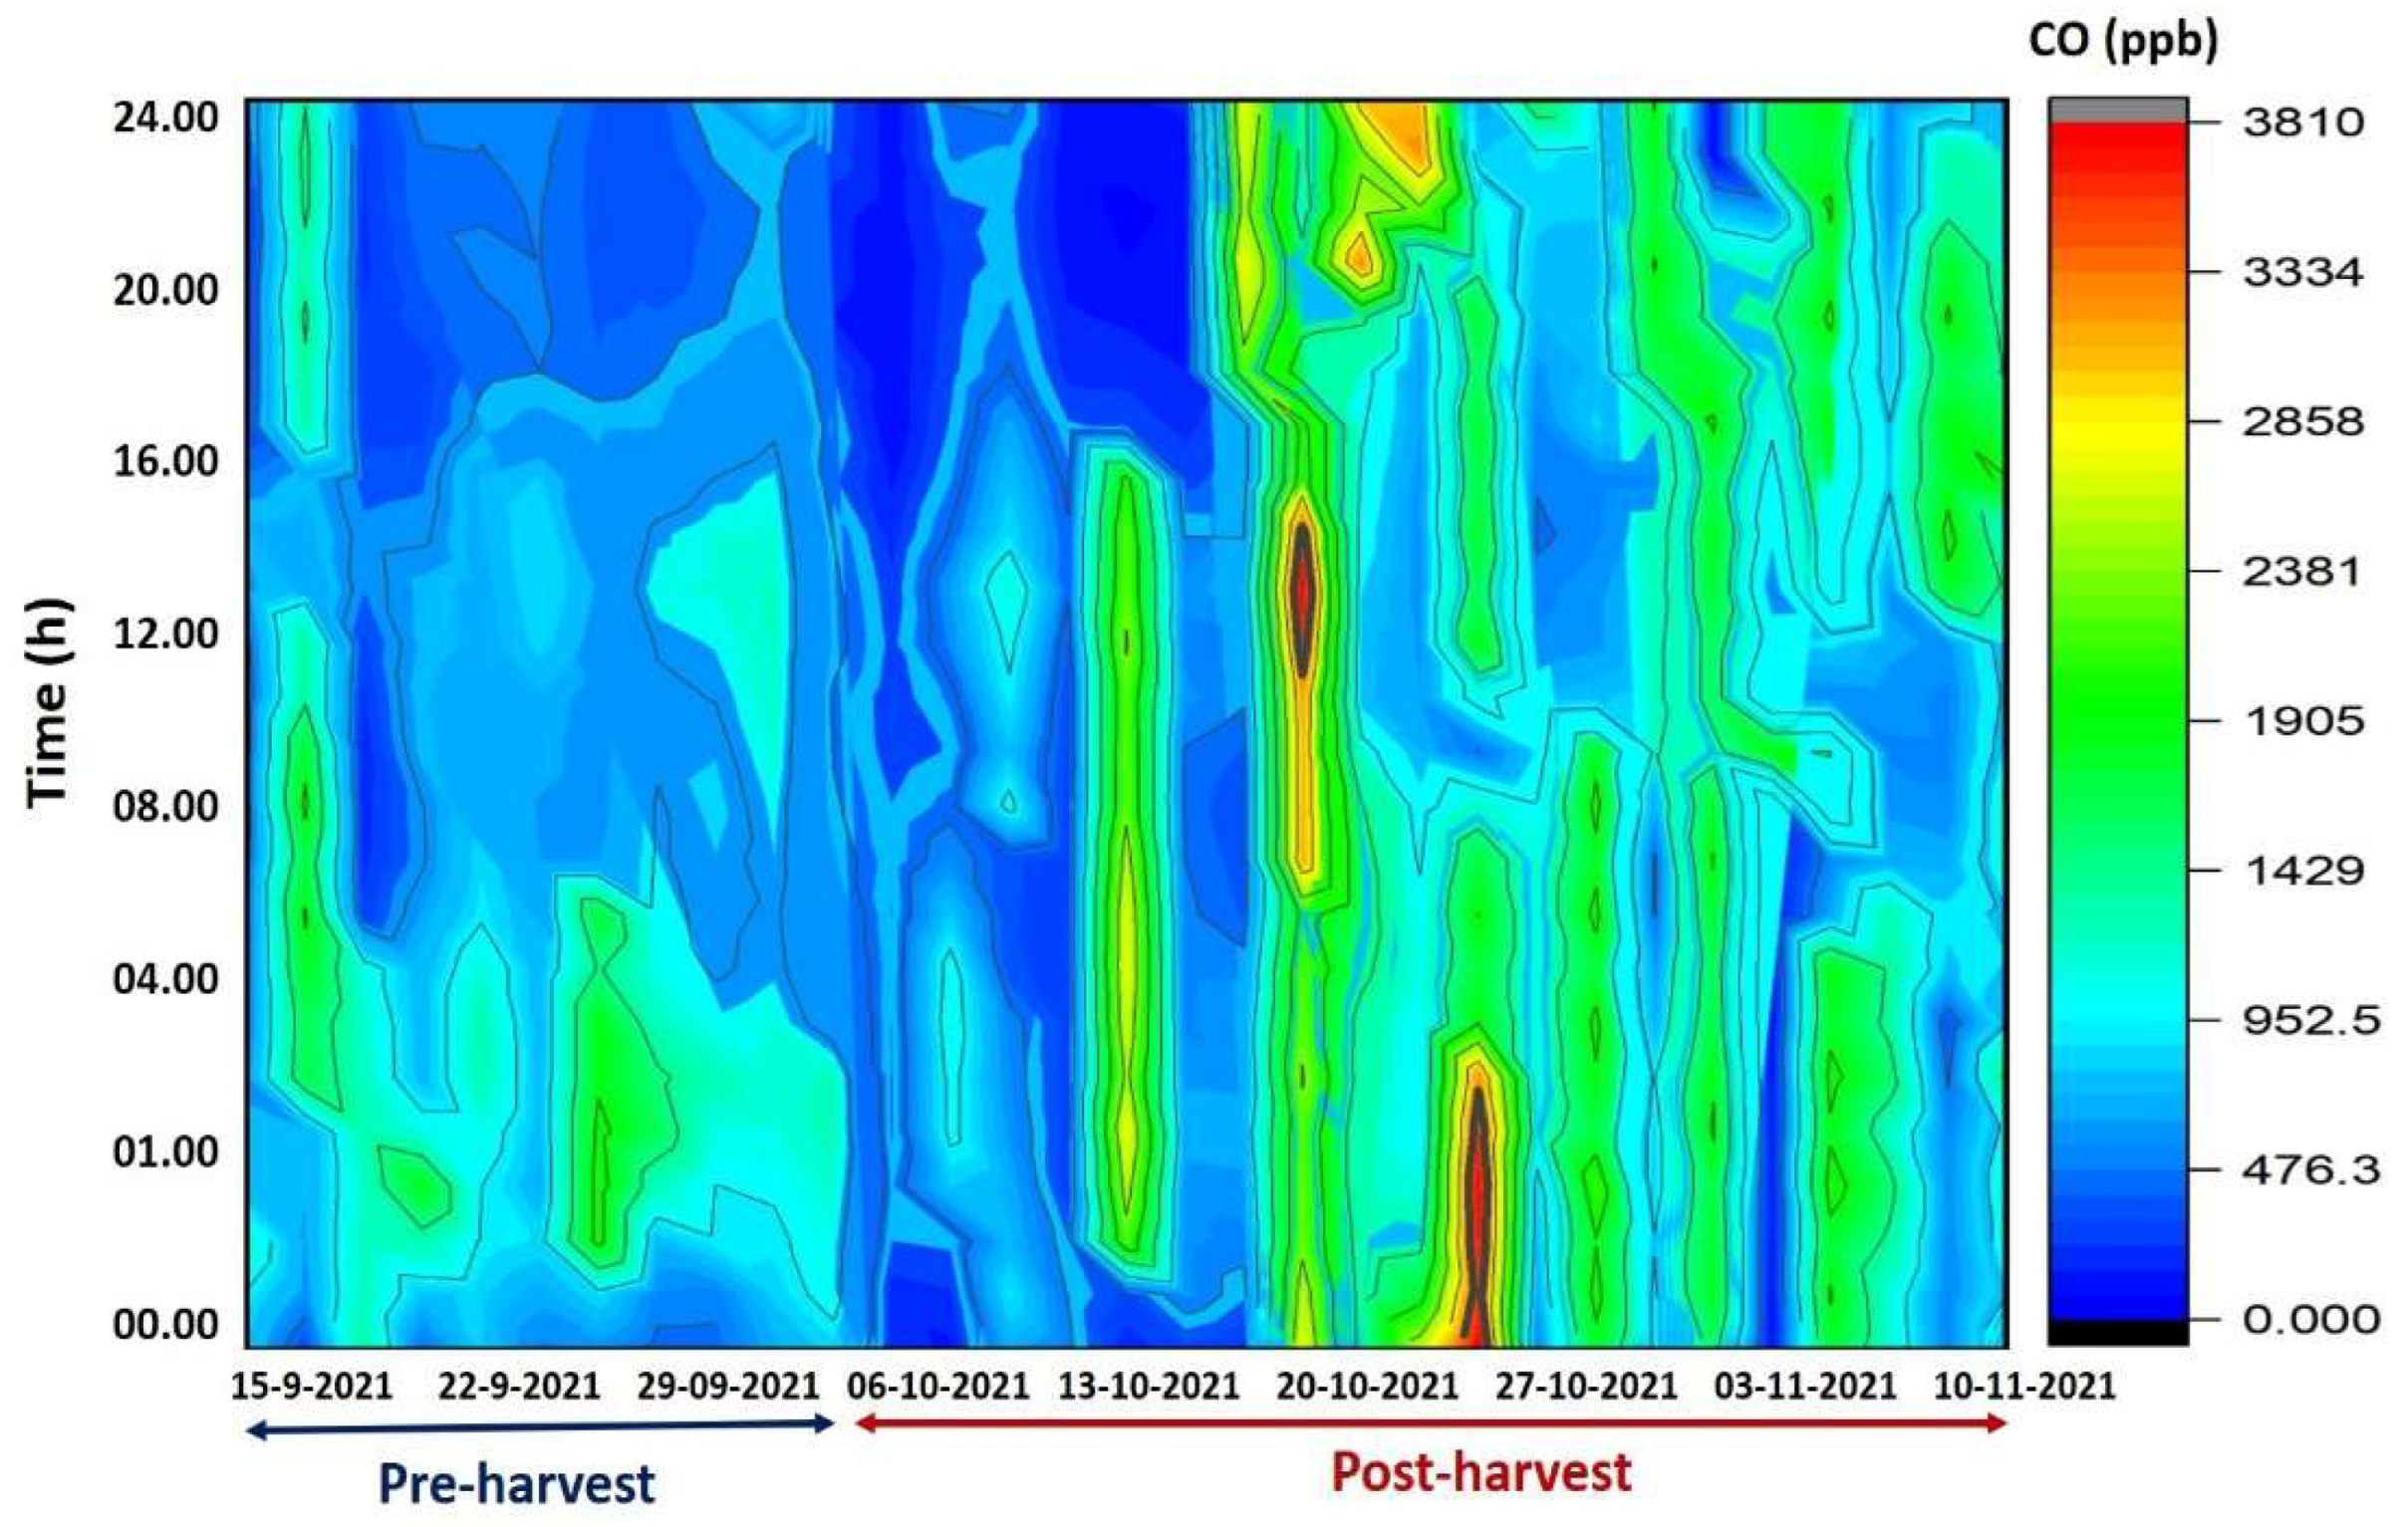
3.2. Temporal Variations in the Concentration of Pollutants during the Pre-Harvest and Post-Harvest Period

Temporal variation of various pollutants was studied during the pre-harvest and post-harvest periods. PM2.5 peaks were recorded in the late evening hours, between 6:00 to 10:00 p.m., both in the pre-harvest (47.7 μg/m3) and post-harvest period (130.8 μg/m3). Continued elevated levels of PM2.5 for 5–6 days during crop residue burning events were attributed to regional biomass burning activities, which emitted a large quantity of particles [7,50,51]. Figure S2 shows the O3 peak during daytime as the intensity of solar radiation was high and favored the formation of ozone, whereas the NOx and BTEX had small peaks during the morning hours (between 7:00 to 9:00 am) and large peaks during late evening hours (6:00 to 9:00 pm). During the post-harvest period (8:00 to 9:00 pm) average NOx increased to 19.9 ppb, which was approximately 10 ppb during the pre-harvest period, and average BTEX increased to 110 μg/m3 during this period (Figure 5).
Saxena et al. [7] reported higher late evening peaks of pollutants during the post-harvest period in Delhi, attributed to crop residue burning activities predominantly in afternoon and evening hours. Chen et al. [16] also reported similar results in Chengdu, southwest China associated with solid biomass burning activities. Kumar et al. [52] investigated the impact of meteorology and emission on the diurnal and seasonal variability of O3, CO and NOx during August 2011 to September 2013 in Mohali, an NW-IGP site. It was observed that post-harvest crop residue burning in summer contributed to 19 ppb enhancement in hourly averaged O3 mixing ratios. Rana et al. [53] investigated the mixing ratios of O3, CO and NOx along with meteorological variables at the semi-urban site of Patiala in the NW-IGP in 2014 and 2015. During the rice and wheat post-harvest period, higher O3 levels were observed: 20 ppb and 15 ppb during daytime and 12 ppb and 18 ppb during nighttime, respectively.
Figure S2 shows the diurnal pattern of O3 during the pre-harvest and post-harvest periods in Agra. Similar results were reported at the same site in earlier studies by Kumari et al. [6]. Tropospheric ozone formation is a cyclic process which begins with the reaction of aromatic hydrocarbon and OH˙ radicals to generate arylperoxy radicals in the presence of NO and produces NO2. This NO2 further photolyzes to form atomic oxygen which combines with O2 to form O3. The formation of O3 was higher during the daytime due to greater photochemical activity associated with higher solar intensity in the noontime contrary to the lower rate of O3 formation during evening hours [6,52].
CO levels at the present site increased during the post-harvest period due to crop residue burning activities. High peaks of CO were recorded from 8:00 to 9:00 pm and with a 24-h average concentration of 1658.6 ppb (Figure 6). Similar results were observed in Agra during the pre- and post-harvest period by Kumari et al. [6]. The high concentration of CO may be due to enhanced local and long-range emission sources (crop residue burning) along with stagnant meteorological conditions [54]. It may also be the impact of crop residue burning during late evening hours, probably between 10:00 pm to early morning, as reported by Ravindra et al. [10] in many locations in India. Enhanced CO concentrations were also reported in earlier studies [38,55]. The diurnal variation of CO was characterized by bimodal peaks during 9:00–10:00 am (891.9 ± 172.6) and 11:00–12:00 pm (801.2 ± 115.2) and low concentrations at noon. During daytime, lower CO concentrations (34%) were attributed to higher boundary layer and the chemical loss of CO via reaction with OH radicals. CO concentrations in the evening were higher than in the morning, probably due to the accumulation of CO emissions as a result of the low boundary layer. The highest morning (951.1 ± 583.4 ppb) and evening (1286.4 ± 920.3 ppb) CO concentrations were comparable to the semi-urban site of Dibrugarh [54].

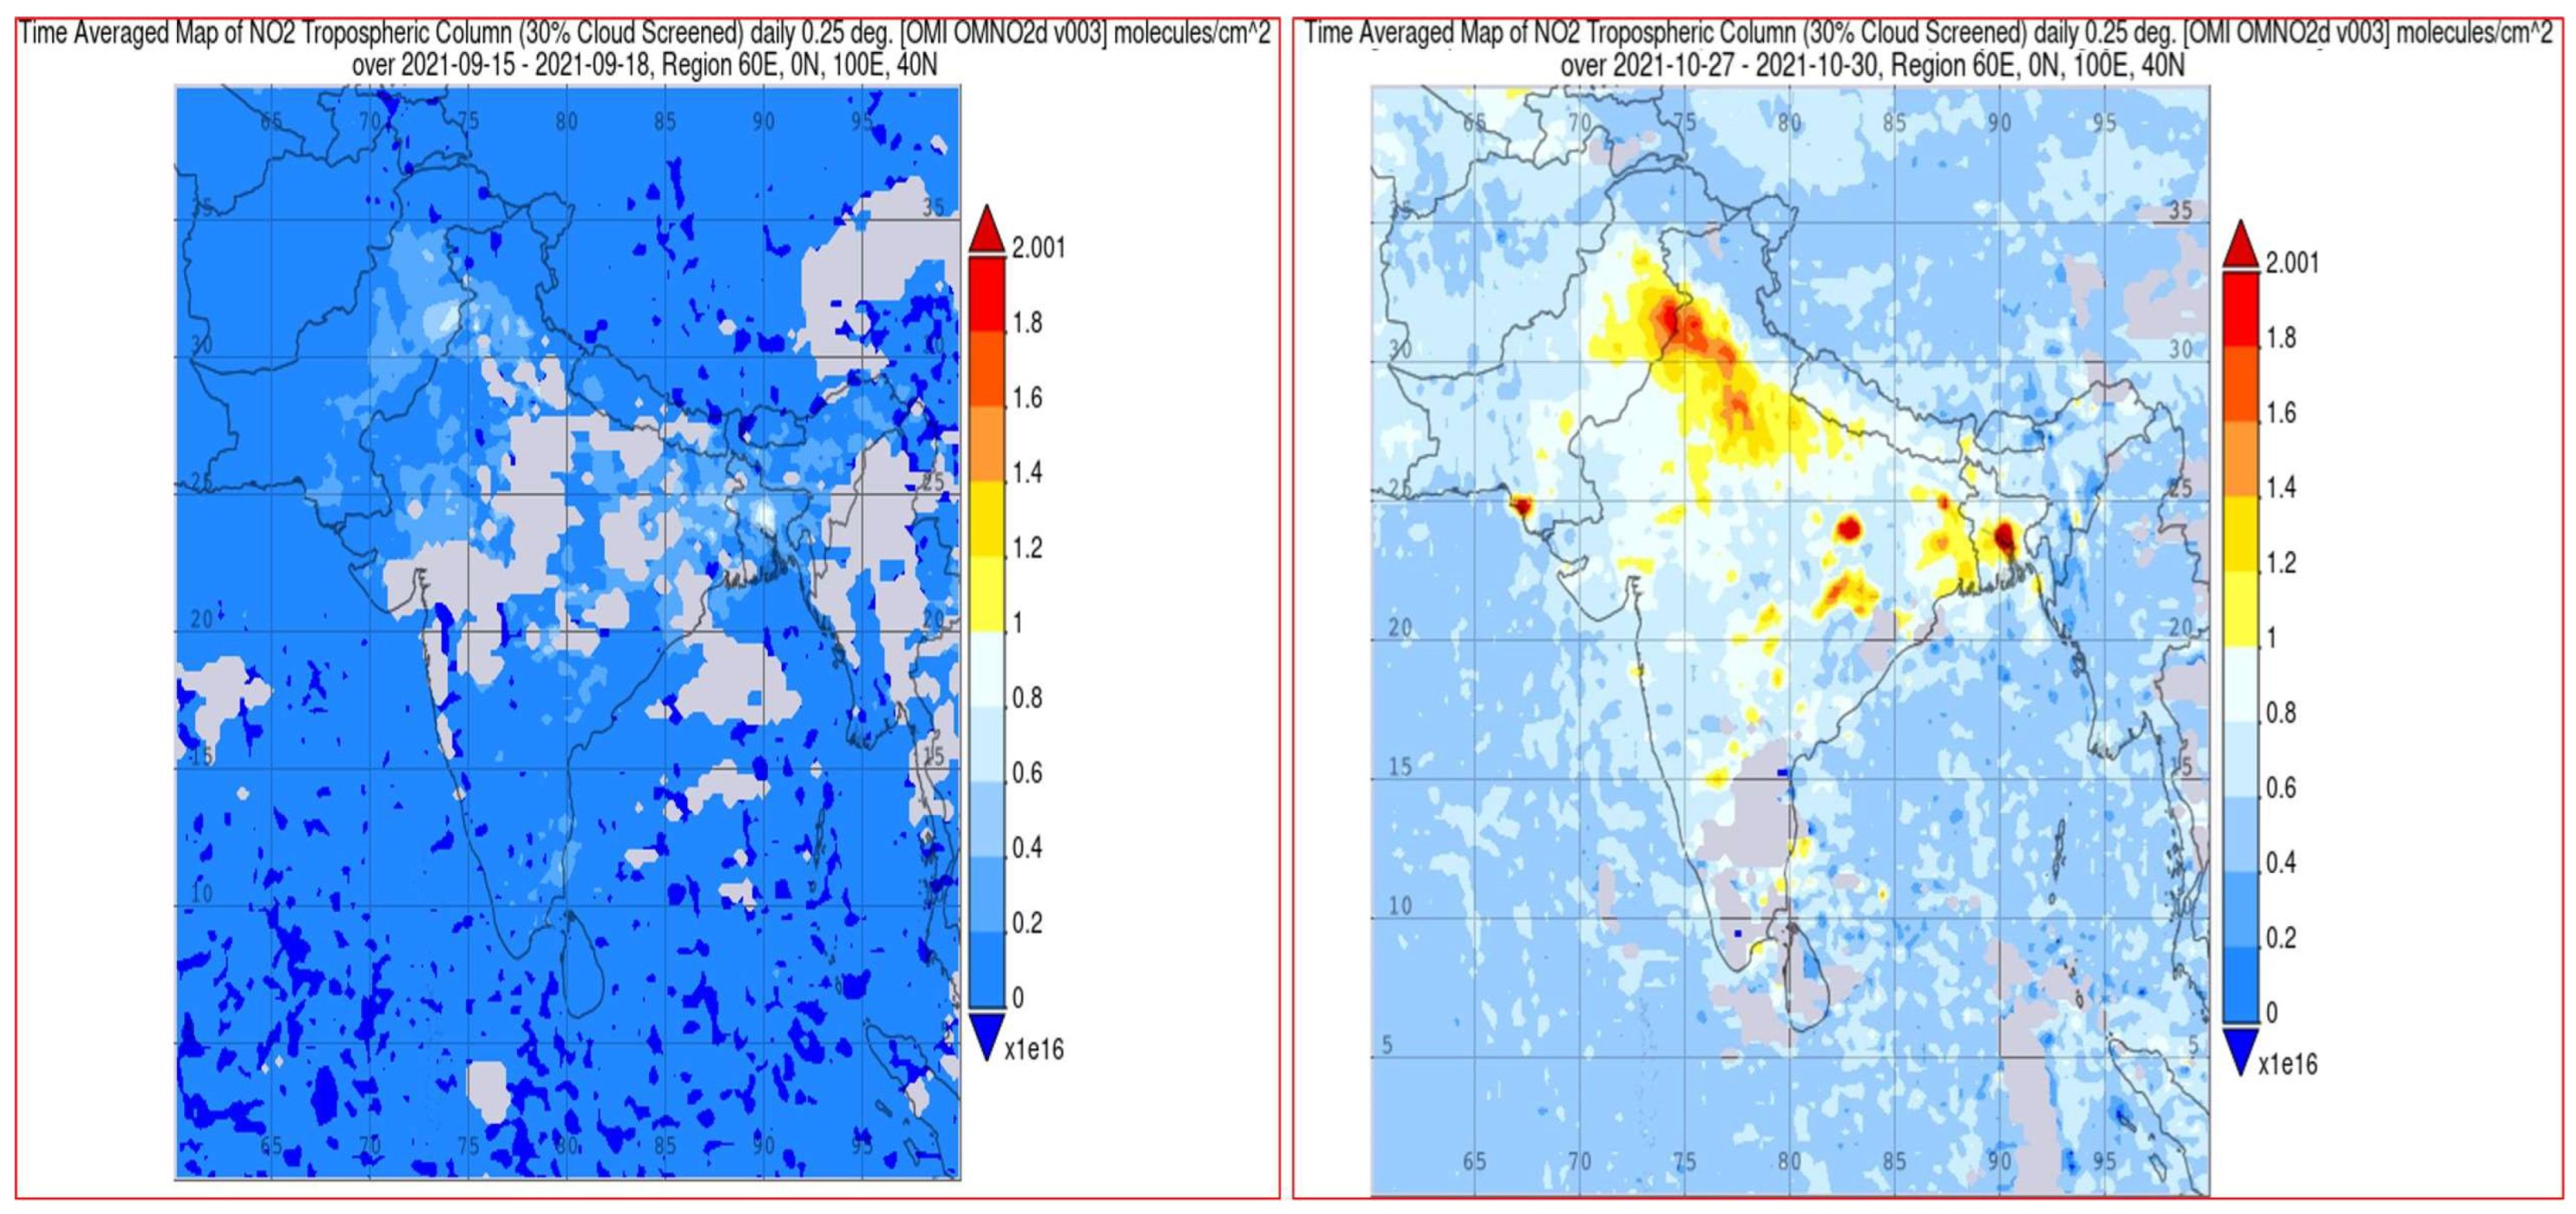
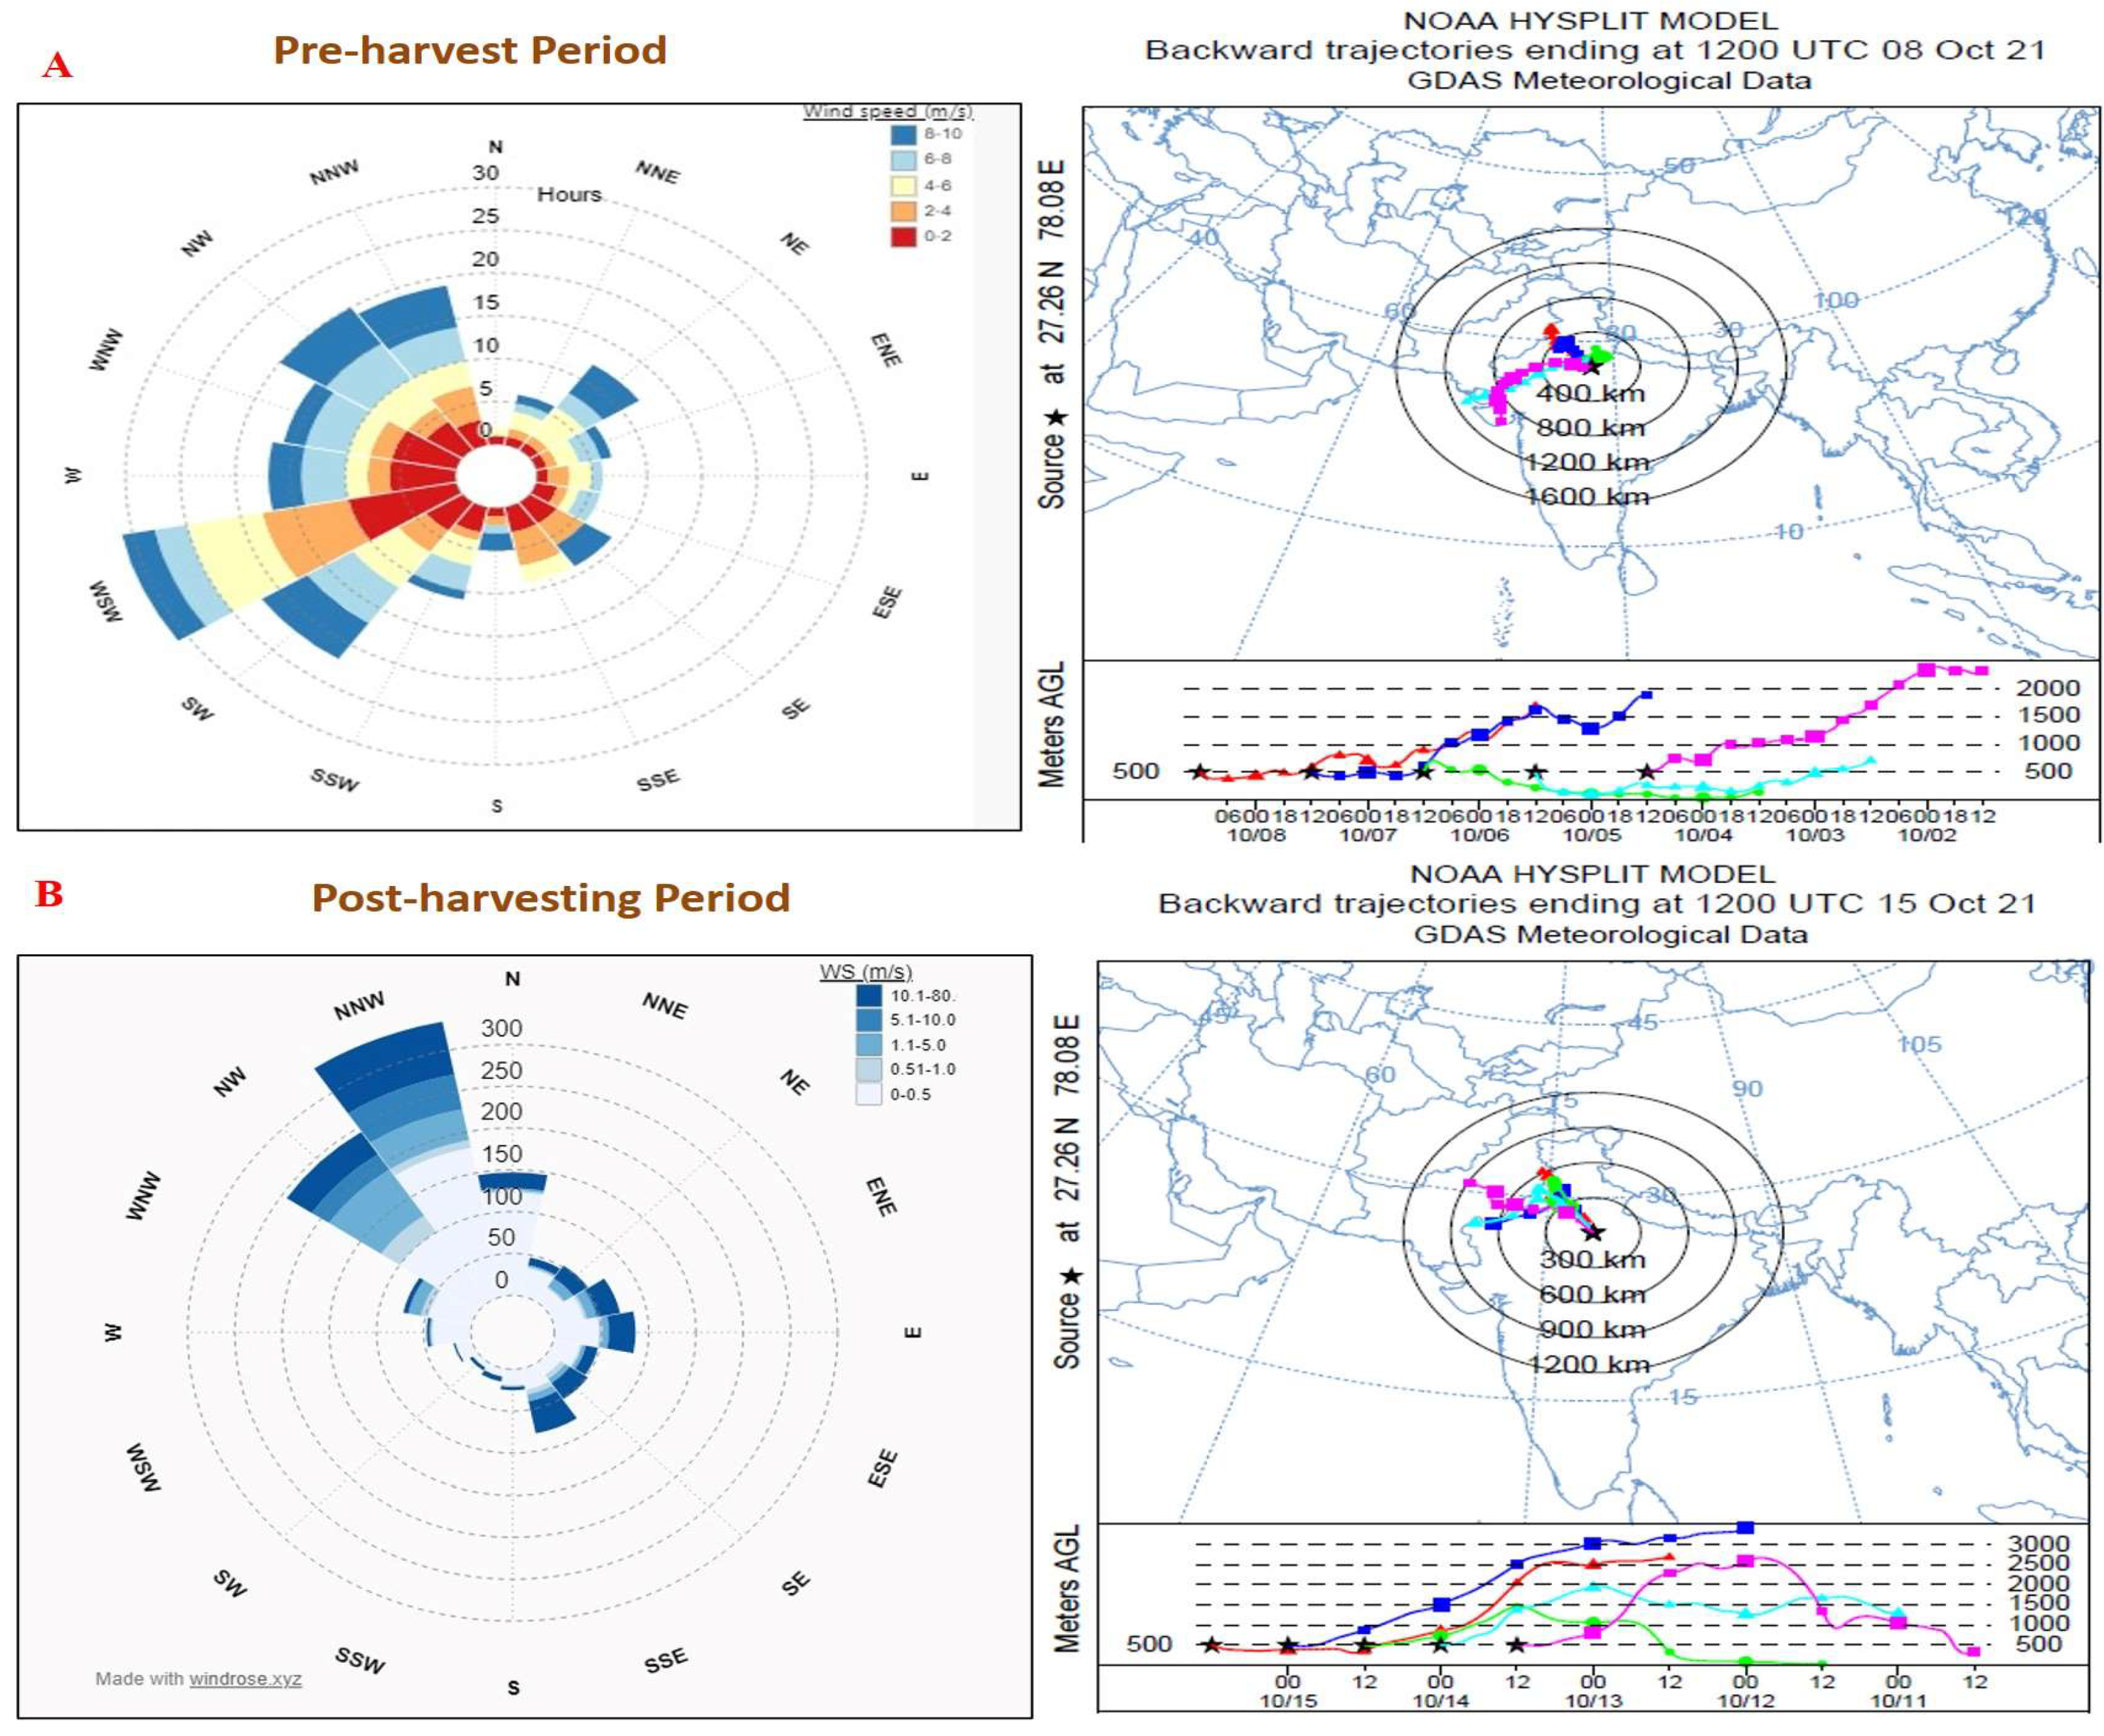
3.3. Backward Trajectory Analysis and Mapping of Crop Residue Burning Activities

Since the smoke plumes and high air pollutant loadings are restricted to the lower troposphere, the trajectory altitudes were set at 500 m in the model. Similar results (typical height of air masses as 500–800 m) have been reported during the pre-burning period [5,10,56].
Backward trajectories of air masses of 72 h were simulated at 500 m altitude and arriving at Dayalbagh, Agra using the Hybrid Single Particle Lagrangian Integrated Trajectory (HYSPLIT) model (Figure 7). The results show massive crop residue burning activities in Punjab and Haryana (northwest region of India) from 6 October 2021 to 5 November 2021. During the pre-harvest period, wind direction and trajectories were observed to have originated from the southwestern (SW) region, contrary to that during the post-harvest period, when the air mass trajectories appear to have moved from northwest of Agra (Figure 7). During the post-harvest period, most of the air mass trajectories were found to have arrived from the NW-IGP (85.7%) towards the sampling site. This is probably due to the impact of synoptic winds during the autumn and spring seasons. [57,58]. Similar results were reported by Singh et al. [2], Saxena et al. [7] and Chandra et al. [17] for the IGP region, where the air masses bring along the air pollutants when they pass over crop residue burning areas. Based on the movement of air masses, they reported that the crop residue burning in Punjab and Haryana influenced the air quality.

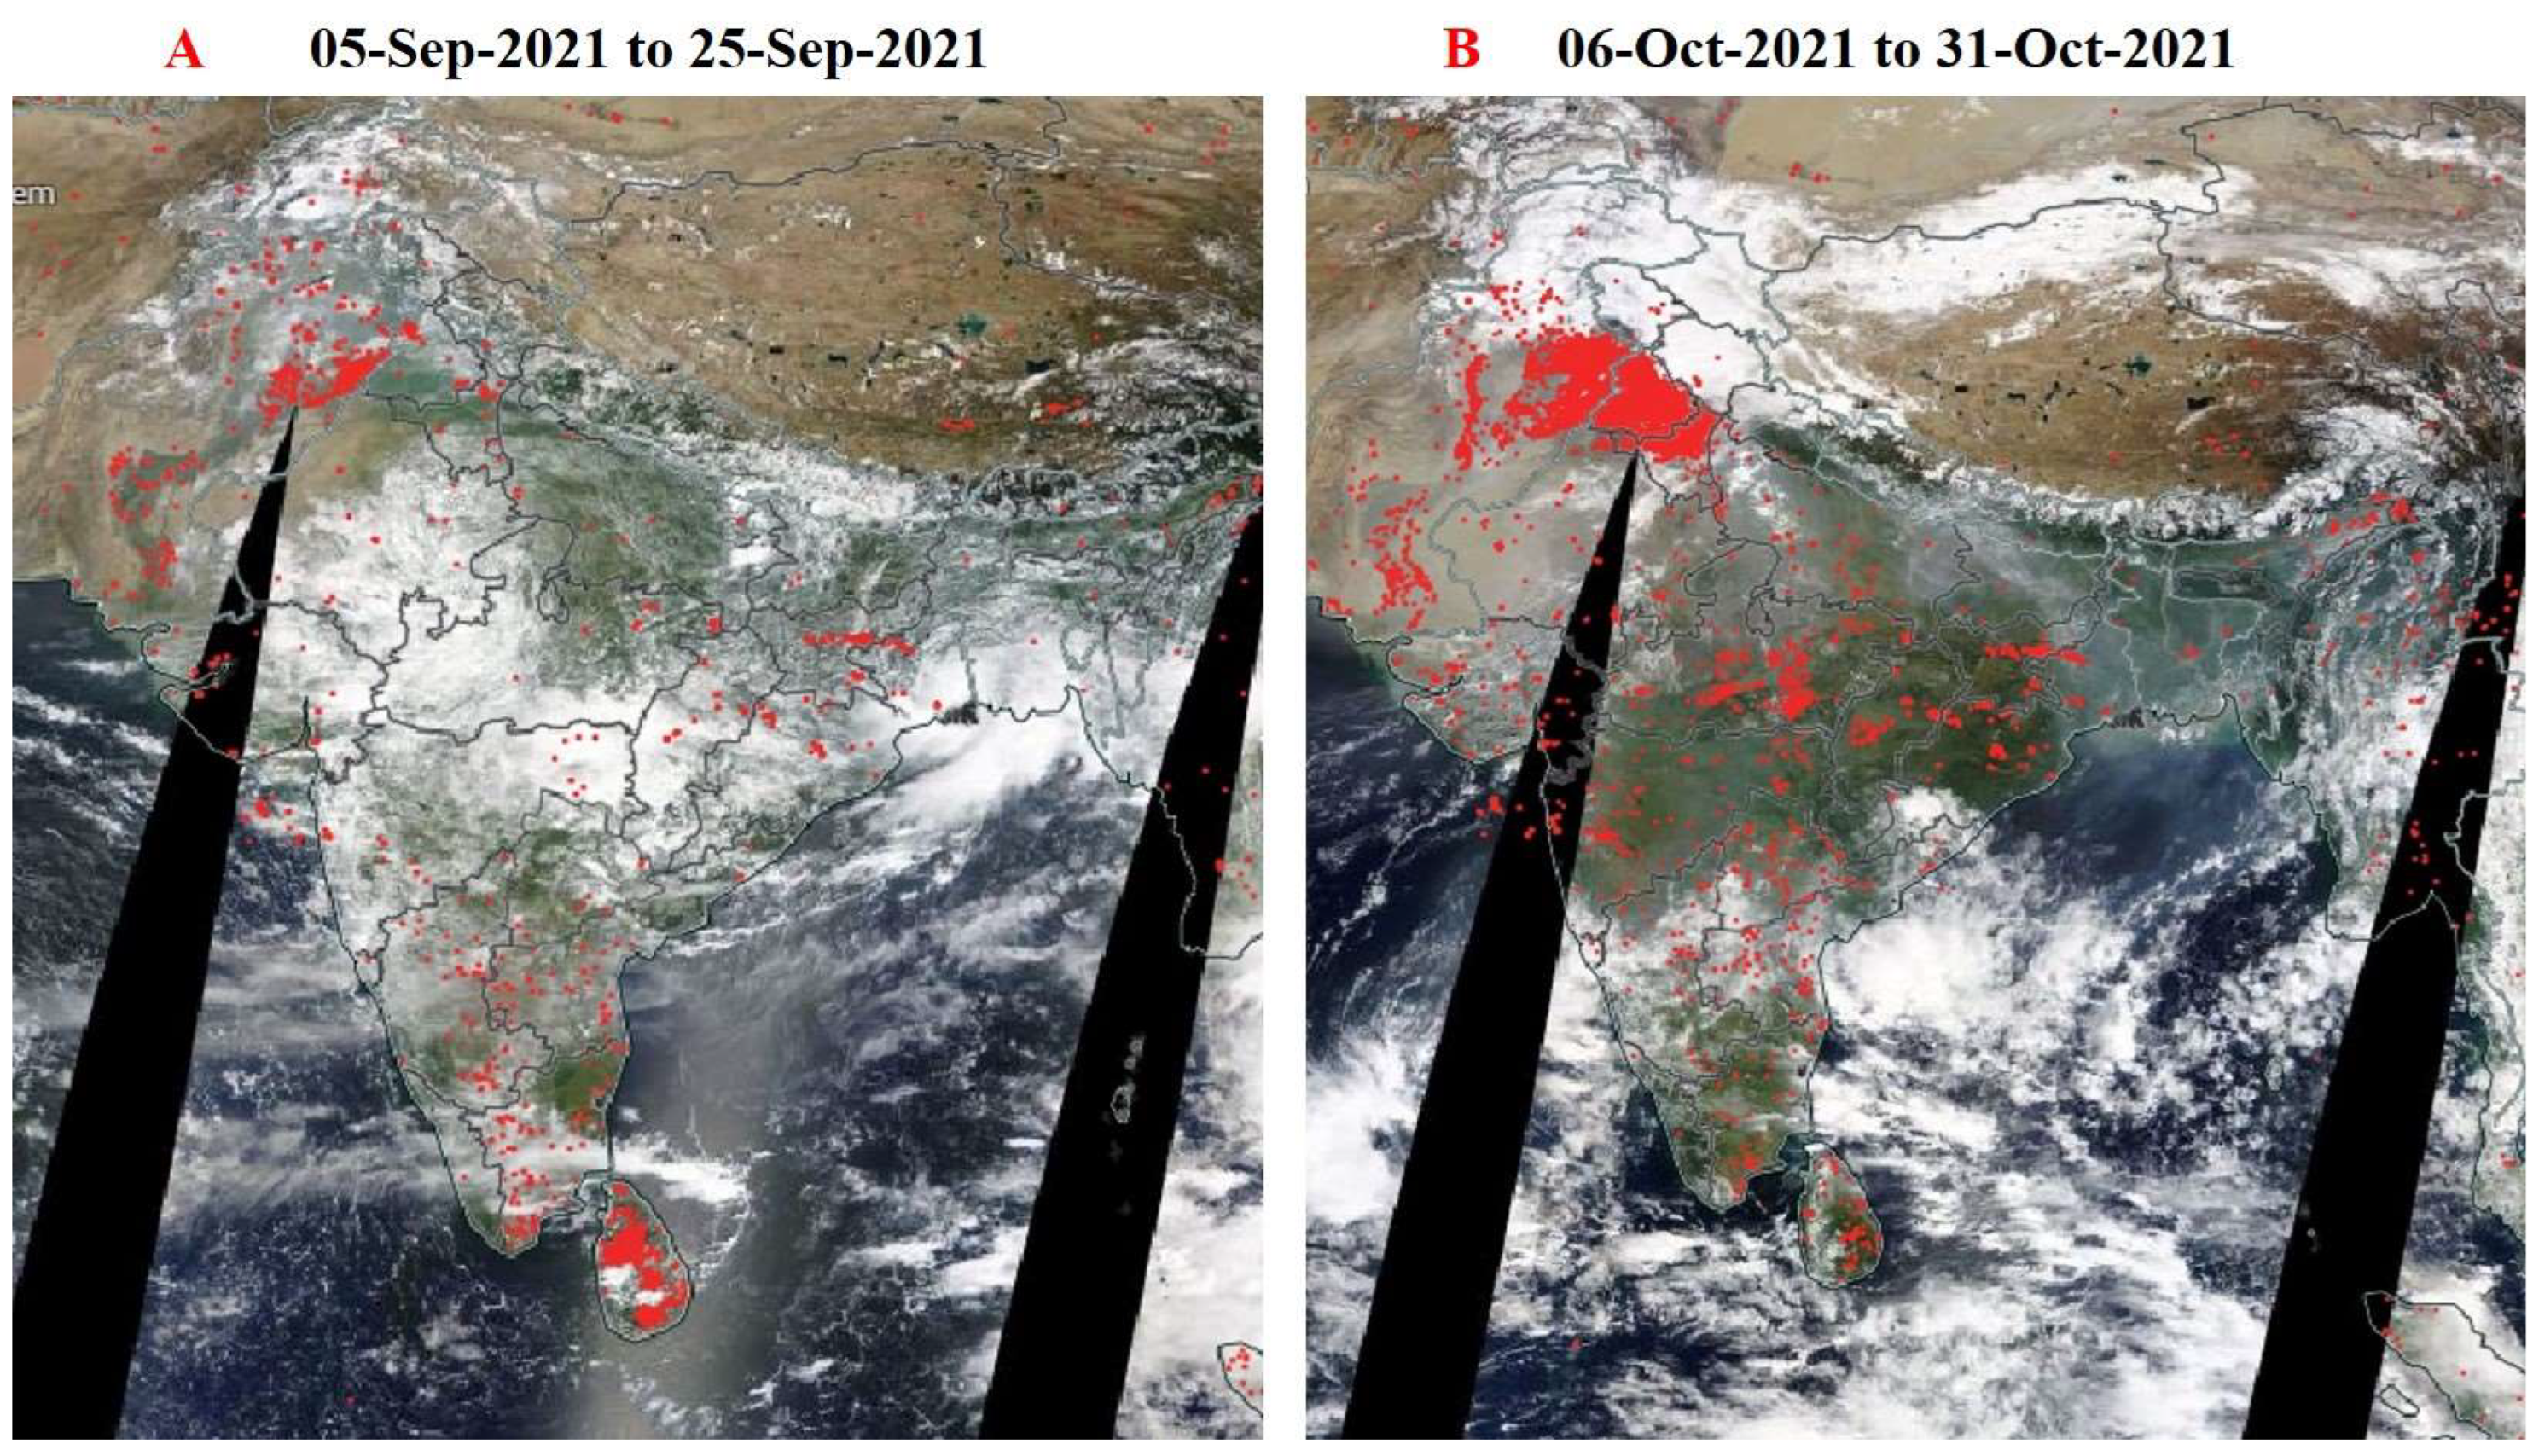
3.4. Fire Burning Activity during the Pre-Harvest and Post-Harvest Period

Daily distribution of MODIS fire counts was estimated in the NW-IGP (Figure 8) where increasing activities of crop residue burning were observed from the end of September to October [59]. During the post-harvest period, 7429 fire counts were detected in Punjab and 1027 in the study region (Agra) (Figure 8). Major fire activities were observed during the harvest period (34% more fire counts) than in the pre-harvest period. A large number of fire hotspots were observed by MODIS over the Punjab and Haryana region during the harvest period. Thus, the enhanced PM2.5, O3, CO, NOx, and BTEX levels during the harvest period were probably the impact of crop residue burning.

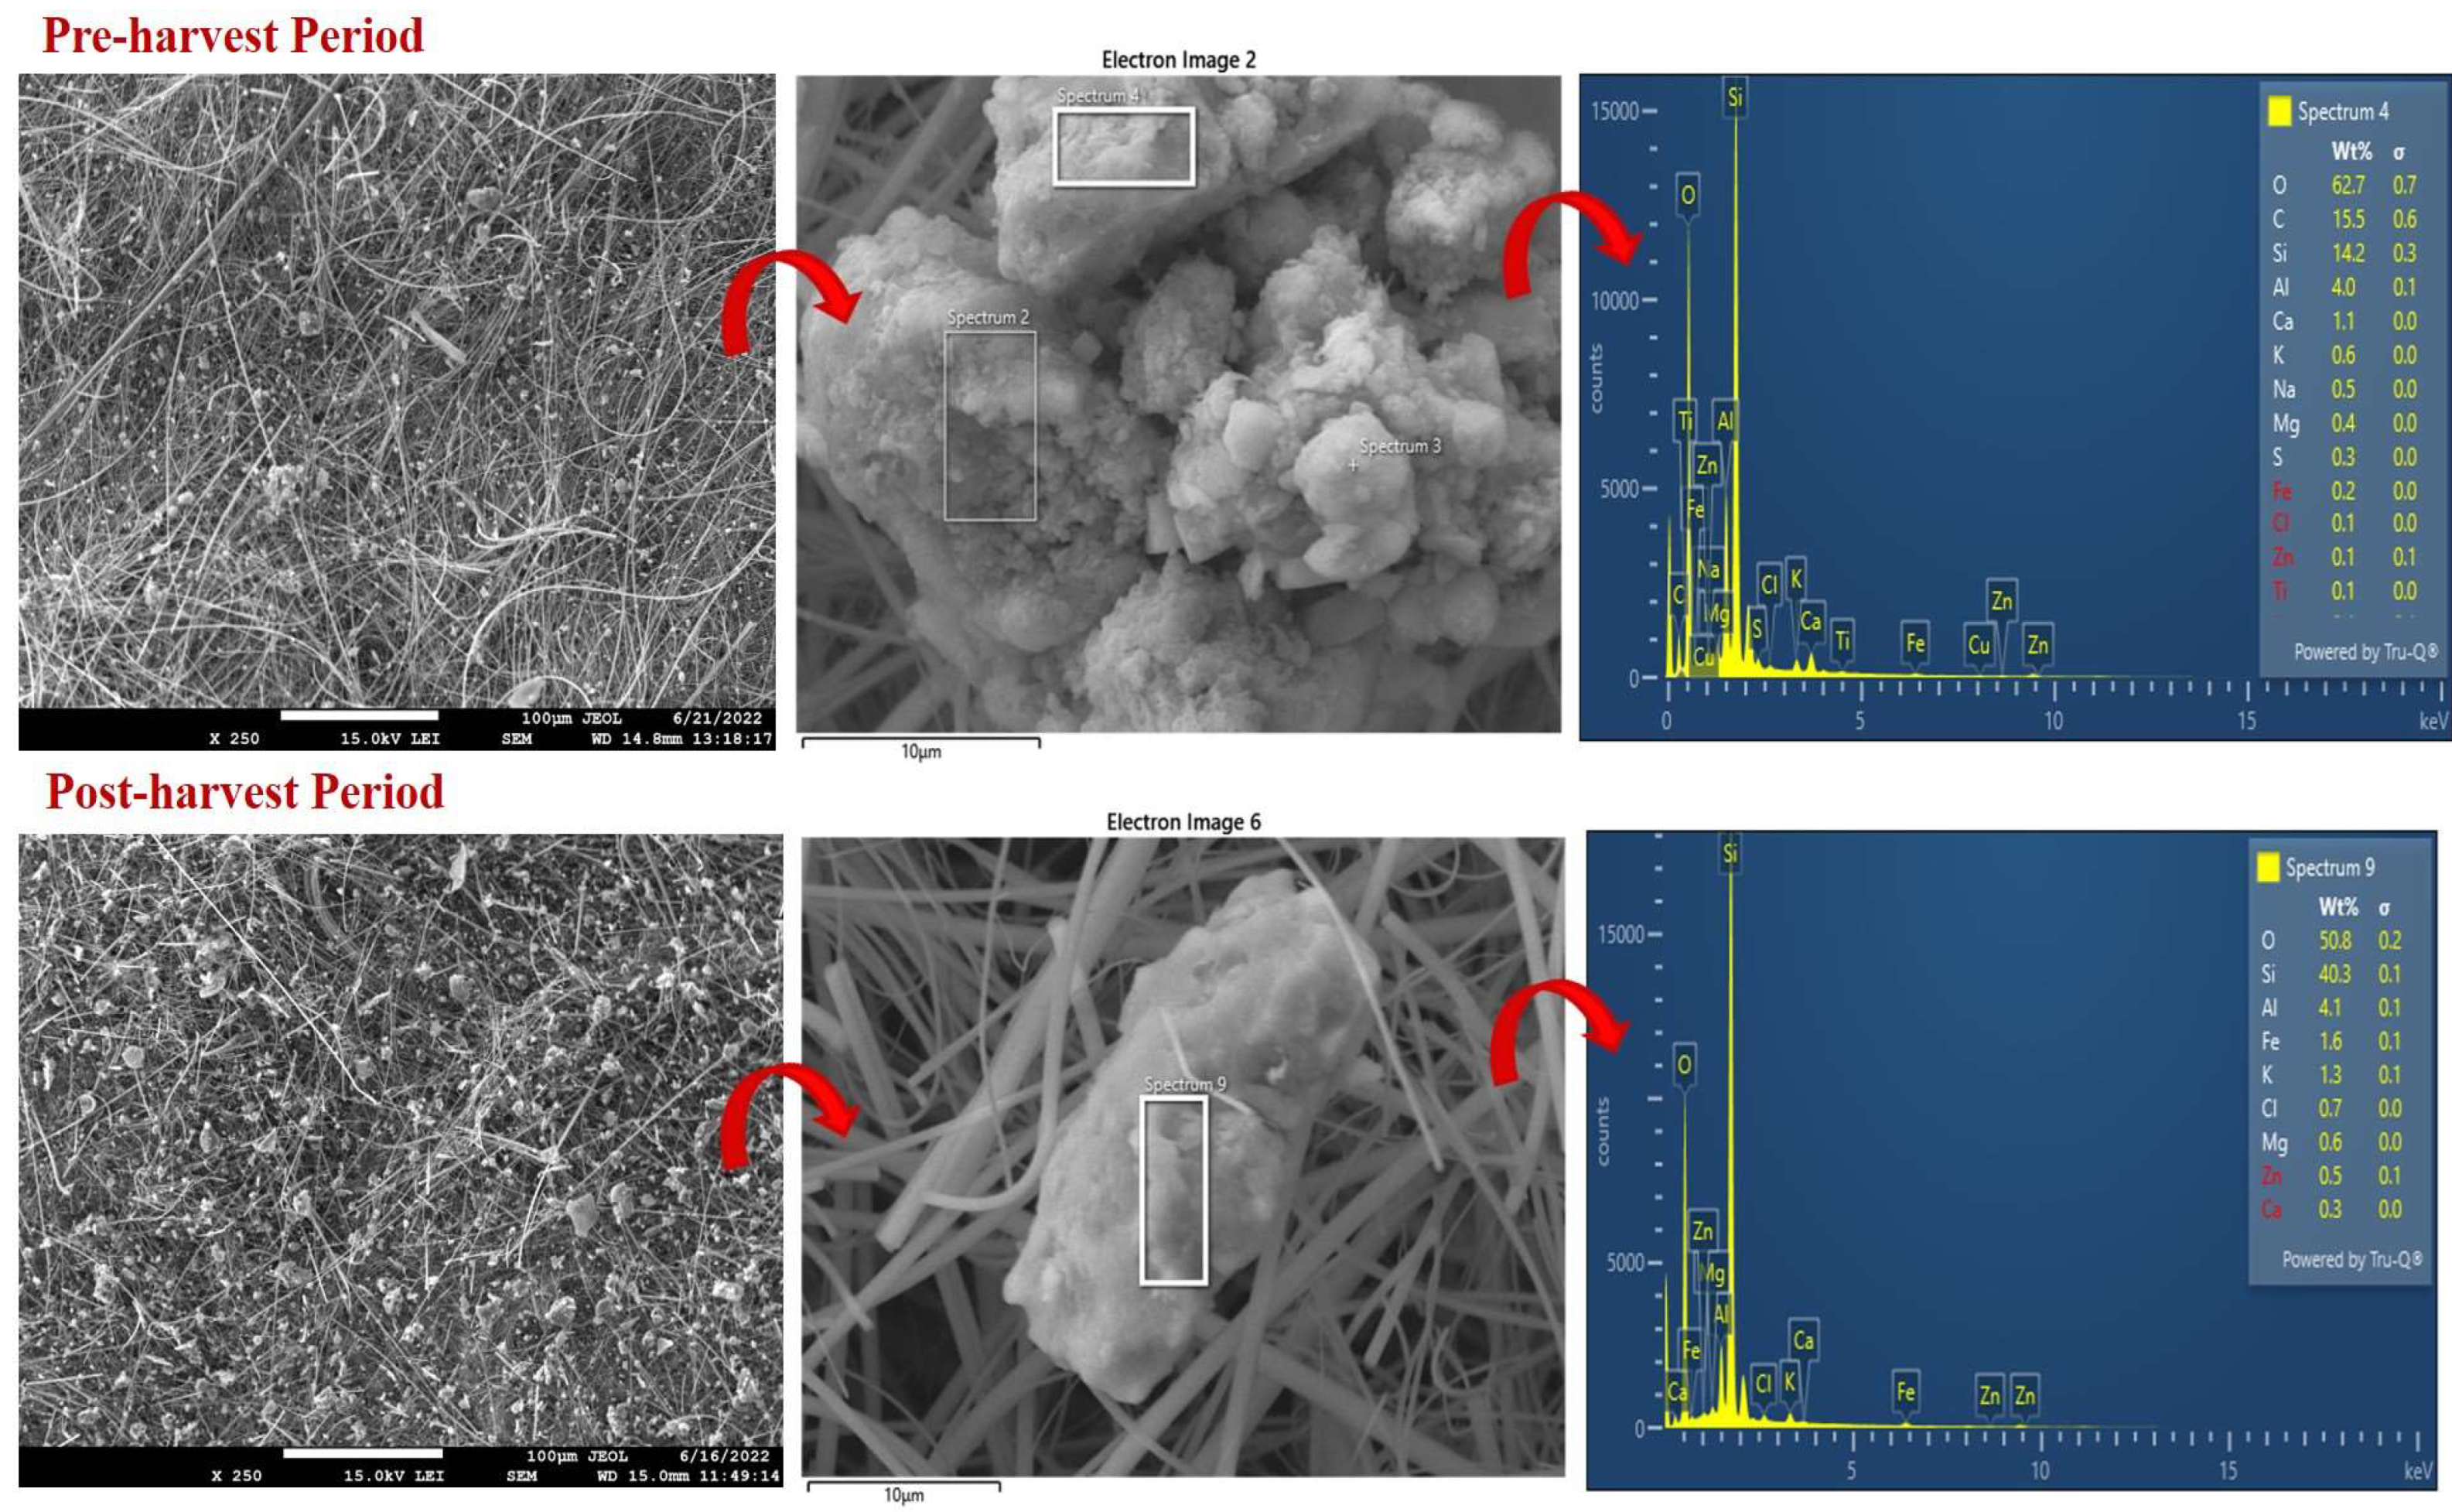
3.5. Morphology of Aerosol Particles by FESEM Measurements

PM2.5 24-h samples were collected during the pre-harvest period and post-harvest period, along with a blank filter. They were subjected to analysis using FESEM-EDX. The analysis revealed spherical, oval, elongated, irregular, porous, agglomerates and floccules in PM2.5. Different shapes and particles sizes may be due to different particle sources [60]. Figure 9 depicts the chemical composition of some of the particles based on the spot EDX spectrum for some of the particles during the pre-harvest and post-harvest period. It shows the FESEM image along with the elemental constituents of the sample collected in the pre-harvest and post-harvest periods. FESEM and EDX analysis showed K-enriched particles in the collected samples. These particles may be due to crop residue burning. Some flaky particles found in the samples were rich in C, O, Na, Mg, Al, Si, S, Cl, K, Fe, Cu and Zn which may have originated from anthropogenic sources: vehicular emissions, industries, biomass combustion, road dust and soil. FESEM results show the presence of fluffy particles in the pre-harvest period. However, the post-harvest period showed irregular, spherical, smooth particles rich in potassium that are often observed in crop residue burning and possess strong light absorbing properties; thus, post residue burning FESEM images reveal K enrichment probably by long-range transport of pollutants from the Punjab and Haryana, along with local emissions from the crop residue burning period [5].

4. Conclusions

Concentrations of atmospheric pollutants (PM2.5, O3, NOx, CO, and VOCs) during crop residue burning were measured. The average PM2.5 levels during the pre-harvest period were 58.9 ± 19.3 μg/m3, which increased to 145 ± 39.5 μg/m3, showing an increase of 146.2% during the post-harvest period. The average concentration of NOx, CO and VOCs was 10.4 ± 5.3 ppb, 709.4 ± 481.7 ppb, and 76.6.1 ± 27.1 μg/m3, respectively, during the pre-harvest period, while during the post-harvest period, the average concentrations of NOx, CO and VOCs were 19.7 ± 7.5 ppb, 1498.5 ± 1077.5 ppb and 110 ± 77.1 μg/m3, respectively. In addition, there was an enhancement of 16% in O3 concentrations. A large number of fire hotspots were observed by MODIS over the Punjab and Haryana region during the harvest period. At the same time, air parcels were also noticed to originate from the NW-IGP. On the basis of backward trajectory analysis and MODIS fire counts, enhanced levels of PM2.5, NOx, CO, O3, and VOCs may be attributed to crop residue burning activities from Punjab and Haryana over the NW-IGP. FESEM and EDX results show the abundance of K which mainly comes from the burning of crops. Thus, the site appears to be influenced by the transport of air masses laden with air pollutants from the crop residue burning regions. As there is no policy for crop residue burning emissions in India, the present study may be helpful to predict and develop proper planning and policies for air quality improvement strategies. It may also help set standard limits for the PM, VOCs and other pollutant levels during the crop residue burning period.

Supplementary Materials

The following are available online at https://www.mdpi.com/article/10.3390/pollutants3010013/s1, Figure S1: Average concentration of the pollutants during the pre-harvest and post-harvest period; Figure S2: Diurnal pattern of O3 during pre-harvest and post-harvest period; Table S1: Meteorological parameters (Temperature and Relative Humidity) during the pre-harvest and post-harvest period.

Author Contributions

N.B.—sampling, analysis, data compilation and manuscript writing. K.S.—data compilation and manuscript writing. A.L.—editing and review of manuscript and funding acquisition, K.M.K.—planning and organizing the manuscript, analyzing the results, final approval, and A.S.—data compilation, editing, review of manuscript, and funding acquisition. All authors have read and agreed to the published version of the manuscript.

Funding

The authors are thankful to the ISRO-GBP ATCTM project and the Department of Science and Technology (DST), Govt. of India, under the FIST Programme (No. SR/FST/CS-II/2017/38 © for providing financial support to carry out the present study.

Data Availability Statement

The present work is an outcome of the ISRO-GBP ATCTM project on “Ozone and its Precursor Relationship in Ambient Air” and the concerned data and materials are available on request from the principal investigator.

Acknowledgments

The authors are grateful for the financial support provided by ISRO-GBP under the ATCTM project and the Department of Science and Technology (DST), Govt. of India, for financial assistance under the FIST Programme (No. SR/FST/CS-II/2017/38 ©. The authors are also thankful to the Director, Dayalbagh Educational Institute, Agra and Head, Department of Chemistry, Faculty of Science, Dayalbagh Educational Institute, Agra for providing infrastructural facilities. The authors are grateful to Shyama Prasad, Senior Scientist, National Institute of Oceanography, Goa and Manju Srivastava, Department of Chemistry, Faculty of Science, Dayalbagh Educational Institute, Agra for FESEM-EDX analysis.

Conflicts of Interest

The authors declare no conflict of interest.

References

  1. Ravindra, K.; Goyal, A.; Mor, S. Influence of meteorological parameters and air pollutants on the airborne pollen of city Chandigarh, India. Sci. Total Environ. 2022, 818, 151829. [Google Scholar] [CrossRef]
  2. Singh, T.; Biswal, A.; Mor, S.; Ravindra, K.; Singh, V.; Mor, S. A high-resolution emission inventory of air pollutants from primary crop residue burning over Northern India based on VIIRS thermal anomalies. Environ. Pollut. 2020, 266, 115132. [Google Scholar] [CrossRef]
  3. Long, X.; Tie, X.; Cao, J.; Huang, R.; Feng, T.; Li, N.; Zhang, Q. Impact of crop field burning and mountains on heavy haze in the North China Plain: A case study. Atmos. Chem. Phys. 2016, 16, 9675–9691. [Google Scholar] [CrossRef] [Green Version]
  4. Zhou, Y.; Han, Z.; Liu, R.; Zhu, B.; Li, J.; Zhang, R.A. Modelling study of the impact of crop residue burning on PM2.5 concentration in Beijing and Tianjin during a severe autumn haze event. Aerosol Air Qual. Res. 2018, 18, 1558–1572. [Google Scholar] [CrossRef]
  5. Kumari, S.; Verma, N.; Lakhani, A.; Kumari, K.M. Severe haze events in the Indo-Gangetic Plain during post-monsoon: Synergetic effect of synoptic meteorology and crop residue burning emission. Sci. Total Environ. 2021, 768, 145479. [Google Scholar] [CrossRef]
  6. Sinha, V.; Kumar, V.; Sarkar, C. Chemical composition of pre-monsoon air in the Indo-Gangetic Plain measured using a new air quality facility and PTR-MS: High surface ozone and strong influence of biomass burning. Atmos. Chem. Phys. 2014, 14, 5921–5941. [Google Scholar] [CrossRef] [Green Version]
  7. Saxena, P.; Sonwani, S.; Srivastava, A.; Jain, M.; Srivastava, A.; Bharti, A.; Bhardwaj, S. Impact of crop residue burning in Haryana on the air quality of Delhi, India. Heliyon 2021, 7, e06973. [Google Scholar] [CrossRef] [PubMed]
  8. Baghel, N.; Kumari, S.; Lakhani, A.; Satsangi, A.; Kumari, K.M. Evaluation of Air Quality at Taj City at Dayalbagh during the COVID-19 Period. Int. J. Environ. Sci. 2022, 11, 62–73. [Google Scholar] [CrossRef]
  9. Kumari, S.; Verma, N.; Lakhani, A.; Tiwari, S.; Kandikonda, M.K. Tropospheric ozone enhancement during post-harvest crop-residue fires at two downwind sites of the Indo-Gangetic Plain. Environ. Sci. Pollut. Res. 2018, 25, 18879–18893. [Google Scholar] [CrossRef] [PubMed]
  10. Ravindra, K.; Singh, T.; Mor, S.; Singh, V.; Mandal, T.K.; Bhatti, M.S.; Beig, G. Real-time monitoring of air pollutants in seven cities of North India during crop residue burning and their relationship with meteorology and transboundary movement of air. Sci. Total Environ. 2019, 690, 717–729. [Google Scholar] [CrossRef] [PubMed]
  11. Dambruoso, P.; de Gennaro, G.; Di Gilio, A.; Palmisani, J.; Tutino, M. The impact of infield biomass burning on PM levels and its chemical composition. Environ. Sci. Pollut. Res. 2013, 21, 13175–13185. [Google Scholar] [CrossRef]
  12. Saffari, A.; Daher, N.; Samara, C.; Voutsa, D.; Kouras, A.; Manoli, E.; Sioutas, C. Increased Biomass Burning Due to the Economic Crisis in Greece and Its Adverse Impact on Wintertime Air Quality in Thessaloniki. Environ. Sci. Technol. 2013, 47, 13313–13320. [Google Scholar] [CrossRef] [PubMed]
  13. Han, K.M.; Lee, B.T.; Bae, M.S.; Lee, S.; Jung, C.H.; Kim, H.S. Crop Residue Burning Emissions and the Impact on Ambient Particulate Matters Over South Korea. Atmosphere 2022, 13, 559. [Google Scholar] [CrossRef]
  14. Huang, L.; Zhu, Y.; Liu, H.; Wang, Y.; Allen, D.T.; Ooi, M.C.G.; Manomaiphiboon, K.; Latif, M.T.; Chan, A.; Li, L. Assessing the contribution of open crop straw burning to ground-level ozone and associated health impacts in China and the effectiveness of straw burning bans. Environ. Int. 2023, 171, 107710. [Google Scholar] [CrossRef]
  15. Gautam, R.; Hsu, N.C.; Eck, T.F.; Holben, B.N.; Janjai, S.; Jantarach, T.; Lau, W.K. Characterization of aerosols over the Indochina peninsula from satellite-surface observations during biomass burning pre-monsoon season. Atmos. Environ. 2013, 78, 51–59. [Google Scholar] [CrossRef]
  16. Chen, Y.; Xie, S.D. Characteristics and formation mechanism of a heavy air pollution episode caused by biomass burning in Chengdu, Southwest China. Sci. Total Environ. 2014, 473, 507–517. [Google Scholar] [CrossRef] [PubMed]
  17. Chandra, B.P.; Sinha, V. Contribution of post-harvest agricultural paddy residue fires in the NW Indo-Gangetic Plain to ambient carcinogenic benzenoids, toxic isocyanic acid and carbon monoxide. Environ. Int. 2016, 88, 187–197. [Google Scholar] [CrossRef] [PubMed]
  18. Ravindra, K.; Singh, T.; Pandey, V.; Mor, S. Air pollution trend in Chandigarh city situated in Indo-Gangetic Plains: Understanding seasonality and impact of mitigation strategies. Sci. Total Environ. 2020, 729, 138717. [Google Scholar] [CrossRef]
  19. Singh, R.P.; Kaskaoutis, D.G. Crop residue burning: A threat to South Asian air quality. Eos Trans. Am. Geophys. Union 2014, 95, 333–334. [Google Scholar] [CrossRef]
  20. Chen, J.; Li, C.; Ristovski, Z.; Milic, A.; Gu, Y.; Islam, M.S.; Dumka, U.C. A review of biomass burning: Emissions and impacts on air quality, health and climate in China. Sci. Total Environ. 2017, 579, 1000–1034. [Google Scholar] [CrossRef] [Green Version]
  21. Kulkarni, S.H.; Ghude, S.D.; Jena, C.; Karumuri, R.K.; Sinha, B.; Sinha, V.; Khare, M. How much does large-scale crop residue burning affect the air quality in Delhi? Environ. Sci. Technol. 2020, 54, 4790–4799. [Google Scholar] [CrossRef] [PubMed]
  22. Vijayakumar, K.; Safai, P.D.; Devara, P.C.S.; Rao, S.V.B.; Jayasankar, C.K. Effects of agriculture crop residue burning on aerosol properties and long-range transport over northern India: A study using satellite data and model simulations. Atmos. Res. 2016, 178, 155–163. [Google Scholar] [CrossRef]
  23. Zhu, C.; Kawamura, K.; Kunwar, B. Effect of biomass burning over the western North Pacific Rim: Wintertime maxima of anhydrosugars in ambient aerosols from Okinawa. Atmos. Chem. Phys. 2015, 15, 1959–1973. [Google Scholar] [CrossRef]
  24. Lin, N.H.; Tsay, S.C.; Maring, H.B.; Yen, M.C.; Sheu, G.R.; Wang, S.H.; Liu, G.R. An overview of regional experiments on biomass burning aerosols and related pollutants in Southeast Asia: From BASE-ASIA and the Dongsha Experiment to 7-SEAS. Atmos. Environ. 2013, 78, 1–19. [Google Scholar] [CrossRef] [Green Version]
  25. Roden, C.A.; Bond, T.C.; Conway, S.; Pinel, A.B.O. Emission factors and real-time optical properties of particles emitted from traditional wood burning cookstoves. Environ. Sci. Technol. 2006, 40, 6750–6757. [Google Scholar] [CrossRef]
  26. Kumari, S.; Baghel, N.; Lakhani, A.; Kumari, K.M. BTEX and formaldehyde levels at a suburban site of Agra: Temporal variation, ozone formation potential and health risk assessment. Urban Clim. 2021, 40, 100997. [Google Scholar] [CrossRef]
  27. Hakimzadeh, M.; Soleimanian, E.; Mousavi, A.; Borgini, A.; De Marco, C.; Ruprecht, A.A.; Sioutas, C. The impact of biomass burning on the oxidative potential of PM2.5 in the metropolitan area of Milan. Atmos. Environ. 2020, 224, 117328. [Google Scholar] [CrossRef]
  28. Puthussery, J.V.; Dave, J.; Shukla, A.; Gaddamidi, S.; Singh, A.; Vats, P.; Salana, S.; Ganguly, D.; Rastogi, N.; Tripathi, S.N.; et al. Effect of Biomass Burning, Diwali Fireworks, and Polluted Fog Events on the Oxidative Potential of Fine Ambient Particulate Matter in Delhi, India. Environ. Sci. Technol. 2022, 56, 14605–14616. [Google Scholar] [CrossRef]
  29. Verma, N.; Lakhani, A.; Maharaj Kumari, K. Surface O3 and Its Precursors (NOx, CO, BTEX) at a Semi-arid Site in Indo-Gangetic Plain: Characterization and Variability. In Urban Air Quality Monitoring, Modelling and Human Exposure Assessment; Springer: Berlin/Heidelberg, Germany, 2021; pp. 119–135. Available online: https://link.springer.com/chapter/10.1007/978-981-15-5511-4_9 (accessed on 30 December 2022).
  30. Verma, N.; Satsangi, A.; Lakhani, A.; Kumari, K.M. Characteristics of surface ozone in Agra, a sub-urban site in Indo-Gangetic Plain. J. Earth Syst. Sci. 2018, 127, 42. [Google Scholar] [CrossRef] [Green Version]
  31. Justice, C.O.; Giglio, L.; Korontzi, S.; Owens, J.; Morisette, J.T.; Roy, D.; Kaufman, Y. The MODIS fire products. Remote Sens. Environ. 2002, 83, 244–262. [Google Scholar] [CrossRef]
  32. Seinfeld, J.H.; Pandis, S.N. Atmospheric Chemistry and Physics: From Air Pollution to Climate Change; Wiley: Hoboken, NJ, USA, 1998; p. 81. [Google Scholar]
  33. Saxena, P.; Nail, V. Air pollution: Causes, effects and controls. J. Crit. Rev. 2018, 7, 717–722. [Google Scholar]
  34. Celarier, E.A.; Brinksma, E.J.; Gleason, J.F.; Veefkind, J.P.; Cede, A.; Herman, J.R.; Levelt, P.F. Validation of Ozone Monitoring Instrument nitrogen dioxide columns. J. Geophys. Res. Atmos. 2008, 113, D15. [Google Scholar] [CrossRef] [Green Version]
  35. Veefkind, J.P.; Aben, I.; McMullan, K.; Förster, H.; De Vries, J.; Otter, G.; Levelt, P.F. TROPOMI on the ESA Sentinel-5 Precursor: A GMES mission for global observations of the atmospheric composition for climate, air quality and ozone layer applications. Remote Sens. Environ. 2012, 120, 70–83. [Google Scholar] [CrossRef]
  36. Wang, L.; Liu, Z.; Sun, Y.; Ji, D.; Wang, Y. Long-range transport and regional sources of PM2. 5 in Beijing based on long-term observations from 2005 to 2010. Atmos. Res. 2015, 157, 37–48. [Google Scholar] [CrossRef]
  37. Kanawade, V.P.; Srivastava, A.K.; Ram, K.; Asmi, E.; Vakkari, V.; Soni, V.K.; Sarangi, C. What caused severe air pollution episode of November 2016 in New Delhi? Atmos. Environ. 2020, 222, 117125. [Google Scholar] [CrossRef]
  38. Sarangi, T.; Naja, M.; Ojha, N.; Kumar, R.; Lal, S.; Venkataramani, S.; Chandola, H.C. First simultaneous measurements of ozone, CO, and NOx at a high-altitude regional representative site in the central Himalayas. J. Geophys. Res. Atmos. 2014, 119, 1592–1611. [Google Scholar] [CrossRef]
  39. Yarragunta, Y.; Srivastava, S.; Mitra, D.; Chandola, H.C. Influence of forest fire episodes on the distribution of gaseous air pollutants over Uttarakhand, India. GISci. Remote Sens. 2020, 57, 190–206. [Google Scholar] [CrossRef]
  40. Srivastava, S.; Senthil Kumar, A. Implications of intense biomass burning over Uttarakhand in April–May 2016. Nat. Hazards 2020, 101, 367–383. [Google Scholar] [CrossRef]
  41. Tang, J.H.; Chan, L.Y.; Chan, C.Y.; Li, Y.S.; Chang, C.C.; Liu, S.C.; Li, Y.D. Characteristics and diurnal variations of NMHCs at urban, suburban, and rural sites in the Pearl River Delta and a remote site in South China. Atmos. Environ. 2007, 41, 8620–8632. [Google Scholar] [CrossRef]
  42. Kumar, R.; Naja, M.; Satheesh, S.K.; Ojha, N.; Joshi, H.; Sarangi, T.; Venkataramani, S. Influences of the springtime northern Indian biomass burning over the central Himalayas. J. Geophys. Res. Atmos. 2011, 116, D19. [Google Scholar] [CrossRef]
  43. Ojha, N.; Naja, M.; Singh, K.P.; Sarangi, T.; Kumar, R.; Lal, S.; Chandola, H.C. Variabilities in ozone at a semi-urban site in the Indo-Gangetic Plain region: Association with the meteorology and regional processes. J. Geophys. Res. Atmos. 2012, 117, D20. [Google Scholar] [CrossRef]
  44. Bali, K.; Kumar, A.; Chourasiya, S. Emission estimates of trace gases (VOCs and NOx) and their reactivity during biomass burning period (2003–2017) over Northeast India. J. Atmos. Chem. 2021, 78, 17–34. [Google Scholar] [CrossRef]
  45. Koppmann, R.; Von Czapiewski, K.; Reid, J.S. A review of biomass burning emissions, part I: Gaseous emissions of carbon monoxide, methane, volatile organic compounds, and nitrogen containing compounds. Atmos. Chem. Phys. Discuss. 2005, 5, 10455–10516. [Google Scholar] [CrossRef] [Green Version]
  46. Pandey, A.; Sadavarte, P.; Rao, A.B.; Venkataraman, C. Trends in multi-pollutant emissions from a technology-linked inventory for India: II. Residential, agricultural and informal industry sectors. Atmos. Environ. 2014, 99, 341–352. [Google Scholar] [CrossRef]
  47. Venkataraman, C.; Habib, G.; Kadamba, D.; Shrivastava, M.; Leon, J.F.; Crouzille, B.; Streets, D.G. Emissions from open biomass burning in India: Integrating the inventory approach with high-resolution Moderate Resolution Imaging Spectroradiometer (MODIS) active-fire and land cover data. Glob. Biogeochem. Cycles 2006, 20. [Google Scholar] [CrossRef]
  48. Ravindra, K.; Singh, T.; Sinha, V.; Sinha, B.; Paul, S.; Attri, S.D.; Mor, S. Appraisal of regional haze event and its relationship with PM2. 5 concentration, crop residue burning and meteorology in Chandigarh, India. Chemosphere 2021, 273, 128562. [Google Scholar] [CrossRef]
  49. Lalchandani, V.; Srivastava, D.; Dave, J.; Mishra, S.; Tripathi, N.; Shukla, A.K.; Tripathi, S.N. Effect of Biomass Burning on PM2.5 Composition and Secondary Aerosol Formation During Post-Monsoon and Winter Haze Episodes in Delhi. J. Geophys. Res. Atmos. 2022, 127, e2021JD035232. [Google Scholar] [CrossRef]
  50. Tiwari, S.; Pipal, A.S.; Srivastava, A.K.; Bisht, D.S.; Pandithurai, G. Determination of wood burning and fossil fuel contribution of black carbon at Delhi, India using aerosol light absorption technique. Environ. Sci. Pollut. Res. 2015, 22, 2846–2855. [Google Scholar] [CrossRef]
  51. Ojha, N.; Girach, I.; Sharma, K.; Nair, P.; Singh, J.; Sharma, N.; Subrahmanyam, K.V. Surface ozone in the Doon Valley of the Himalayan foothills during spring. Environ. Sci. Pollut. Res. 2019, 26, 19155–19170. [Google Scholar] [CrossRef] [PubMed]
  52. Kumar, V.; Sarkar, C.; Sinha, V. Influence of post-harvest crop residue fires on surface ozone mixing ratios in the NW IGP analyzed using 2 years of continuous in situ trace gas measurements. J. Geophys. Res. Atmos. 2016, 121, 3619–3633. [Google Scholar] [CrossRef] [Green Version]
  53. Rana, A.D.; Parvez, S.; Ul-Haq, Z.; Batool, S.A.; Chaudhary, M.N.; Mahmood, K.; Tariq, S. Anthropogenic, biogenic and pyrogenic emission sources and atmospheric formaldehyde (Hcho) and Nitrogen Dioxide (NO2) columns over different landuse/landcovers of South Asia. Appl. Ecol. Environ. Res. 2019, 17, 10989–11015. [Google Scholar] [CrossRef]
  54. Kumari, S.; Lakhani, A.; Kumari, K.M. Variation of carbon monoxide at a suburban site in the Indo-Gangetic Plain: Influence of long-range transport from crop residue burning region. Atmos. Pollut. Res. 2021, 12, 101166. [Google Scholar] [CrossRef]
  55. Yadav, R.; Sahu, L.K.; Beig, G.; Jaaffrey, S.N.A. Role of long-range transport and local meteorology in seasonal variation of surface ozone and its precursors at an urban site in India. Atmos. Res. 2016, 176, 96–107. [Google Scholar] [CrossRef]
  56. Kaskaoutis, D.G.; Kumar, S.; Sharma, D.; Singh, R.P.; Kharol, S.K.; Sharma, M.; Singh, D. Effects of crop residue burning on aerosol properties, plume characteristics, and long-range transport over northern India. J. Geophys. Res. Atmos. 2014, 119, 5424–5444. [Google Scholar] [CrossRef]
  57. Badarinath, K.V.S.; Sharma, A.R.; Kharol, S.K.; Prasad, V.K. Variations in CO, O3 and black carbon aerosol mass concentrations associated with planetary boundary layer (PBL) over tropical urban environment in India. J. Atmos. Chem. 2009, 62, 73–86. [Google Scholar] [CrossRef]
  58. Roy, C.; Ayantika, D.C.; Girach, I.; Chakrabarty, C. Intense biomass burning over northern India and its impact on air quality, chemistry and climate. In Extremes in Atmospheric Processes and Phenomenon: Assessment, Impacts and Mitigation; Springer Nature: Singapore, 2022; pp. 169–204. Available online: https://link.springer.com/chapter/10.1007/978-981-16-7727-4_8 (accessed on 30 December 2022).
  59. Badarinath, K.V.S.; Chand, T.K.; Prasad, V.K. Agriculture crop residue burning in the Indo-Gangetic Plains–a study using IRS-P6 AWiFS satellite data. Curr. Sci. 2006, 91, 1085–1089. Available online: http://www.jstor.org/stable/24093988 (accessed on 30 December 2022).
  60. Reid, J.S.; Koppmann, R.; Eck, T.F.; Eleuterio, D.P. A review of biomass burning emissions part II: Intensive physical properties of biomass burning particles. Atmos. Chem. Phys. 2005, 5, 799–825. [Google Scholar] [CrossRef] [Green Version]
Figure 1. (A) Location of Agra in Map of India, and (B) Sampling site (Dayalbagh Educational Institute, Agra) in the IGP.
Pollutants 03 00013 g001
Figure 2. Day-to-day variability of PM and trace gases during the pre-harvest and post-harvest periods.
Pollutants 03 00013 g002
Figure 3. NO2 Tropospheric column during the pre-harvest and post-harvest periods.
Pollutants 03 00013 g003
Figure 4. BTEX concentrations during the pre-harvest and post-harvest period.
Pollutants 03 00013 g004
Figure 5. Box plots showing the variation of PM2.5 and trace gases during the pre-harvest and post-harvest period.
Pollutants 03 00013 g005
Figure 6. Contour showing hourly variation of CO during the pre-harvest and post-harvest periods.
Pollutants 03 00013 g006
Figure 7. Air backward trajectory and wind direction during the (A) pre-harvest period and (B) post-harvest period at the study site.
Pollutants 03 00013 g007
Figure 8. MODIS fire activity during the (A) pre-harvest and (B) post-harvest period.
Pollutants 03 00013 g008
Figure 9. FESEM-EDX images of PM2.5 filter papers during the pre-harvest and post-harvest crop residue burning events.
Pollutants 03 00013 g009
Disclaimer/Publisher’s Note: The statements, opinions and data contained in all publications are solely those of the individual author(s) and contributor(s) and not of MDPI and/or the editor(s). MDPI and/or the editor(s) disclaim responsibility for any injury to people or property resulting from any ideas, methods, instructions or products referred to in the content.

