1. Introduction
Climate change is perceptible nowadays. Extensive drought or rainfall, extreme temperatures, glacier melting, and sea level rise have been observed, all of which have a direct impact on human health, the economy, society, flora, and fauna [
1]. The most significant consequence of climate change is that our planet will become uninhabitable for life in few years, and the situation is worsening by day.
In June 1992, the United Nations Framework Convention on Climate Change was signed in Rio de Janeiro, with the goal of limiting climate change [
2]. The aim of this Convention was to keep greenhouse gas concentrations in the atmosphere stable at a level that would prevent hazardous anthropogenic climate intervention. The Convention also stated that the developed countries should do more to combat climate change by adopting policies and initiatives to mitigate climate change, with the goal of returning CO
2 and GHG emissions to 1990 levels by the year 2000 [
2]. In order to operationalize the United Nations Framework Convention, the Kyoto Protocol was established in 1997 [
3], with legally binding targets for industrialized countries to limit and reduce GHG emissions in accordance with agreed individual targets. The EU and its Member States agreed to an 8% reduction compared to 1990s emissions during 2008–2012 [
4]. Finally, the main target of the Paris Agreement in 2015 was to strengthen the global response to the threat of climate change by keeping the rise of average global temperature below 2 °C and to strive to limit the temperature increase even further to 1.5 °C [
2]. Additionally, the aim is to reach a zero-emission state immediately after 2050 [
5].
The National Energy and Climate Plan (NECP) of Greece in compliance with the Paris Agreement is the strategic plan of the Greek Government for climate and energy issues, setting out a detailed roadmap regarding the achievement of specific energy and climate targets by 2030. The NECP describes priorities and policy measures in respect to a wide range of development and economic activities intended to benefit Greek society, and therefore it is considered as a reference for the forthcoming decade [
6]. Europe’s targets up to 2030 include 40–45% GHG emissions reduction in comparison to 1990s emissions, 32.5% improvement in energy efficiency and 32% share of renewable energy in total energy consumption. Policy measures include various directives to improve energy efficiency, renewable energy, electricity supply, reformation of the European Emissions Trading Scheme, as well as governance measures including national energy and climate plans [
7].
Furthermore, in view of a total energy system reformation and the transition away from fossil fuels, specific initiatives are already being promoted and implemented such as the simplification and acceleration of the licensing framework in Greece, the optimal integration of Renewable Energies in the electrical network, the operation of storage systems, and the promotion of electricity use as a fuel. The target for 2030 energy consumption is set to be lower than the consumption in 2017 [
8]. Additionally, energy renovation of a large number of buildings (especially of the old ones, i.e., over 30 years old) will also contribute to achieving the long-term target of neutrality by 2050 [
9]. In any case, the war in Ukraine and the uncertainty of the future Russian gas supply, especially in Europe, will reshape the global energy status. Therefore, estimations and provisions of today should be reconsidered.
However, the energy sector is still playing a very important role in GHG emission inventories and is the biggest contributor of GHG emissions in the developed countries [
10] due to coal-related processes (mining and combustion). Moreover, the improvement in human living standards has also influenced the CO
2 emission trend over the years related to the increase in energy/electricity consumption. At the same time, total CO
2e emissions per electricity produced have decreased mainly as a result of the introduction of natural gas and renewable energy sources into the electricity system (partial energy network reformation). Nevertheless, the decreasing trend for emissions in the years 2008–2018 is also strongly related to the economic recession that Greece is facing and to the mitigation actions that took place [
2,
11]. The availability of hydropower, on the other hand, has a considerable impact on emission levels. For instance, due to the penetration of natural gas and the high availability of hydropower, the considerable rise in electricity consumption in 2008 was not followed by a similar increase in emissions [
2,
12,
13].
The most common technique to represent and calculate the climate change is through the use of carbon and ecological footprints. The carbon footprint estimates the amount of carbon dioxide emitted into the atmosphere as a result of a specific lifestyle or operation and contributes to global warming, whereas the ecological footprint estimates the amount of land required to support a specific lifestyle or operation by measuring the use of bio-productive space [
14].
Carbon footprint considers all six greenhouse gases included in the Kyoto Protocol: Carbon Dioxide (CO
2), Methane (CH
4), Nitrogen Monoxide (N
2O), Hydrofluorocarbons (HFCs), Perfluorocarbons (PFCs), and Sulfur Hexafluoride (SF
6) and is measured in tons of carbon dioxide equivalent (tCO
2e). Carbon dioxide equivalent (CO
2e) allows different greenhouse gases to be comparable with each other on a calculation basis having one unit of carbon dioxide (CO
2) as a unit of measurement. CO
2e is calculated if we multiply the emissions of each of the six greenhouse gases with their global warming potential period of 100 years [
14]. More specifically, CO
2e compares emissions from all greenhouse gases in relation to CO
2 which has a GWP equal to one. The carbon dioxide is set as the reference gas and the basis of comparison for all other gases. ISO Standards are well-structured tools that integrate scientific knowledge into comprehensive methodology and the best way to accomplish a goal. In this case, ISO 14060 is a group of standards related to GHG emissions and include ISO 14064-1, ISO 14064-2 ISO 14064-3, ISO 14065, ISO 14066, and ISO/TR 14069. Many companies and organizations comply to and are certified by these standards for carbon footprint control [
15]. On the other hand, universities have their own carbon and ecological footprint as a result of their operations and activities, taking into consideration their multidimensional mission. Hence, several studies have been conducted at universities throughout the world calculating either their carbon or ecological footprint.
The majority of the studies that are calculating the carbon footprint found that, regarding energy consumption, electricity consumption was the biggest most significant contributor. According to the guidelines of the Intergovernmental Panel on Climate Change (IPCC), activity data and data from campus operations (i.e., liters of fuel, kWh of electricity, commuting, eating habits) were converted into tons of equivalent carbon dioxide (tCO
2e) using the relevant emissions factor. The necessary input data were obtained from online questionnaires. A number of studies conducted by Suan Sunandha Rajabhat University in Thailand [
16] and Tongji University in China [
17] expressed their calculations per personal average carbon footprint. In the case of Thailand University [
16], where students reside near the university and commute primarily by public transportation, the estimated personal footprint of 35 students was about 2.16 tCO
2e/yr. In a more detailed study of Li et al. [
17], the answers given by 1029 people at Tongji University resulted in approximately 3.84 tCO
2e for a 9-month academic duration. Dining was found to have the biggest share of the daily activities (65%) with 34% against 15% which results from academic activities (i.e., use of computers for studying, printing and scanning) and 14% from electricity consumption in dormitories. Finally, it is proposed that to reduce the universities’ carbon footprints, an environmental campaign (e.g., use of new low energy consumption technologies, energy saving, and waste sorting) needs to be launched focusing on the right behaviors of each individual person from the academic society.
Furthermore, the Southeast European University in Tetovo (N. Macedonia) [
18] not only calculated the carbon footprint using an improved campus carbon calculator for Clean Air–Cool Planet (CA-CP), but also prepared a Climate Action Plan (CAP) that prioritizes actions and sets milestones to achieve carbon neutrality. The university has an area of 20.000 m
2 and 6000 students while the starting point is the year 2009. The strategy for reducing GHG emissions included the design of environmentally friendly buildings including actions such as building insulation, light bulb replacement with lower-consumption bulbs, and the installation of solar panels, water heaters, and photovoltaic systems capable of covering 28% of total load. Regarding commuting, alternative forms of transportation include carpooling, public transportation, and alternative cars such as hybrids and electric vehicles, as well as long-term usage of biofuels. In this case, the usage of video conferencing as a means of communication is utilized in order to reduce commuting as well. Finally, waste management and recycling were incorporated into the university’s policy since they not only reduce CO
2 emissions but also contribute to behavior change.
The carbon footprint of Birla Institute of Technology and Science, Pilani Campus (India [
19], was calculated using the life cycle analysis for the academic year 2014–2015, with the goal of serving as a model for other universities in India. For the CO
2 emissions estimate, the ISO 14064 GHG protocol was used. The life cycle approach was used to quantify the emissions via Umberto NXT Universal software and Ecoinvent v 3.0 database. An offline survey was conducted to collect data regarding travel, commuting, and food habits. Other consumption and procurement data were collected from various authorities within the institute. Results showed that 50% of GHG emissions are coming from scope 2 due to high operation hours of air-conditioning systems while 48.9% are coming from scope 3 due to commuting and business travel (68%) and engineering services.
What was missing from the above-mentioned studies was a universal carbon footprint standard as analyzed by Robinson et al. [
20]. In other words, a standard methodology, a consistent and transparent approach in assessing the carbon footprint. The study resulted in a four-step process by: (a) establishing organizational boundaries, (b) defining the operational limits, (c) quantifying the carbon footprint, and (d) reporting and validating the outcomes. Alternatively, scoping (which includes organizational boundaries and activities), conceptualizing, and communicating. The methodology is similar to that of ISO standards.
Later, the carbon footprint assessment of Universitat Jaume I in Spain [
21] was an attempt to construct an excel file tool called CO
2UNV to calculate the carbon footprint of universities and be the evolution of the Campus Carbon Calculator. The main goal of this tool was to be applicable for universities worldwide and the results among them to be comparable. All three scopes are included as well as offsets, report generation, and trend analysis. It also gives the opportunity to insert emission sources and their emission factors. Existing emission factors can be expanded and updated as well. The case of Universitat Jaume I was the verification of the tool, but its importance is indisputable because calculation is simple, flexible, accurate, and complete.
Finally, Bournemouth University [
22] in the UK calculated the impact of COVID-19 lockdown on its CO
2 footprint. The study covers the period from 1 April to 30 June 2020, when the campus was closed, all operations were ceased, and working/learning operations were online. The results were compared with those of previous years (2018 and 2019) in the same period using GHG conversion factors from GOV. UK. As expected, data used in 2018 and 2019 calculations (such as processes required for on-campus teaching, research and support services, staff travel using the university’s fleet, staff business travel, and staff and student commutes) were not applicable in the 2020 calculation. On the other hand, extra emission sources were added, relevant to working and studying from home (use of laptop and desktop PCs, electrical consumption for lighting, breakfast, and lunch preparation). Results revealed that the total carbon footprint was reduced by about 29% and the largest contribution was from distant working/studying. The interesting finding is that despite the lockdown, work/study from home can generate as much emissions as commuting!
In the case of Greece, the Campus University of Patras firstly calculated its carbon footprint in 2013 [
23] with necessary data taken from online surveys and relevant offices. Information on energy and water consumption, as well as waste management, were also provided for each department from the University’s “Environmental Management and Sustainability Office”. It is noteworthy that the carbon footprint of an organization is the key indicator not just of its energy consumption profile, but also of its people’s behavior and culture. Moreover, it can be used as a starting point for GHG and energy reduction initiatives by developing an action plan along with a sustainable environmental culture among the university members.
Therefore, the current study aims to precisely measure the carbon footprint as well as the electricity consumption of the University of Patras collecting data that were not available in the initial effort and deriving from all existing sources of CO2 emissions. For the calculations, a “Carbon Campus Calculator” was used. To the best of the authors knowledge, till submitting the present study, no similar work was reported in the literature concerning the Campus University of Patras. The calculations are based on closing the loop by identifying applicable actions for every valid root cause, aiming to eliminate manual work and calculations, supporting automation and digitalization. In addition, it is a systematic approach to deal with fundamental organizational changes in the future management of the university. The following questions guided this study:
What are the exact GHG emissions of the University of Patras considering all emission sources (all scopes)?
Which are the biggest contributors to the carbon footprint?
What is the university’s ranking among local consumers in the Region of Western Peloponnese according to the outcomes?
Can the GHG emissions of Patras University be reduced in compliance with the NECP?
How feasible is it to draw up an environmental action plan for a ‘green’ university?
3. Results
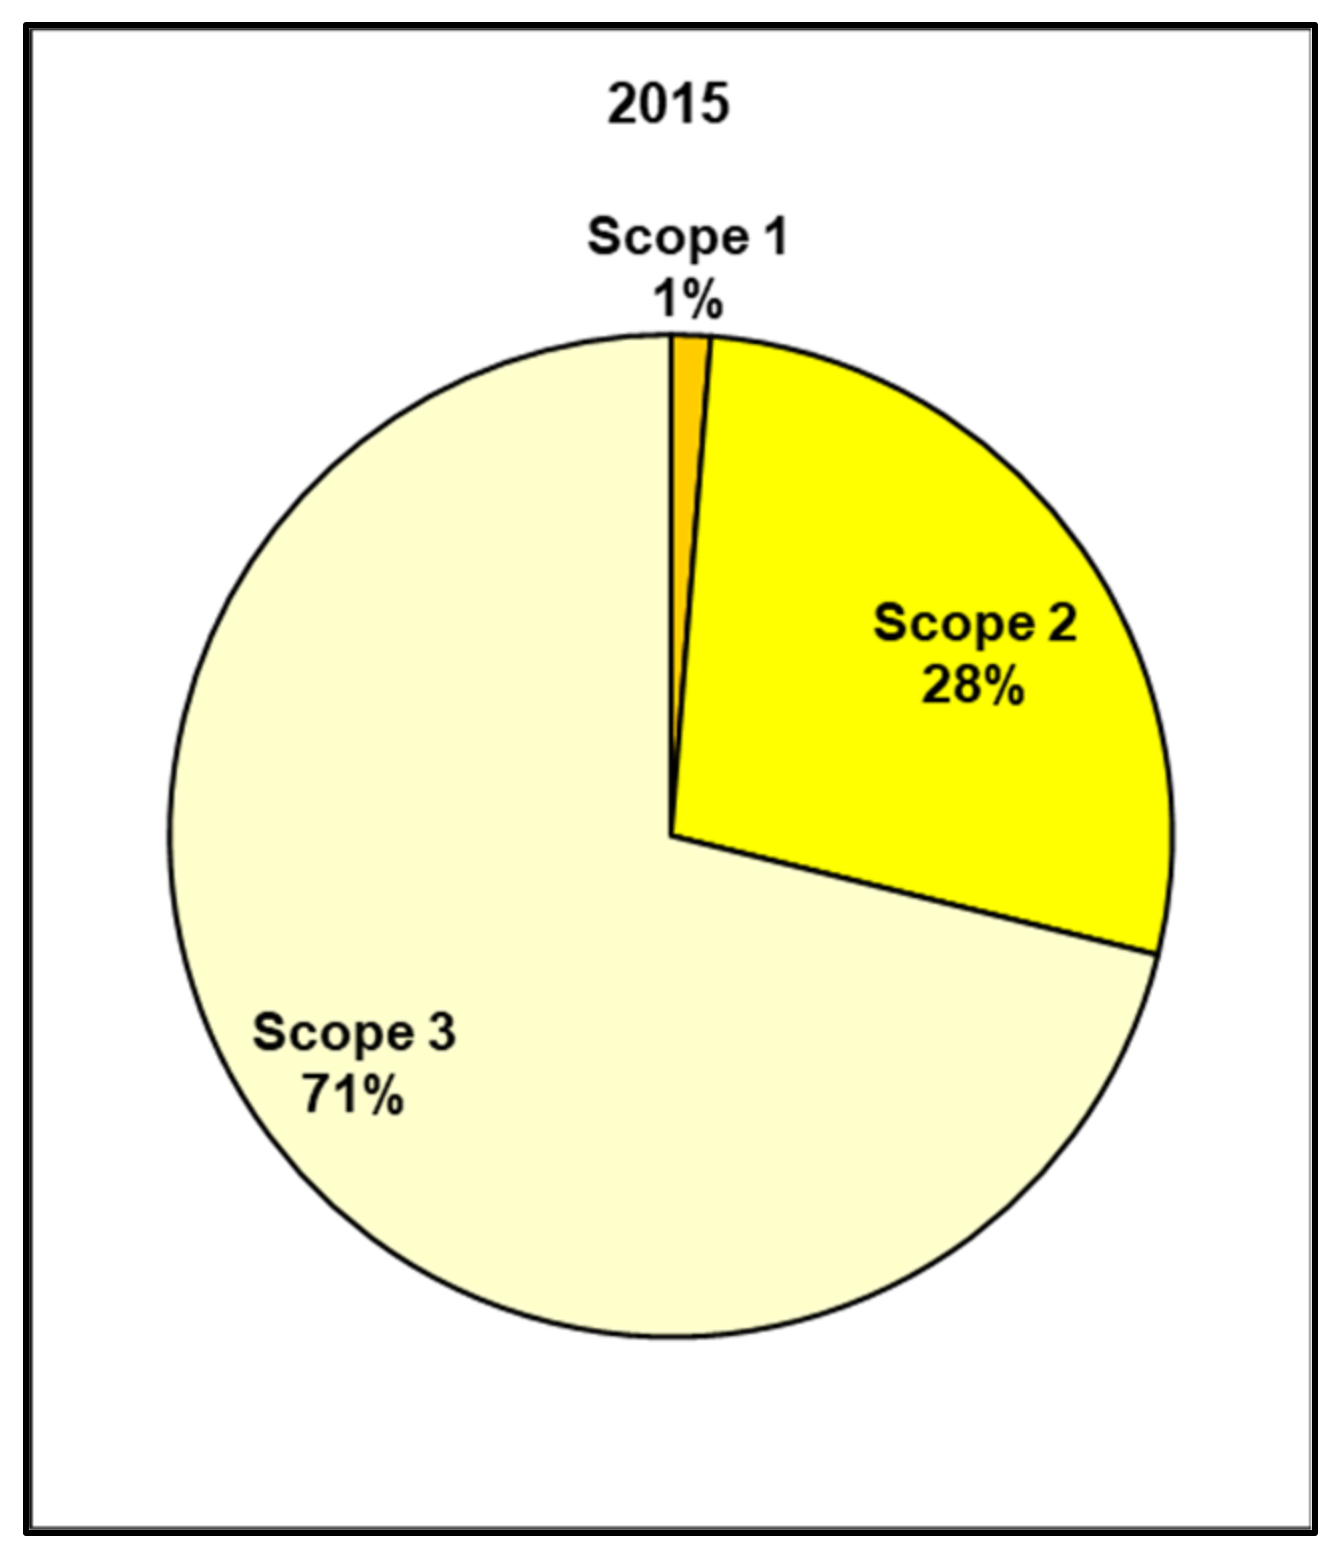
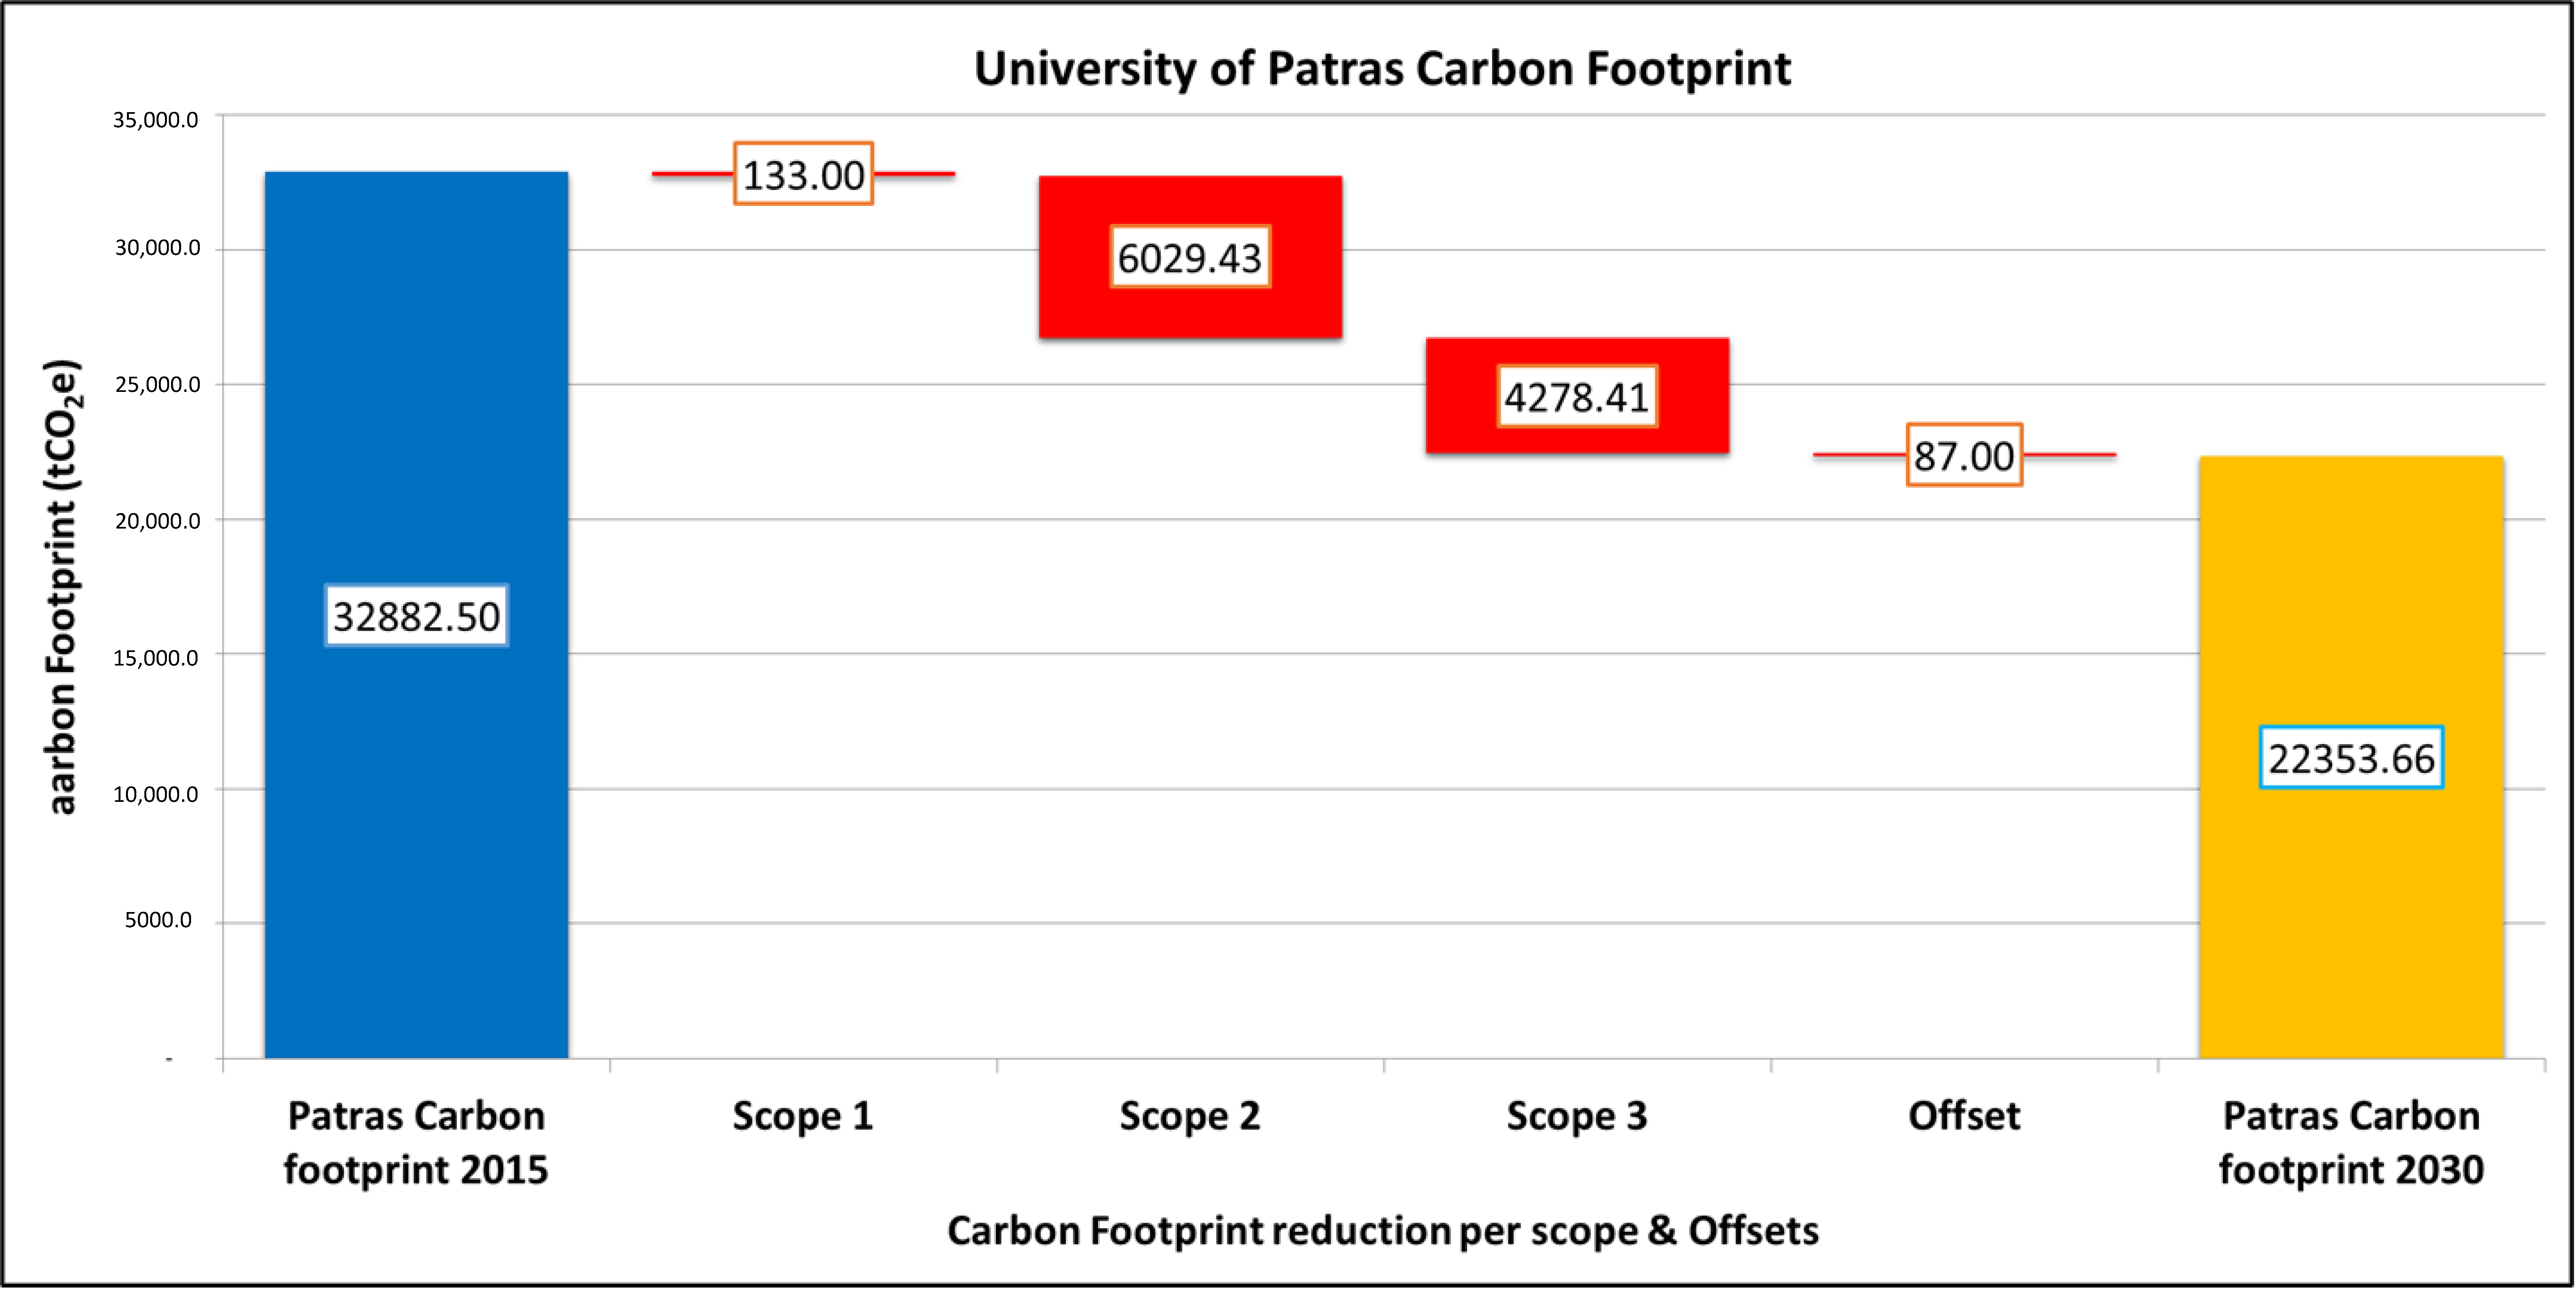
The carbon footprint of the Rio Campus of the University of Patras was calculated at 32,882.5 tCO
2e for 2015. Contribution from scope 1 was 418.1 t CO
2e, 9059.5 t CO
2e from scope 2 (electricity consumption), and 23,404.9 t CO
2e from scope 3 as shown in
Figure 2.
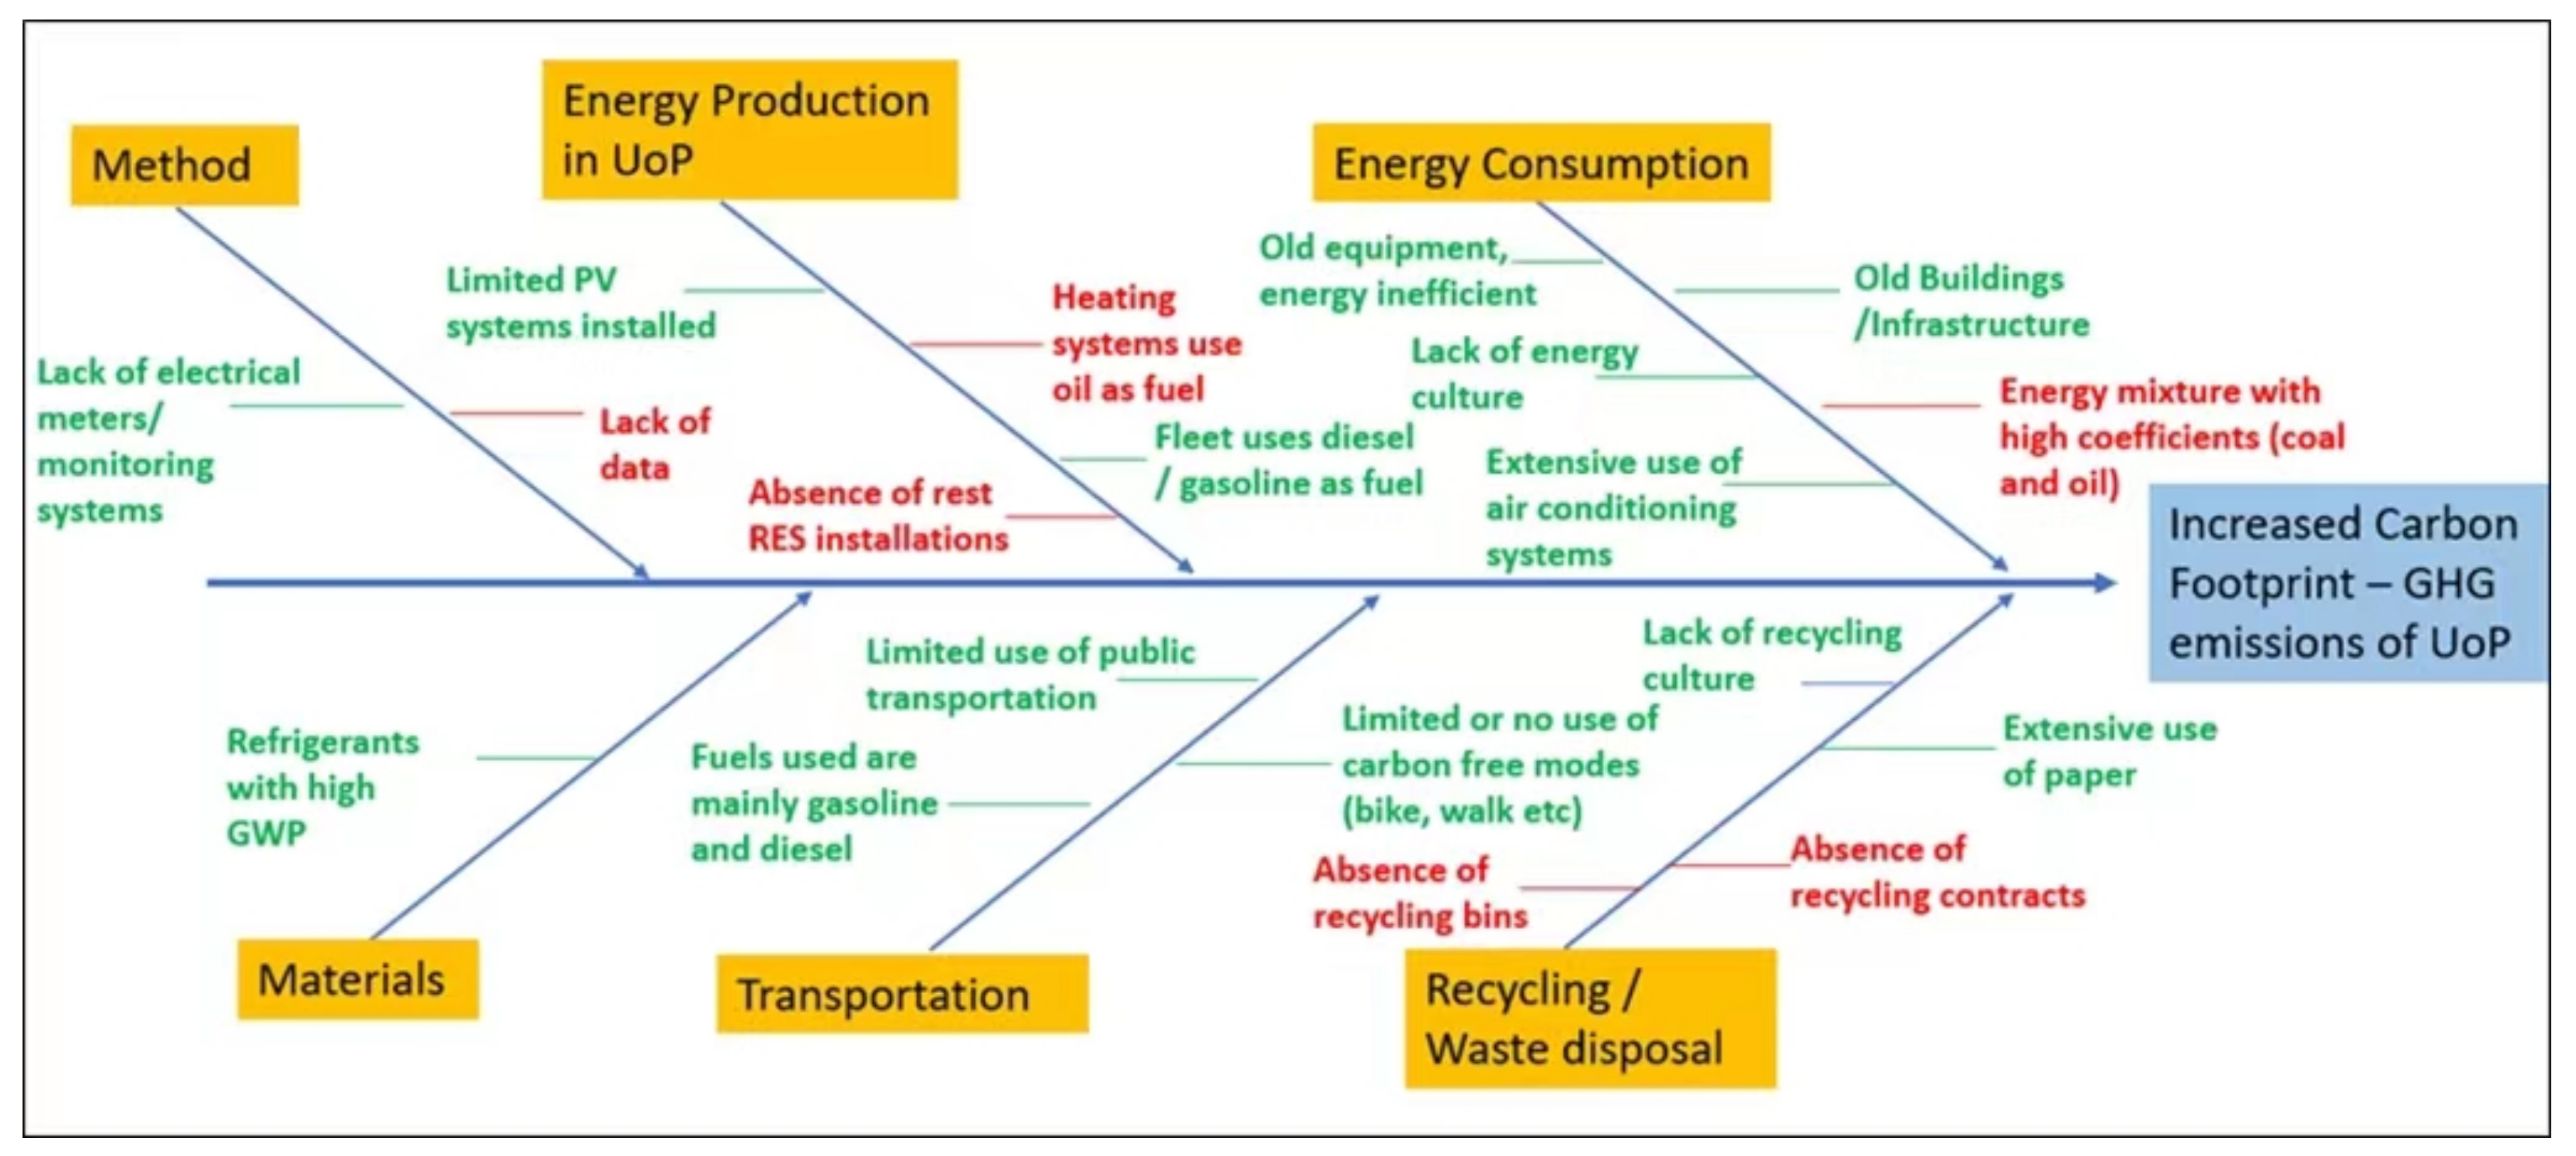
It is noteworthy that the largest contribution to the footprint comes from scope 3 concerning commuting, travel, recycling and waste production of the Rio Campus, and disposal.
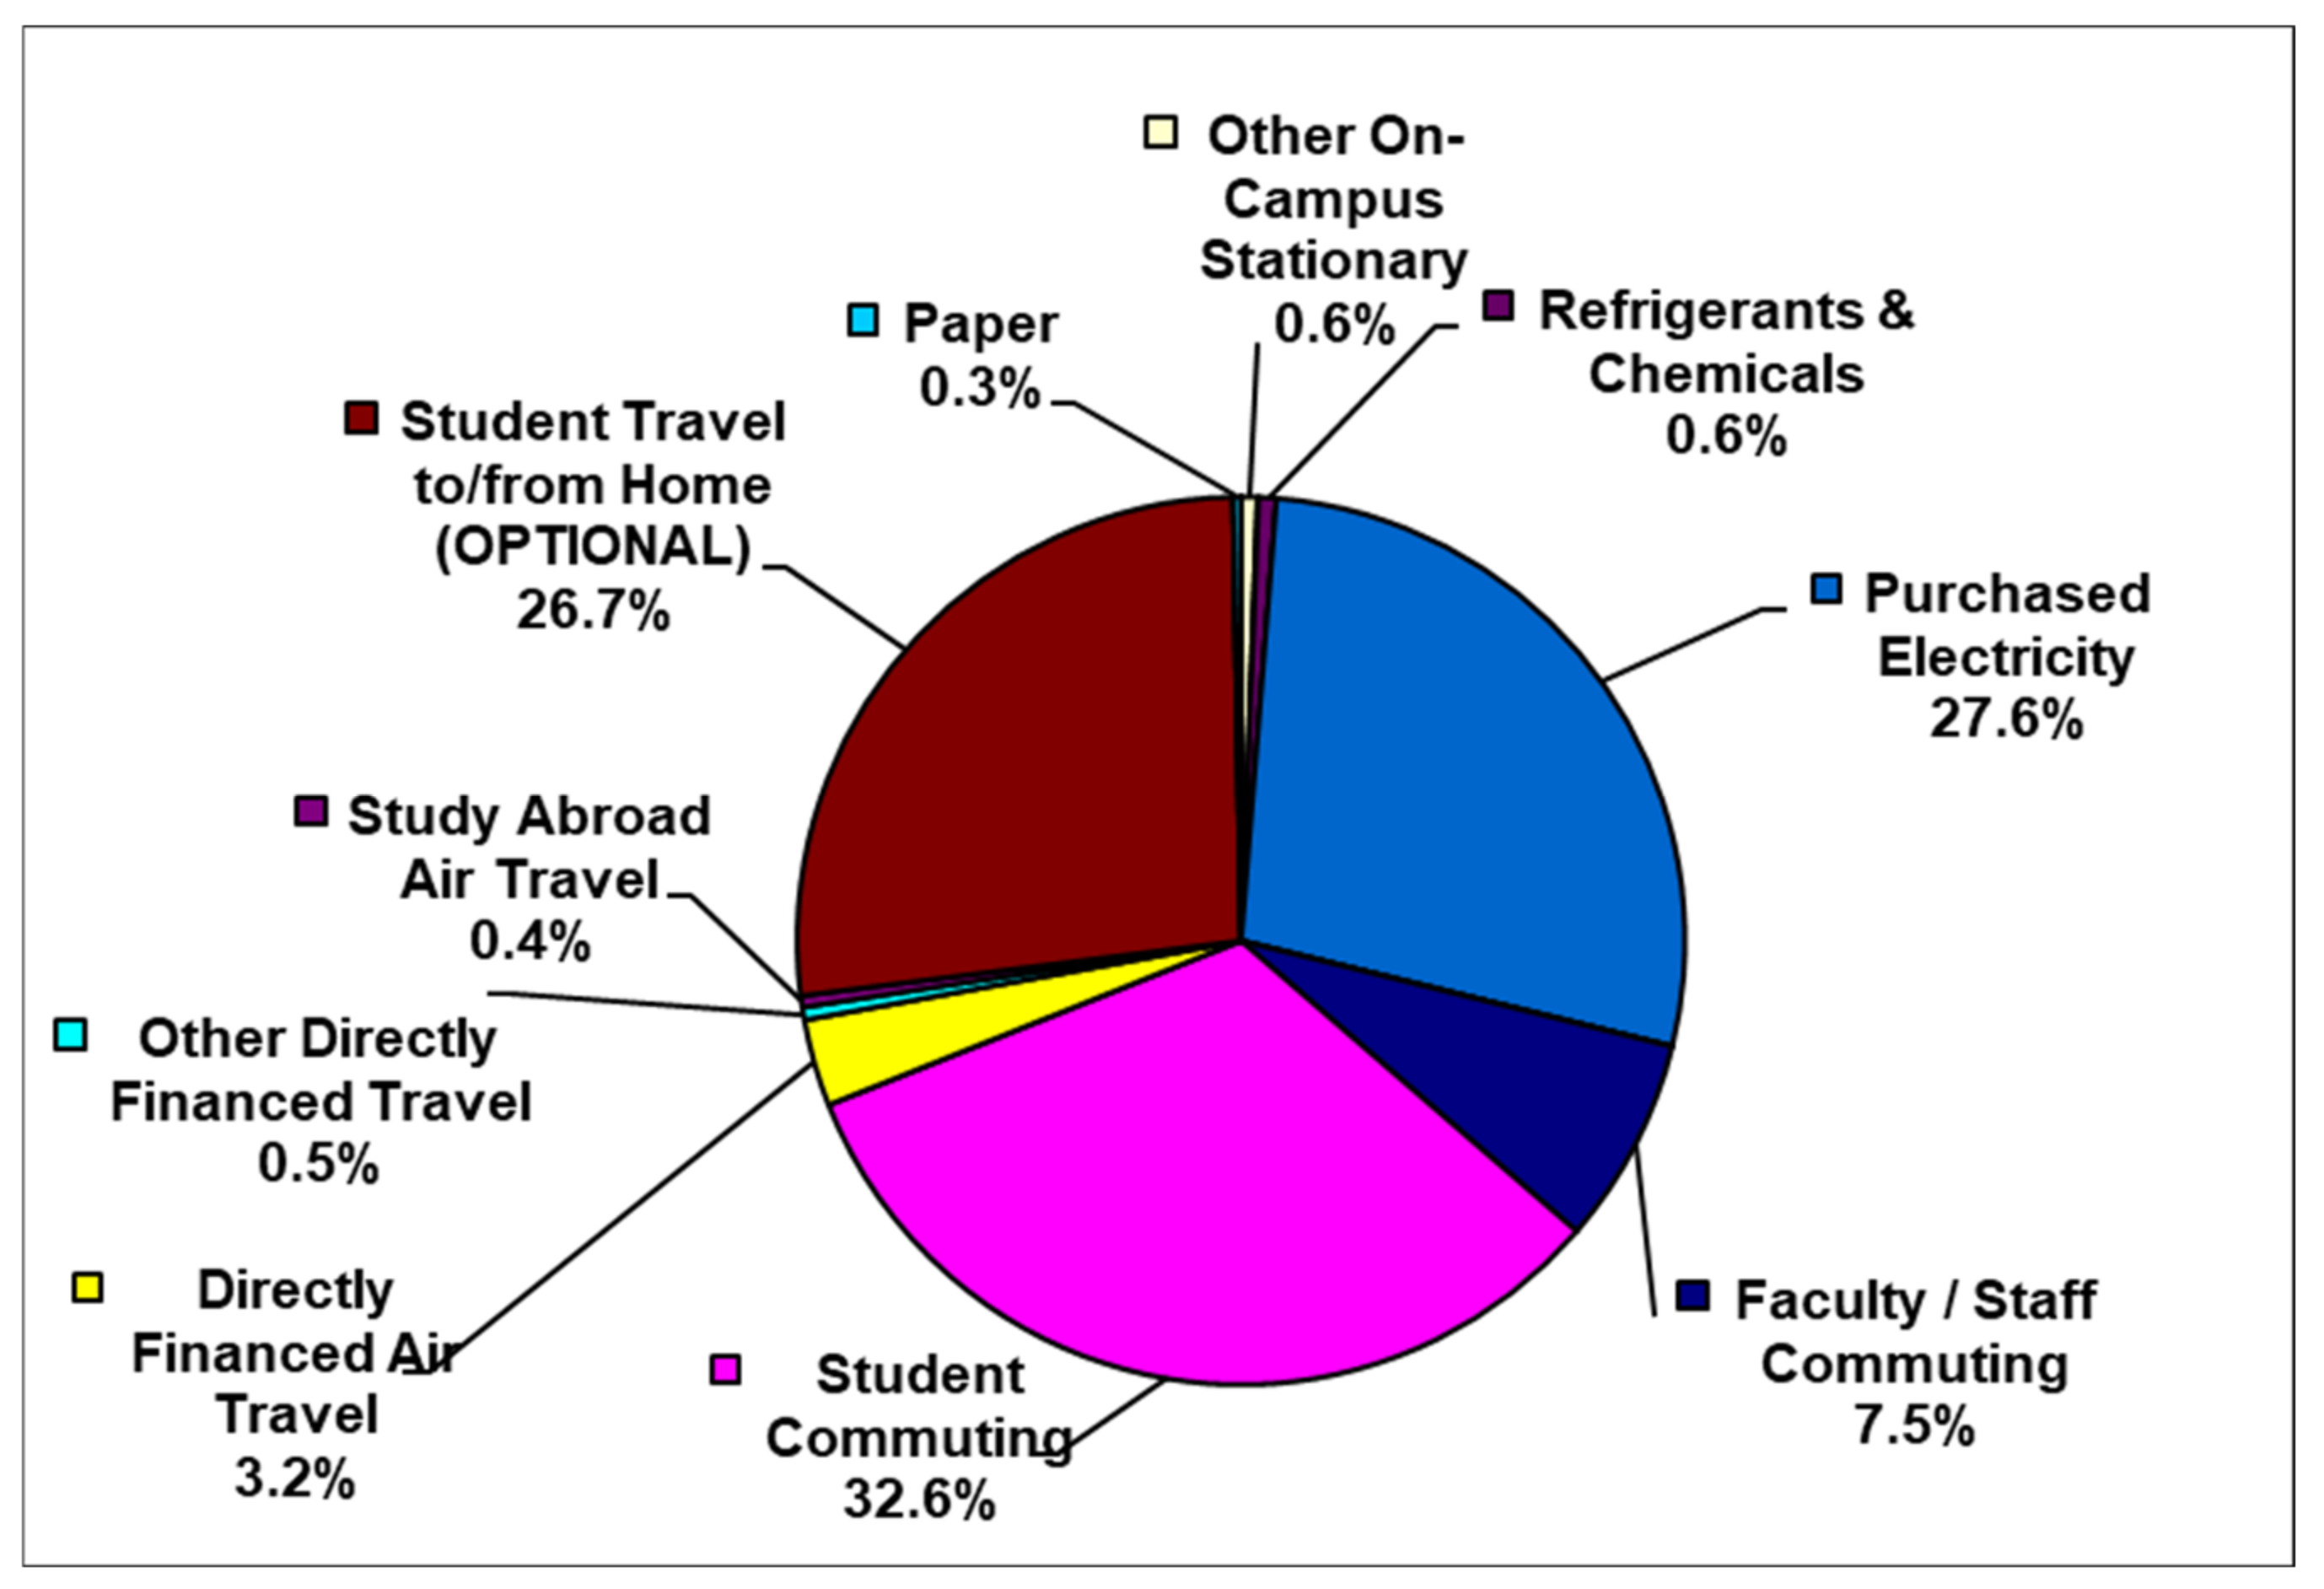
Further deployment, contribution to CO
2 emissions per emission source, helps realize and set objective and realistic goals for their reduction. The largest contribution to the carbon footprint comes from students commuting to/from the university (32.6%), the second largest source of greenhouse gas emissions is electricity (27.6%), followed by travel to/from the place of permanent residence of university members (26.7%), while staff and faculty commuting is only 7.5%. All other sources contribute at a lower rate as shown in the chart below (
Figure 3).
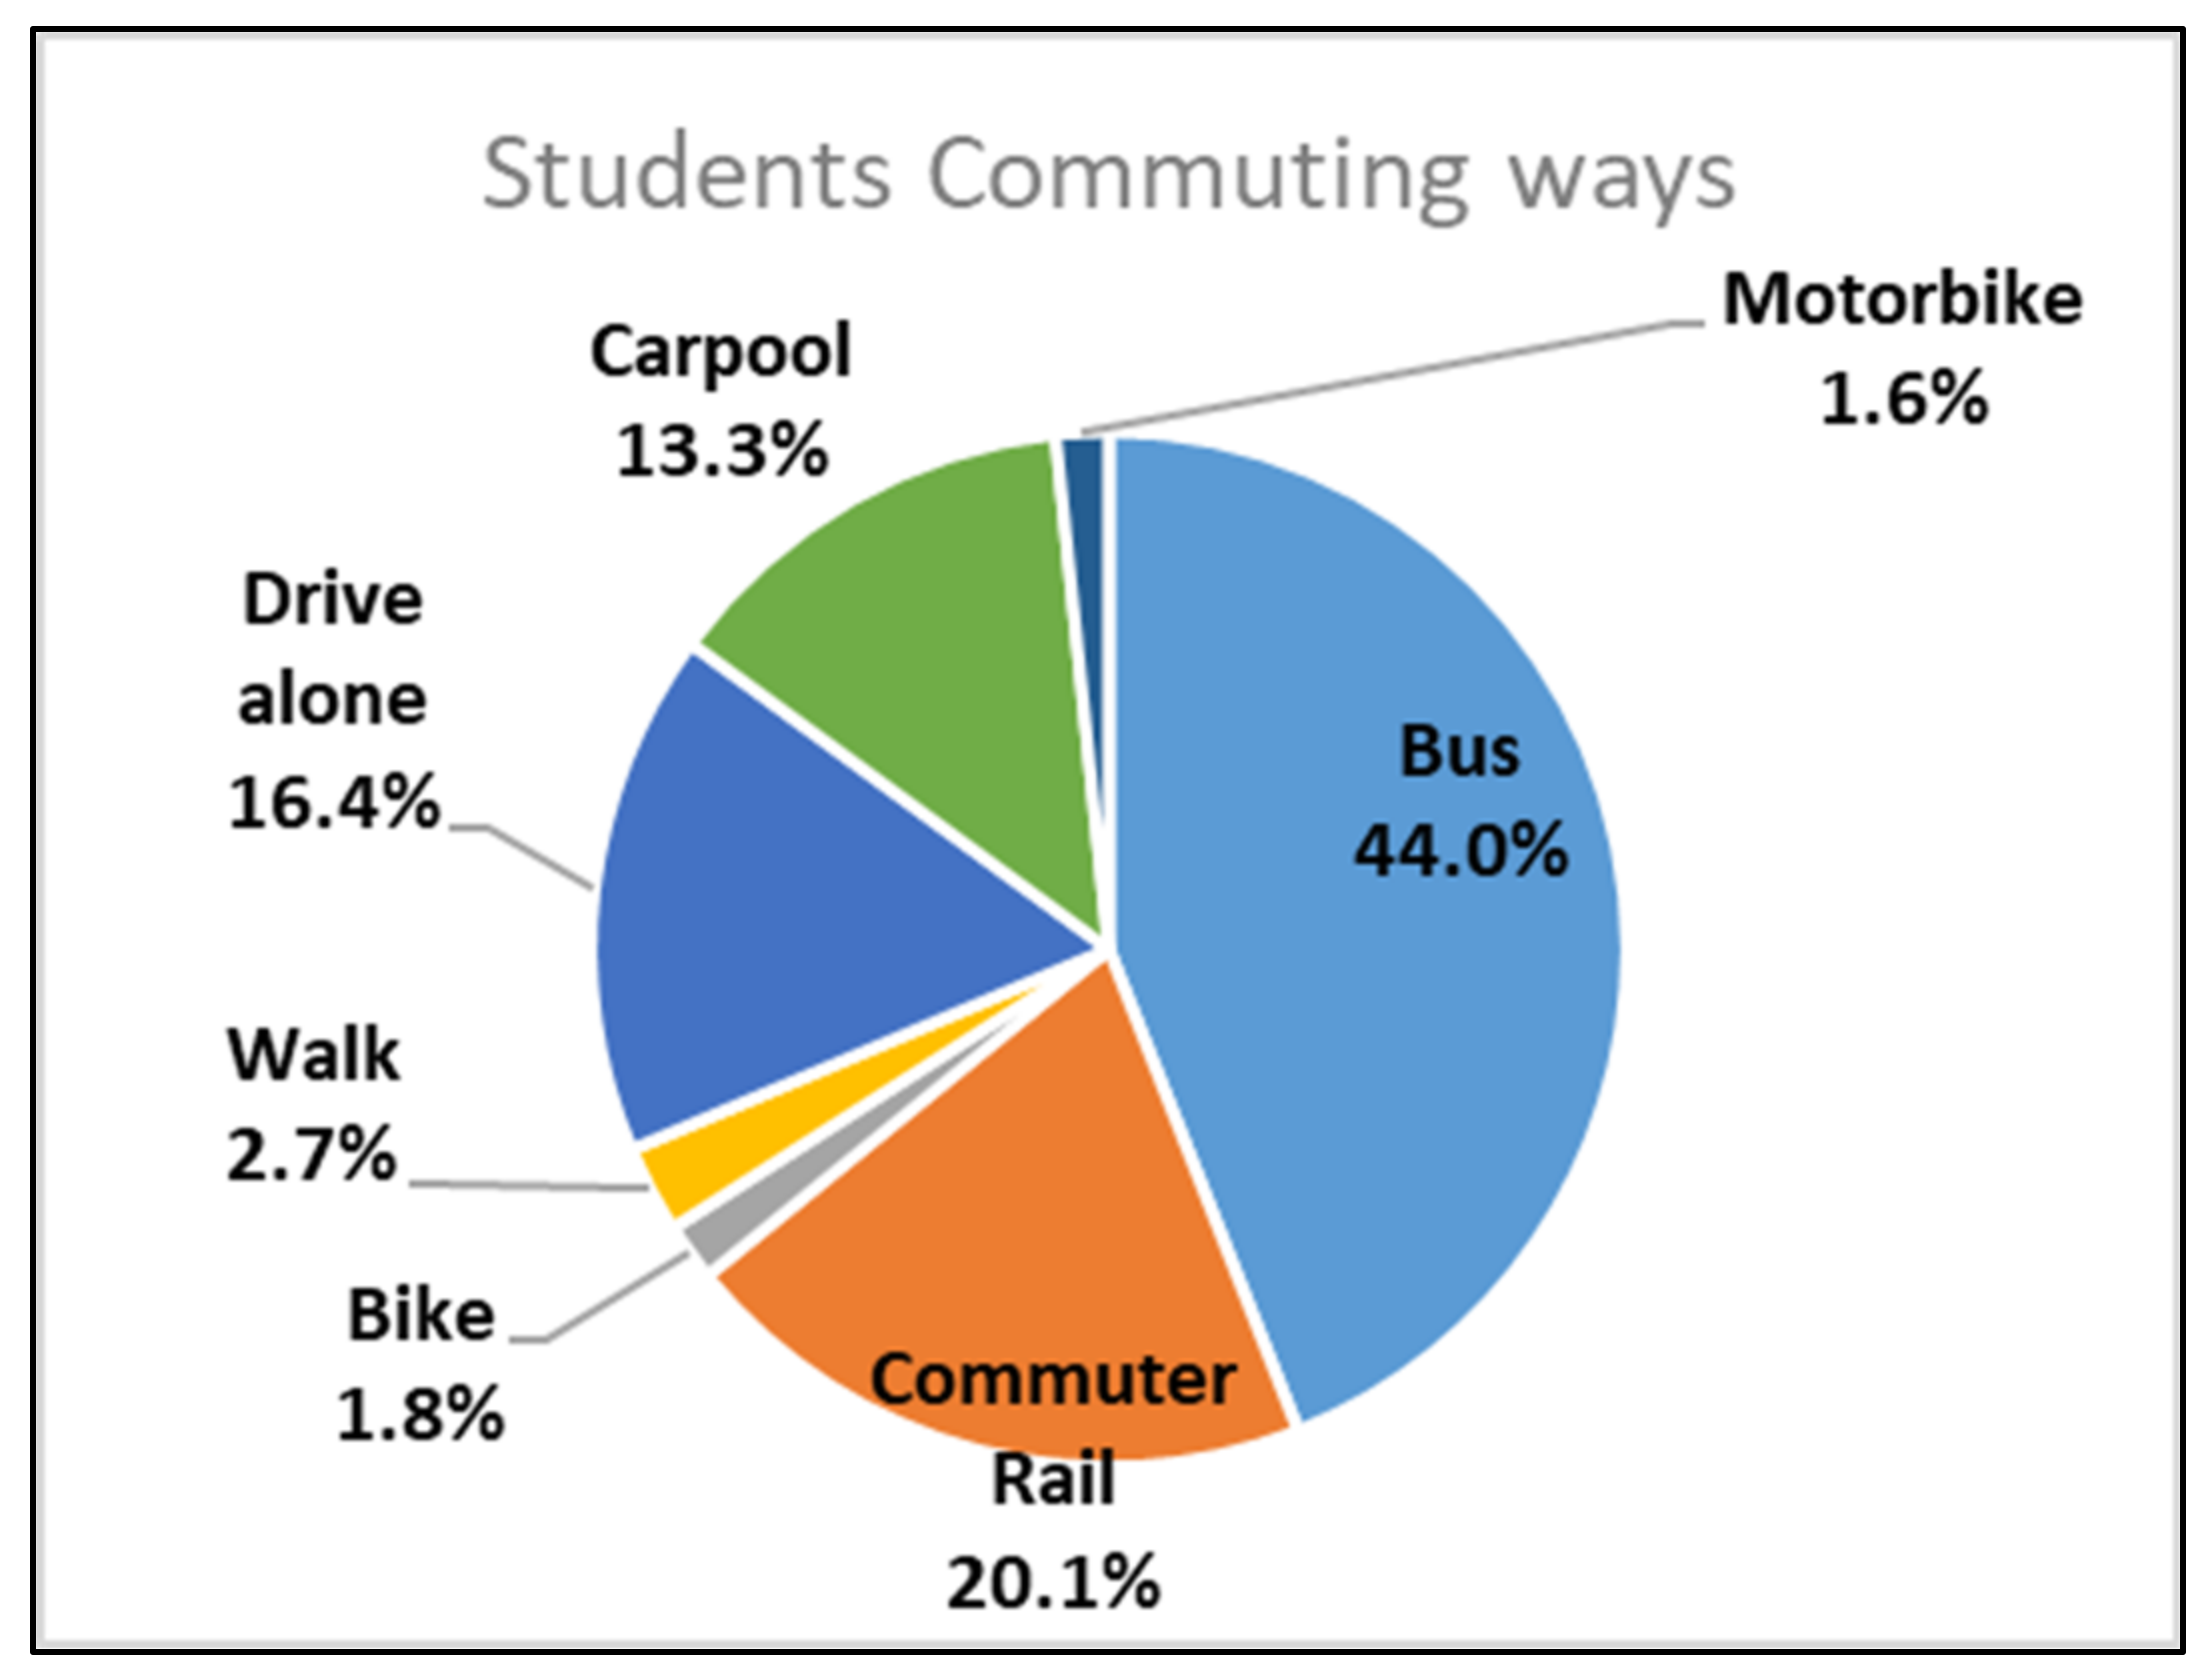
In terms of third-level deployment in student commuting, the results obtained from an online survey,
Figure 4 showed that 44% prefer the bus, 20.1% the light rail, 16.4% the car (drive alone), 13.3% carpooling, 2.7% walking, 1.8% cycling, and 1.6% motorcycling. Therefore, the majority of students use public (64.1%) and carbon-free transportation (4.5%) which amounts to almost 70%.
At this point, it is obvious that initiatives that will form the Action Plan of the University of Patras must focus primarily on reducing scope 3 emissions, particularly student commuting and electricity consumption, which account for 60.2% of the University of Patras Carbon Footprint.
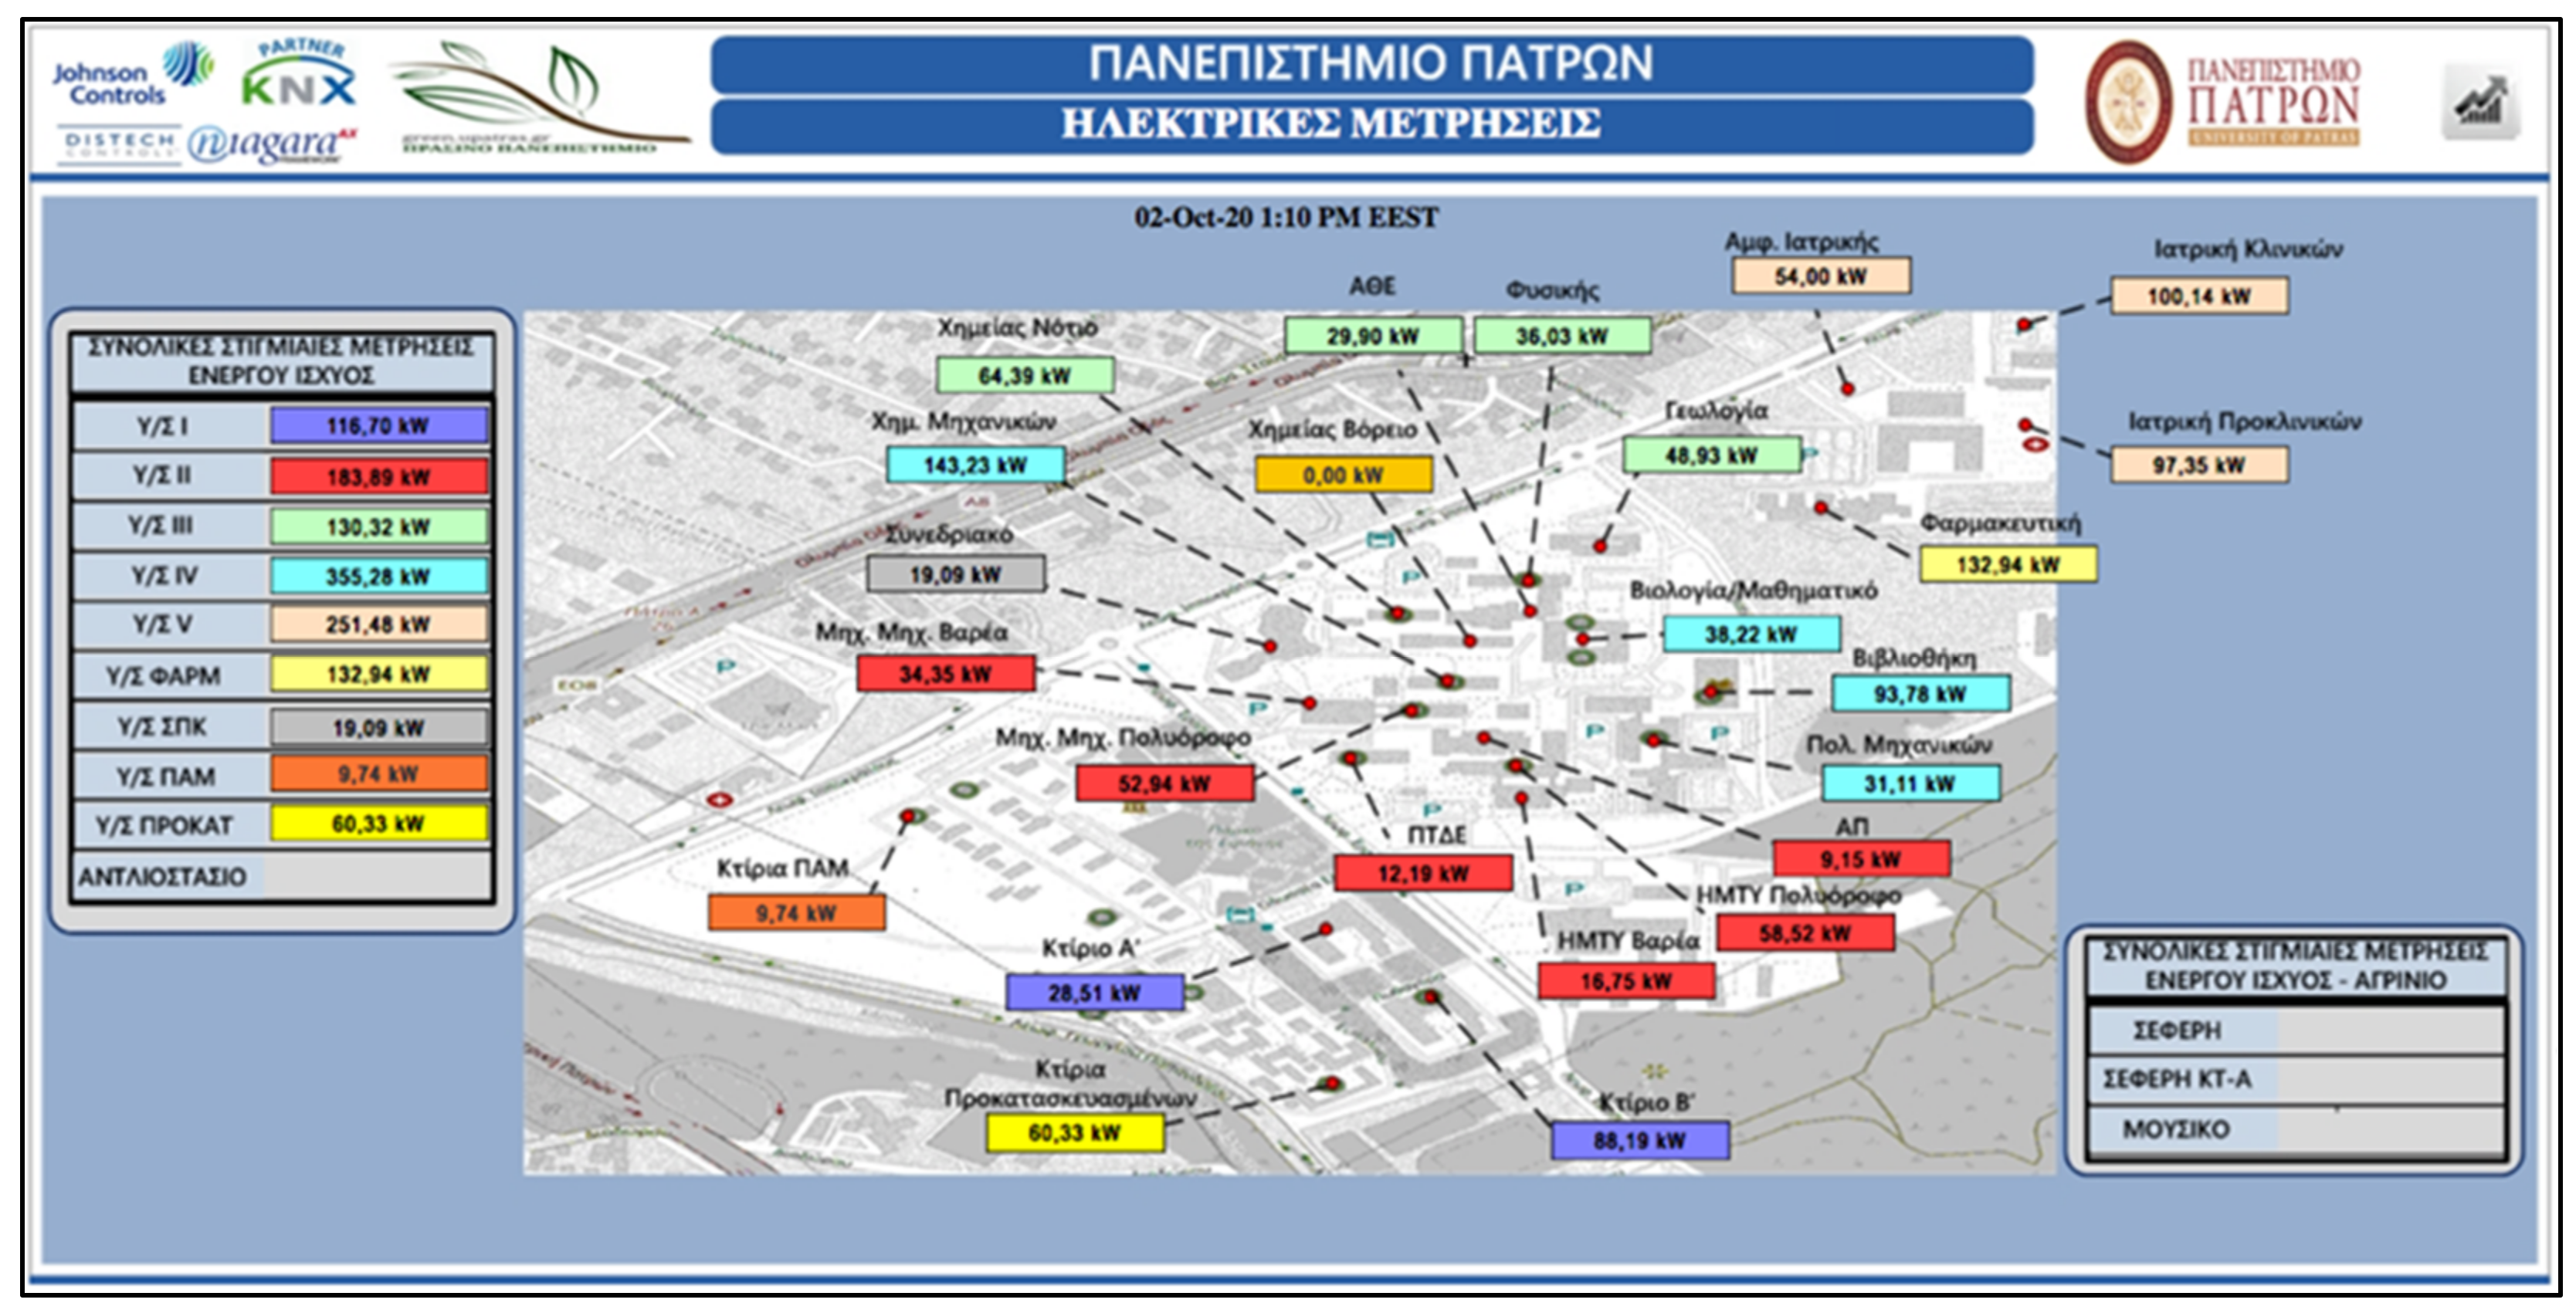
Data for electricity consumption were taken from department’s individual energy meters with manual processing from the “Environmental Management and Sustainability Office” of the University of Patras. Because of the gap and constraints met and the large number of assumptions made, the University of Patras moved on by installing 28 energy meters with an online monitoring system in 2017, highlighting the importance of correct and accurate data recording.
The electricity online monitoring system was the first step for data collection and generation of a reference point of electrical consumption of the university. For every meter, a monthly trigger point is set, taking into account several criteria such as consumption during office hours (or not), working days or Sundays/holidays, seasons, estimation of weather data, building type, or other specific restrictions for every building and its operation such as electricity account per month (cost based).
These energy meters are interconnected with a central controller via the university’s data network. Data are then collected, processed, and displayed on a map (
Figure 5). It is possible to track real-time electricity consumption and total statistics for all buildings, draw useful conclusions, and monitor energy prices and intervene when they reach specified thresholds.
As a result, many findings emerged such as increased lighting (electricity consumption) and air conditioning in the Conference and Cultural Center of the University of Patras. After replacement of lighting with LED systems and air conditioning with high energy class systems (better CEER and COPS energy rate), a saving of 84.103 KWh (reduction 35%) between 2016 and 2017 was achieved which means 50.4 t CO
2e annual reduction and EUR 8543.19 annual cost savings [
28].
4. Discussion
Expressing the results as personal carbon footprint of university members, like Suan Sunandha Rajabhat in Thailand, Tongji university in China, and Birla Institute of Technology and Science in India, the case of the Rio Campus of the University of Patras is 0.85 tCO2e/person, much lower than the result of other universities although is much higher than their total carbon footprint. The reason is that this study involves the whole campus of the University of Patras and all potential carbon sources. For Birla Institute of Technology, the personal carbon footprint is much higher (4.6 tCO2e/student) mainly due to excessive electricity consumption and high coefficient factor as coal-based electricity is around 60%. The two universities used the same methodology for carbon footprint calculation (data collection from relevant offices and survey for commuting and travel).
In the other studies [
16,
17,
18,
19], the largest contribution to the carbon footprint comes from electrical consumption (except China’s case [
17] where the maximum contribution comes from eating habits), while in the University of Patras for both calculations of 2013 [
23] and 2015 the largest contribution comes from the commute of university members and travel, which are classified in scope 3.
In relation to the study in Tetovo [
18], Northern Macedonia, the ratios per source are similar to the University of Patras. The biggest difference is observed in electricity and is about 10%. Apart from this, we confirm that there are great similarities in the carbon footprints of the two institutions.
Comparing the two calculations of the Rio Campus of the University of Patras, the attempt of 2013 faced difficulties in data gathering (travel data, refrigerants) which had a large impact on the correct calculation carbon footprints. In the 2015 calculation, the carbon footprint of the University of Patras was almost 8 times larger than in 2013.
The University of Patras belongs to the Western Greece region. Western Greece [
29] is the fourth most populated region of Greece with Patras being its capital. Patras also is the third largest city of the country generating only 5% of the National GDP. Deindustrialization has been a serious problem of the area since 1990 and as a consequence high unemployment and ageing of the population are important issues in the region.
Electricity production in the region does not come from coal. Hydropower and renewable energy systems are installed in the area in wind and solar parks. Natural gas installation still does not exist.
Regarding transportation and commuting, there is only one airport in the region (with very small traffic) and four ports. The road network is the main way of commuting.
Agriculture (directly connected with fertilizer application from an environmental point of view) is significant only in remote areas and not close to cities.
Deployment of GHG emissions per capita and region showed that they are quite low (<10 tCO
2e) [
30]. This is totally compatible with the low personal carbon of the University of Patras, and the largest contribution comes from scope 3 (transportation, commuting, and travel)
In 2015, the University of Patras also evaluated the environmental culture among its members via the online questionnaire. Part D of the online survey was dedicated to environmental culture. The first question asked the candidates about the form of commuting they used 3 years previously to investigate the evolution over time. The second question asked the respondents if they know how they can affect the carbon footprint and the answers were 51% “no” and 49% “yes” which, in combination with the third (last) question (51% interested in being informed, 43% that it would be good for them to know, and only 6% answered no), we are led to the conclusion that an action plan and environmental campaign need to be developed in the near future.
The main benefits following the ISO Standards [
15] for Carbon Footprint Calculation are:
Evaluation of the carbon footprint of an organization and possibilities of its reduction.
Identify opportunities for energy savings and energy efficiency improvement.
Reduction in business, organization, or institution operating costs.
Presentation of reliable data.
Increasing the environmental awareness of its staff/members.
Promoting the corporate social responsibility of the company/organization and improving its corporate image.
ISO 14064 includes three parts, which can be used independently. ISO 14064-1 defines the principles and requirements for the quantification and reporting of greenhouse gas emissions of an organization. It covers the design, development, management, reporting and verification of an organization’s GHG inventory. ISO 14064-2 supports multiple types of GHG projects, sets out the principles and requirements, and provides guidance for the implementation of projects aimed at quantifying, monitoring, and reporting on greenhouse gas emissions or reductions. It covers the design of GHG projects, the identification and selection of sources, absorption and retention sites of GHG related to the project and the baseline scenario, the monitoring, quantification, documentation, and reporting of the performance of the GHG project, and the quality management of data. ISO 14064-3 sets out the principles and requirements and guides those who conduct or administer GHG inventory validation and/or verification. It can be applied to the quantification, monitoring, and reporting of the organization or greenhouse gases.
Even though ISO Standards provide guidance for GHG emissions management, only one study, the one of Birla Institute of Technology and Science Pilani, implemented it to quantify its emissions. Although ISO Standards are applicable for all organizations, implementation in educational institutions often has poor outcomes. The way of working in all studies and all universities, although is quite similar and similar to the methodology of ISO 14064, it is not strictly followed. It is in the nature of higher education to question existing standards and to open the horizons and promote knowledge and the learning process, setting new standards if needed. In fact, the opposite is common. Many standards came from studies and work undertaken by universities.
Setting targets and creating an action plan is a very important process for the success of this study. Targets should never be arbitrary but align with the targets of a larger group, organization, or community. Therefore, targets of the University of Patras should follow the targets of the country (NECP) which are in compliance with the targets of the European Union and EU’s targets comply with Global Goals.
Therefore, targets for the University of Patras can be:
Reduction of 42% of greenhouse gas emissions by 2030 compared to 1990, 55% compared to 2005, and then a linear reduction to make the transition to carbon neutrality in 2050 value equivalent to 10473.07t CO2e and emissions target for 2030 set to 22409.42 t CO2e.
Waste management for different types of materials (e.g., paper, plastic, batteries, lamps, etc.)
Energy from renewable energy sources should account for 35% of the total energy consumption.
Energy consumption in 2030 to be lower than in 2017. Energy records of 2017 showed that the energy consumption of the University of Patras was about 13 GWh.
It makes sense to prioritize actions and focus on actions that have a larger contribution in achieving the target with as little effort and cost as possible. From the 1st level deployment of carbon footprint, the target of GHG emissions reduction should be met by reducing emissions of scope 3, but deployment of the 2nd level indicates that the students commuting and electricity consumption (scope 2) are the biggest contributors. Third-level deployment shows that almost 70% of the students use public transportation and carbon freeways for commuting. The remaining 30% has quite low space for reduction and requires large efforts and costs to achieve it. Moving to the second contributor, there is large room for improvement and also the actions for achieving target (a) are common with the actions achieving targets (c) and (d) (
Figure 6).
It should be mentioned that by changing the energy mixture of the country, which is an external parameter for the University of Patras, there is a reduction in its carbon footprint without any other change but keeping energy consumption constant. Therefore, the University of Patras and other institutions can benefit from NECP actions carried out in parallel with their actions. One of the main targets of NECP is the coal exemption of Greece’s energy mixture by 2028.
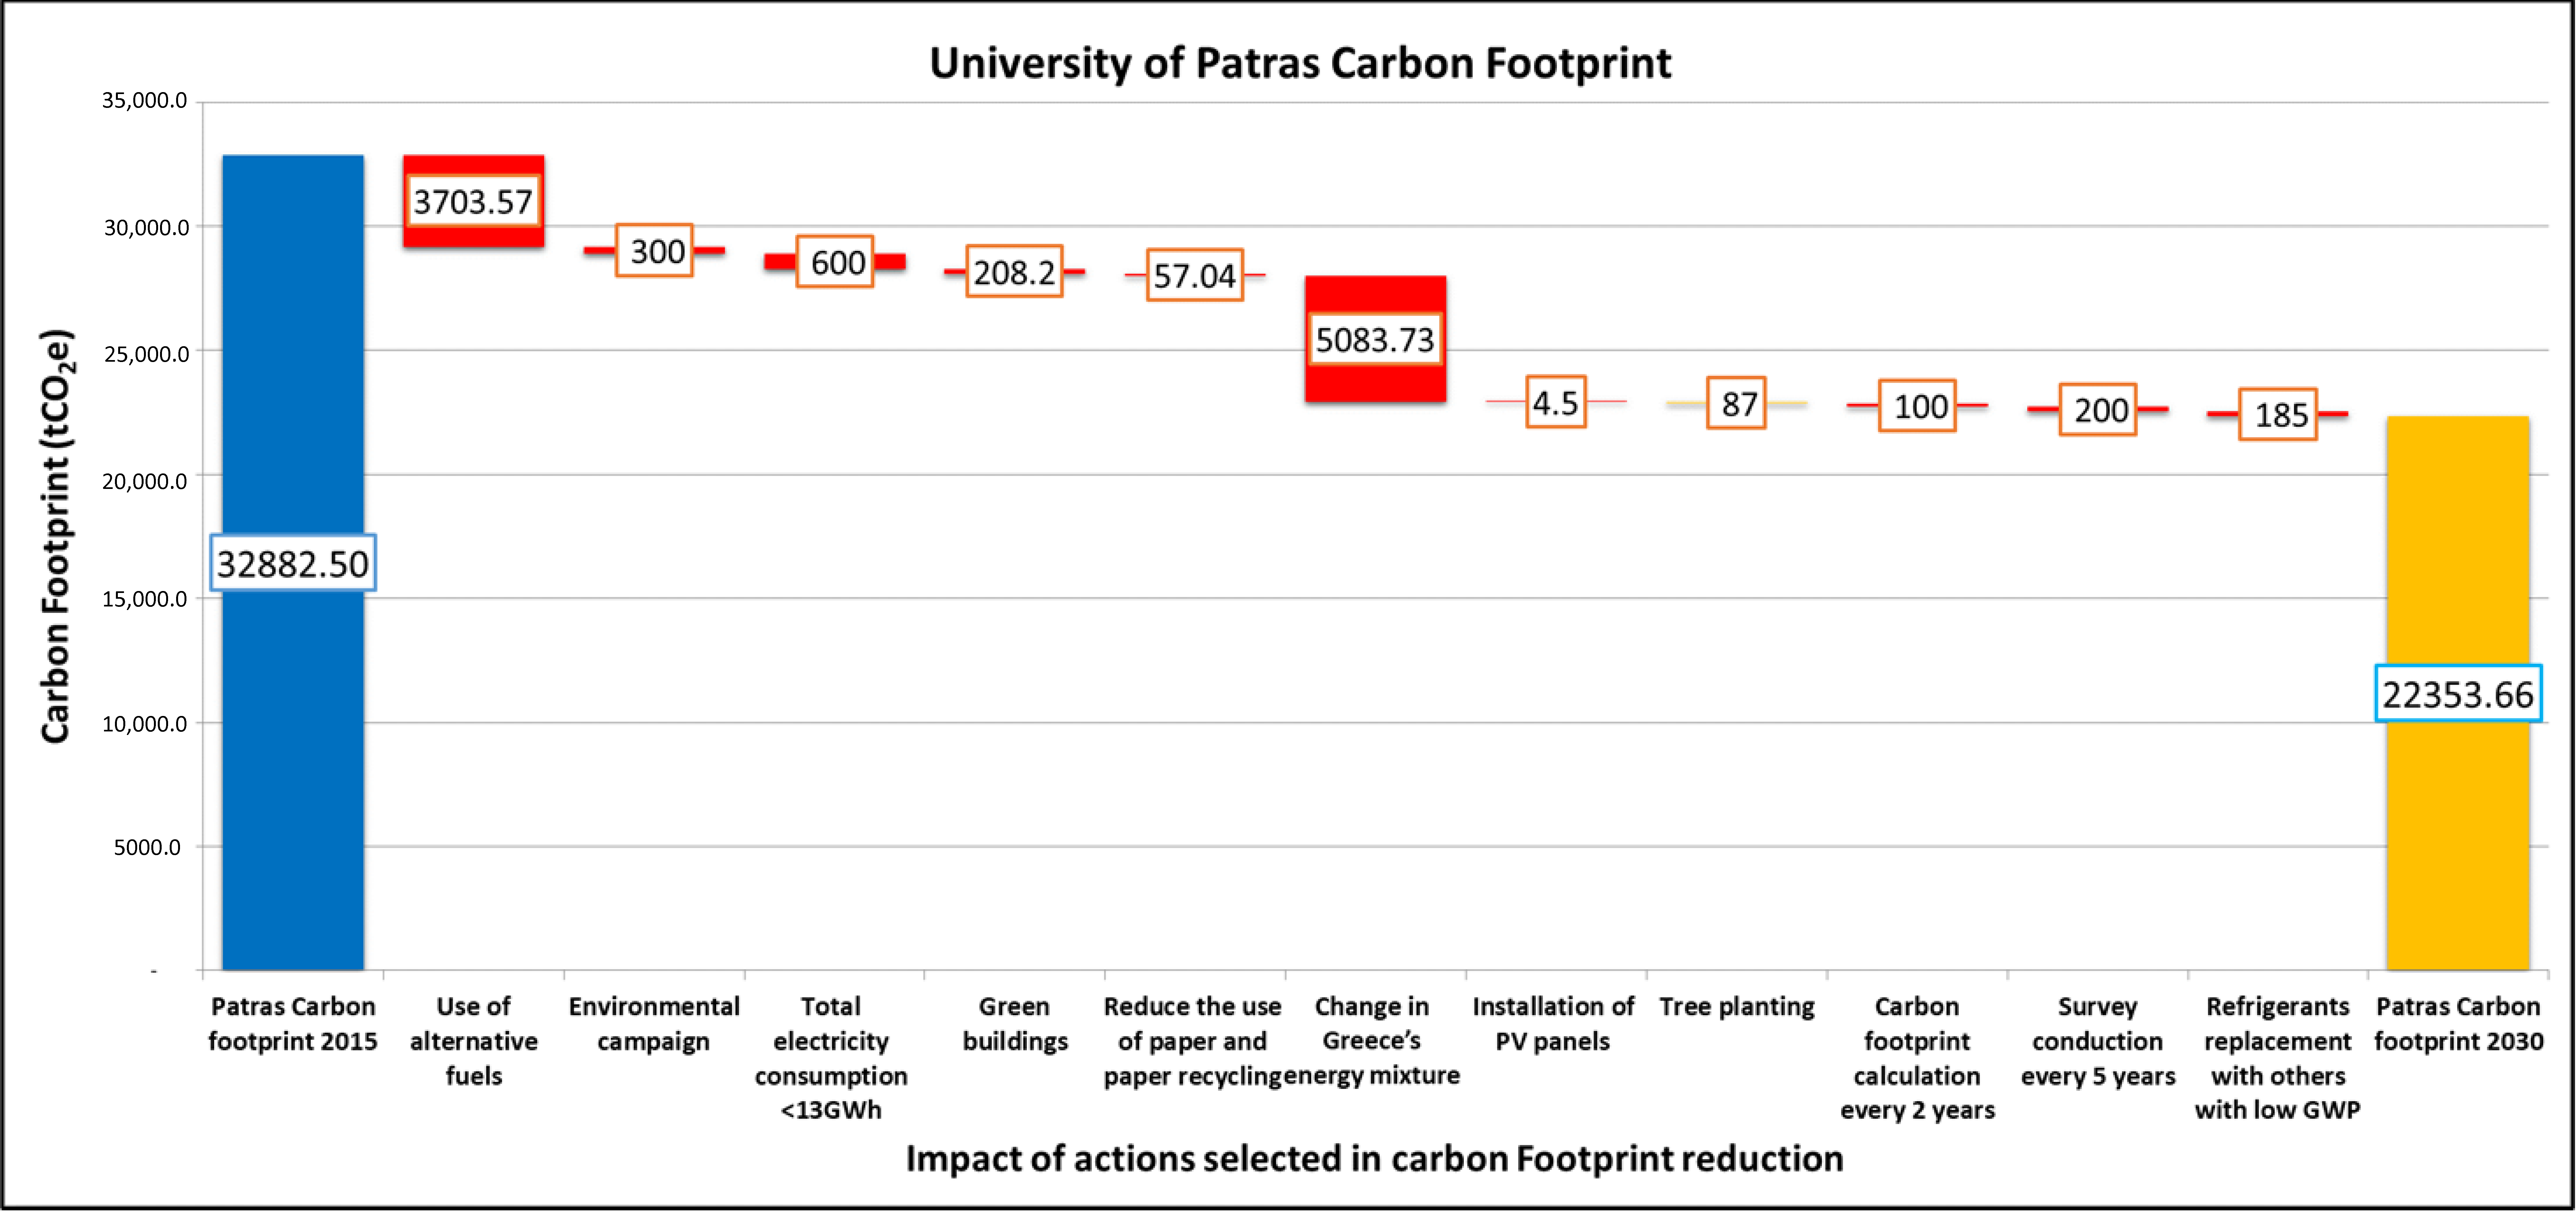
The Action Plan planned until 2030 and the contribution of each action to the overall carbon footprint based on the previous target setting is presented in
Table 3 and
Figure 7. The proposed Action Plan does not contain actions that change, limit the operation of the university, or even sacrifice facilities and amenities of its members. It includes actions that reduce CO
2 emissions by keeping all the functions the same but in a more environmentally friendly way.
Many of the actions included in the Action Plan are actually smaller or bigger projects which must be prepared in detail before execution. Financial constraints in implementing the actions for CO2 emissions reduction require a selection process (which building could contribute more in terms of carbon footprint in action No 5) and a prioritization of countermeasures in creating the action plan.
Regarding energy consumption and energy efficiency actions, the use of the BEM approach should be appropriate for small campuses [
31]. It is indisputable that benefits from the online monitoring system are huge but there is also room for future improvement. Trigger points of the online system should take into account real weather data of the area and not only an estimation in order to be more accurate. When a trigger point is reached, an SMS or email alarm should be generated and be sent to one or more dedicated persons without requiring a unique dedicated person and continuous checking by him, being accurate and saving time.
Installation of a photovoltaic system should be undertaken after deciding the size of the plant, taking into account the energy consumption figures of the buildings by using a feasibility study like in the case of the Technical University of Crete [
32].
Actions 1 and 3 are external actions (NECP actions) but with an impact on the University of Patras’ emissions and are taken into account in the action plan.
Action plan should be finalized in 2030 but milestones have to be set in order to keep on track. Energy audits should be implemented to verify, validate, and sustain the results achieved. If a deviation is observed, countermeasures should be taken. Action plans are always dynamic.
5. Conclusions
A well-implemented action plan with detailed action steps that describe how and when these steps will be taken is of paramount importance for the University of Patras. The present study is a step forward in this direction.
Once the action plan has been approved, a responsible person should be appointed for each action. If additional investigation, study, and/or investments are required, the competent persons, services, and departments should be notified in order to ensure that the project implementation is on track. Finally, in terms of cost, the action plan should be integrated into the total budget of the university.
Apart from the correct implementation of the action plan, extra attention should be paid to sustain its results. It is undoubtable that external factors in Greece, such as political and socio-economic changes occurring, would directly affect carbon footprint. In this case, CO2 emissions will benefit as energy consumption and redundant transportation will be reduced but it will be only temporary. Once the crisis is over, the impacts will return to higher emissions. Only building a strong environmental culture among the community will ensure sustainability of the results.
Taking into consideration that green growth is part of the 2030 Agenda of the Greek Government for Sustainable Development, the University of Patras should include green growth in its current agenda.
Moreover, further research is necessary to undertake in order to study:
These two factors strongly influence the carbon footprint performance of the University of Patras.

 ,
, 


