
Experimental Evaluations of the Impact of an Additive Oxidizing Electronic Air Cleaner on Particles and Gases

 , , and
Abstract
:1. Introduction
2. Materials and Methods
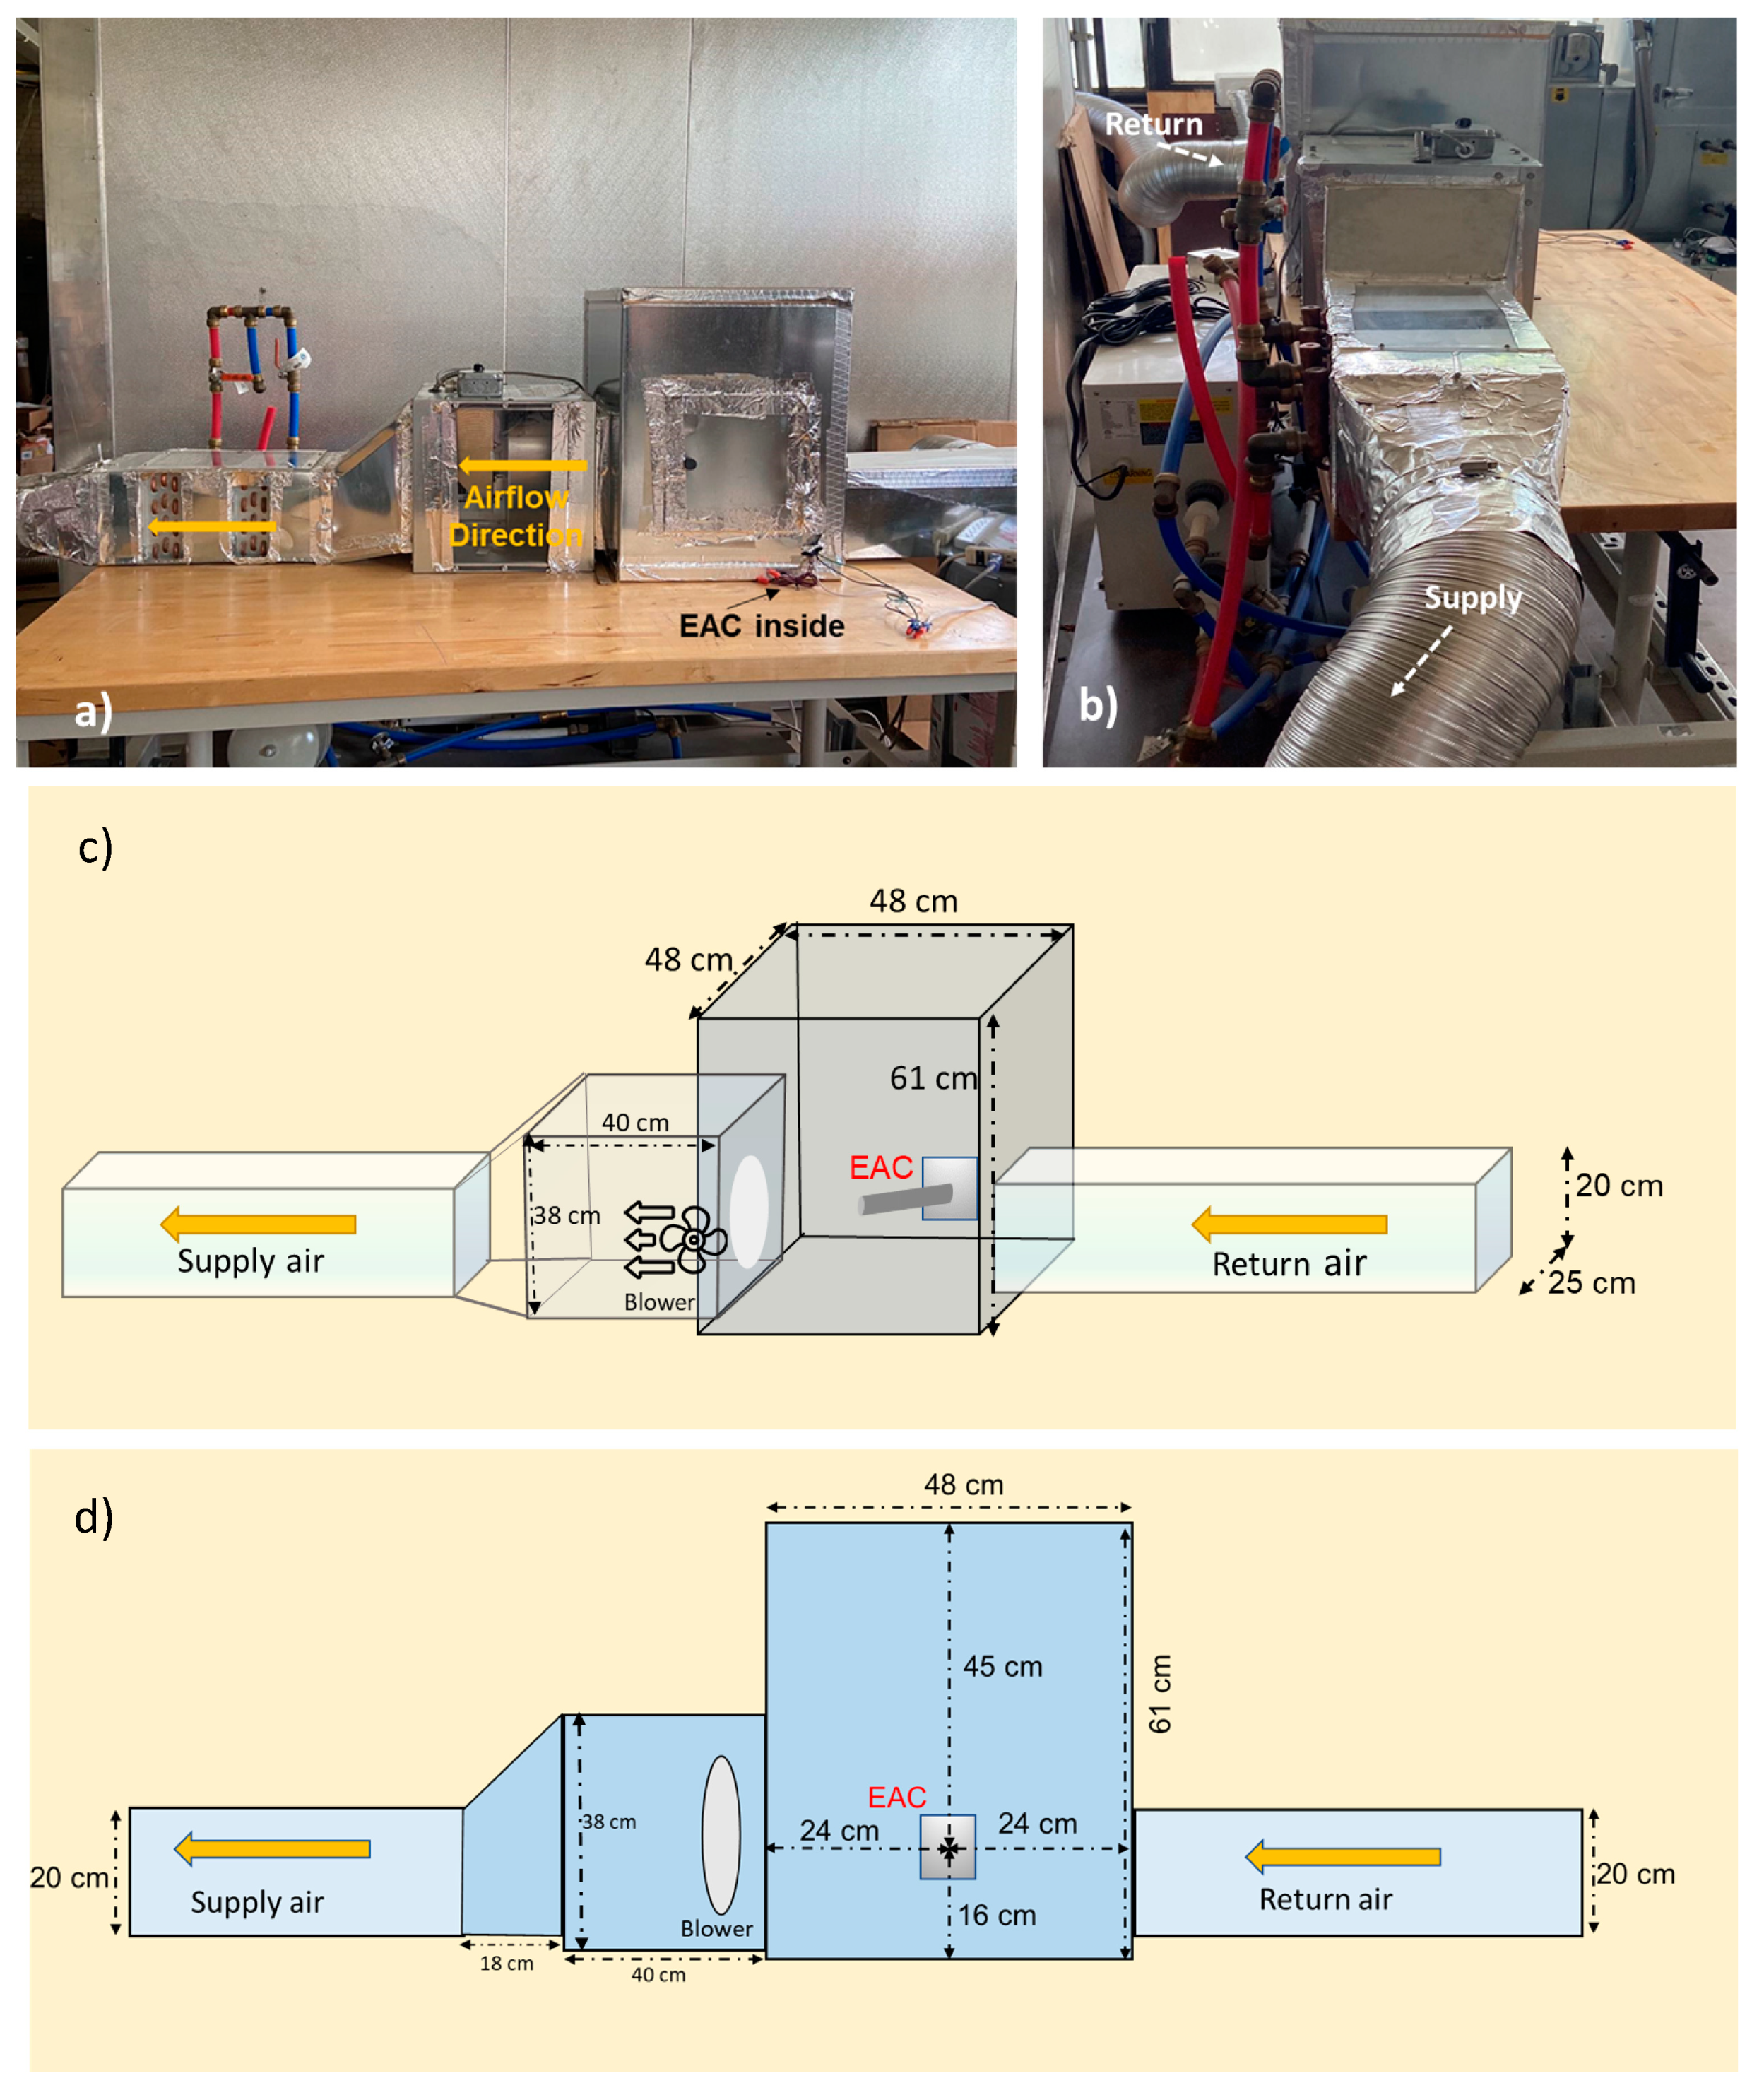
2.1. Chamber Experiments: Chicago, IL, USA
Analytical Measurements
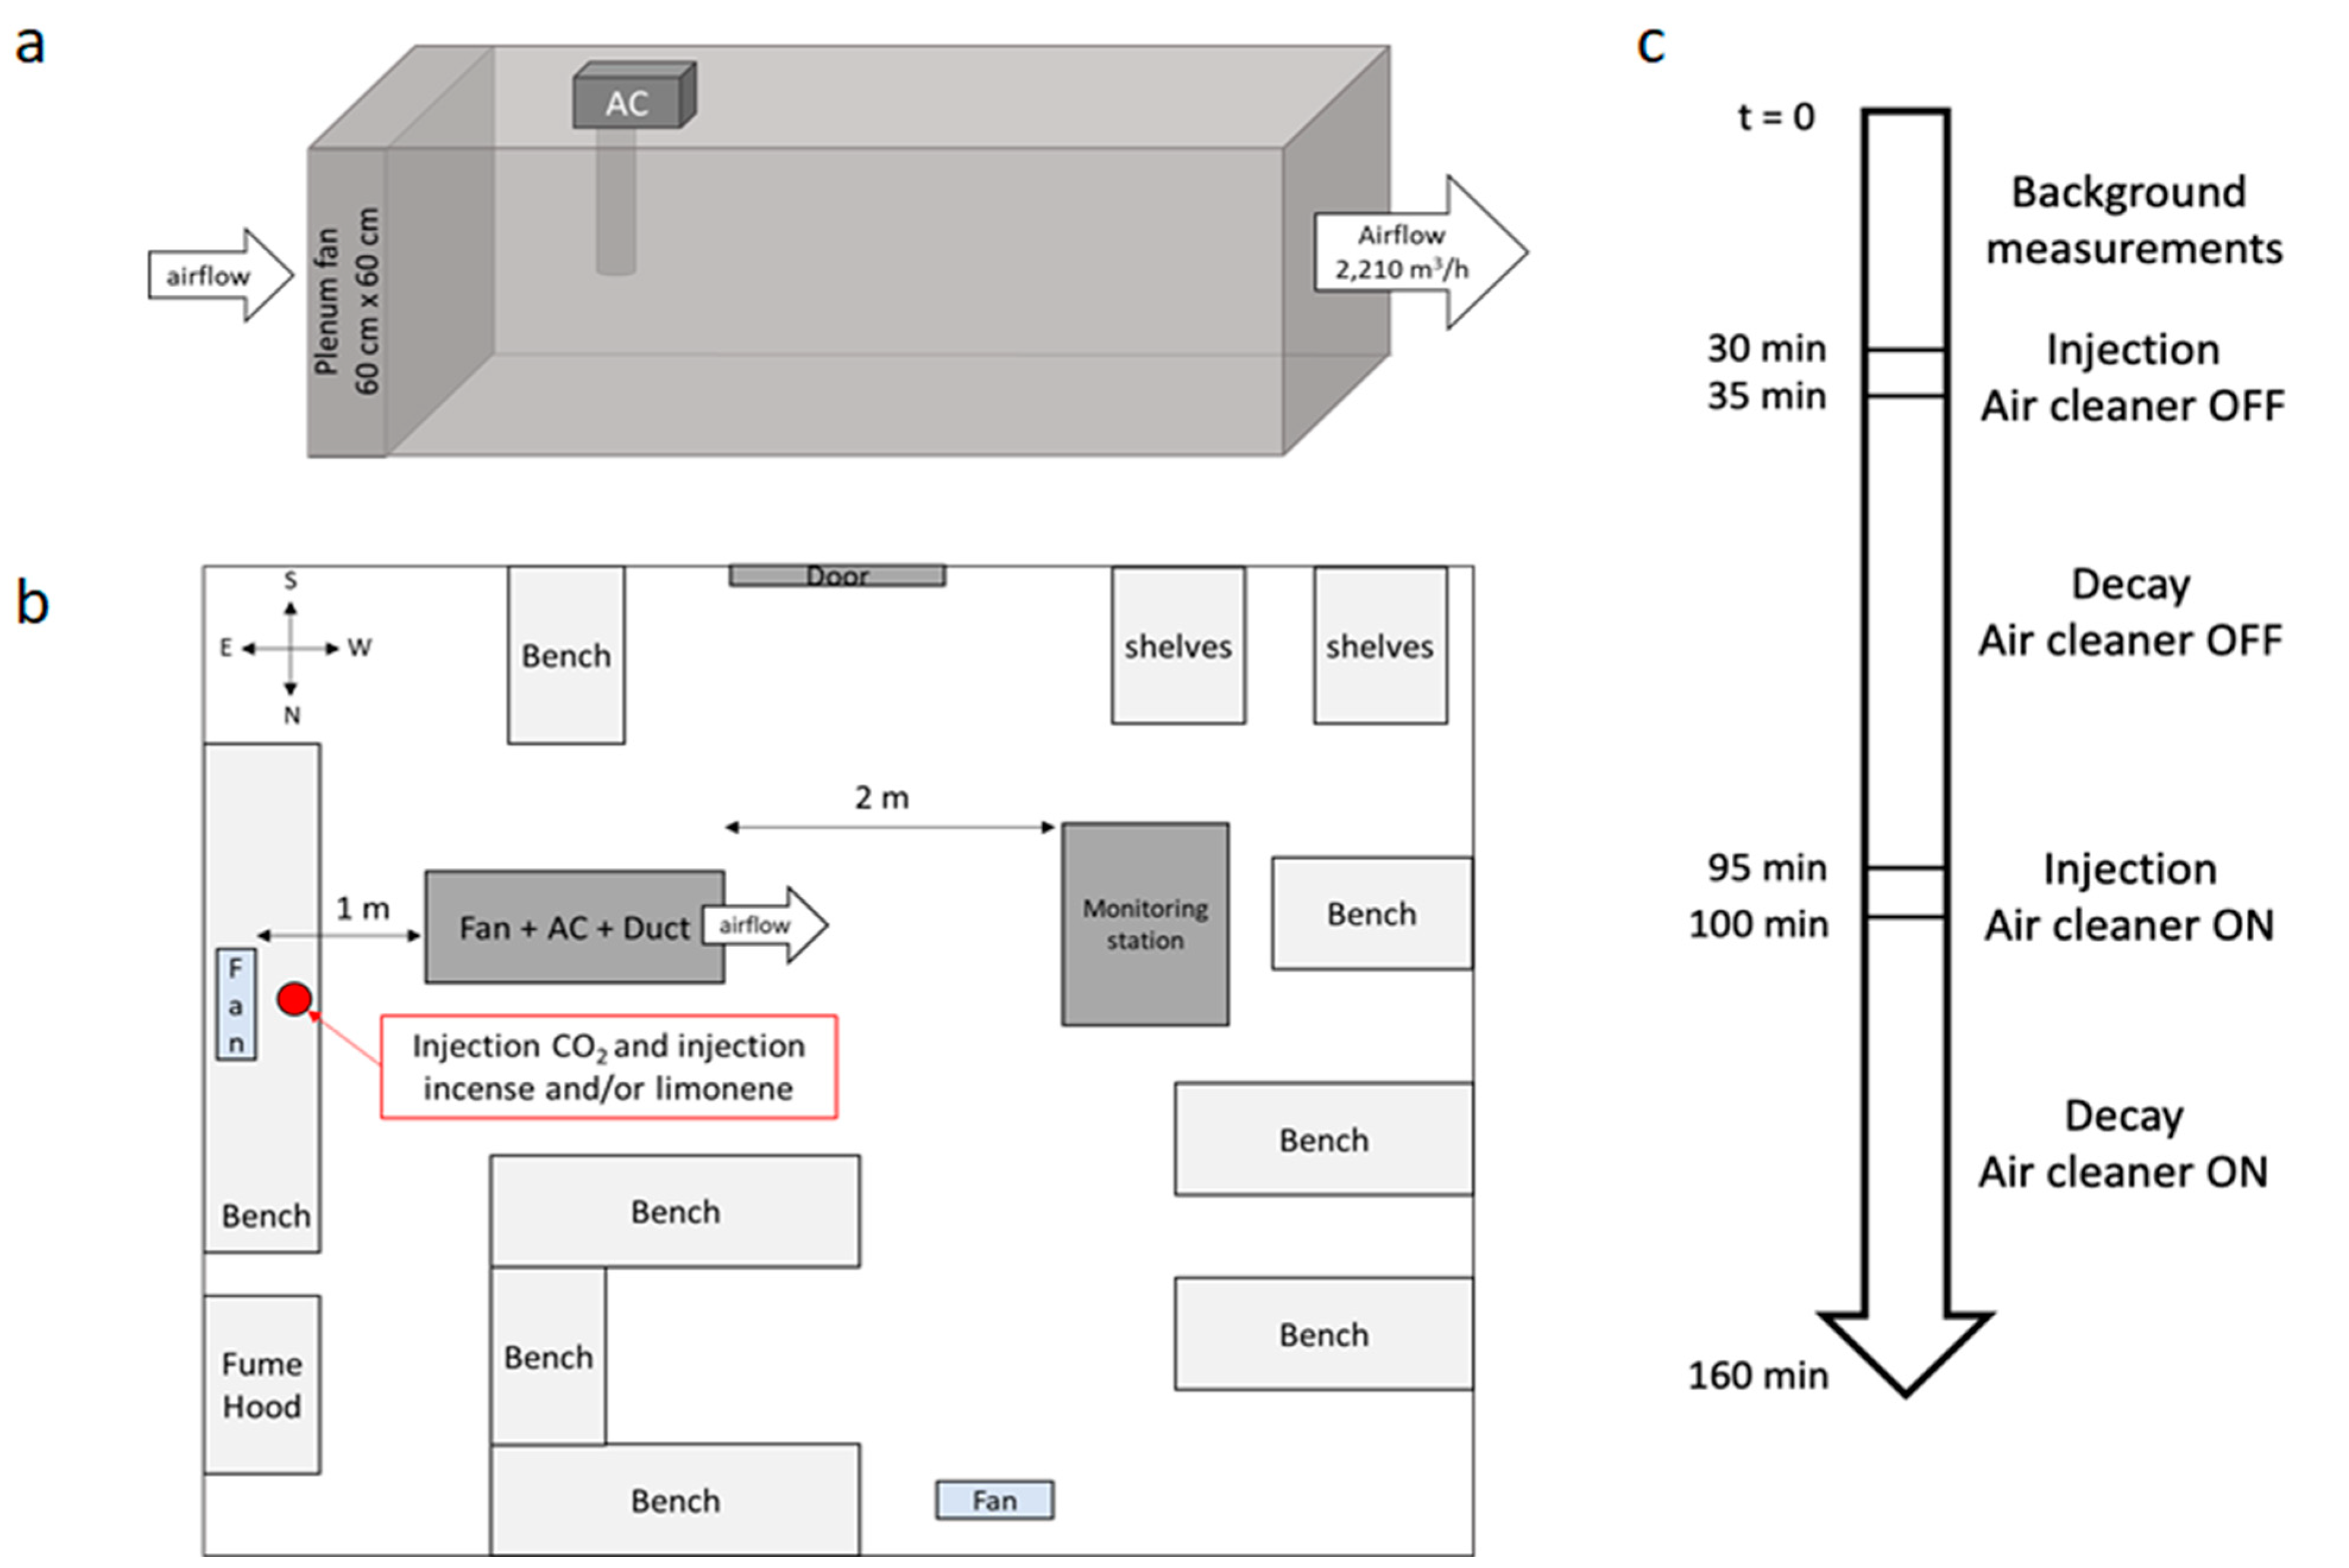
2.2. Controlled Laboratory Experiments: Portland, OR, USA
Analytical Measurements
2.3. Analysis and Parameter Estimation
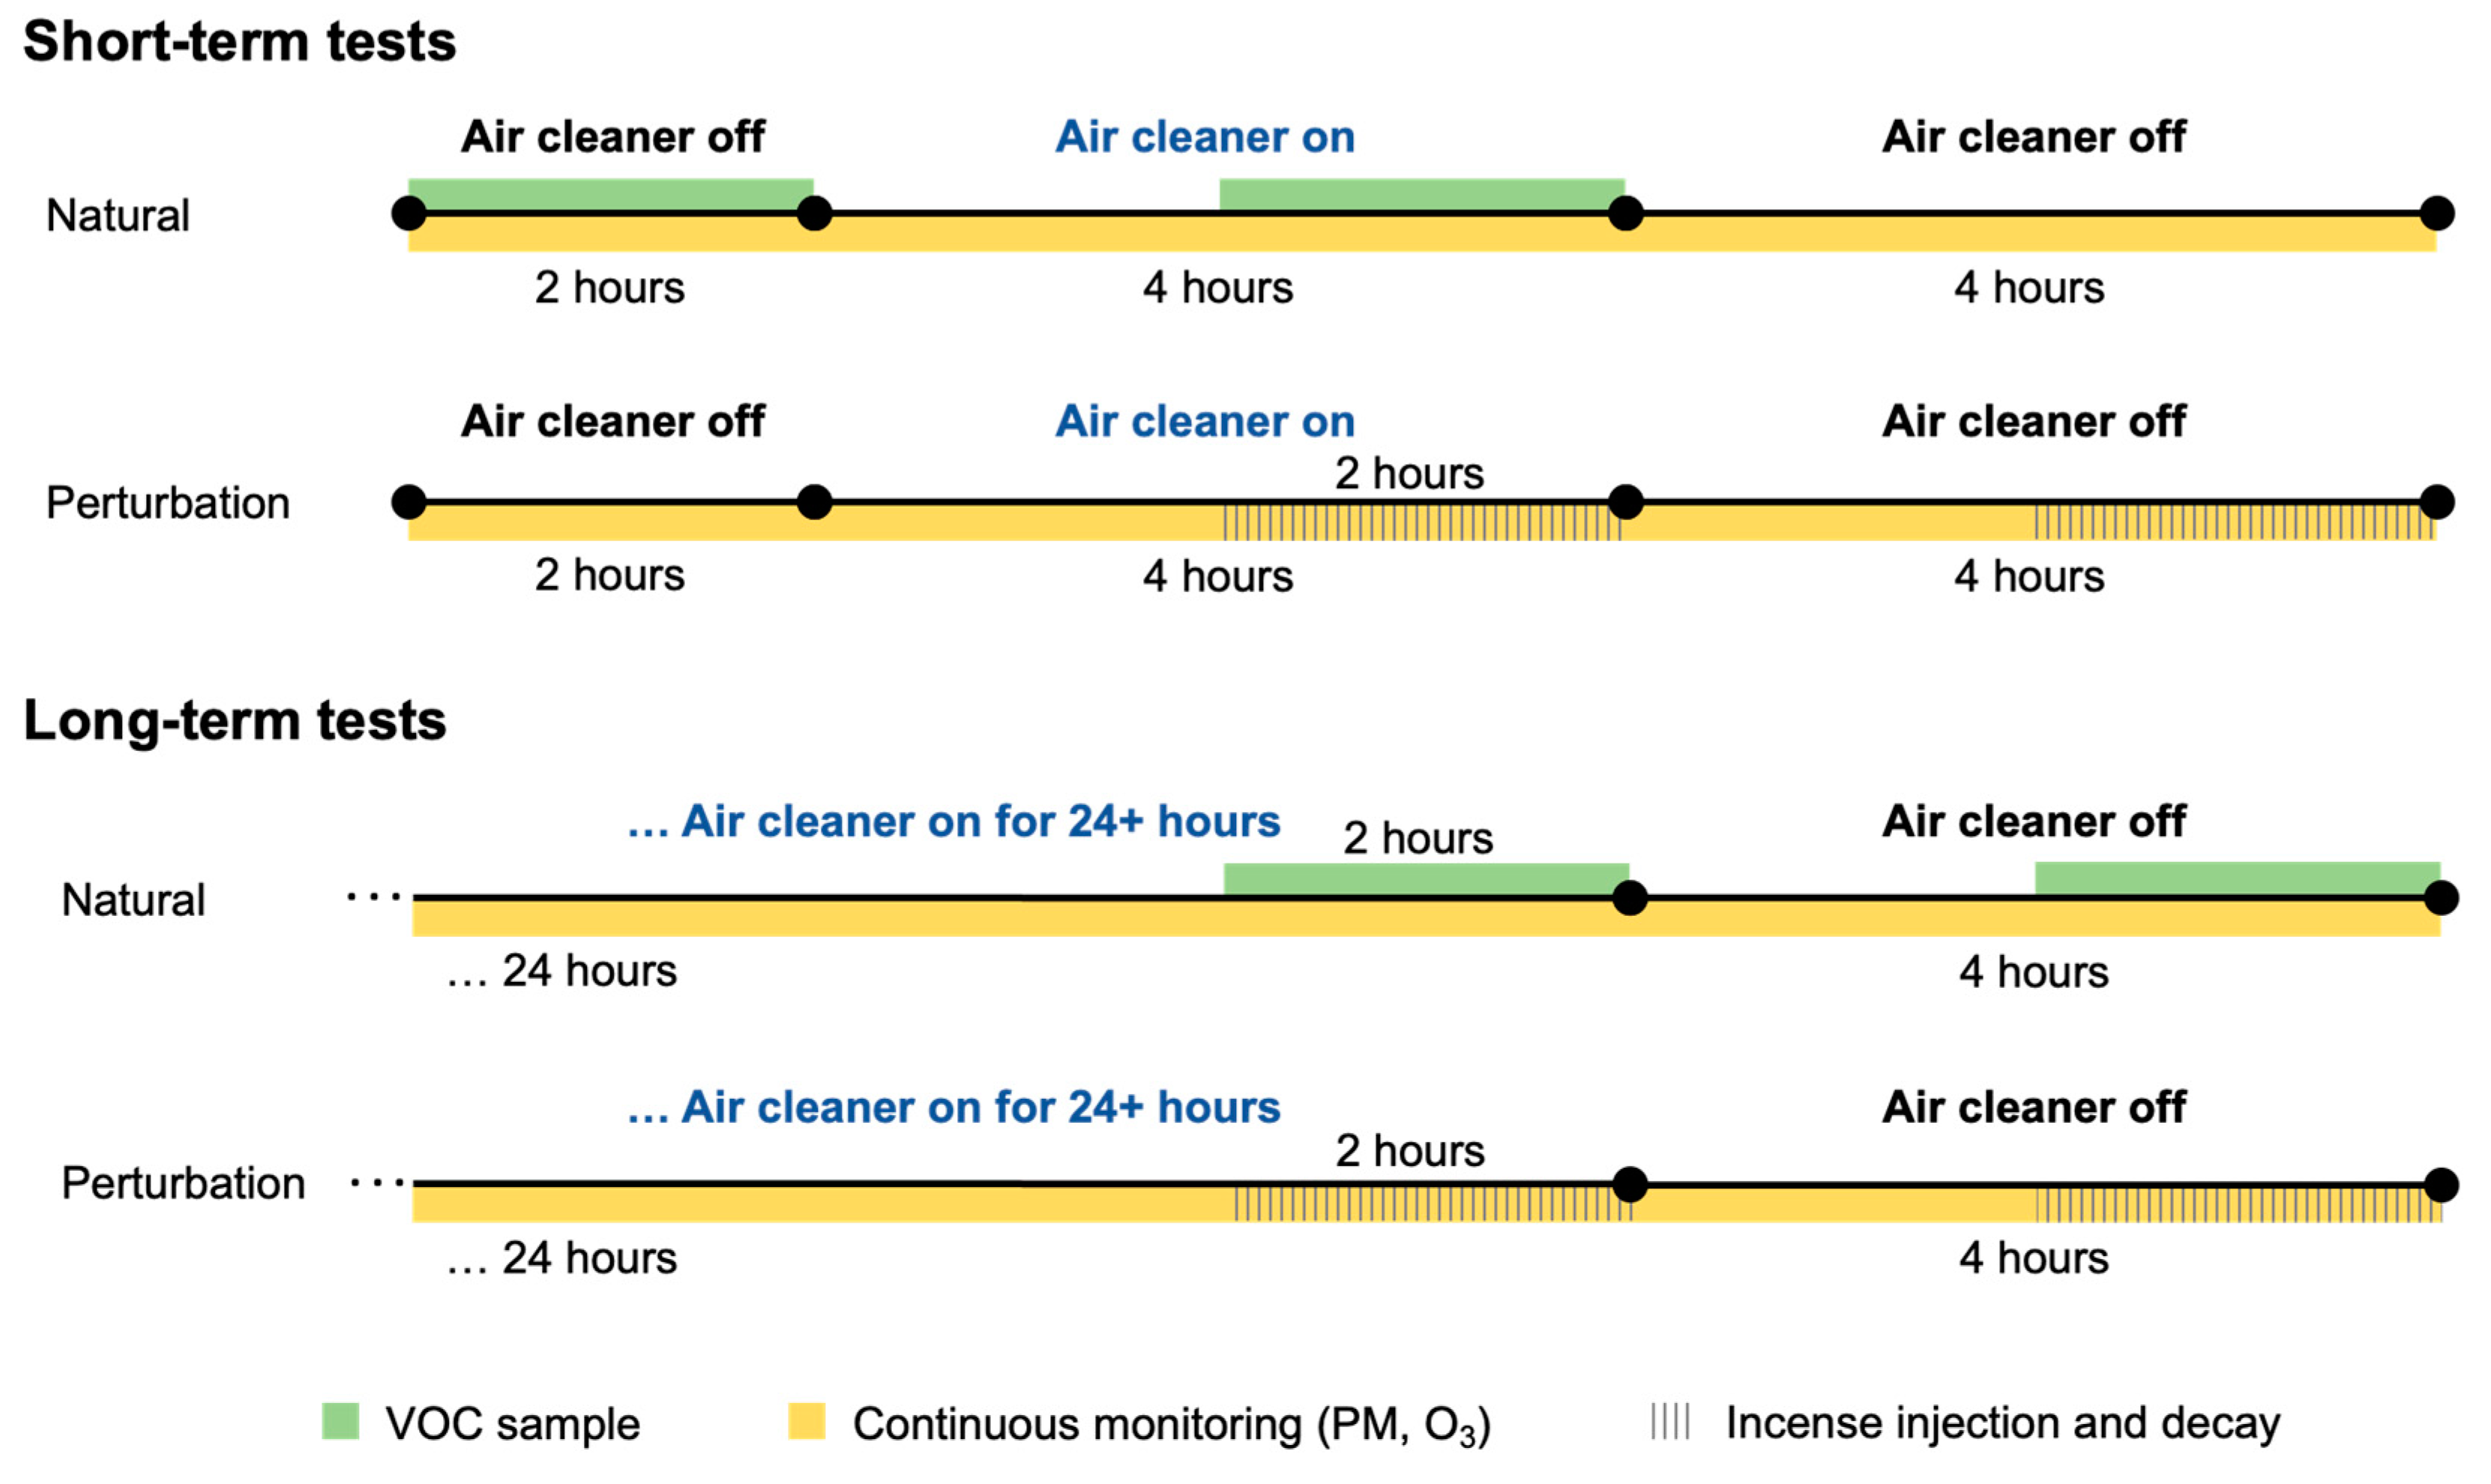
2.3.1. Natural Condition Tests (IIT Chamber Study)
2.3.2. Perturbation Tests (IIT Chamber Study and PSU Lab Study)
3. Results and Discussion
3.1. Chamber Experiments: Chicago, IL, USA
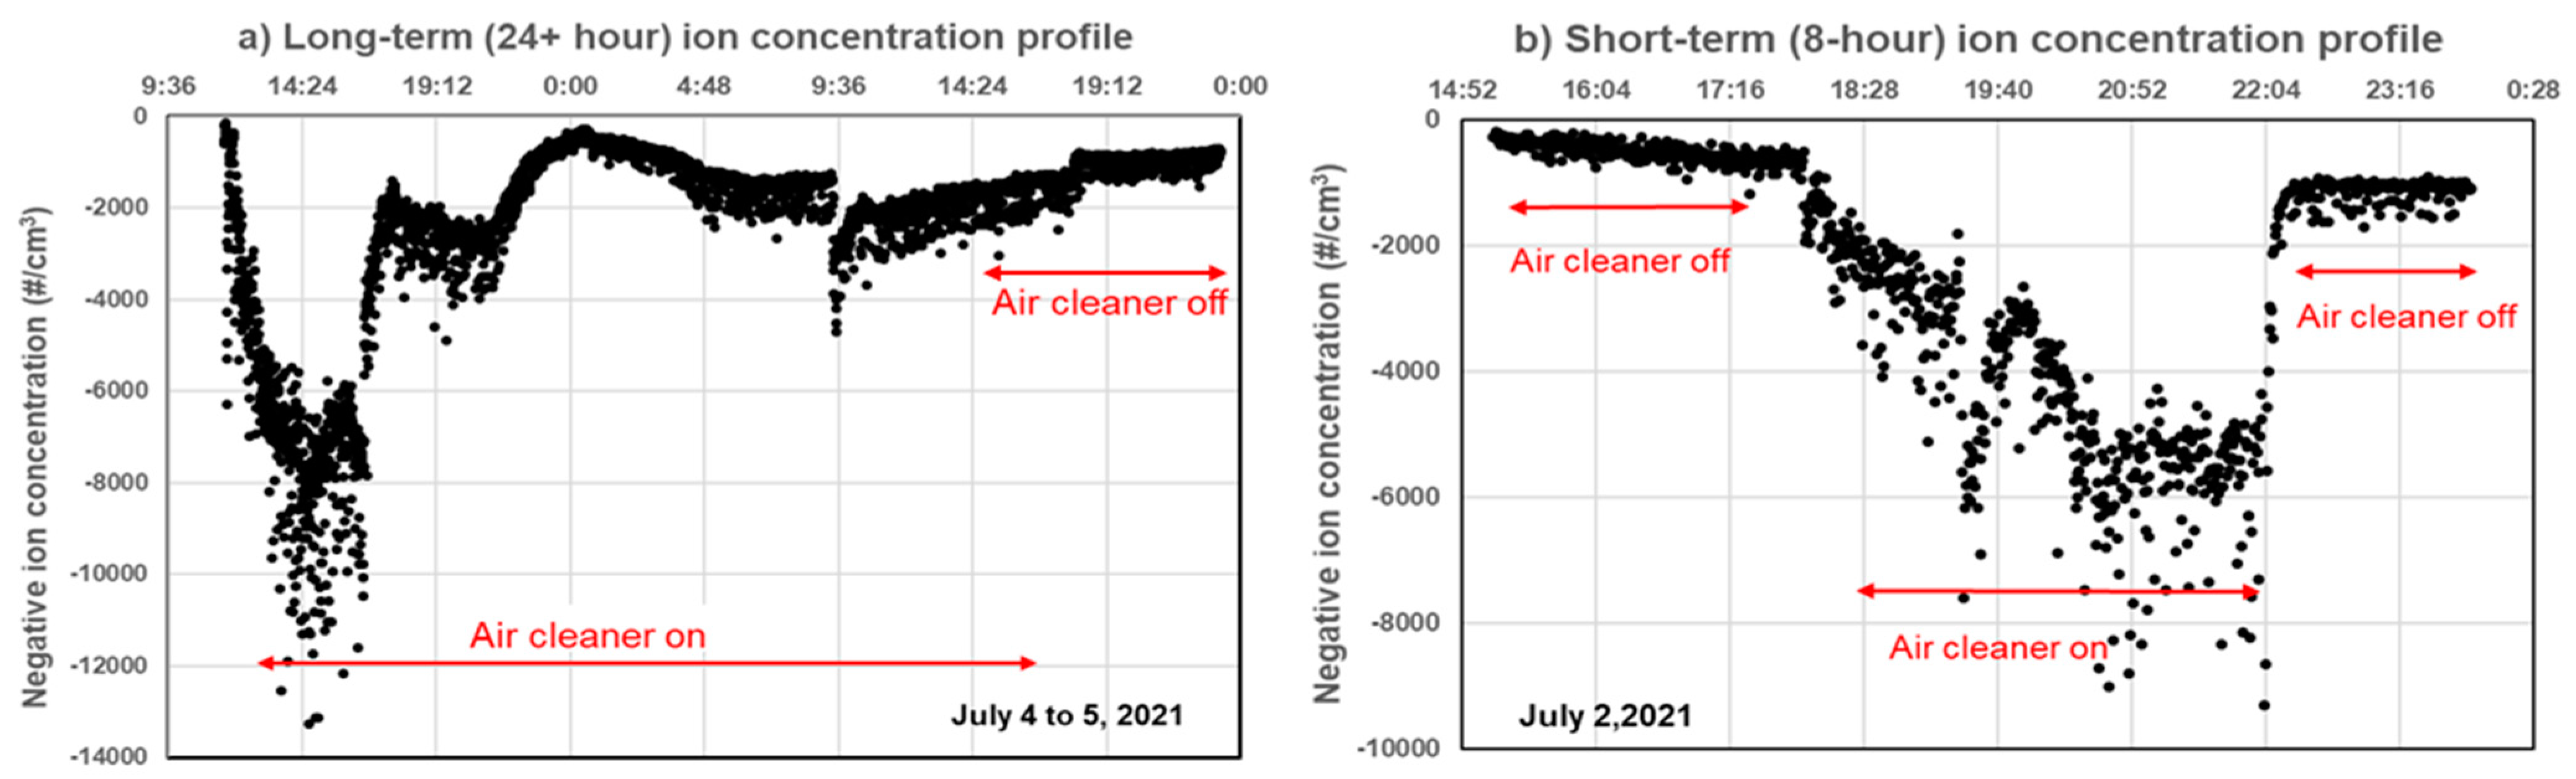
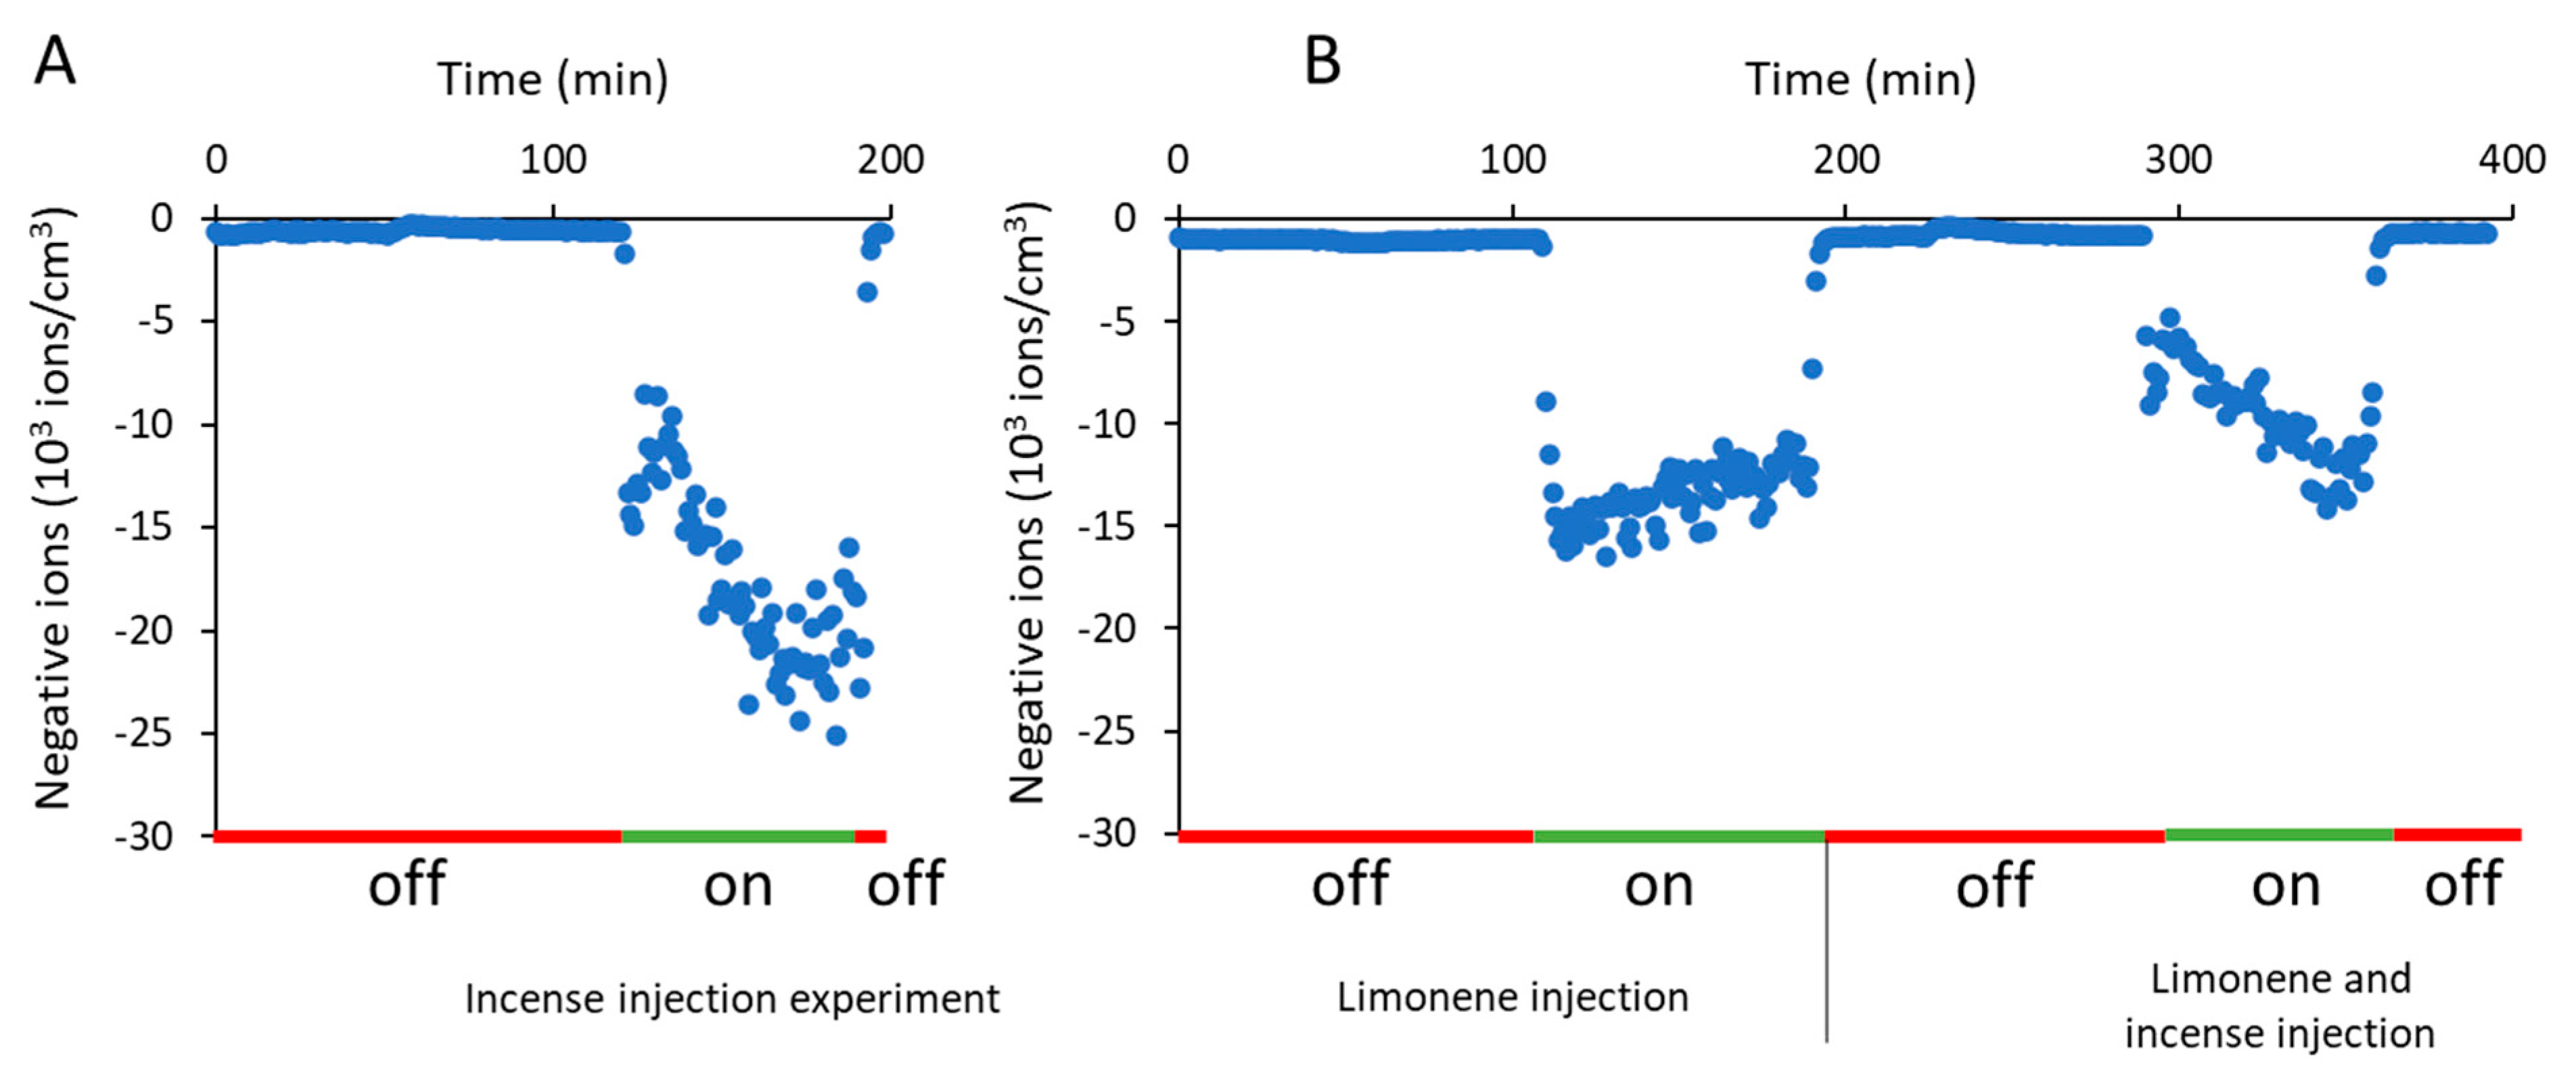
3.1.1. Negative Ion Production
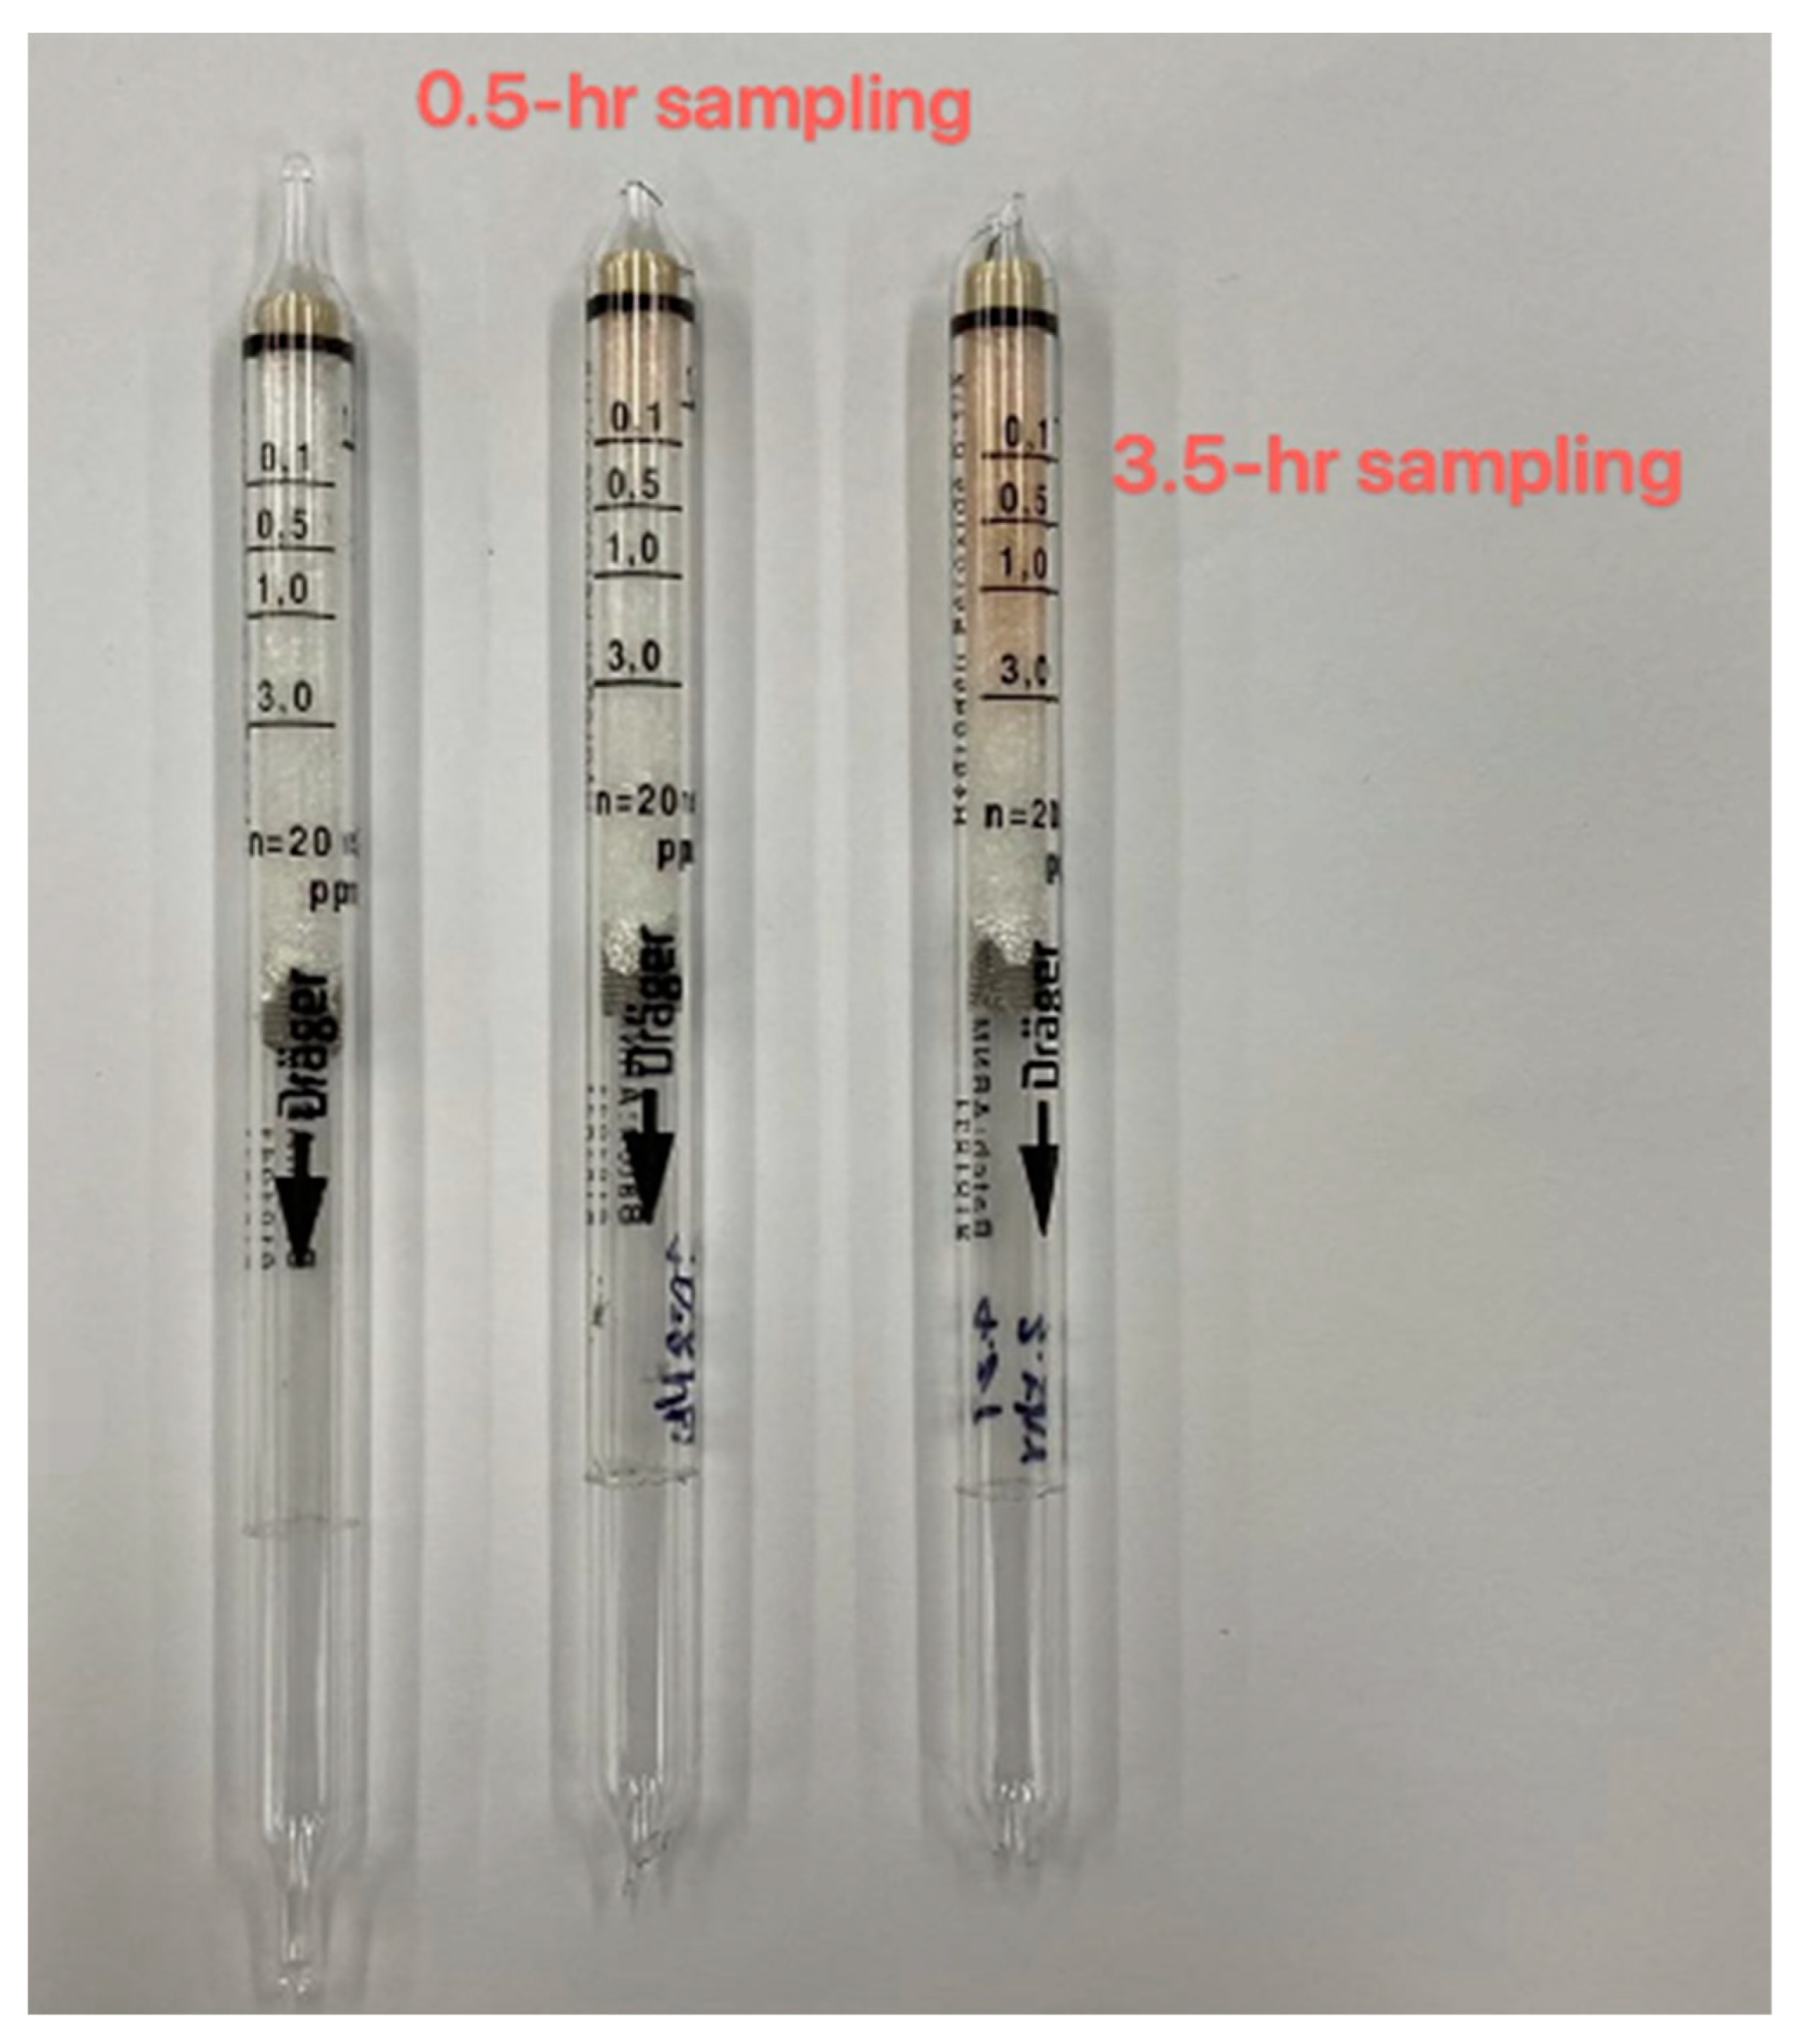
3.1.2. H2O2 Production
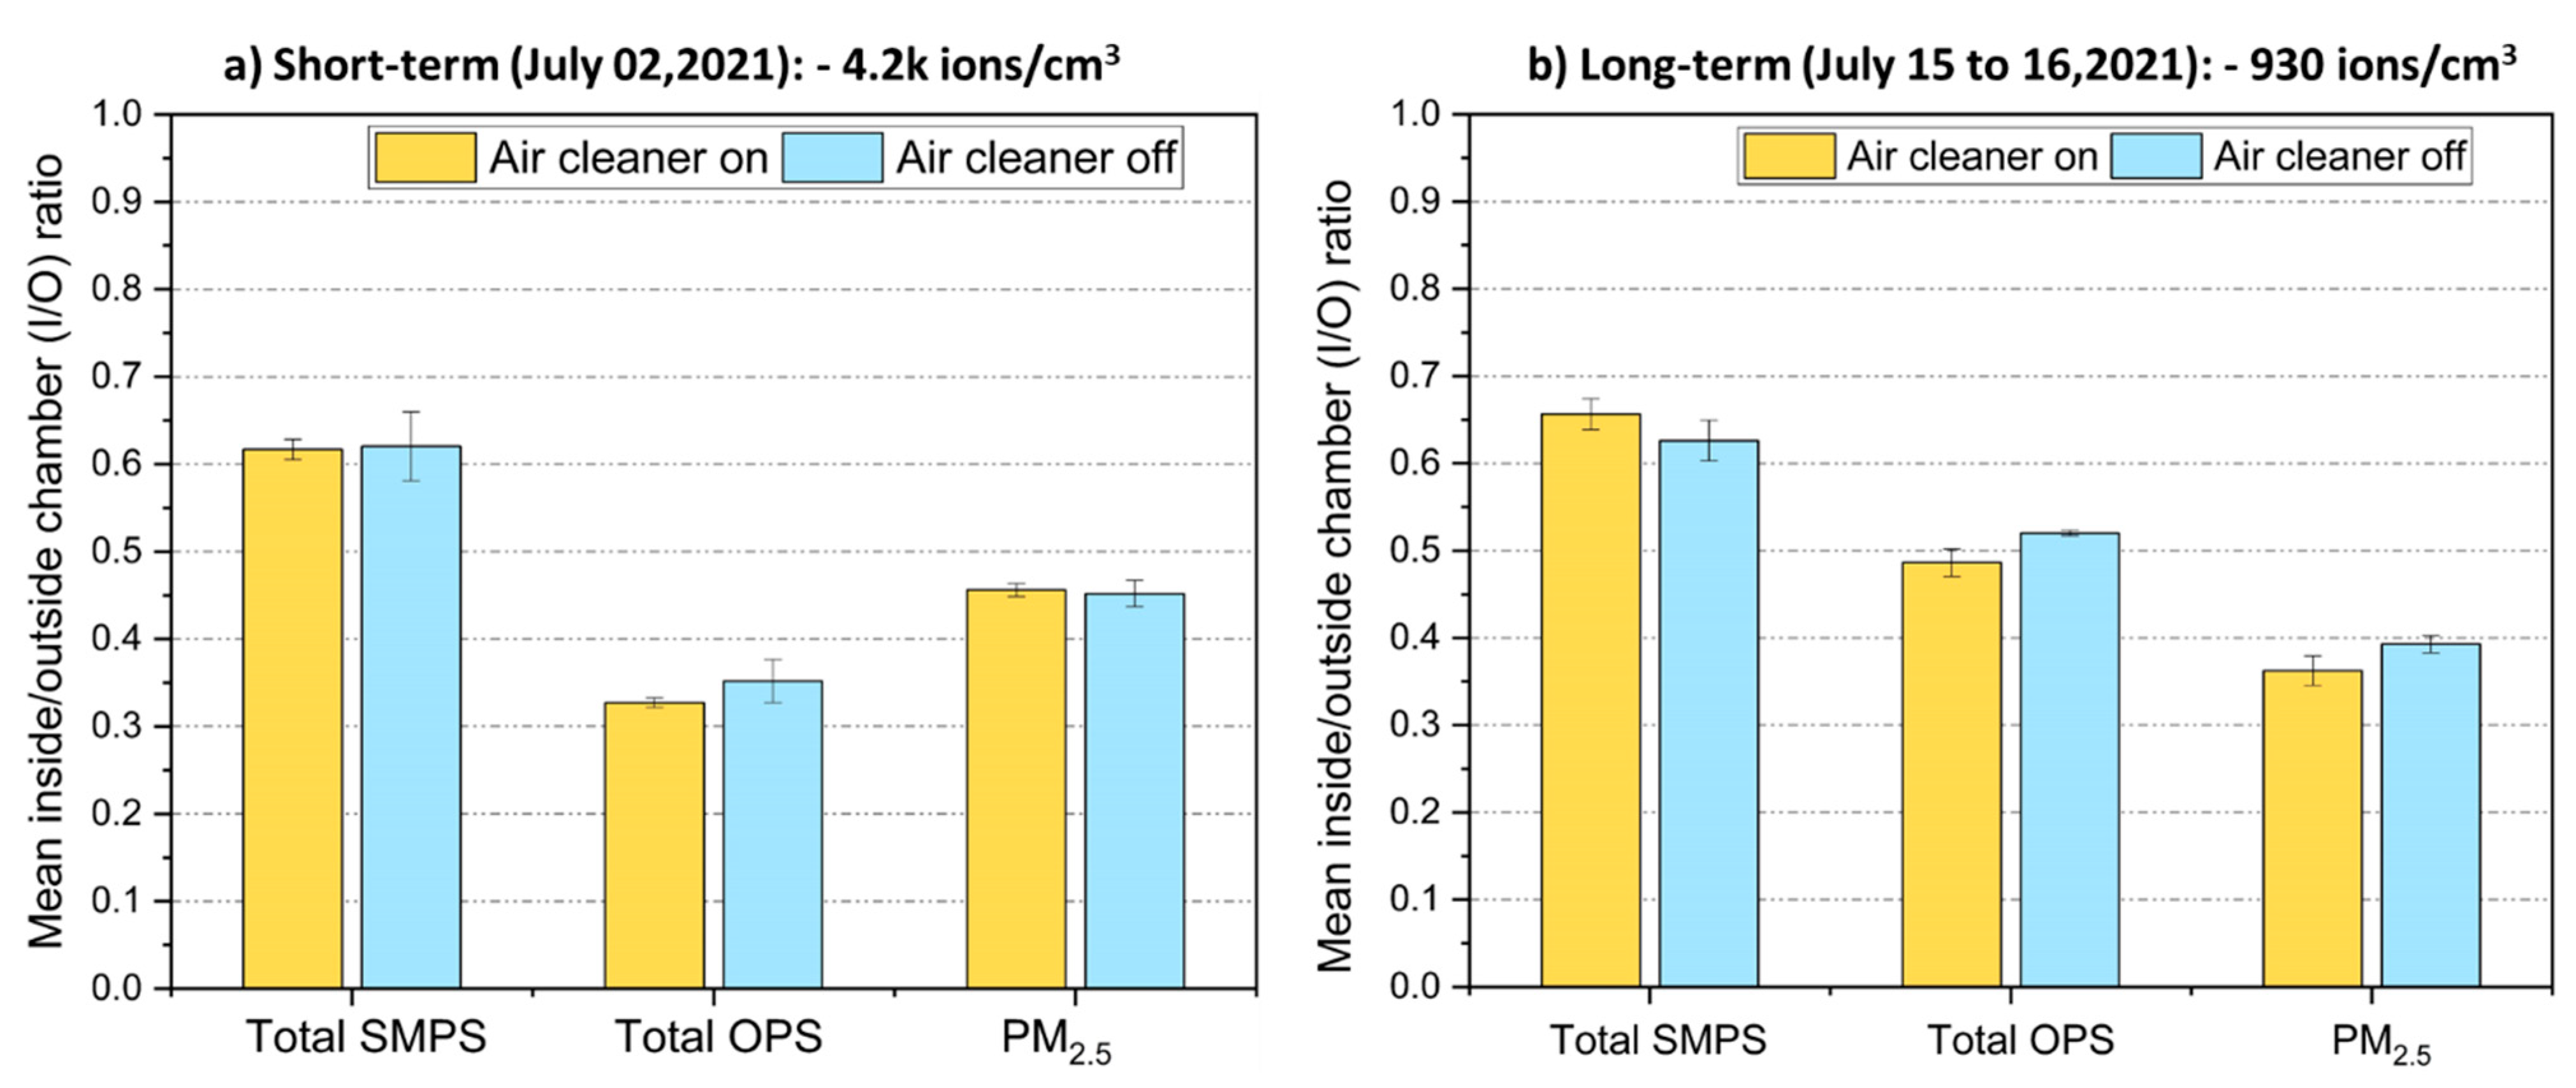
3.1.3. Natural Condition Chamber Tests: Particulate Matter (PM)
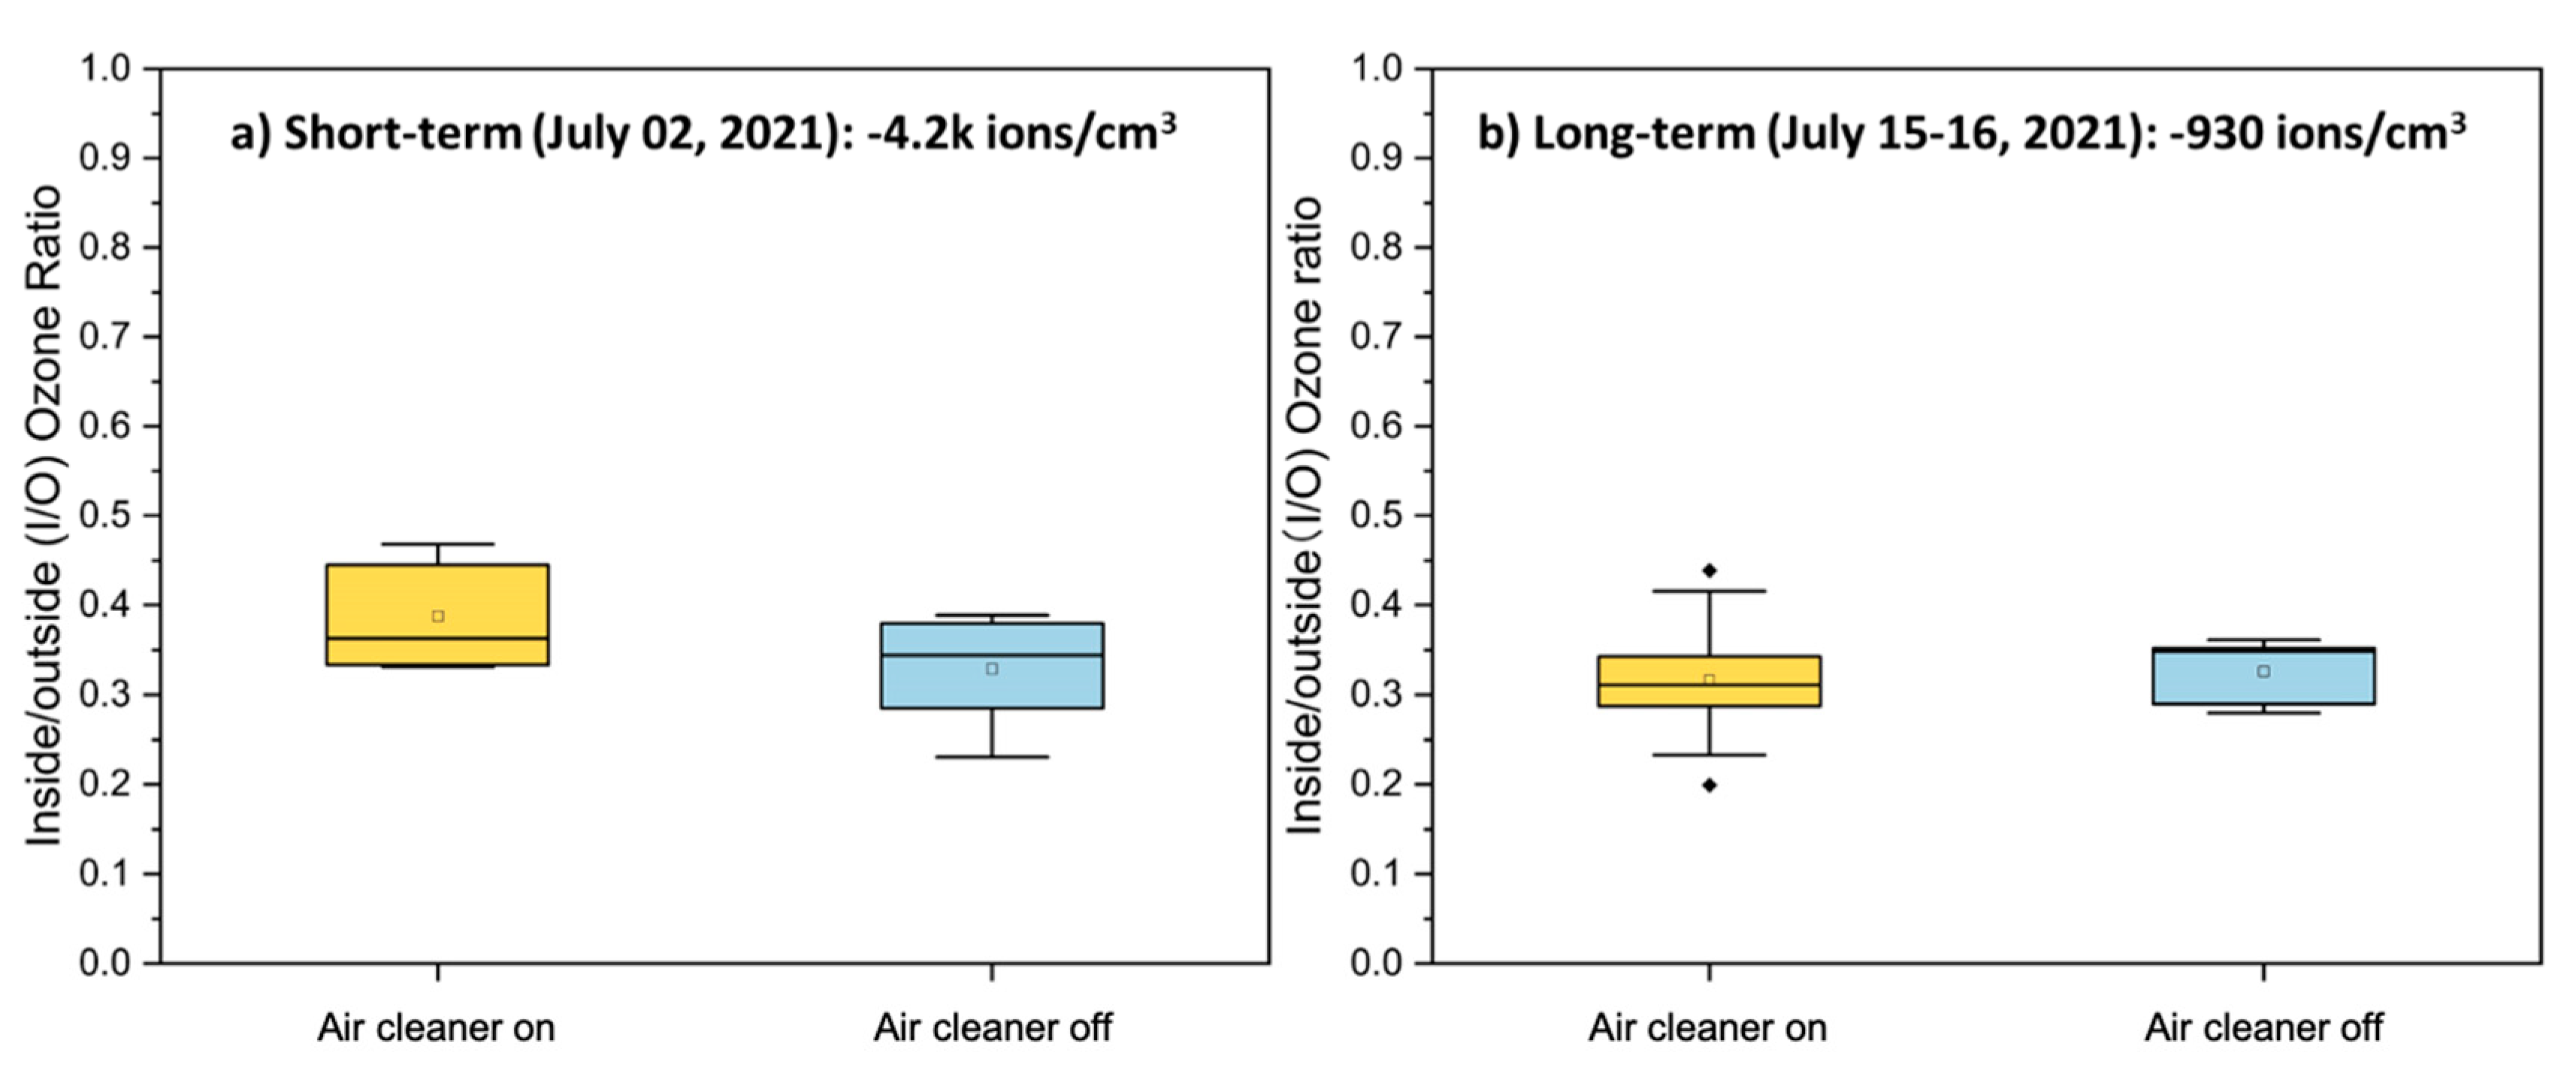
3.1.4. Natural Condition Chamber Tests: Ozone (O3) Concentrations
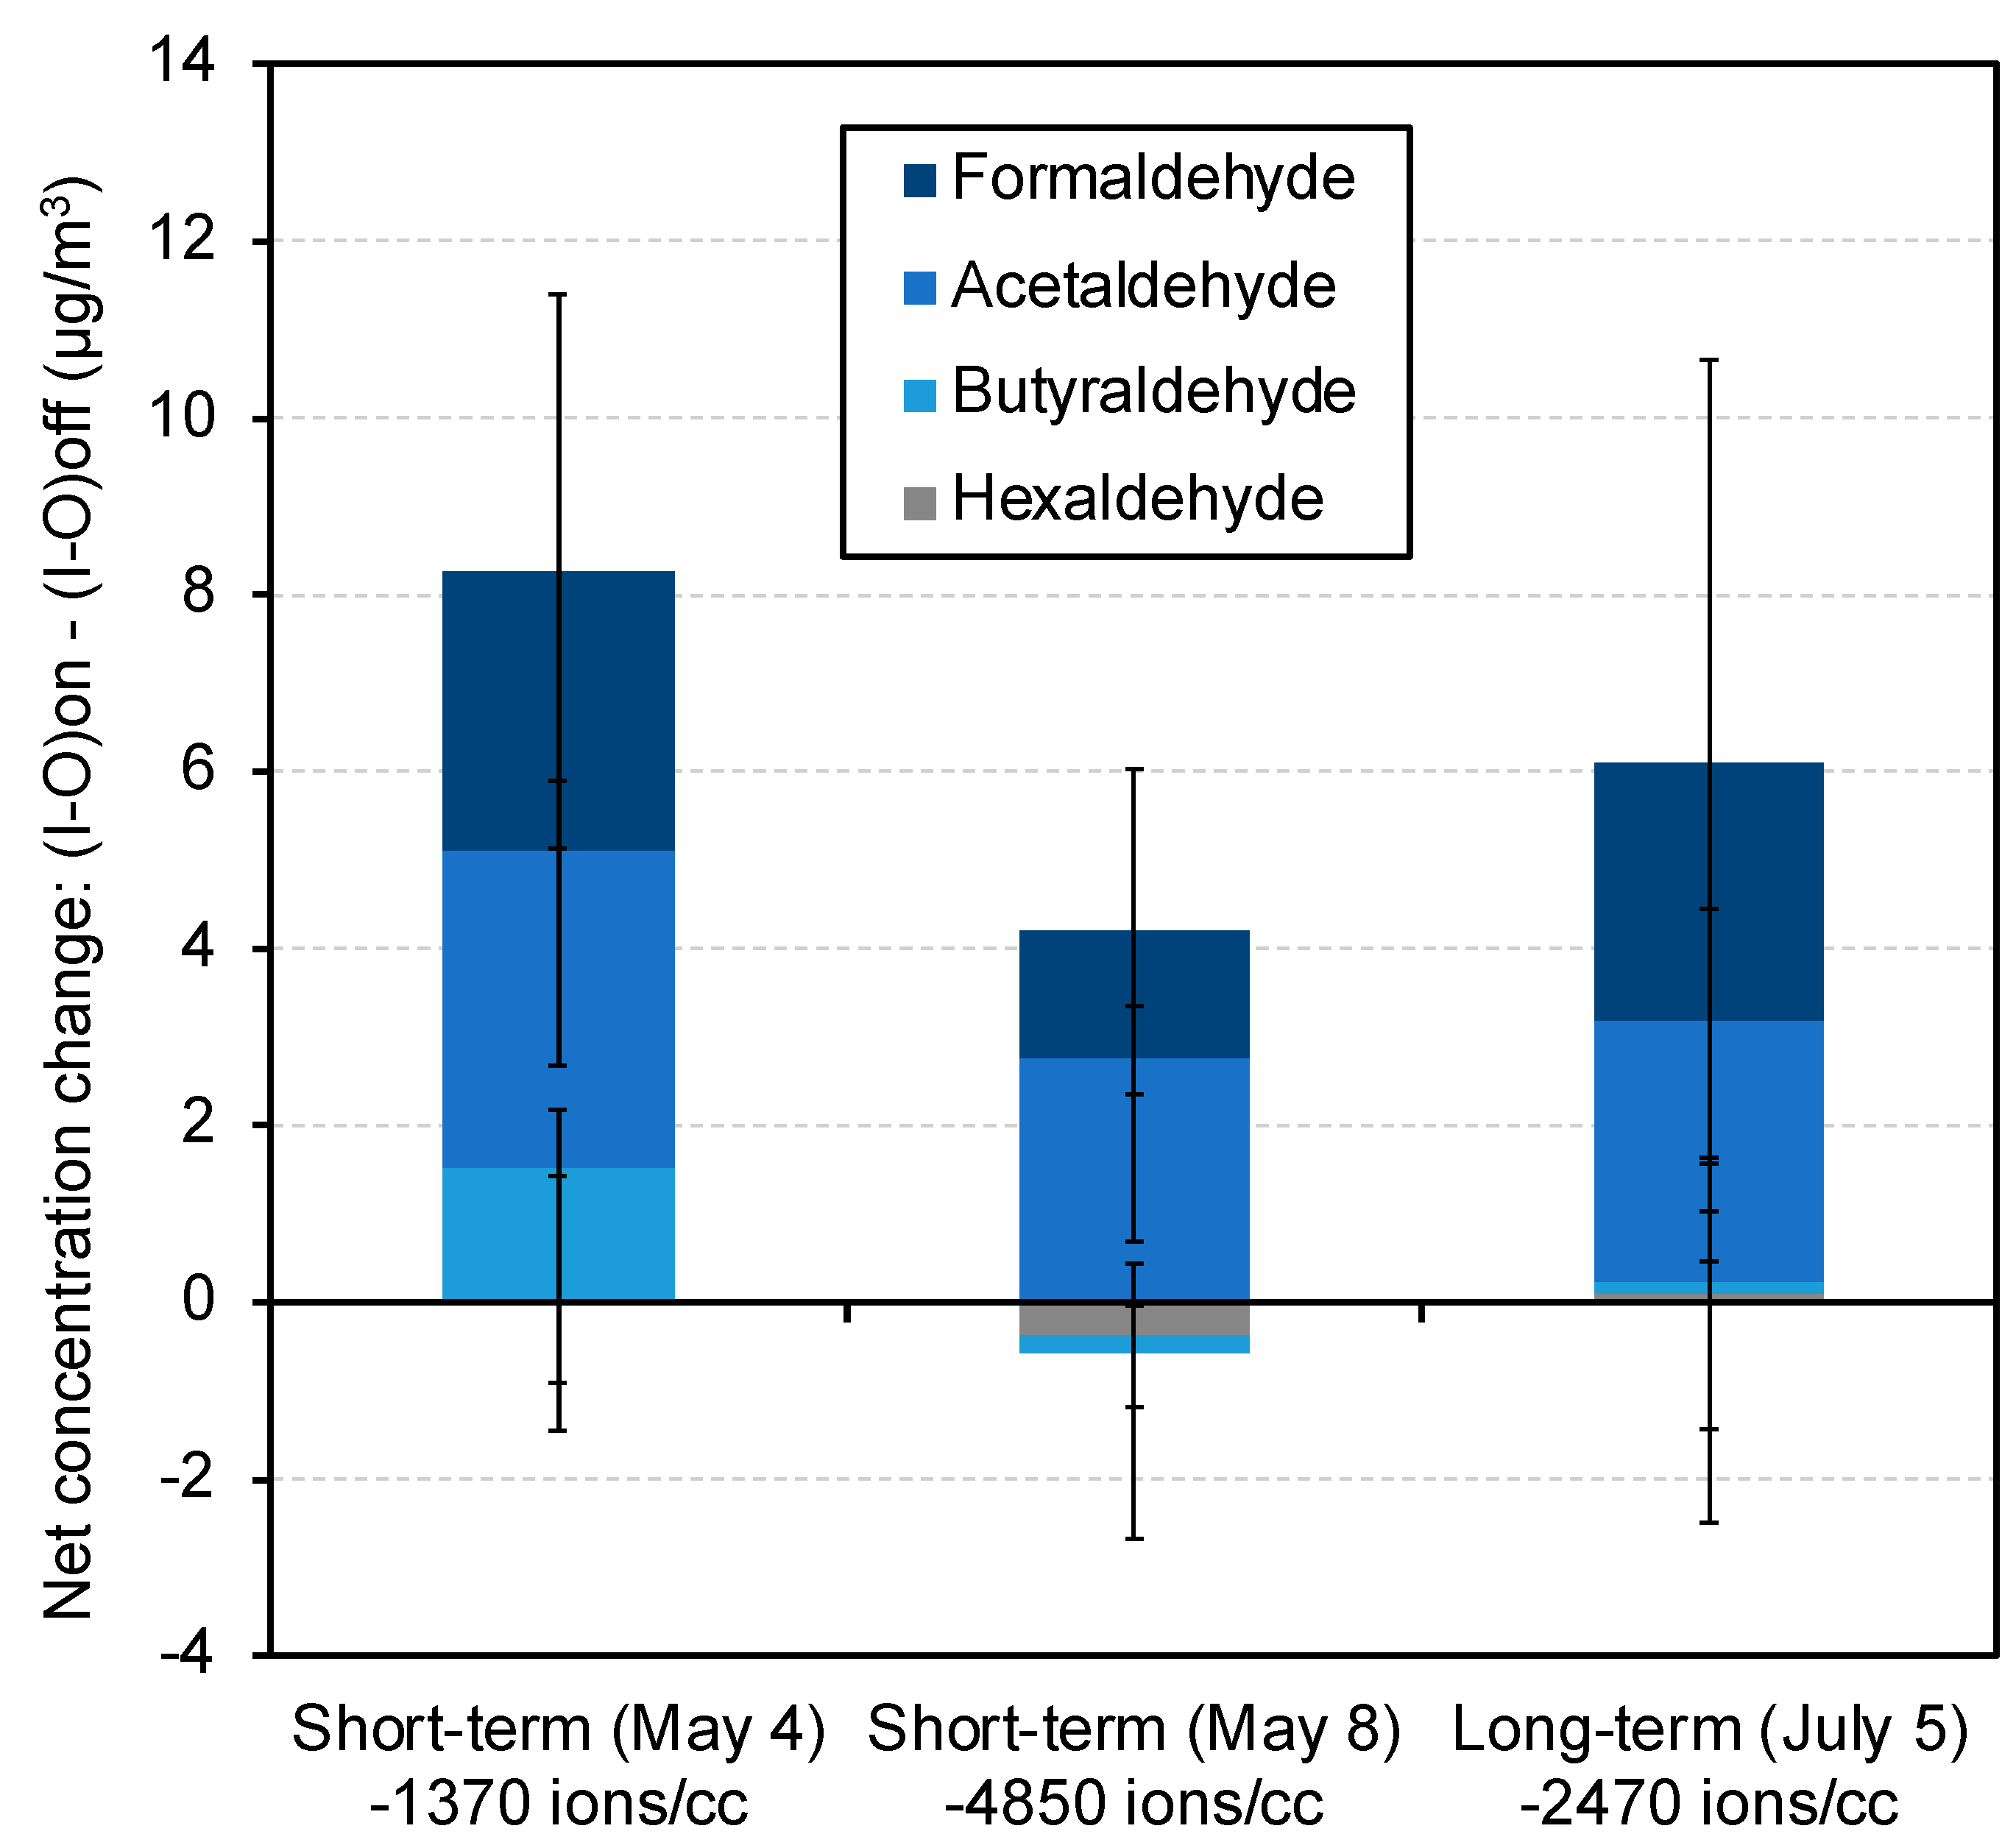
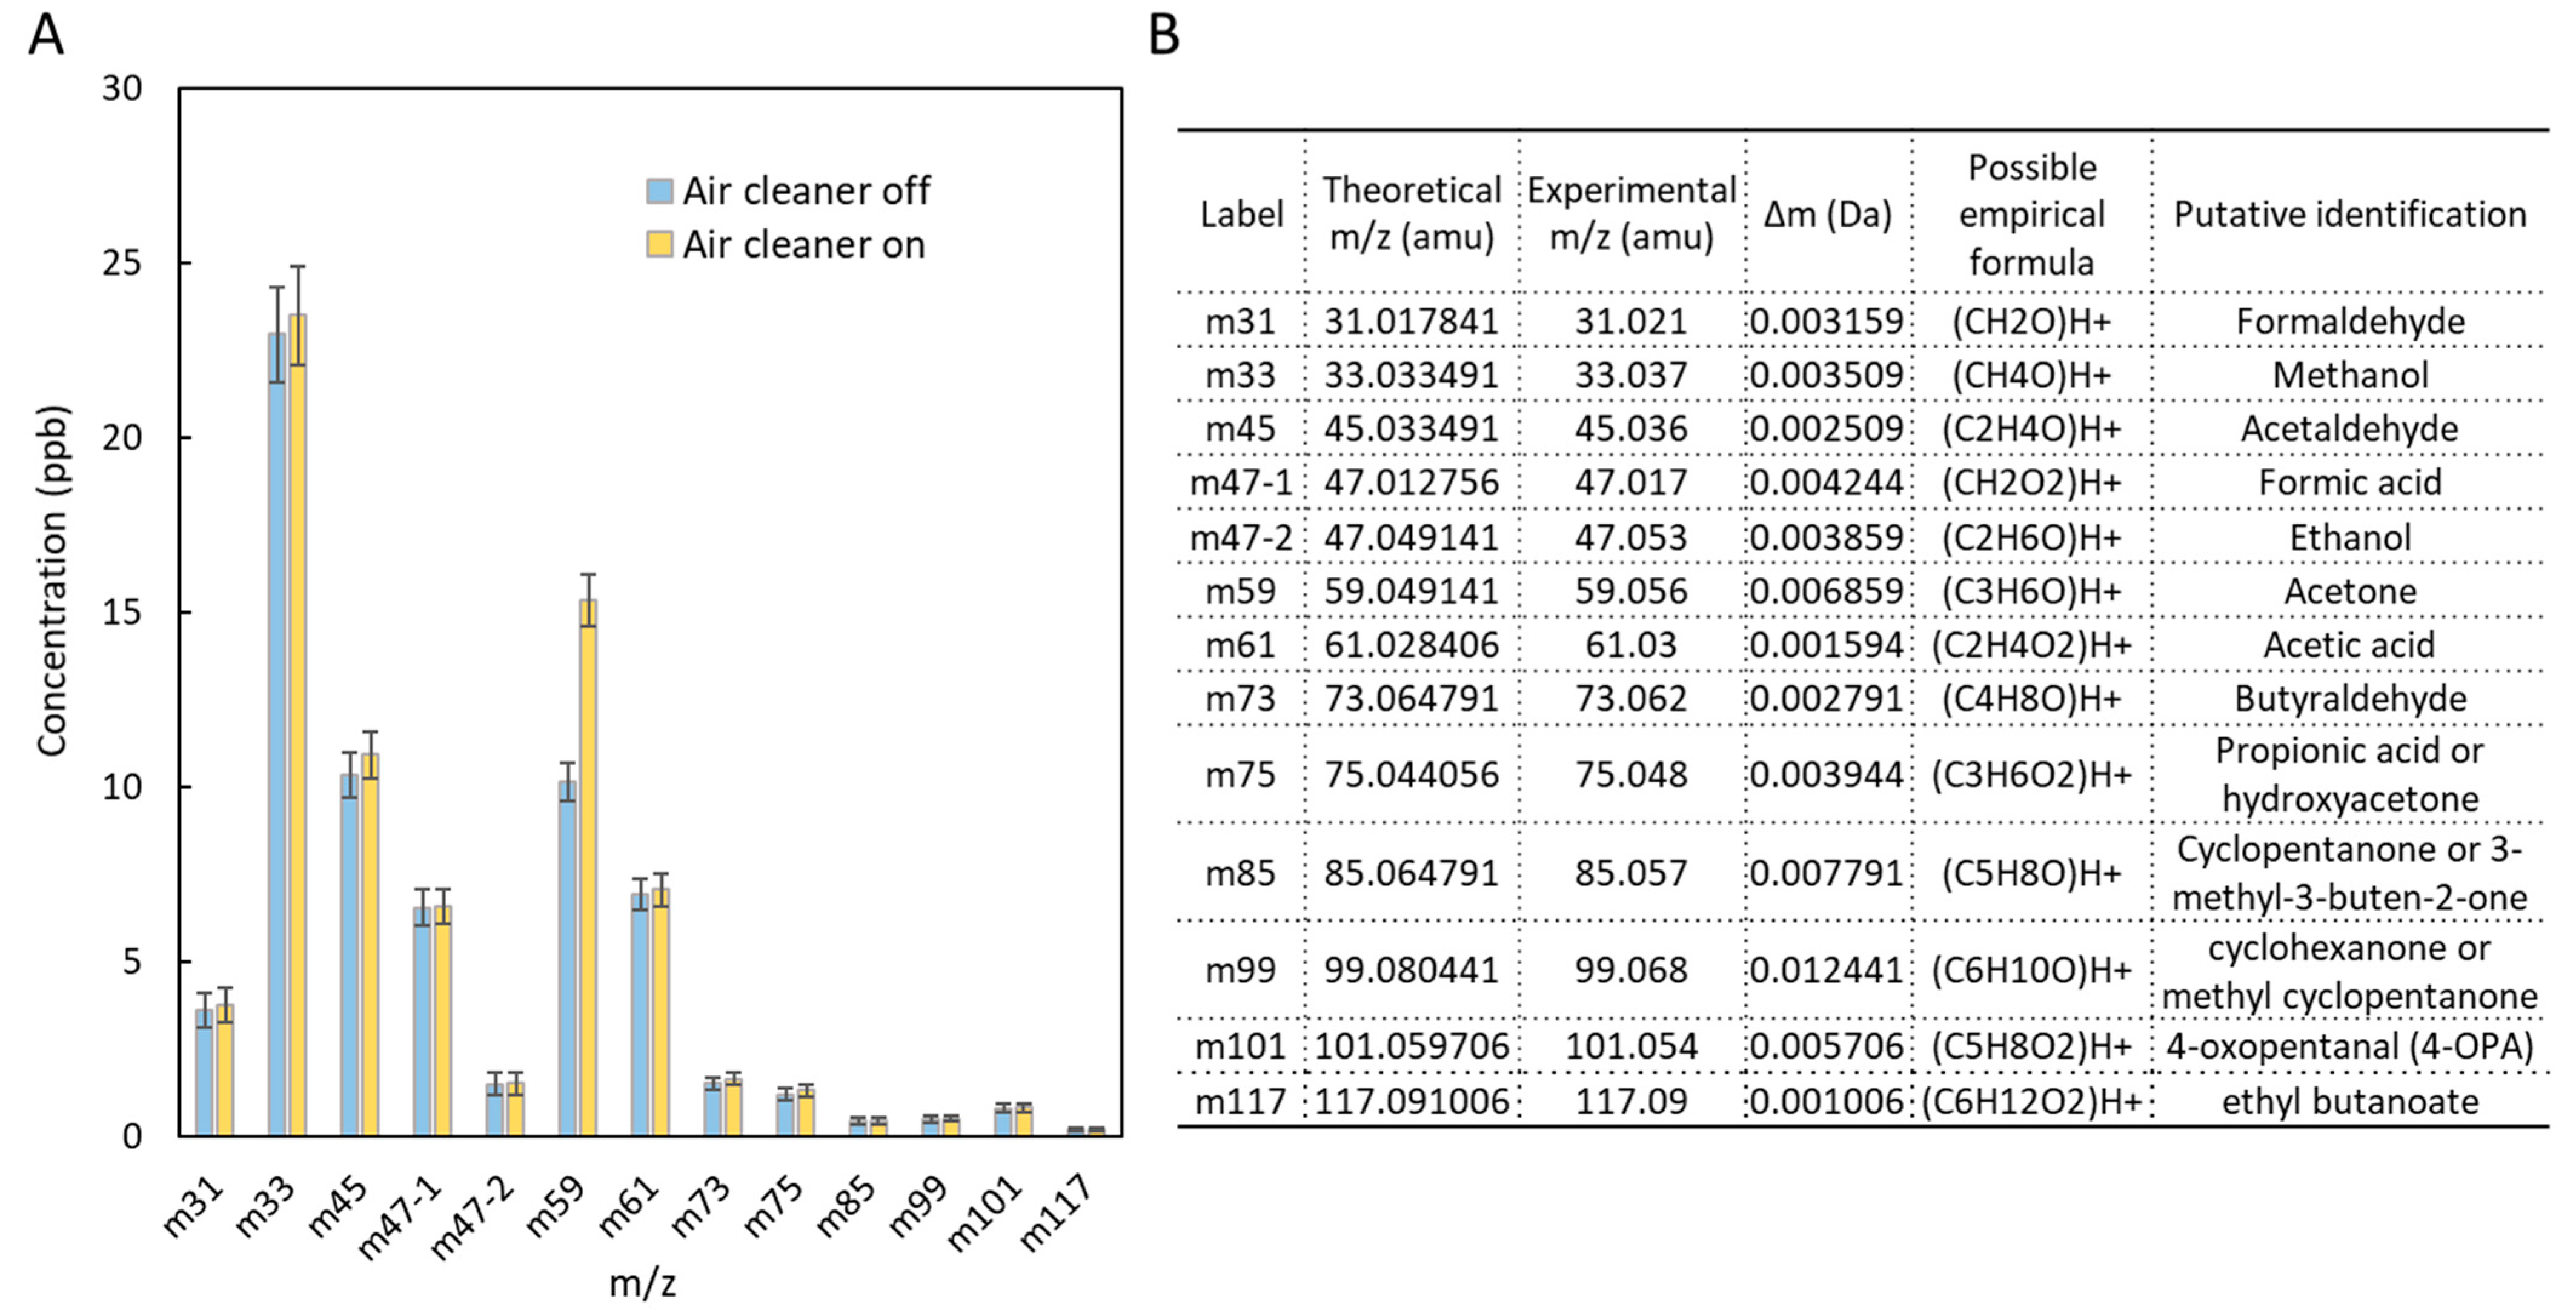
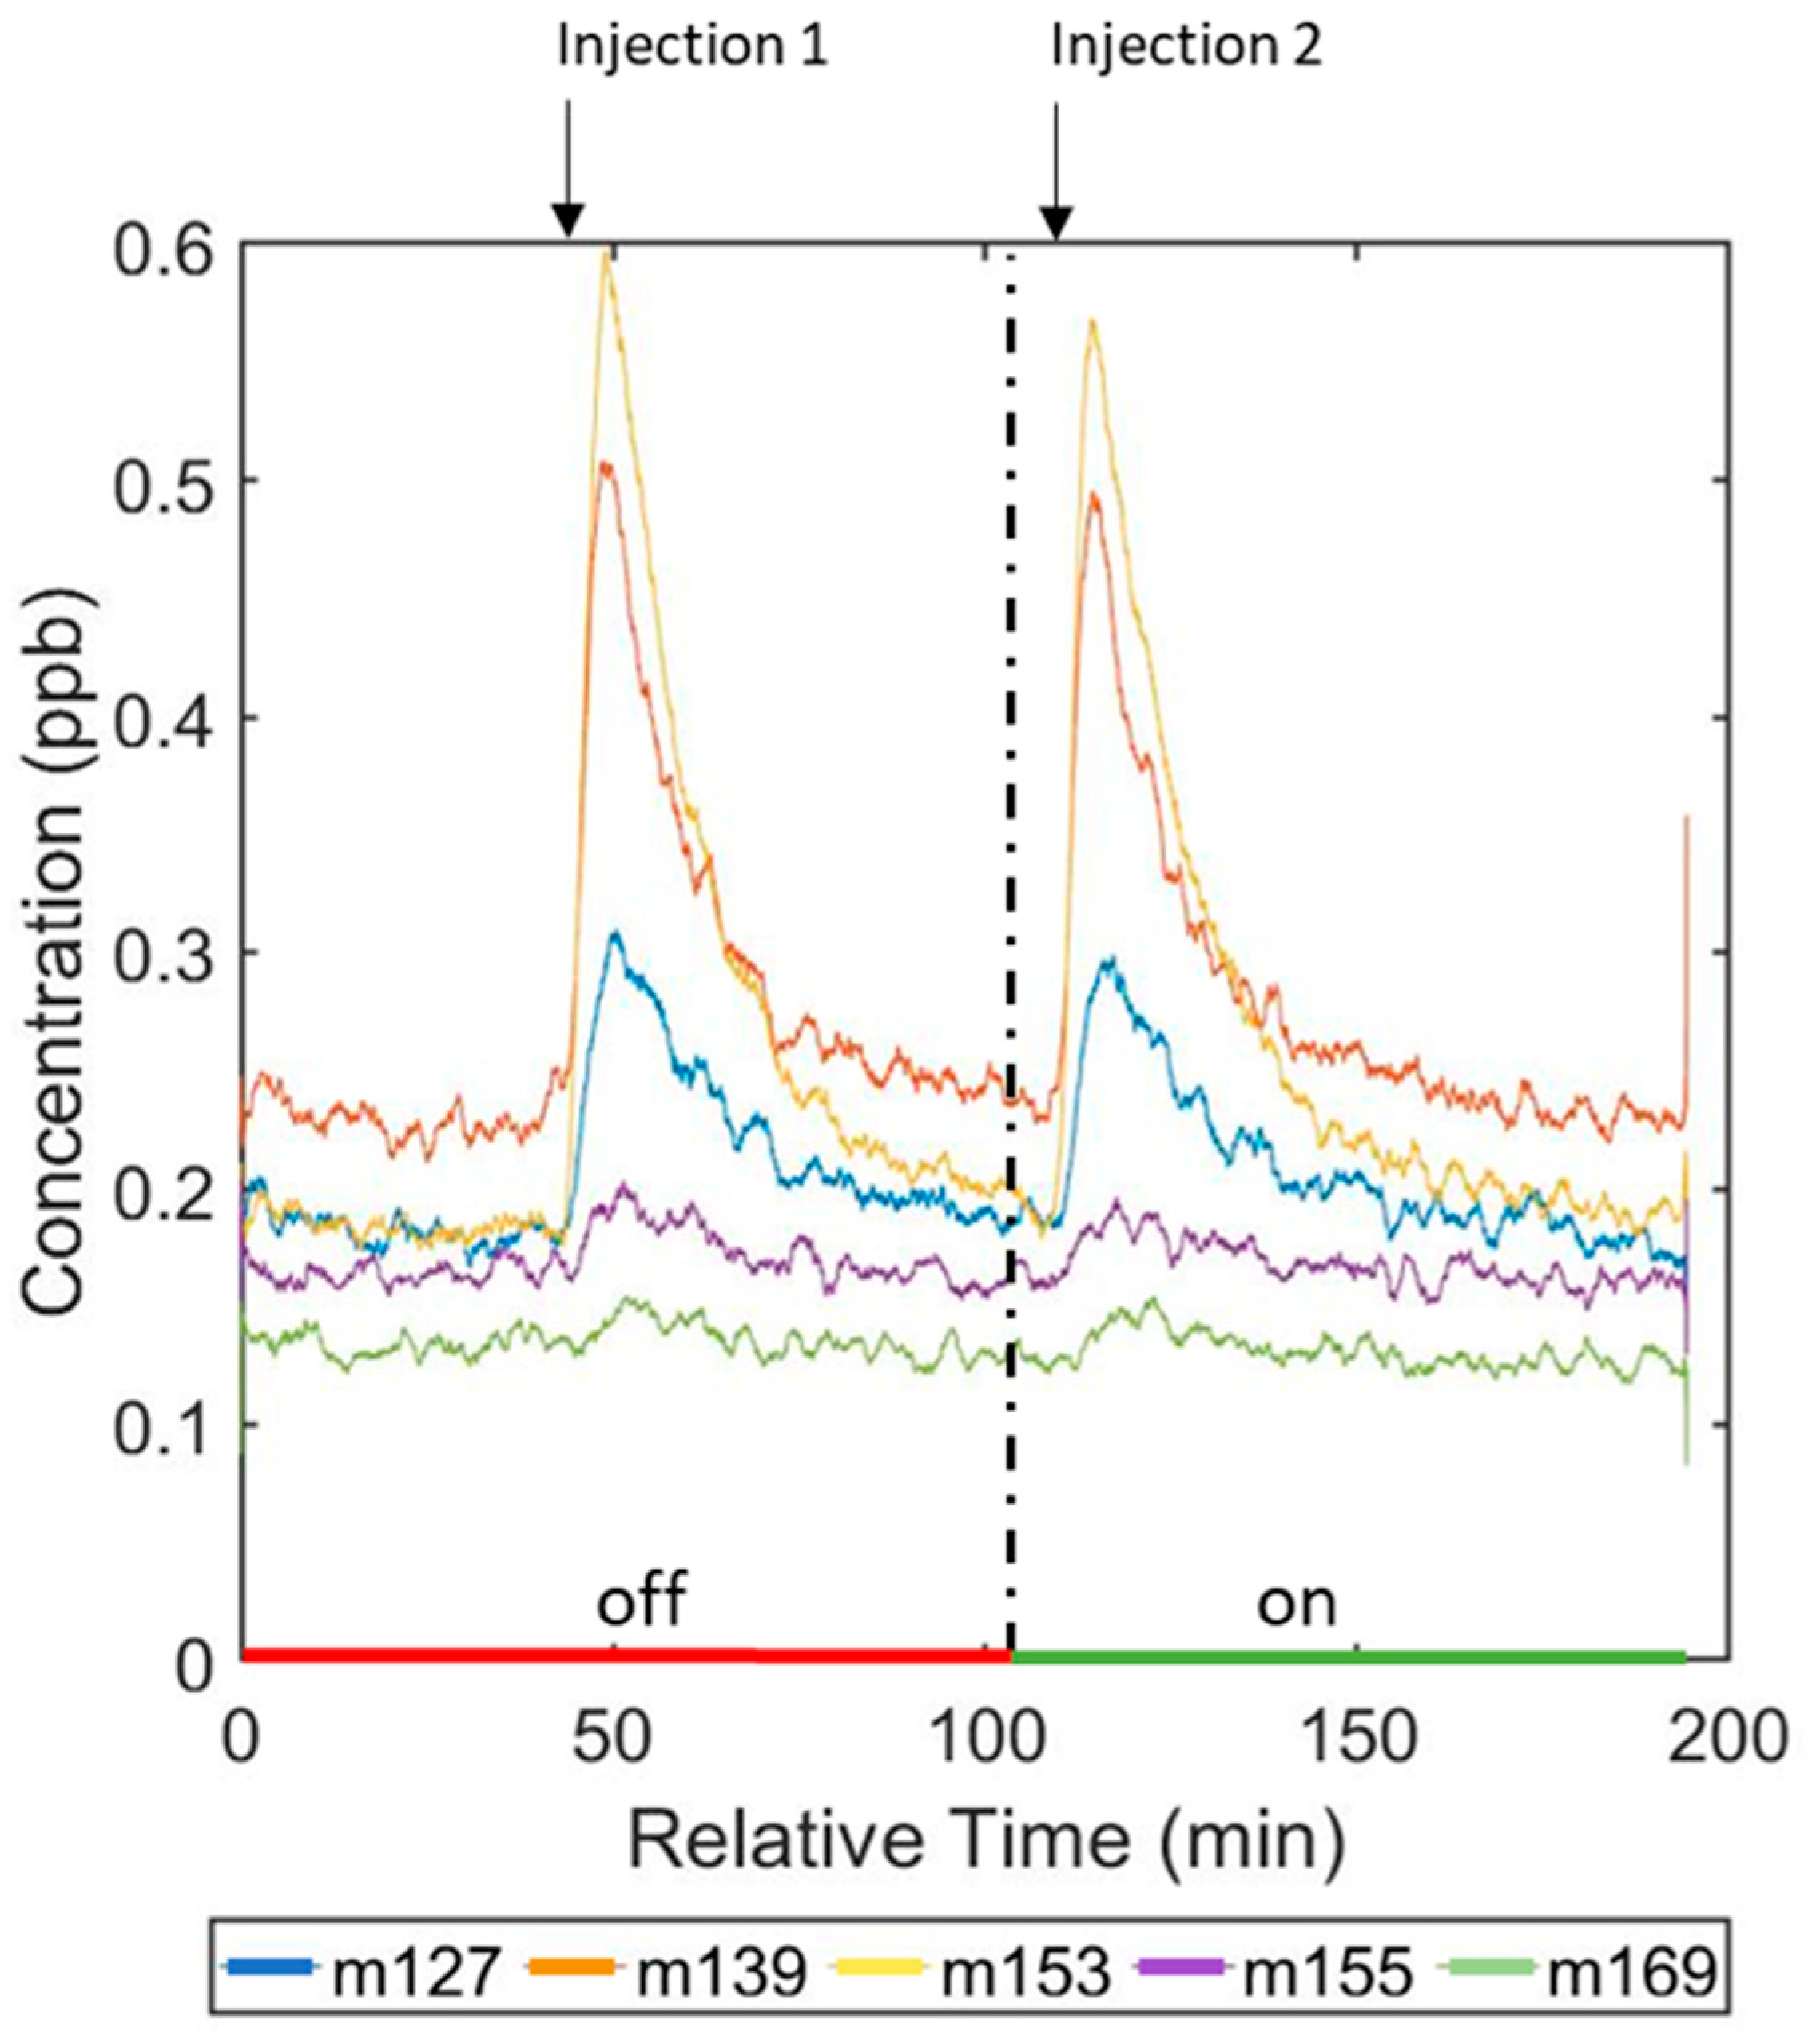
3.1.5. Natural Condition Chamber Tests: Gas-Phase Organics
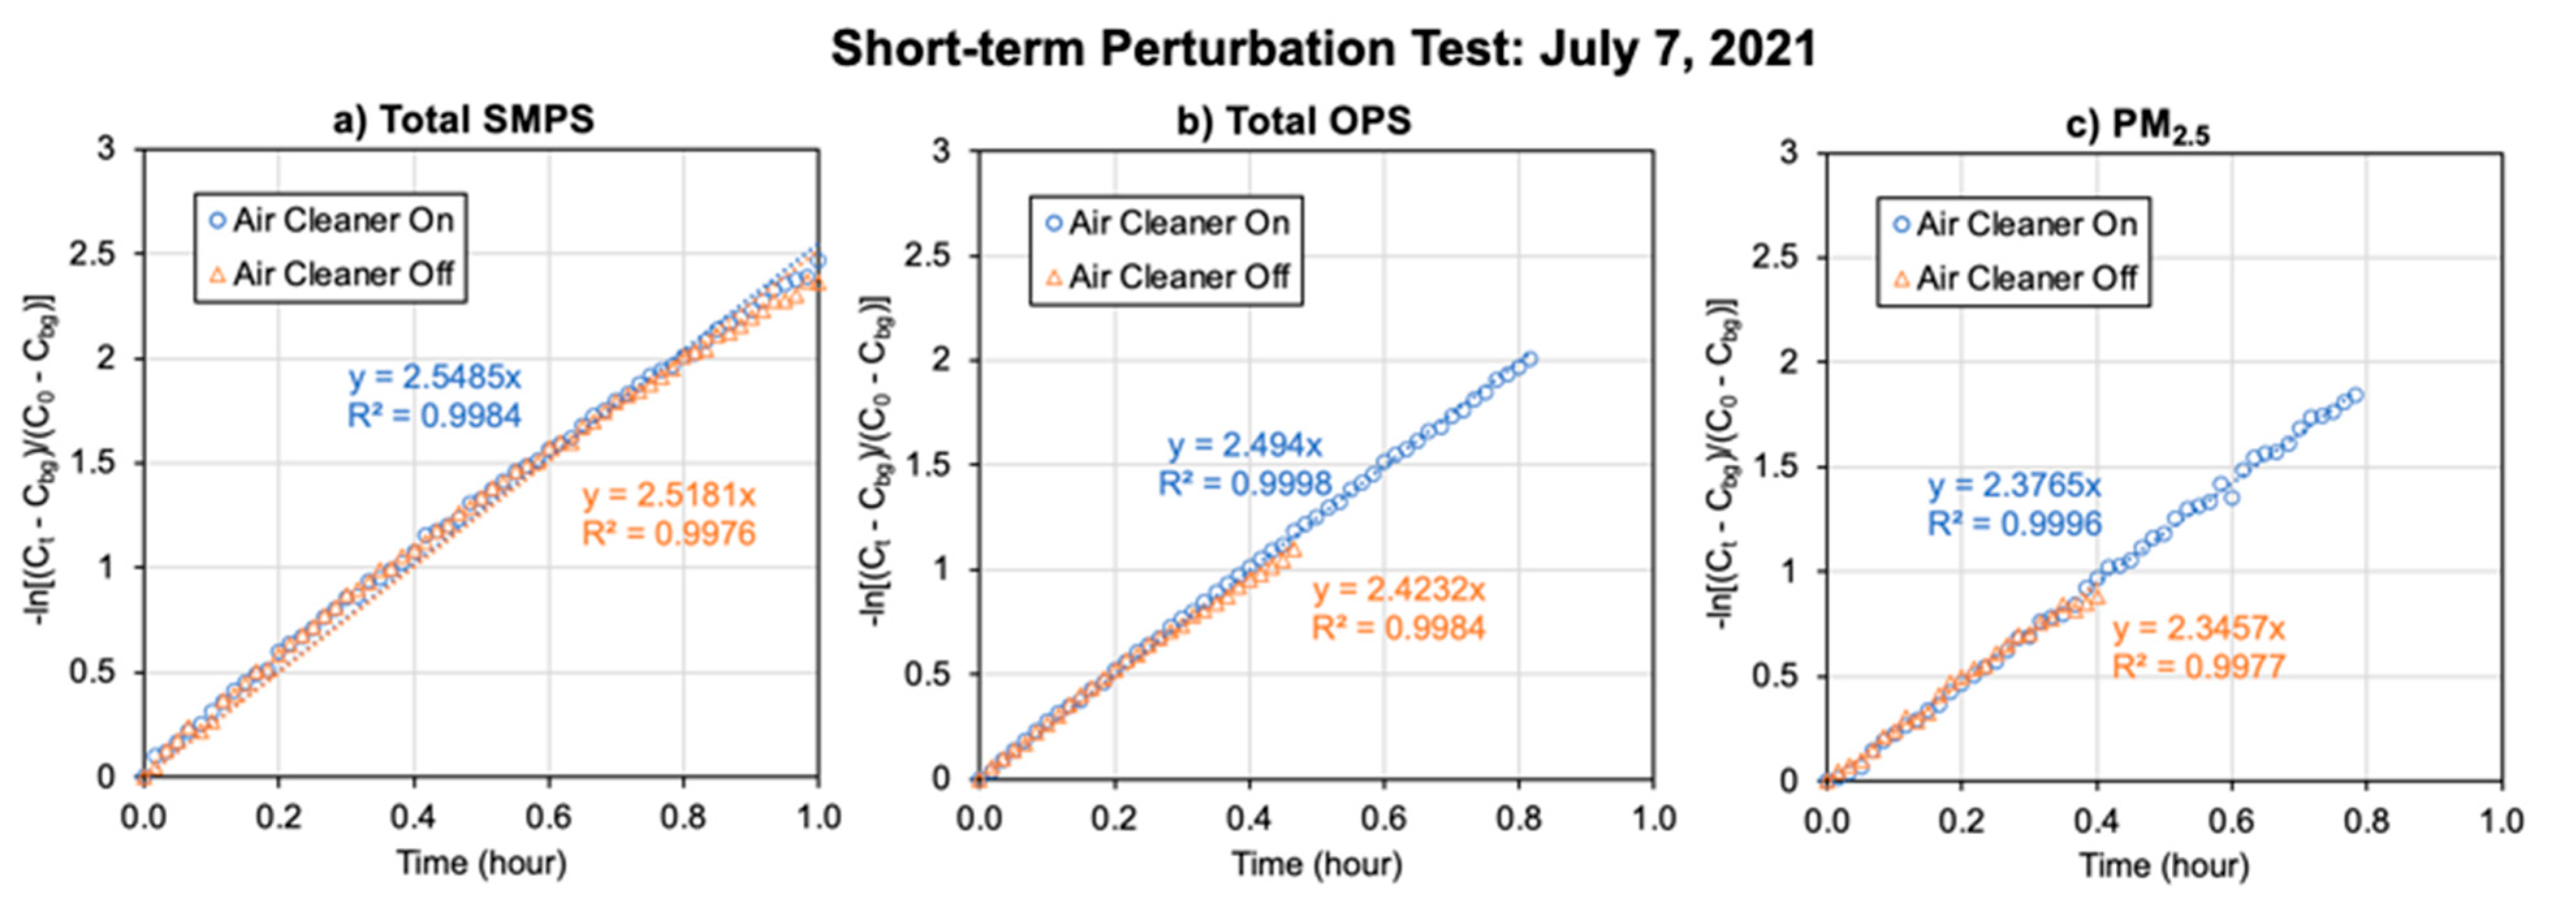
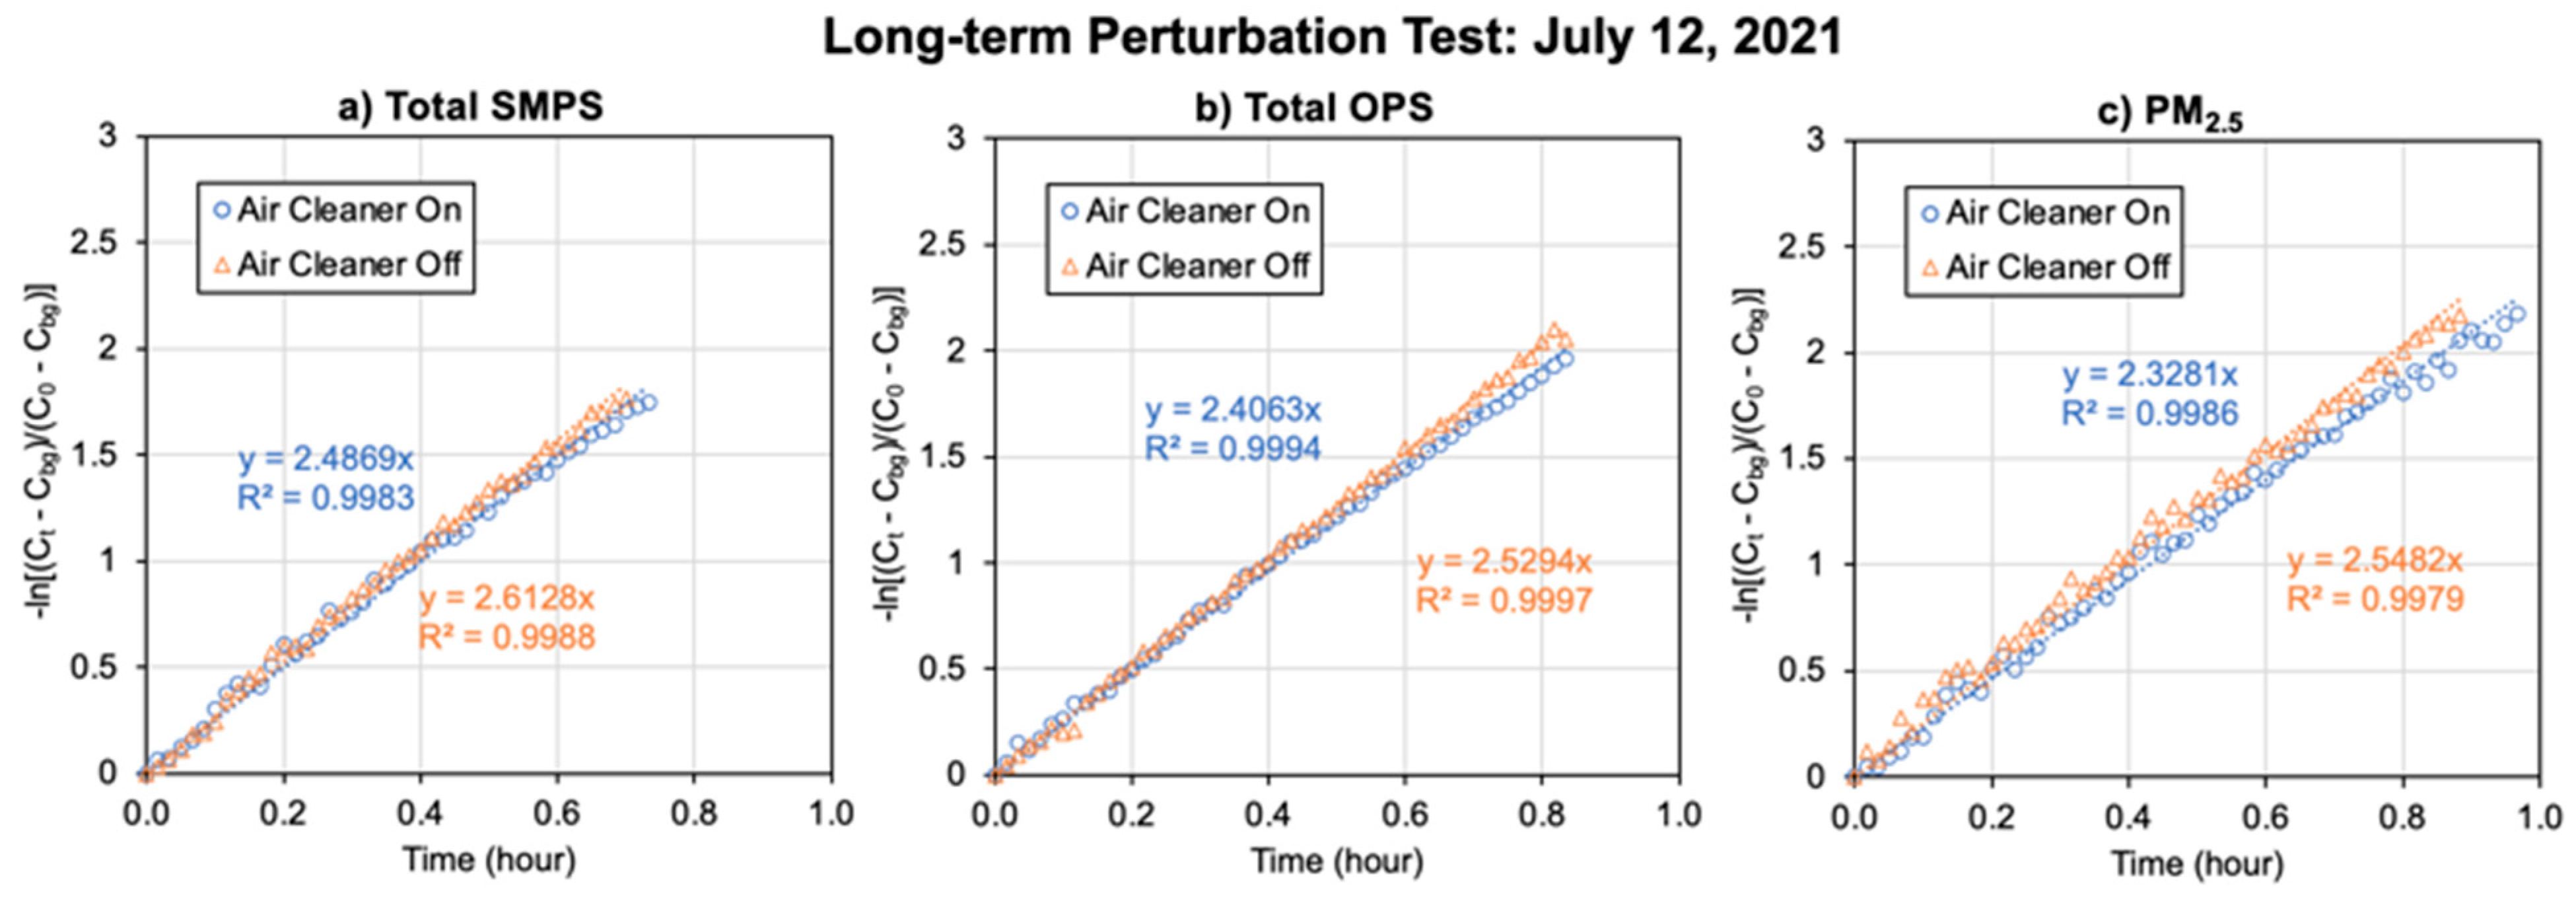
3.1.6. Chamber Perturbation Tests: Particulate Matter (PM)
3.2. Controlled Laboratory Experiments: Portland, OR, USA
3.2.1. Negative Ion Production
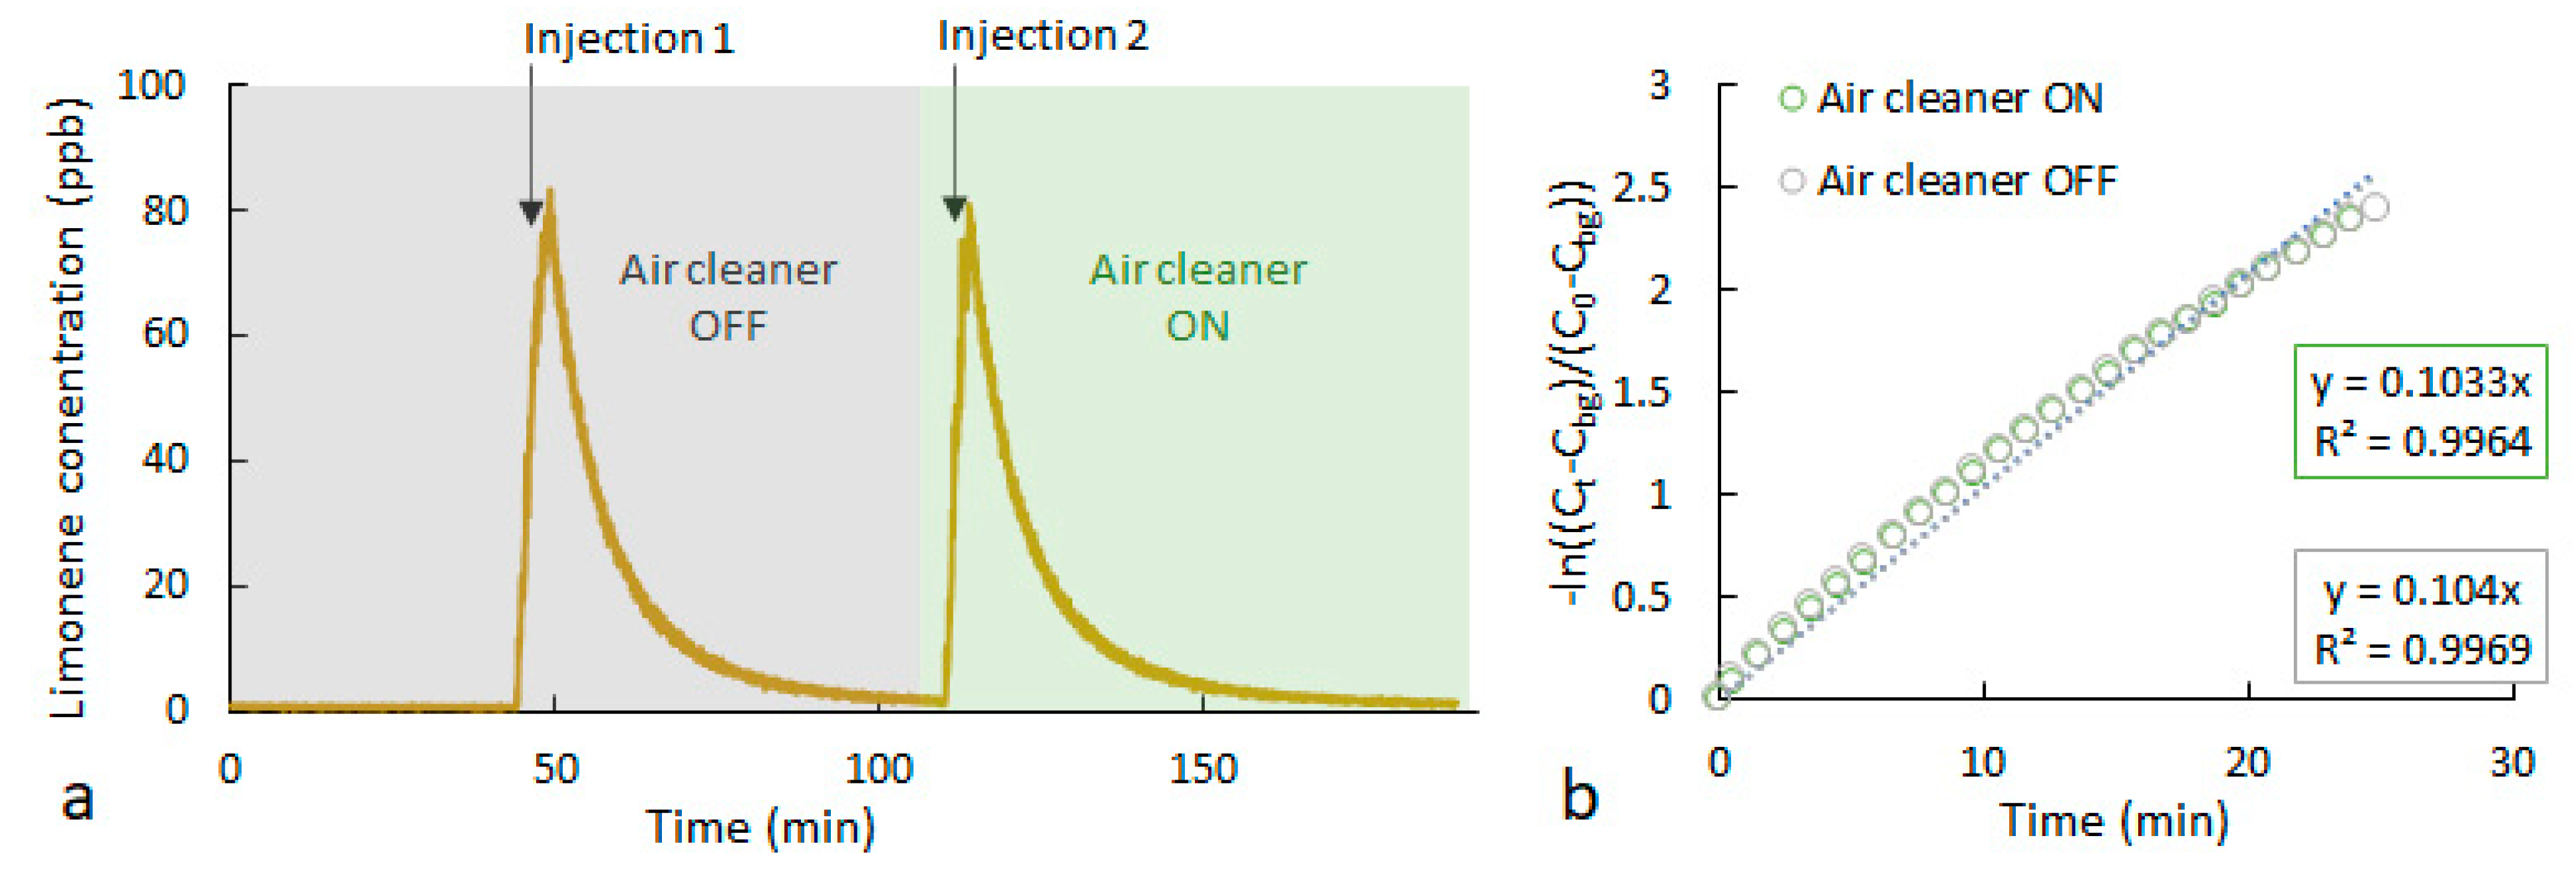
3.2.2. Controlled Laboratory Study Perturbation Tests
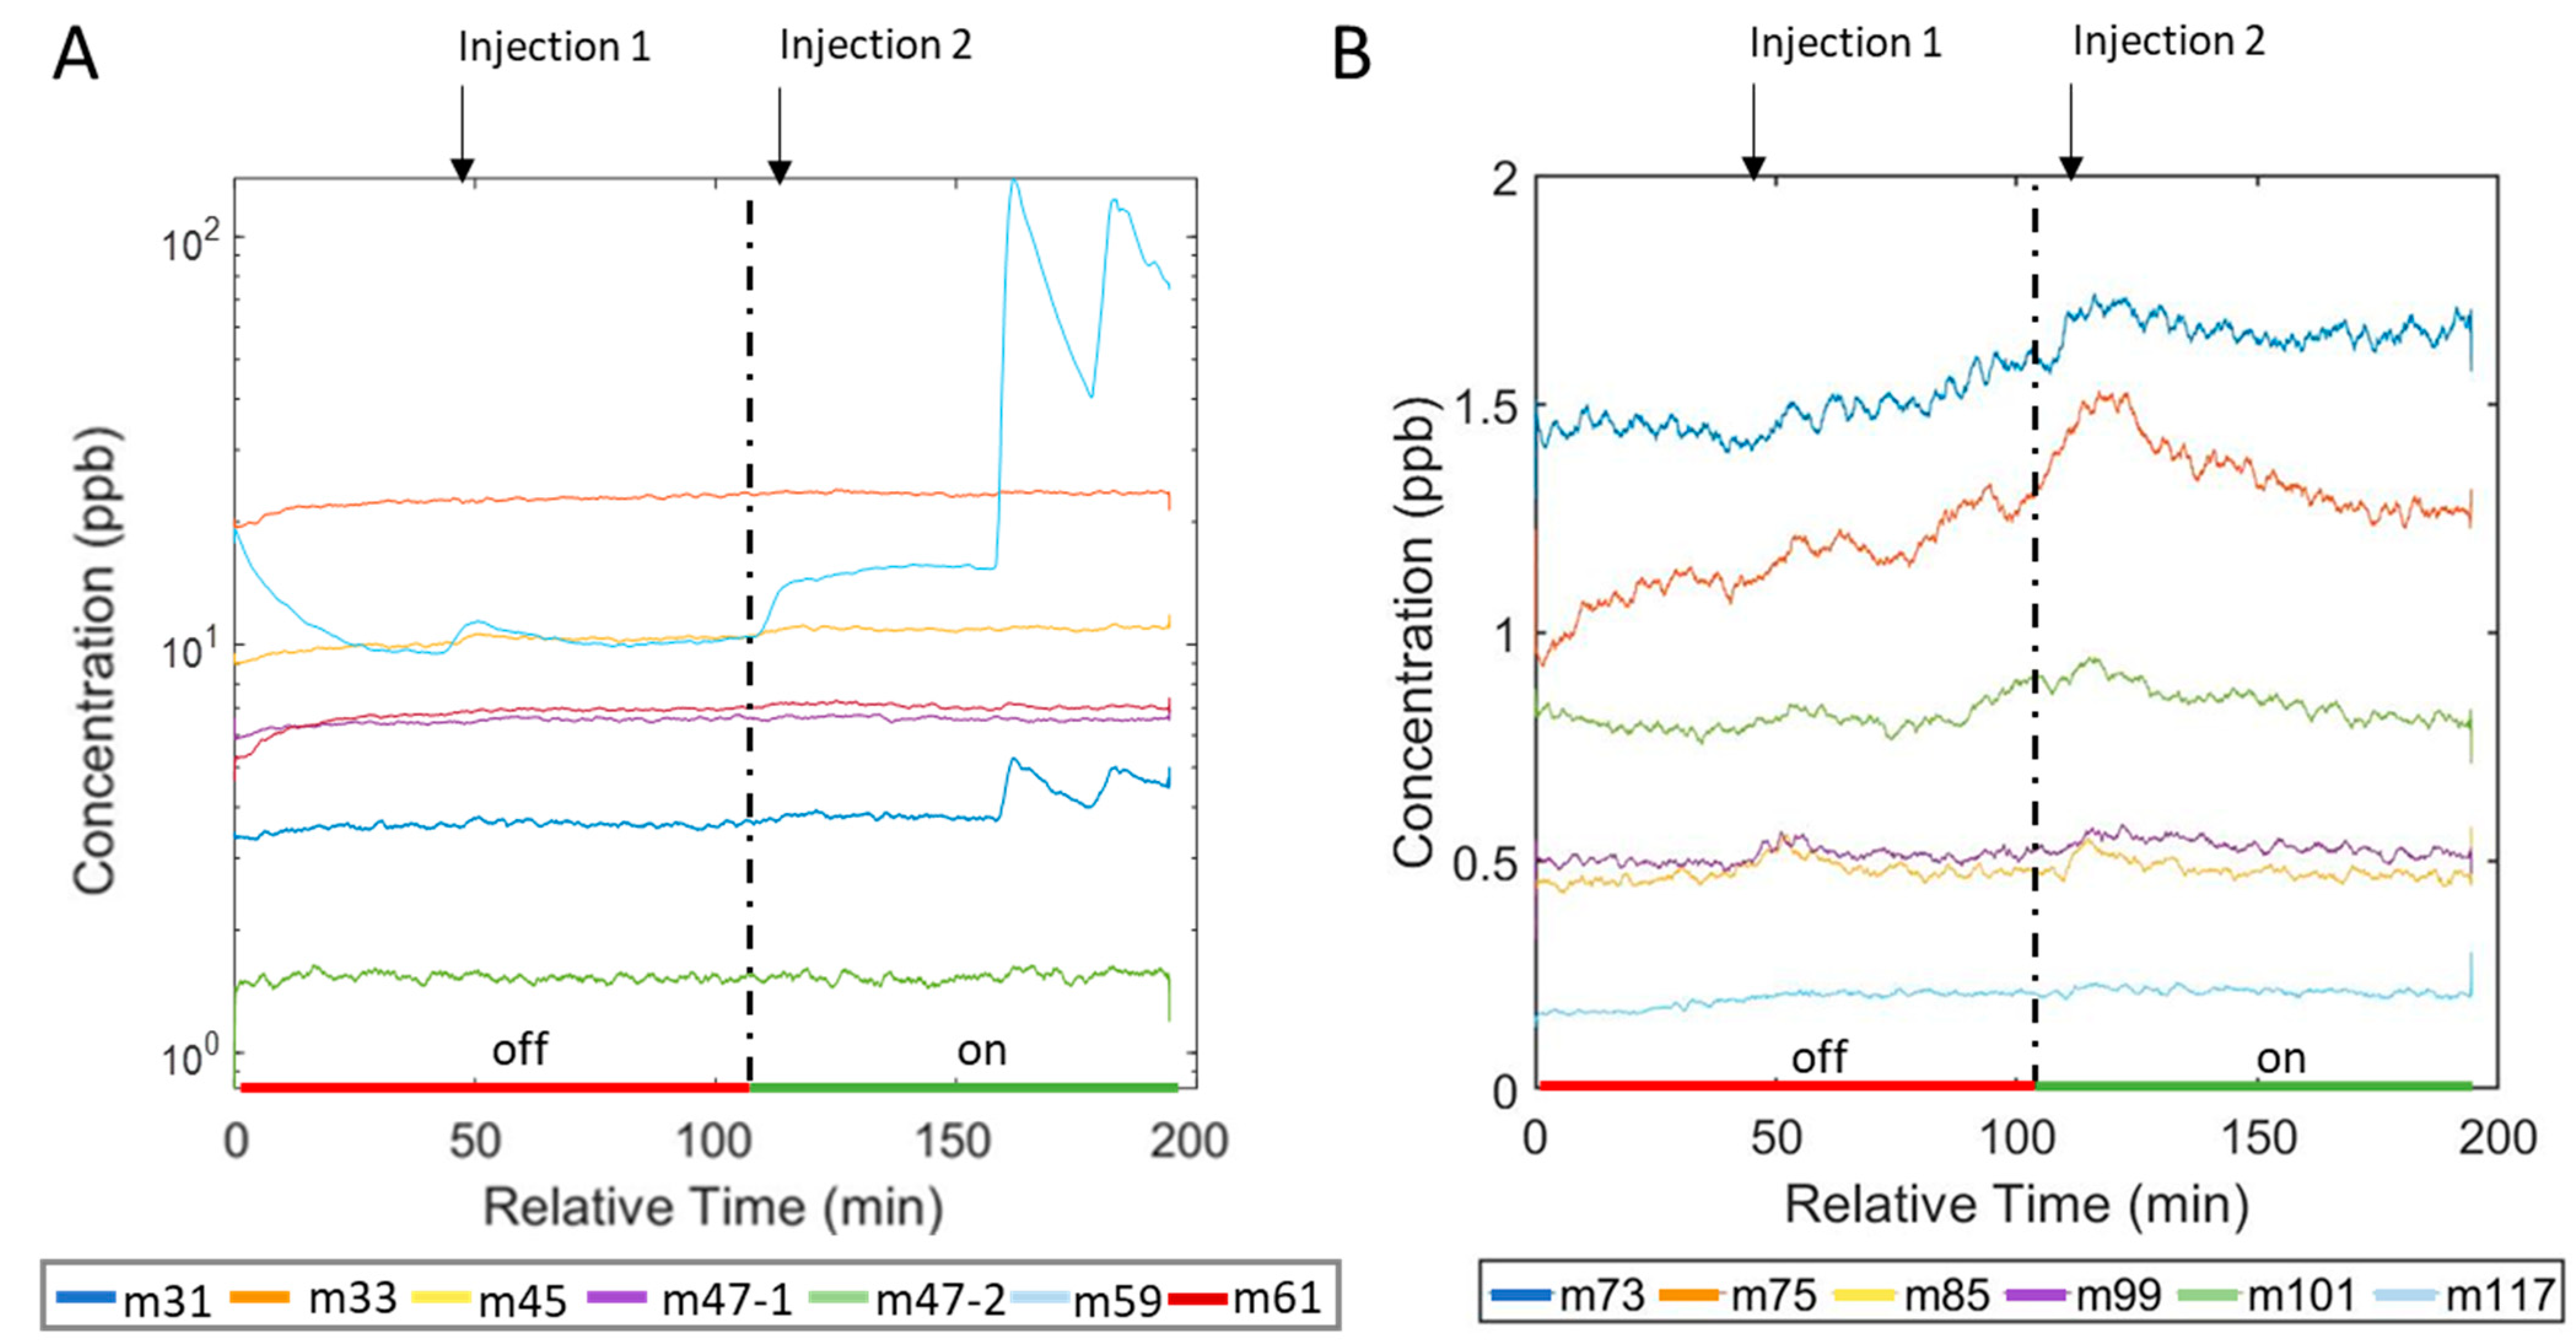
3.2.3. Byproduct Formation in the Controlled Laboratory Study
4. Conclusions
Author Contributions
Funding
Data Availability Statement
Conflicts of Interest
Appendix A
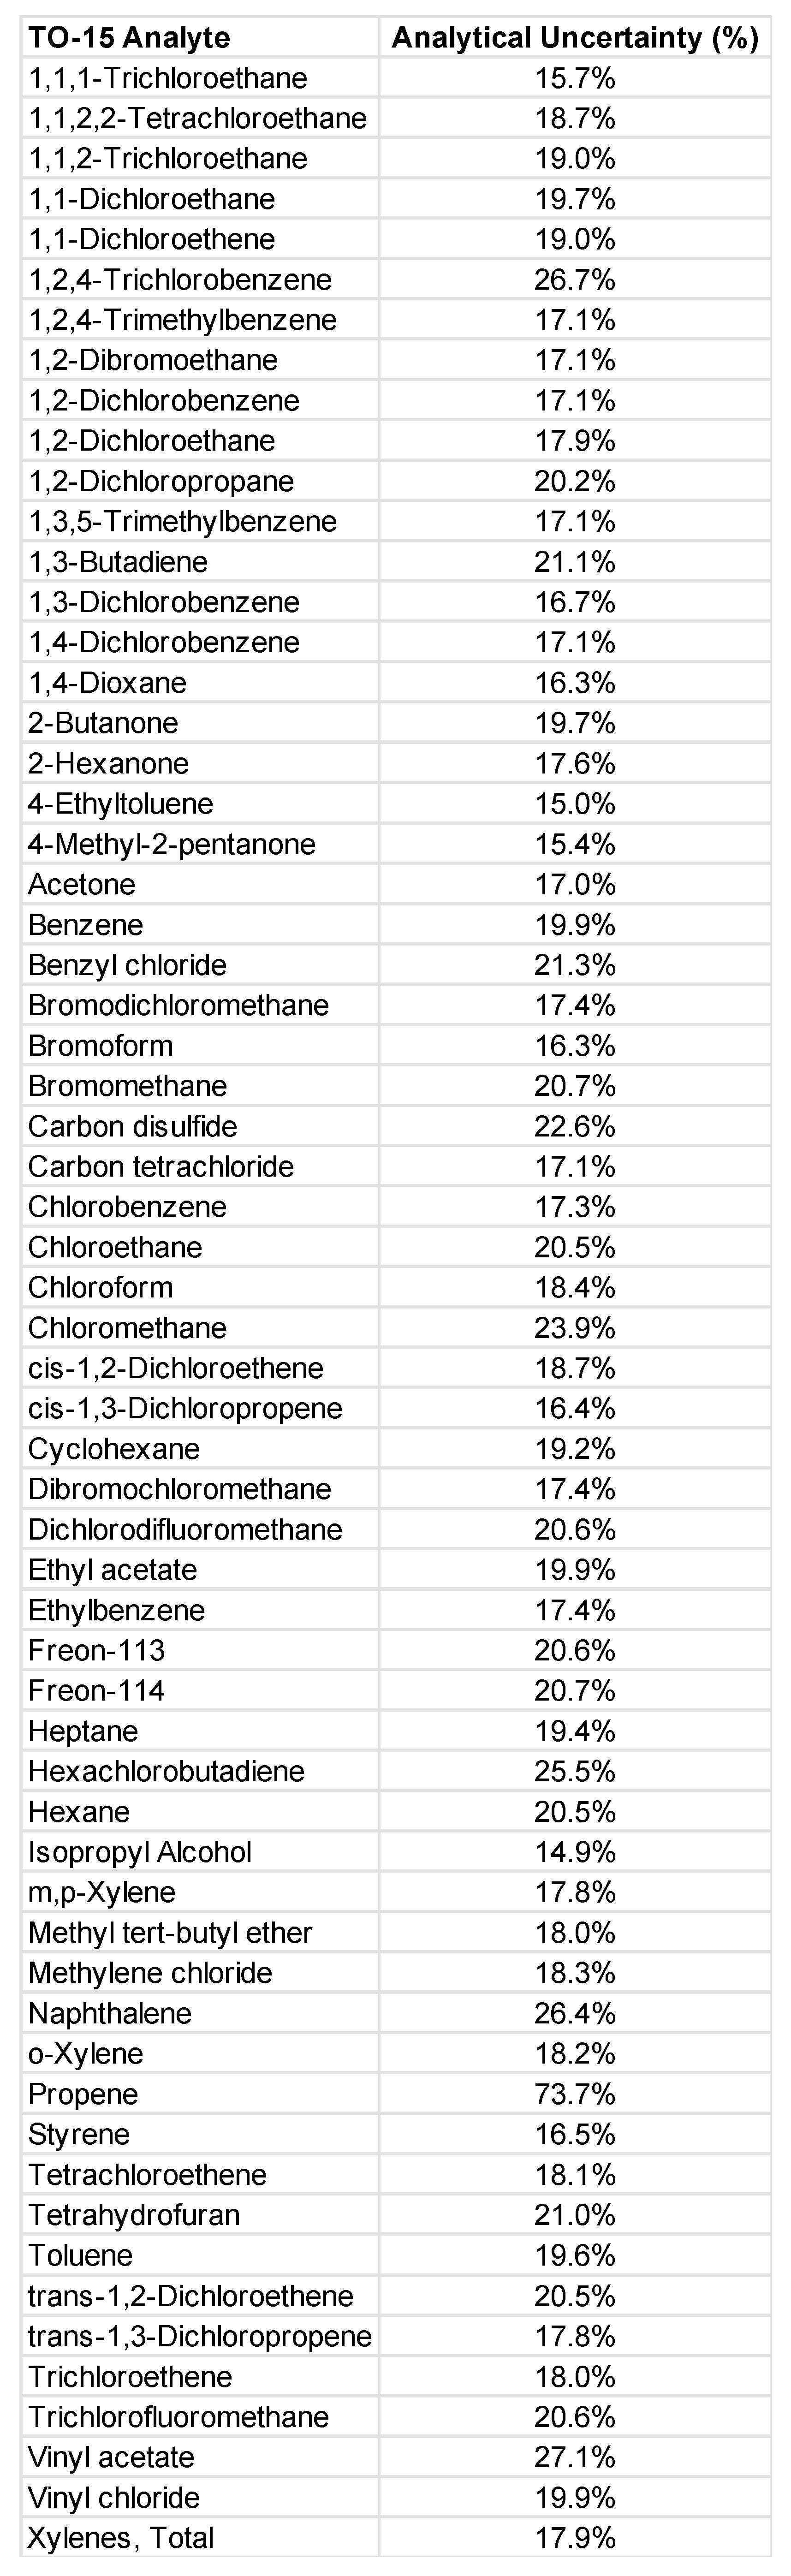
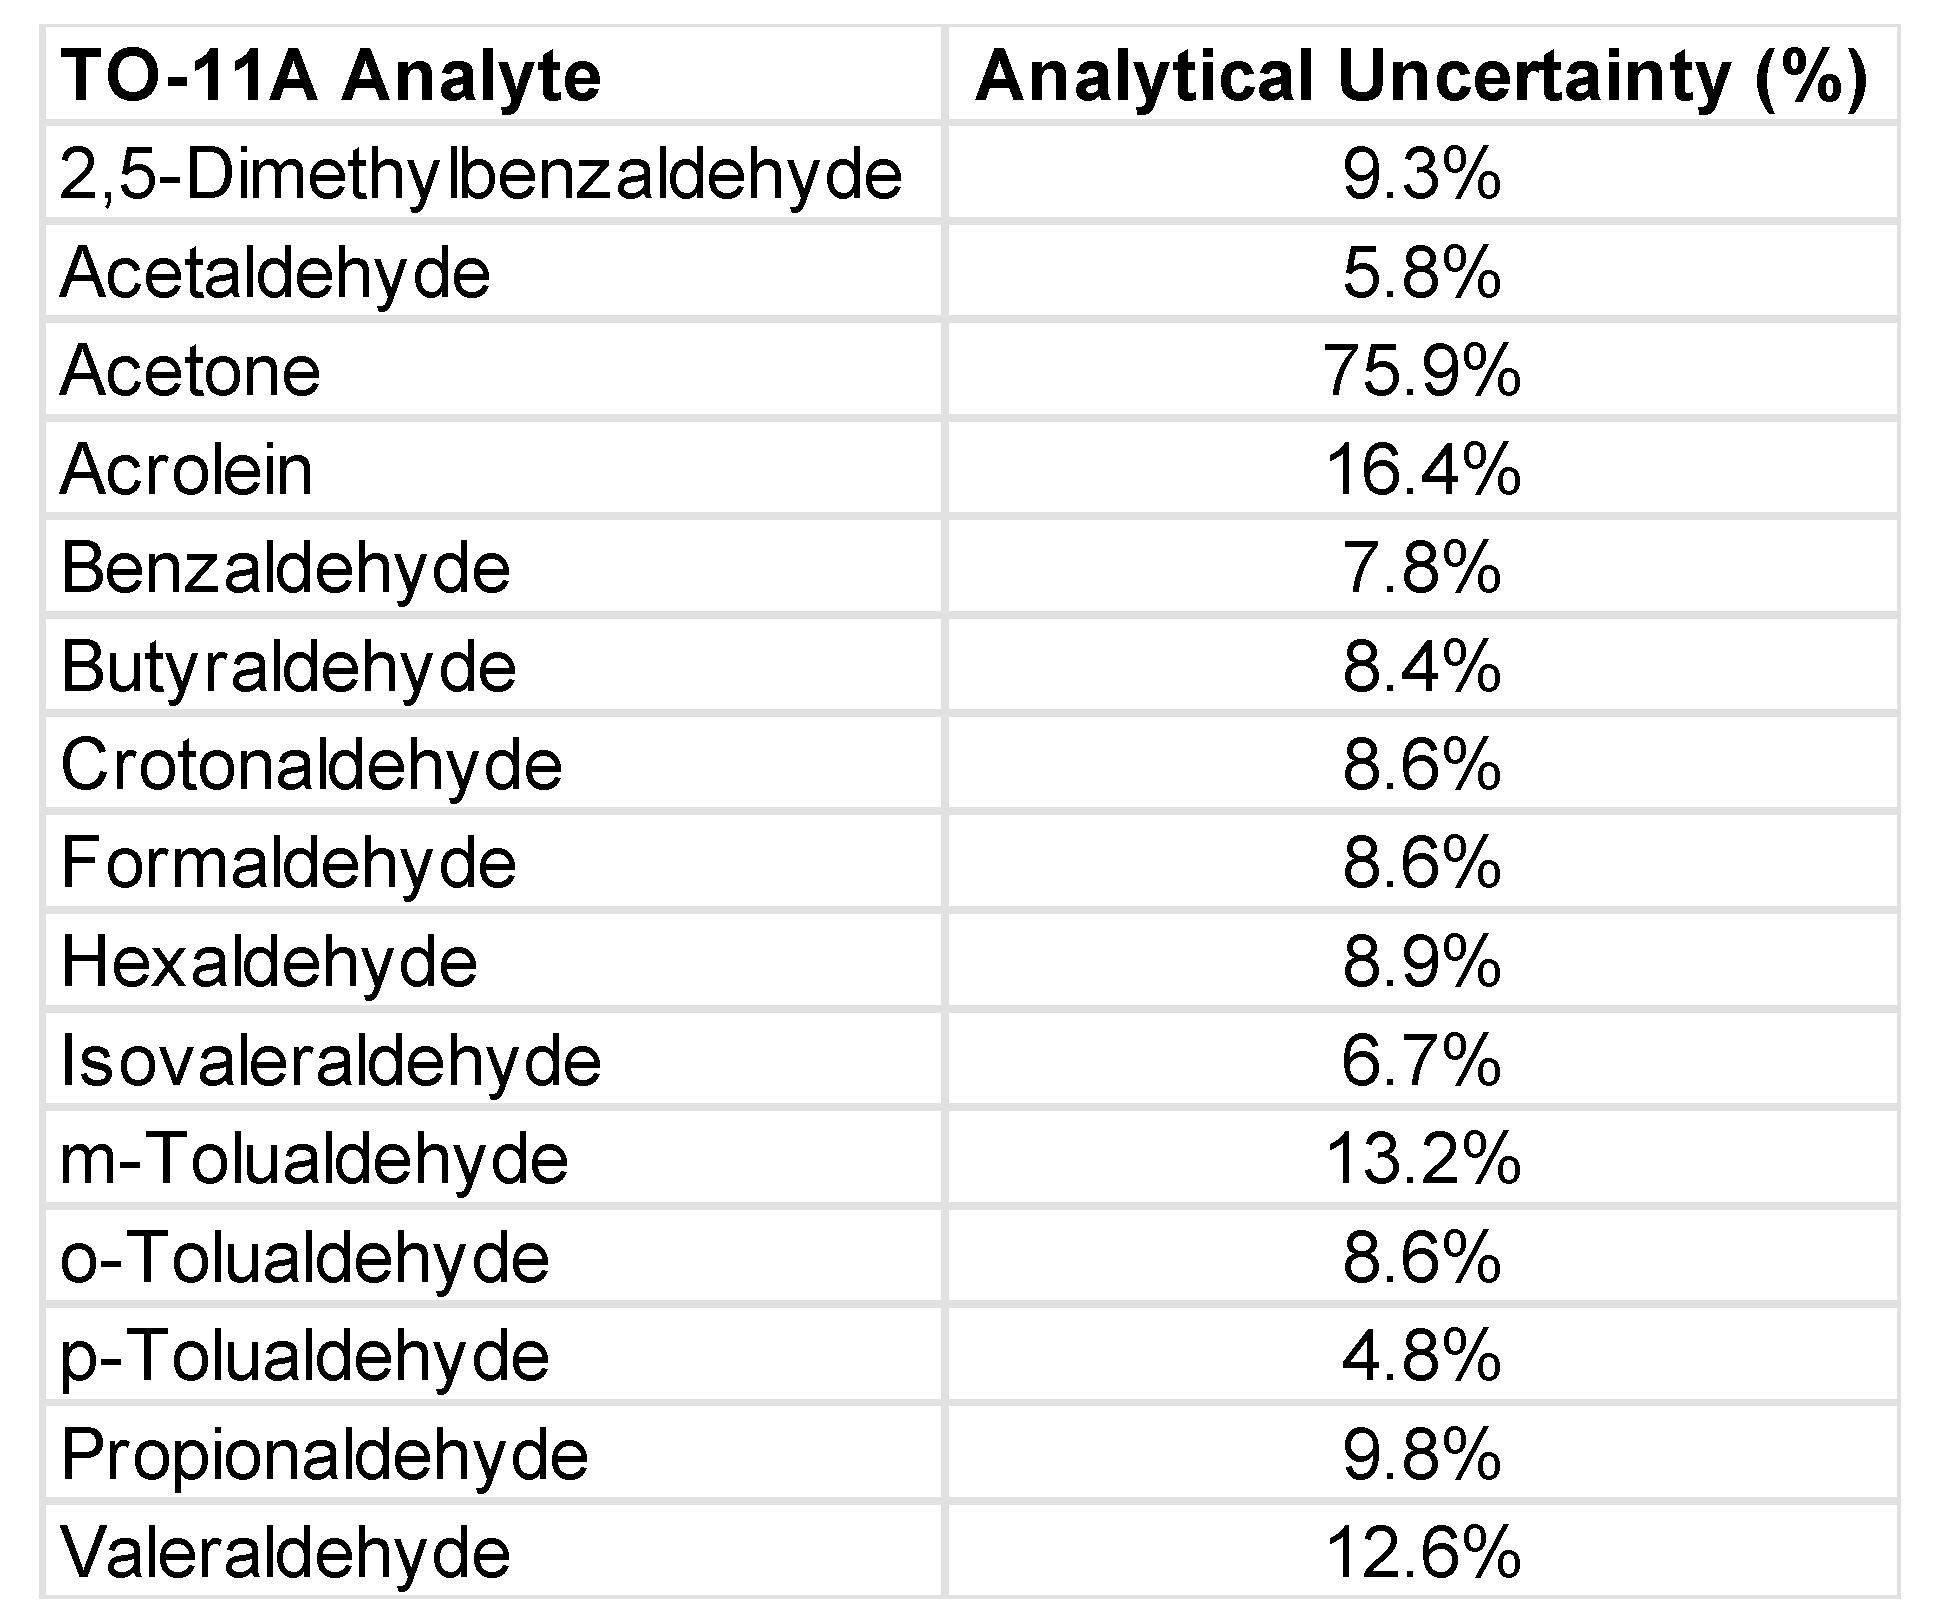
Appendix A.1. VOCs including Aldehydes from the Chamber Study


| 4 May 2021-Short-Term (Negative Ions: −1370 ions/cm3) | |||||||||||
|---|---|---|---|---|---|---|---|---|---|---|---|
| Analyte | MW (g/mol) | Concentration (µg/m3) | I/O Concentration Ratio | Concentration Difference (µg/m3) | |||||||
| Air Cleaner Off | Air Cleaner On | Inside–Outside (I–O) | |||||||||
| TO-15 List | Inside Chamber | Outside Chamber | Inside Chamber | Outside Chamber | EAC Off | EAC On | % Change | EAC Off | EAC On | EAC On-Off | |
| 1,2-Dichloroethane | 99.0 | 3.8 (0.7) | <2.5 | 2.6 (0.5) | <2.5 | >1.5 | >1.0 | unknown | >1.3 | >0.1 | <−1.2 |
| 2-Butanone | 72.1 | <4.4 | <4.4 | 8.2 (1.6) | <4.4 | unknown | >1.9 | likely ↑ | unknown | 3.8 (1.6) | unknown |
| Acetone | 58.1 | 137 (23) | 37.7 (6.4) | 196 (33) | 63.7 (11) | 3.6 (0.9) | 3.1 (0.7) | −15% | 99 (24) | 132 (35) | +33 (43) |
| Benzene | 78.1 | <1.9 | <1.9 | 123.7 (25) | <1.9 | unknown | >65 | likely ↑ | unknown | 121.8 (25) | unknown |
| Carbon disulfide | 76.1 | <1.9 | <1.9 | 4.9 (1.1) | <1.9 | unknown | >2.6 | likely ↑ | unknown | 3.0 (1.1) | unknown |
| Dichlorodifluoromethane | 120.9 | <3.0 | <3.0 | <3.0 | 3.1 (0.6) | unknown | <1.0 | unknown | unknown | −0.1 (0.6) | unknown |
| Ethylbenzene | 106.2 | <2.6 | <2.6 | 24.1 (4.2) | <2.6 | unknown | >9.2 | likely ↑ | unknown | 21.5 (4.2) | >+20 |
| Isopropyl Alcohol | 60.1 | 3418 (509) | 439 (65) | 2173 (323) | 634 (25) | 7.8 (1.6) | 3.4 (0.7) | −56% | 2979 (513) | 1538 (337) | −1440 (613) |
| m,p-Xylene | 106.2 | <5.2 | <5.2 | 16.8 (3.0) | <5.2 | unknown | >3.2 | likely ↑ | unknown | >11.6 | unknown |
| Propene | 42.1 | 222 (164) | 25.6 (18.9) | 130 (96) | 34.2 (25.2) | 8.7 (9.0) | 3.8 (4.0) | −56% | 197 (165) | 95.7 (99) | −101 (192) |
| Tetrachloroethene | 165.8 | <4.1 | 18.2 (3.3) | <4.1 | <4.1 | <0.23 | unknown | likely ↓ | −14.1 (3.3) | unknown | unknown |
| Toluene | 92.1 | 7.5 (1.5) | 4.1 (0.8) | 7.9 (1.5) | 4.5 (0.9) | 1.8 (0.5) | 1.75 (0.5) | −4% | 3.4 (1.7) | 3.4 (1.8) | 0 (2.4) |
| Trichloroethene | 131.4 | <3.3 | 3.4 (0.6) | <3.3 | <3.3 | <1.0 | unknown | unknown | −0.1 (0.6) | unknown | unknown |
| Sum VOCs > RL | n/a | 3788 (698) | 528 (95) | 2687 (489) | 740 (132) | 7.2 (1.8) | 3.6 (0.9) | −49% | 3260 (704) | 1947 (506) | −1313 (867) |
| TO-11A List | |||||||||||
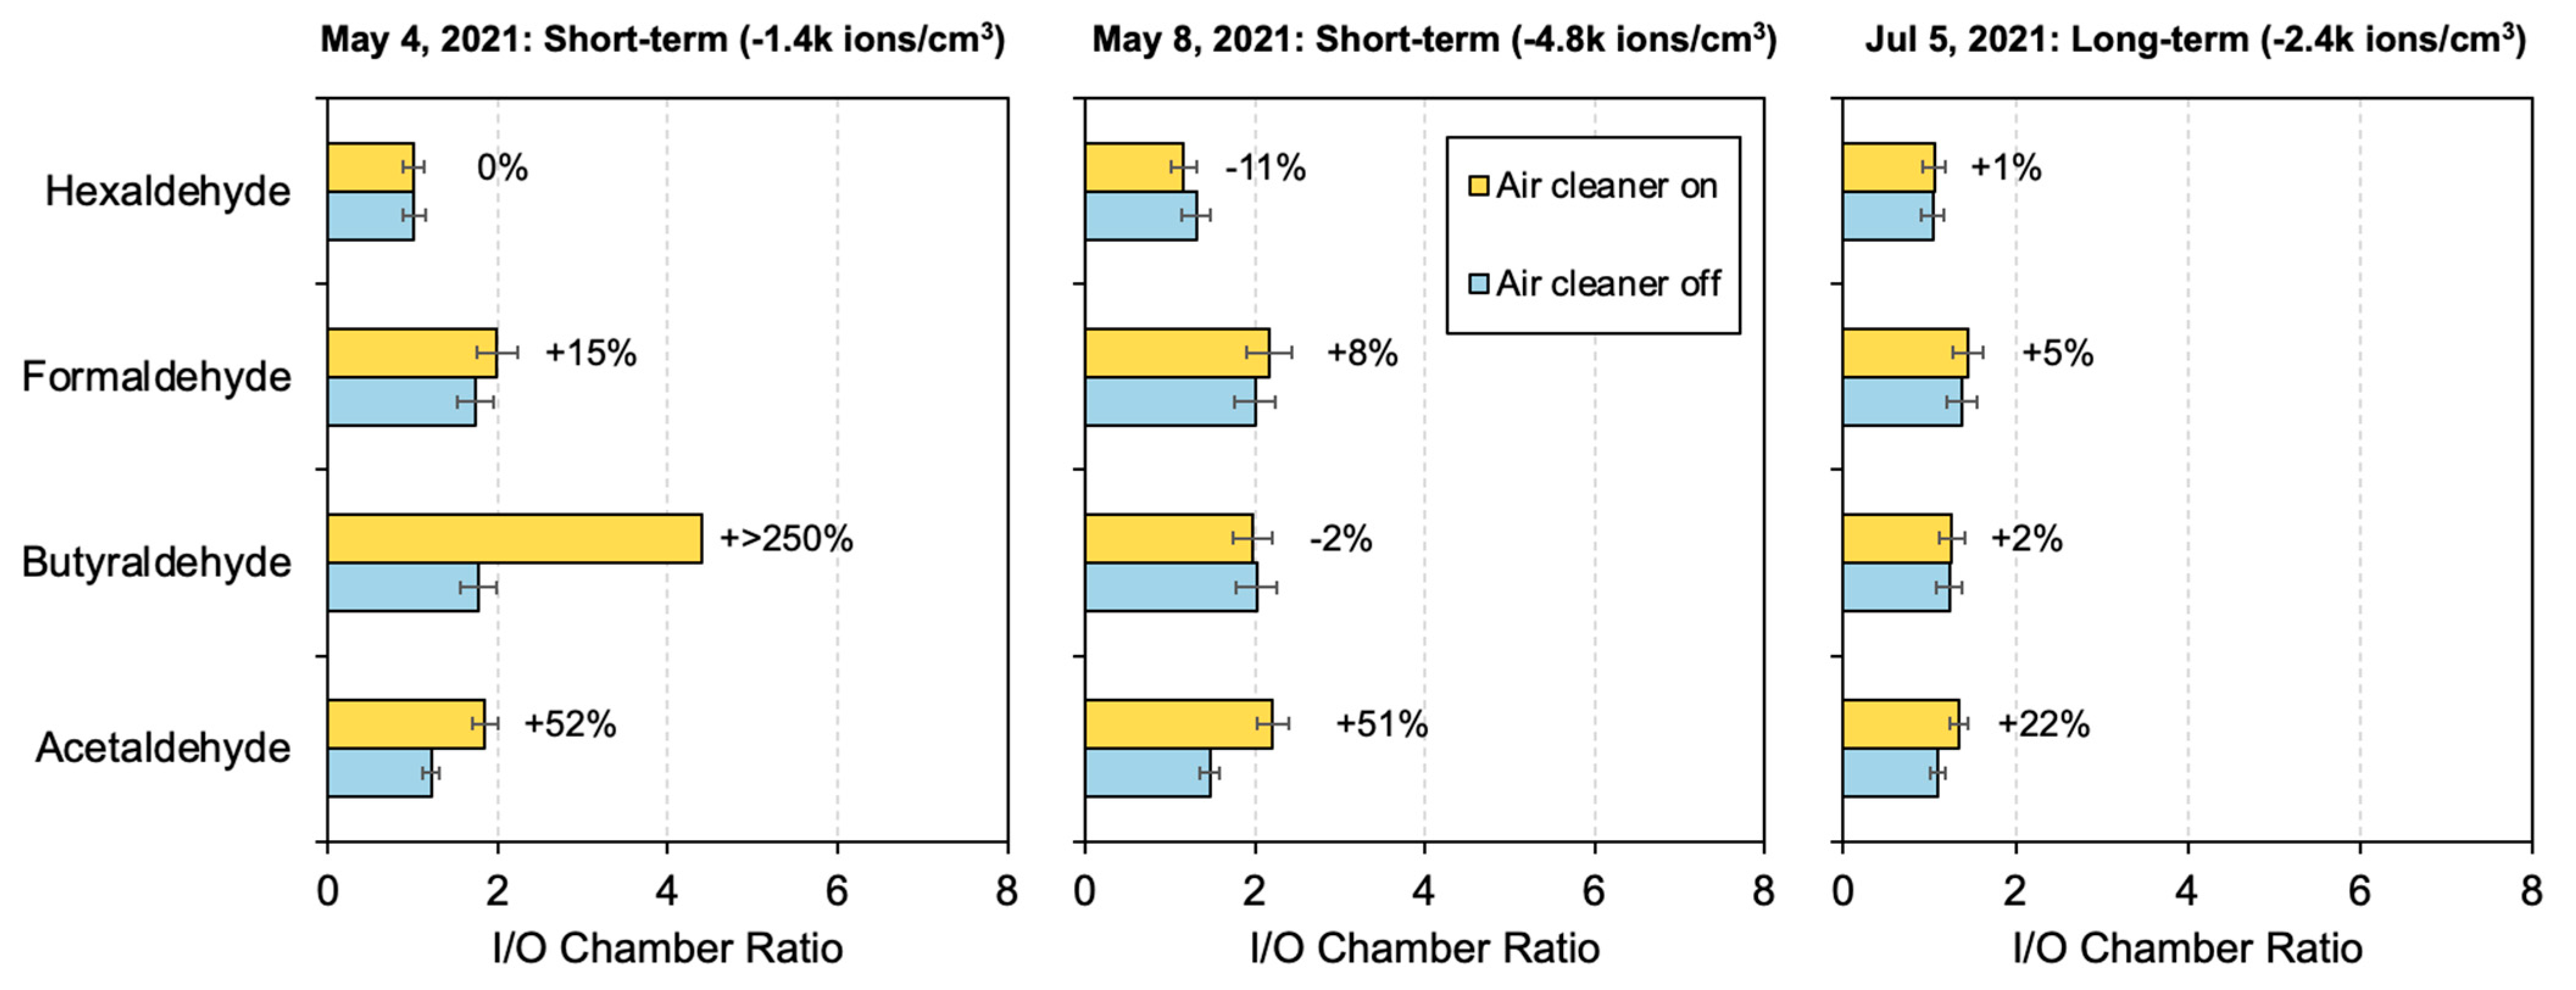
| Acetaldehyde | 44.1 | 6.0 (0.3) | 4.9 (0.3) | 10.1 (0.6) | 5.5 (0.3) | 1.2 (0.1) | 1.9 (0.2) | +52% | 1.1 (0.4) | 4.6 (0.7) | +3.6 (0.8) |
| Butyraldehyde | 72.1 | 5.2 (0.4) | 2.9 (0.2) | 4.9 (0.4) | <1.1 | 1.8 (0.2) | >4.4 | >+250% | 2.2 (0.5) | >3.8 | >+1.5 (0.6) |
| Formaldehyde | 30.0 | 21.1 (1.8) | 12.1 (1.0) | 24.3 (2.1) | 12.2 (1.1) | 1.7 (0.2) | 2.0 (0.24) | +15% | 8.9 (2.1) | 12.1 (2.3) | +3.2 (3.1) |
| Hexaldehyde | 100.2 | 7.7 (0.7) | 7.6 (0.7) | 8.5 (0.8) | 8.4 (0.8) | 1.0 (0.1) | 1.0 (0.13) | 0% | 0.1 (1.0) | 0.1 (1.1) | 0 (1.4) |
| Valeraldehyde | 86.1 | 3.3 (0.4) | <1.1 | 2.2 (0.3) | 2.6 (0.3) | >3.0 | 0.9 (0.2) | likely ↓ | >2.2 | −0.4 (0.4) | <−2.6 (0.6) |
| Total aldehydes | n/a | 43.2 (3.7) | 27.7 (2.3) | 50.1 (4.1) | 28.8 (2.4) | 1.6 (0.6) | 1.7 (0.6) | +11% | 15.6 (4.3) | 21.3 (4.8) | +5.7 (6.5) |
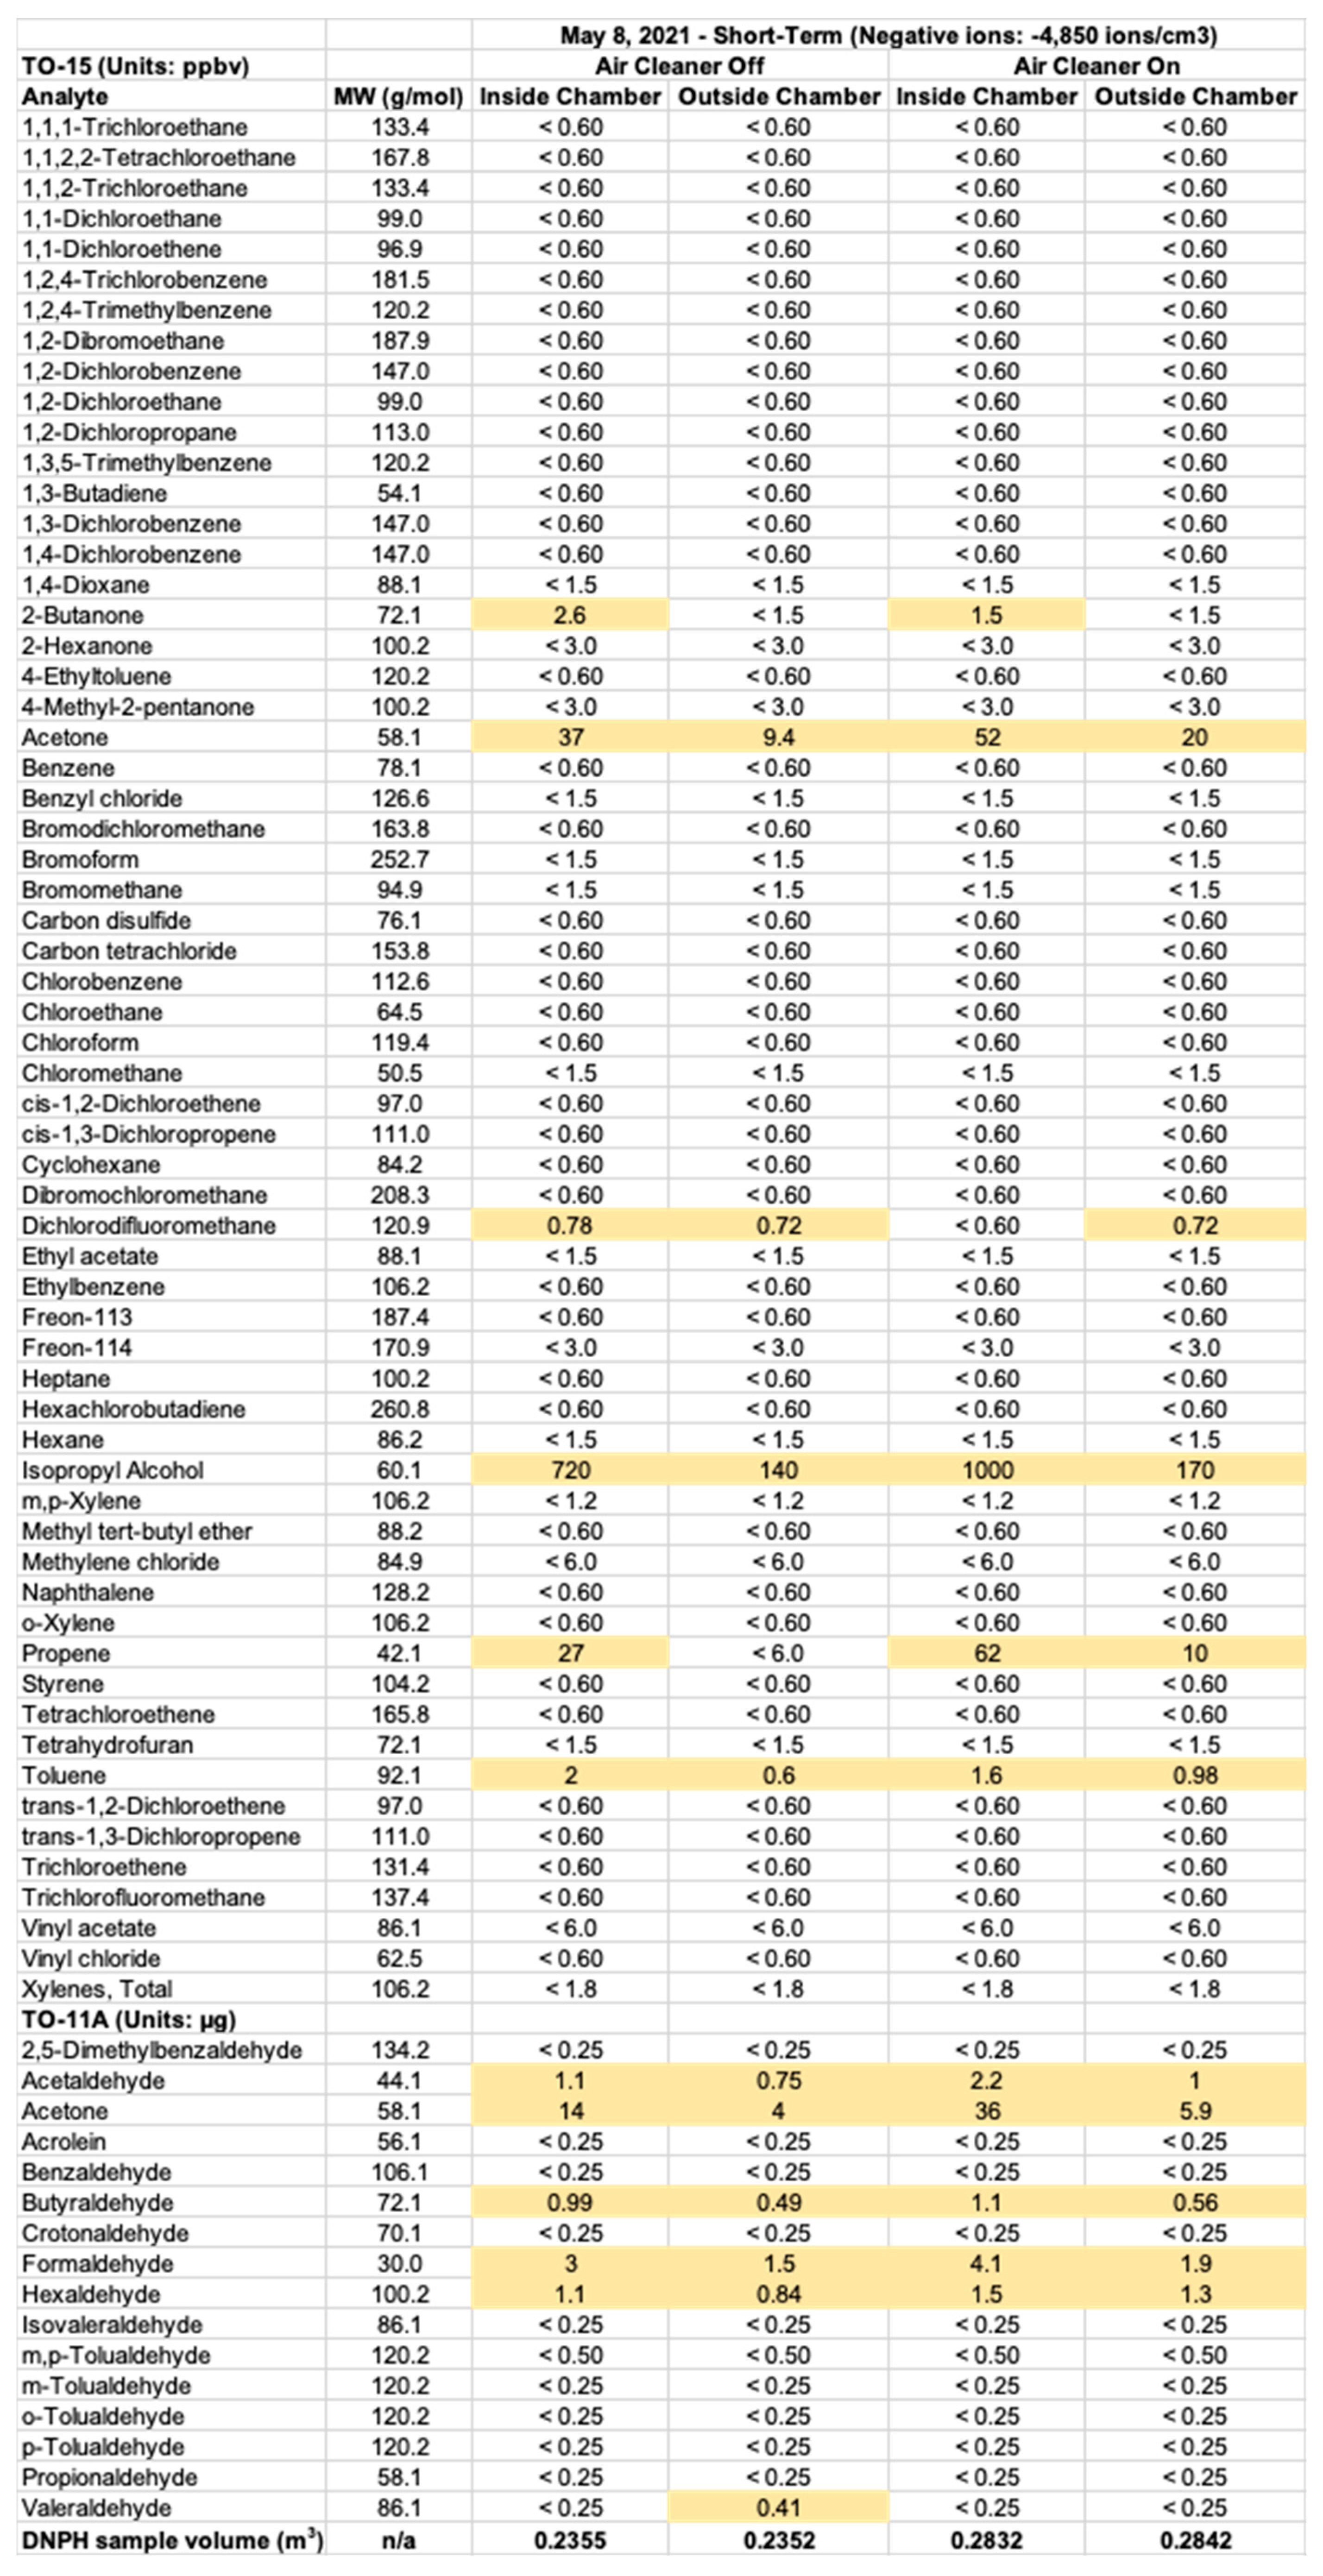
| 8 May 2021-Short-Term (Negative Ions: −4850 ions/cm3) | |||||||||||
|---|---|---|---|---|---|---|---|---|---|---|---|
| Analyte | MW (g/mol) | Concentration (µg/m3) | I/O Concentration Ratio | Concentration Difference (µg/m3) | |||||||
| Air Cleaner Off | Air Cleaner On | Inside–Outside (I–O) | |||||||||
| TO-15 List | Inside Chamber | Outside Chamber | Inside Chamber | Outside Chamber | EAC Off | EAC On | % Change | EAC Off | EAC On | EAC On-Off | |
| 2-Butanone | 72.1 | 7.7 (1.5) | <4.5 | 4.5 (0.9) | <4.5 | >1.7 | >1 | unknown | >3.2 | >0 | unknown |
| Acetone | 58.1 | 88.5 (15.0) | 22.5 (3.8) | 124.4 (21.2) | 47.8 (8.1) | 3.9 (0.9) | 2.6 (0.6) | −34% | 66.1 (16) | 76.6 (23) | +10.5 (28) |
| Dichlorodifluoromethane | 120.9 | 3.9 (0.8) | 3.6 (0.7) | <3.0 | 3.6 (0.7) | 1.1 (0.3) | <0.8 | likely ↓ | 0.3 (1.1) | >−0.6 | >−0.9 |
| Isopropyl Alcohol | 60.1 | 1783 (265) | 346 (52) | 2476 (368) | 421 (63) | 5.2 (1.1) | 5.0 (1.2) | +14% | 1436 (270) | 2055 (374) | +619 (461) |
| Propene | 42.1 | 46.8 (34.5) | <10.4 | 107.5 (79.2) | 17.3 (12.8) | >4.5 | 6.2 (6.5) | unknown | >36.4 | 90.2 (80) | >+44 |
| Toluene | 92.1 | 7.6 (1.5) | 2.3 (0.4) | 6.1 (1.2) | 3.7 (0.7) | 3.3 (0.9) | 1.6 (0.5) | −51% | 5.3 (1.6) | 2.4 (1.4) | −3.0 (2.1) |
| Sum VOCs >RL | n/a | 1937 (319) | 375 (57) | 2718 (471) | 493 (85) | 5.2 (1.2) | 5.5 (1.3) | +7% | 1562 (324) | 2225 (479) | +663 (578) |
| TO-11A List | |||||||||||
| Acetaldehyde | 44.1 | 4.7 (0.3) | 3.2 (0.2) | 7.8 (0.4) | 3.5 (0.2) | 1.5 (0.1) | 2.2 (0.2) | +51% | 1.5 (0.3) | 4.3 (0.5) | +2.8 (0.6) |
| Butyraldehyde | 72.1 | 4.2 (0.4) | 2.1 (0.2) | 3.9 (0.3) | 2.0 (0.2) | 2.0 (0.2) | 2.0 (0.2) | −2% | 2.1 (0.4) | 1.9 (0.4) | −0.2 (0.5) |
| Formaldehyde | 30.0 | 12.7 (1.1) | 6.4 (0.5) | 14.5 (1.2) | 6.7 (0.6) | 2.0 (0.2) | 2.2 (0.3) | +8% | 6.4 (1.2) | 7.8 (1.4) | +1.4 (1.8) |
| Hexaldehyde | 100.2 | 4.7 (0.4) | 3.6 (0.3) | 5.3 (0.5) | 4.6 (0.4) | 1.3 (0.2) | 1.2 (0.2) | −11% | 1.1 (0.5) | 0.7 (0.6) | −0.4 (0.8) |
| Valeraldehyde | 86.1 | <1.1 | 1.7 (0.2) | <1.1 | <1.1 | <0.7 | unknown | unknown | >−0.6 | unknown | unknown |
| Total aldehydes | n/a | 26.3 (2.1) | 17.0 (1.4) | 31.4 (2.5) | 16.7 (1.4) | 1.5 (0.8) | 1.9 (0.8) | +21% | 9.3 (2.6) | 14.7 (2.8) | +5.4 (3.8) |
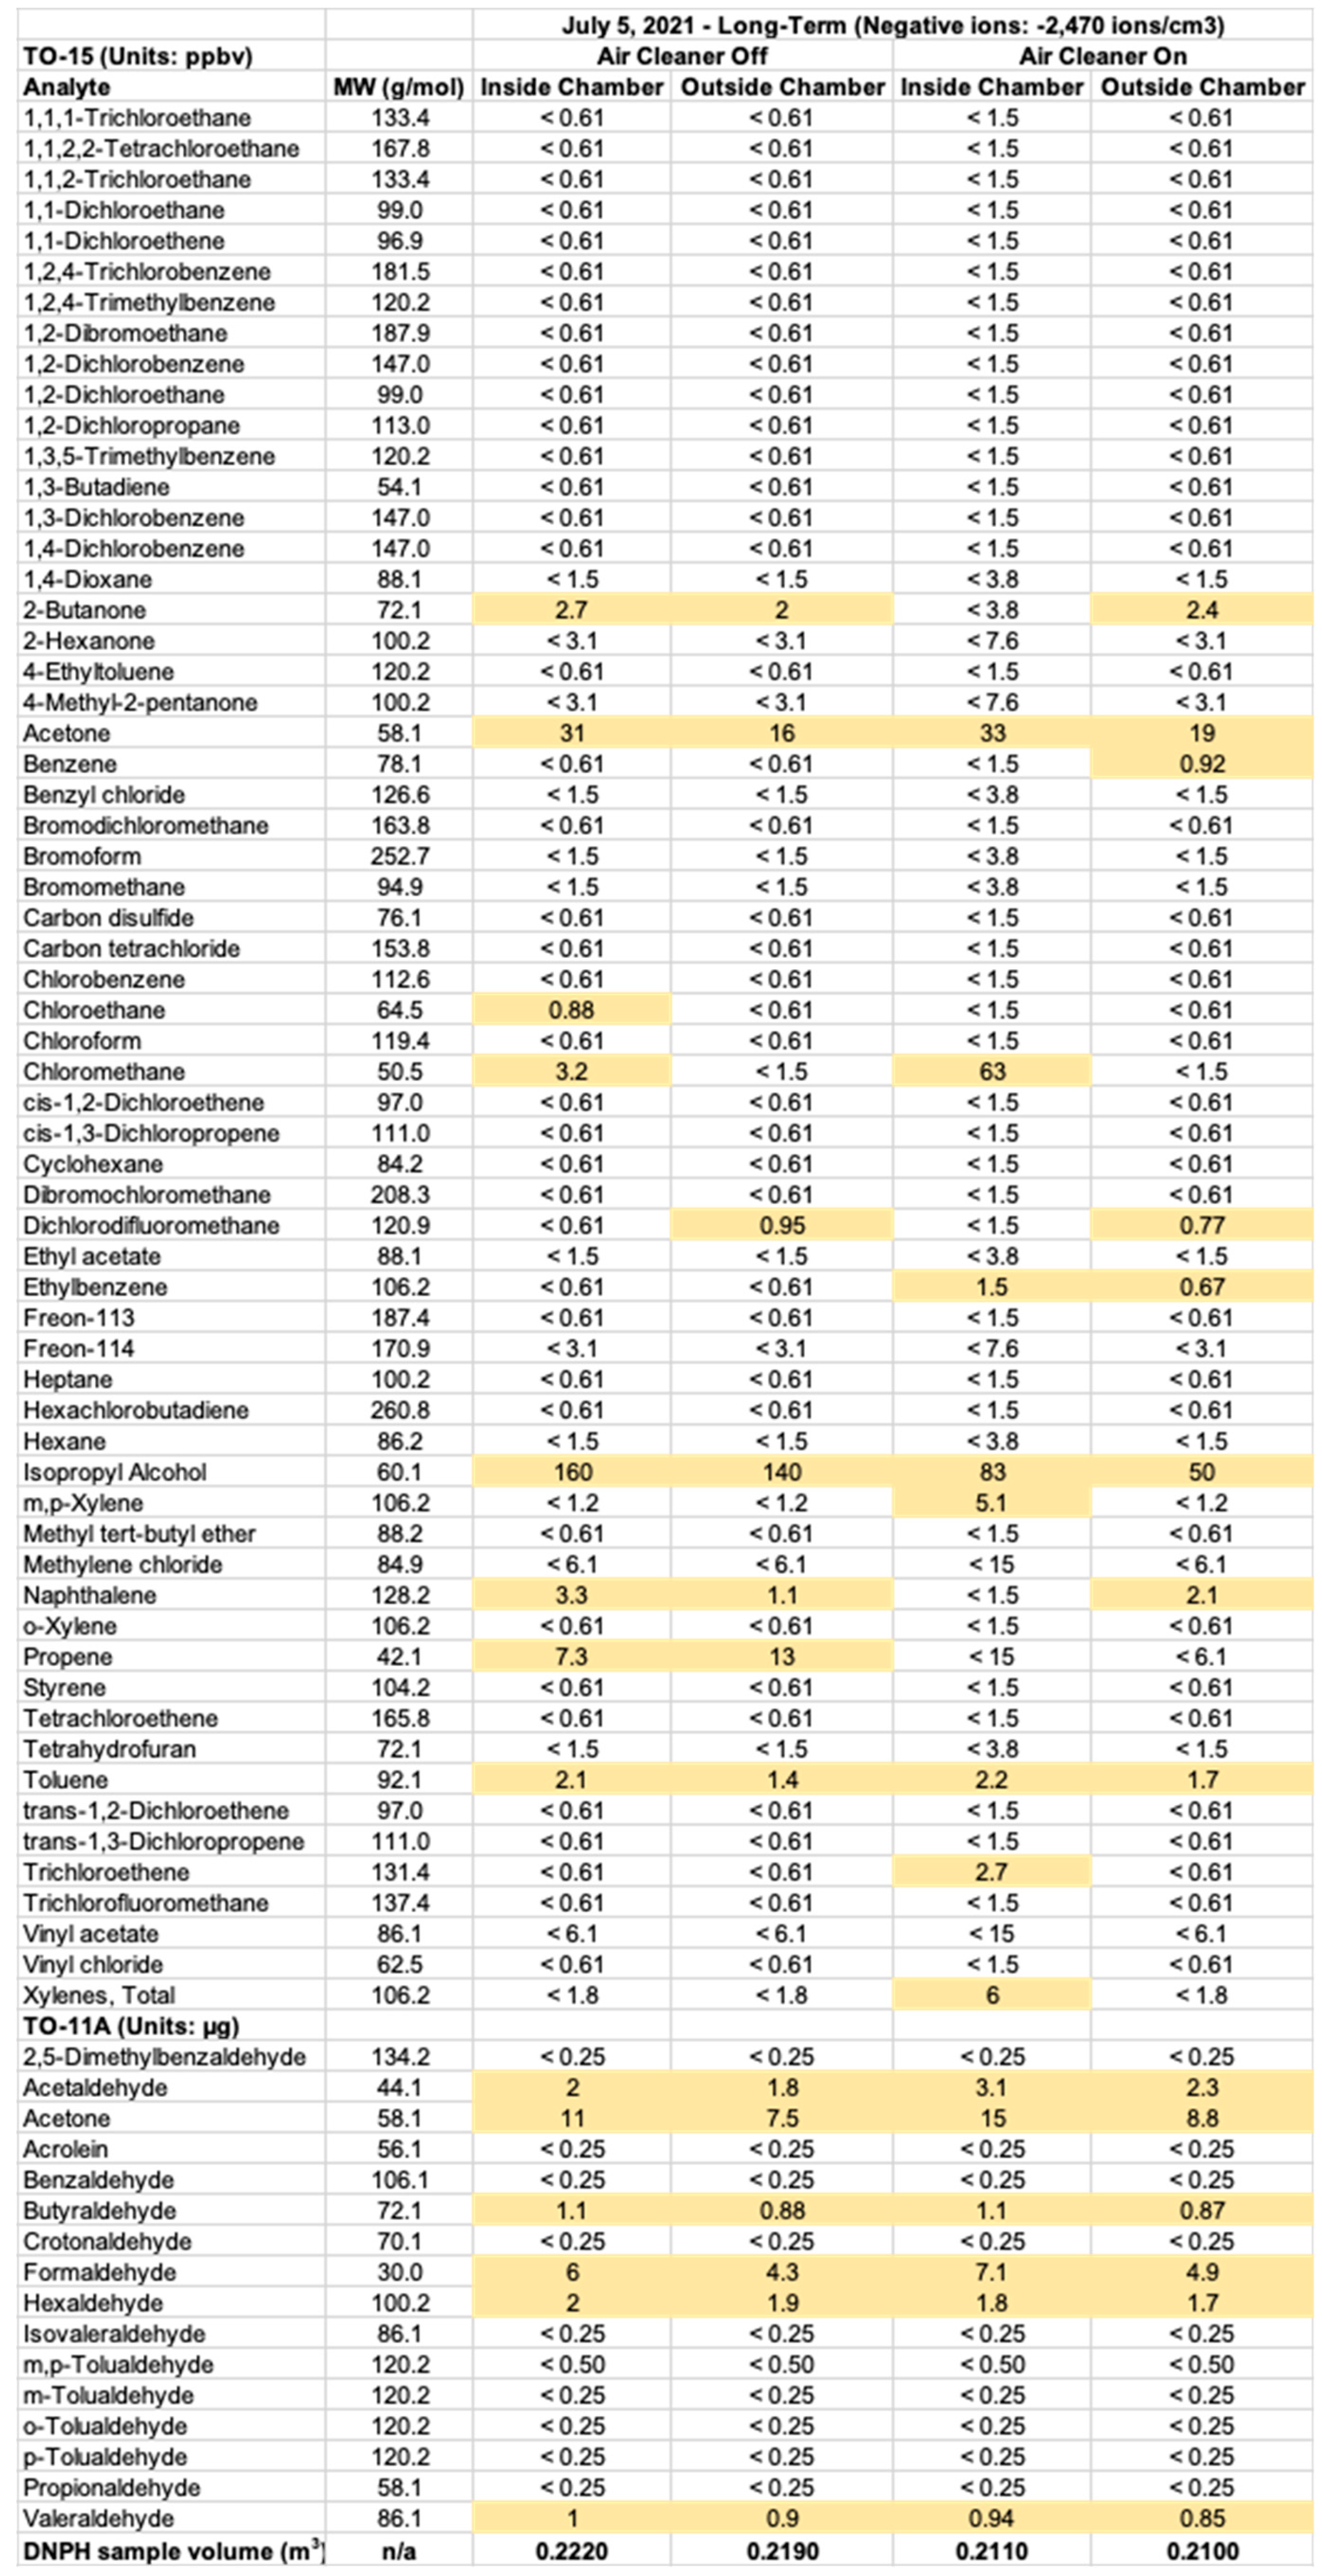
| 5 July 2021-Long-Term (Negative Ions: −2470 ions/cm3) | |||||||||||
|---|---|---|---|---|---|---|---|---|---|---|---|
| Analyte | MW (g/mol) | Concentration (µg/m3) | I/O Concentration Ratio | Concentration Difference (µg/m3) | |||||||
| Air Cleaner Off | Air Cleaner On | Inside–Outside (I–O) | |||||||||
| TO-15 List | Inside Chamber | Outside Chamber | Inside Chamber | Outside Chamber | EAC Off | EAC On | % Change | EAC Off | EAC On | EAC On-Off | |
| 2-Butanone | 72.1 | 7.8 (1.5) | 5.8 (1.1) | <11.0 | 7.0 (1.4) | 1.3 (0.4) | <1.6 | unknown | 2.0 (1.9) | unknown | unknown |
| Acetone | 58.1 | 72.3 (12.3) | 37.5 (6.4) | 76.9 (13.1) | 44.6 (7.6) | 1.9 (0.5) | 1.7 (0.4) | −10% | 34.7 (13.8) | 32.3 (15.1) | −2.4 (21) |
| Benzene | 78.1 | <1.9 | <1.9 | <4.7 | 2.9 (0.6) | unknown | <1.6 | unknown | unknown | unknown | unknown |
| Chloroethane | 64.5 | 2.3 (0.5) | <1.6 | <3.9 | <1.6 | >1.4 | unknown | unknown | >0.7 | unknown | unknown |
| Chloromethane | 50.5 | 6.5 (1.6) | <3.1 | 127.7 (30.5) | <3.1 | >2.1 | >41 | likely ↑ | >3.4 | >124.6 | >+121 |
| Dichlorodifluoromethane | 120.9 | <3.0 | 4.6 (1.0) | <7.3 | 3.8 (0.8) | <0.7 | <1.9 | unknown | >−1.6 | unknown | unknown |
| Ethylbenzene | 106.2 | <2.6 | <2.6 | 6.4 (1.1) | 2.9 (0.5) | unknown | 2.2 | unknown | unknown | 3.5 (1.2) | unknown |
| Isopropyl Alcohol | 60.1 | 386 (57) | 340 (51) | 200 (30) | 121 (18) | 1.1 (0.2) | 1.7 (0.3) | +45% | 45.9 (77) | 78.8 (35) | +33 (84) |
| m,p-Xylene | 106.2 | <5.1 | <5.1 | 21.7 (3.9) | <5.1 | unknown | >4.2 | likely ↑ | unknown | >16.6 | unknown |
| Naphthalene | 128.2 | 17.0 (9.1) | 5.7 (1.5) | < 7.7 | 10.9 (2.9) | 3.0 (1.1) | <0.7 | likely ↓ | 11.3 (4.7) | >−3.2 | >−14.5 |
| Propene | 42.1 | 12.3 (9.1) | 22.1 (16.3) | <25.3 | <10.4 | 0.6 (0.6) | unknown | unknown | −9.8 (18.7) | unknown | unknown |
| Toluene | 92.1 | 7.8 (1.5) | 5.2 (1.0) | 8.1 (1.6) | 6.3 (1.2) | 1.5 (0.4) | 1.3 (0.4) | −14% | 2.6 (1.8) | 1.8 (2.0) | −0.7 (2.7) |
| Trichloroethene | 131.4 | <3.2 | <3.2 | 14.2 (2.6) | <3.2 | unknown | >4.4 | likely ↑ | unknown | >11.0 | Unknown |
| Sum VOCs > RL | n/a | 512 (88) | 421 (78) | 455 (83) | 200 (33) | 1.2 (0.3) | 2.3 (0.6) | +87% | 91 (118) | 256 (89) | +165 (148) |
| TO−11A List | |||||||||||
| Acetaldehyde | 44.1 | 9.0 (0.5) | 8.2 (0.5) | 14.7 (0.8) | 11.0 (0.6) | 1.1 (0.1) | 1.3 (0.1) | +22% | 0.8 (0.7) | 3.7 (1.1) | +2.9 (1.3) |
| Butyraldehyde | 72.1 | 5.0 (0.4) | 4.0 (0.3) | 5.2 (0.4) | 4.1 (0.3) | 1.2 (0.2) | 1.3 (0.2) | +2% | 0.9 (0.5) | 1.1 (0.6) | +0.2 (0.8) |
| Formaldehyde | 30.0 | 27.0 (2.3) | 19.6 (1.7) | 33.6 (2.9) | 23.3 (2.0) | 1.4 (0.2) | 1.4 (0.2) | +5% | 7.4 (2.9) | 10.3 (3.5) | +2.9 (4.5) |
| Hexaldehyde | 100.2 | 9.0 (0.8) | 8.7 (0.8) | 8.5 (0.8) | 8.1 (0.7) | 1.0 (0.1) | 1.1 (0.1) | +1% | 0.3 (1.1) | 0.4 (1.0) | +0.1 (1.5) |
| Valeraldehyde | 86.1 | 4.5 (0.6) | 4.1 (0.5) | 4.5 (0.6) | 4.0 (0.5) | 1.1 (0.2) | 1.1 (0.2) | 0% | 0.4 (0.8) | 0.4 (0.8) | 0.0 (1.1) |
| Total aldehydes | n/a | 54.5 (4.6) | 44.7 (3.8) | 66.5 (5.5) | 50.6 (4.2) | 1.2 (0.7) | 1.3 (0.9) | +8% | 9.8 (6.0) | 16.0 (6.9) | +6.1 (9.2) |

Appendix A.2. VOC Measurements in the Controlled Laboratory Study


Appendix A.3. Ozone Measurements in the Controlled Laboratory Study

References
- Tang, J.W.; Marr, L.C.; Li, Y.; Dancer, S.J. COVID-19 has redefined airborne transmission. BMJ 2021, 373, n913. [Google Scholar] [CrossRef] [PubMed]
- Blocken, B.; van Druenen, T.; Ricci, A.; Kang, L.; van Hooff, T.; Qin, P.; Xia, L.; Ruiz, C.A.; Arts, J.H.; Diepens, J.F.L.; et al. Ventilation and air cleaning to limit aerosol particle concentrations in a gym during the COVID-19 pandemic. Build. Environ. 2021, 193, 107659. [Google Scholar] [CrossRef] [PubMed]
- Morawska, L.; Allen, J.; Bahnfleth, W.; Bluyssen, P.M.; Boerstra, A.; Buonanno, G.; Cao, J.; Dancer, S.J.; Floto, A.; Franchimon, F.; et al. A paradigm shift to combat indoor respiratory infection. Science 2021, 372, 689–691. [Google Scholar] [CrossRef] [PubMed]
- Allen, J.G.; Ibrahim, A.M. Indoor Air Changes and Potential Implications for SARS-CoV-2 Transmission. JAMA 2021, 325, 2112. [Google Scholar] [CrossRef]
- Gettings, J.; Czarnik, M.; Morris, E.; Haller, E.; Thompson-Paul, A.M.; Rasberry, C.; Lanzieri, T.M.; Smith-Grant, J.; Aholou, T.M.; Thomas, E.; et al. Mask Use and Ventilation Improvements to Reduce COVID-19 Incidence in Elementary Schools—Georgia, November 16–December 11, 2020. MMWR Morb. Mortal. Wkly. Rep. 2021, 70, 779–784. [Google Scholar] [CrossRef]
- Lindsley, W.G.; Derk, R.C.; Coyle, J.P.; Martin, S.B.; Mead, K.R.; Blachere, F.M.; Beezhold, D.H.; Brooks, J.T.; Boots, T.; Noti, J.D. Efficacy of Portable Air Cleaners and Masking for Reducing Indoor Exposure to Simulated Exhaled SARS-CoV-2 Aerosols—United States, 2021. MMWR Morb. Mortal. Wkly. Rep. 2021, 70, 972–976. [Google Scholar] [CrossRef]
- Coleman, K.K.; Tay, D.J.W.; Tan, K.S.; Ong, S.W.X.; Than, T.S.; Koh, M.H.; Chin, Y.Q.; Nasir, H.; Mak, T.M.; Chu, J.J.H.; et al. Viral Load of Severe Acute Respiratory Syndrome Coronavirus 2 (SARS-CoV-2) in Respiratory Aerosols Emitted by Patients with Coronavirus Disease 2019 (COVID-19) While Breathing, Talking, and Singing. Clin. Infect. Dis. 2021, ciab691. [Google Scholar] [CrossRef]
- Corsi, R.; Miller, S.L.; VanRy, M.G.; Marr, L.C.; Cadet, L.R.; Pollock, N.R.; Michaels, D.; Jones, E.R.; Levinson, M.; Li, Y.; et al. Designing Infectious Disease Resilience into School Buildings through Improvements to Ventilation and Air Cleaning. In The Lancet COVID-19 Commission: Task Force on Safe Work, Safe School, and Safe Travel; United Nations Sustainable Development Solutions Network: New York, NY, USA, 2021. [Google Scholar]
- Stauffer, D.A.; Autenrieth, D.A.; Hart, J.F.; Capoccia, S. Control of wildfire-sourced PM2.5 in an office setting using a commercially available portable air cleaner. J. Occup. Environ. Hyg. 2020, 17, 109–120. [Google Scholar] [CrossRef]
- Xiang, J.; Huang, C.-H.; Shirai, J.; Liu, Y.; Carmona, N.; Zuidema, C.; Austin, E.; Gould, T.; Larson, T.; Seto, E. Field measurements of PM2.5 infiltration factor and portable air cleaner effectiveness during wildfire episodes in US residences. Sci. Total Environ. 2021, 773, 145642. [Google Scholar] [CrossRef]
- Fisk, W.J.; Chan, W.R. Health benefits and costs of filtration interventions that reduce indoor exposure to PM2.5 during wildfires. Indoor Air 2017, 27, 191–204. [Google Scholar] [CrossRef] [Green Version]
- Wargocki, P.; Kuehn, T.B.B.; Muller, C.; Conrad, E. ASHRAE Position Document on Filtration and Air Cleaning 2018; ASHRAE: Atlanta, GA, USA, 2018. [Google Scholar]
- Zhang, Y.; Mo, J.; Li, Y.; Sundell, J.; Wargocki, P.; Zhang, J.; Little, J.C.; Corsi, R.; Deng, Q.; Leung, M.H.; et al. Can commonly-used fan-driven air cleaning technologies improve indoor air quality? A literature review. Atmos. Environ. 2011, 45, 4329–4343. [Google Scholar] [CrossRef] [PubMed]
- Harriman, L.; Stephens, B.; Brennan, T. New Guidance for Residential Air Cleaners. ASHRAE J. 2019, 61, 14–23. [Google Scholar]
- Elejalde-Ruize, A. What Will It Take to Make Diners Feel Safe Indoors? Nearly 60% Feel Uneasy Eating inside, so Restaurants Try Sterilizing UV Wands, Tabletop Air Purifiers as Winter Looms. Chicago Tribune, 20 September 2020. [Google Scholar]
- Environmental and Modelling Group (EMG) Potential Application of Air Cleaning Devices and Personal Decontamination to Manage Transmission of COVID-19; Scientific Advisory Group for Emergencies (SAGE): London, UK, 2020.
- Johnson Controls. 2020 Johnson Controls Energy Efficiency Indicator Study: COVID-19 Pulse Survey; Johnson Controls: Milwaukee, WI, USA, 2020. [Google Scholar]
- Mandavilli, A. How to Keep the Coronavirus at Bay Indoors. The New York Times, 19 November 2020. [Google Scholar]
- Ori, R. Worries about COVID-19 Spreading through the Vents Send Chicago Building Owners in Search of Cleaner Air. ‘You Can’t Put a Force Field around Your Property’. Chicago Tribune, 27 July 2020. [Google Scholar]
- US EPA. Can Air Cleaning Devices That Use Bipolar Ionization, Including Portable Air Cleaners and in-Duct Air Cleaners Used in HVAC Systems, Protect Me from COVID-19? Coronavirus FAQ 2021; EPA: Washington, DC, USA, 2021.
- ASHRAE. Filtration/Disinfection. ASHRAE COVID-19 Resources 2020; ASHRAE: Atlanta, GA, USA, 2020. [Google Scholar]
- Collins, D.B.; Farmer, D.K. Unintended Consequences of Air Cleaning Chemistry. Environ. Sci. Technol. 2021, 55, 12172–12179. [Google Scholar] [CrossRef] [PubMed]
- Berry, D.; Mainelis, G.; Fennell, D. Effect of an Ionic Air Cleaner on Indoor/Outdoor Particle Ratios in a Residential Environment. Aerosol Sci. Technol. 2007, 41, 315–328. [Google Scholar] [CrossRef]
- Kim, H.-J.; Han, B.; Kim, Y.-J.; Oda, T.; Won, H. Submicrometer particle removal indoors by a novel electrostatic precipitator with high clean air delivery rate, low ozone emissions, and carbon fiber ionizer. Indoor Air 2013, 23, 369–378. [Google Scholar] [CrossRef]
- Kim, K.-H.; Szulejko, J.E.; Kumar, P.; Kwon, E.E.; Adelodun, A.A.; Reddy, P.A.K. Air ionization as a control technology for off-gas emissions of volatile organic compounds. Environ. Pollut. 2017, 225, 729–743. [Google Scholar] [CrossRef]
- Pushpawela, B.; Jayaratne, R.; Nguy, A.; Morawska, L. Efficiency of ionizers in removing airborne particles in indoor environments. J. Electrost. 2017, 90, 79–84. [Google Scholar] [CrossRef]
- Wu, Y.-Y.; Chen, Y.-C.; Yu, K.-P.; Chen, Y.-P.; Shih, H.-C. Deposition Removal of Monodisperse and Polydisperse Submicron Particles by a Negative Air Ionizer. Aerosol Air Qual. Res. 2015, 15, 994–1007. [Google Scholar] [CrossRef] [Green Version]
- Liu, W.; Huang, J.; Lin, Y.; Cai, C.; Zhao, Y.; Teng, Y.; Mo, J.; Xue, L.; Liu, L.; Xu, W.; et al. Negative ions offset cardiorespiratory benefits of PM2.5 reduction from residential use of negative ion air purifiers. Indoor Air 2020, 31, 220–228. [Google Scholar] [CrossRef]
- Zeng, Y.; Manwatkar, P.; Laguerre, A.; Beke, M.; Kang, I.; Ali, A.S.; Farmer, D.K.; Gall, E.T.; Heidarinejad, M.; Stephens, B. Evaluating a commercially available in-duct bipolar ionization device for pollutant removal and potential byproduct formation. Build. Environ. 2021, 195, 107750. [Google Scholar] [CrossRef]
- Lee, C.-S.; Shayegan, Z.; Haghighat, F.; Zhong, L.; Bahloul, A.; Huard, M. Experimental evaluation of in-duct electronic air cleaning technologies for the removal of ketones. Build. Environ. 2021, 196, 107782. [Google Scholar] [CrossRef]
- Joo, T.; Rivera-Rios, J.C.; Alvarado-Velez, D.; Westgate, S.; Ng, N.L. Formation of Oxidized Gases and Secondary Organic Aerosol from a Commercial Oxidant-Generating Electronic Air Cleaner. Environ. Sci. Technol. Lett. 2021, 8, 691–698. [Google Scholar] [CrossRef]
- Licht, S.; Hehir, A.; Trent, S.; Dunlap, D.; Borumand, K.; Wilson, M.; Smith, K. Use of Bipolar Ionization for Disinfection within Airplanes; Boeing: Chicago, IL, USA, 2021. [Google Scholar]
- Trane. A Taxonomy of Air-Cleaning Technologies Featuring Bipolar Ionization; Trane Technologies: Swords, Ireland, 2021. [Google Scholar]
- US EPA. Results for Aerosol Treatment Technology Evaluation with Cold Plasma Bipolar Ionization Device; EPA: Washington, DC, USA, 2021.
- Ye, Q.; Krechmer, J.E.; Shutter, J.D.; Barber, V.P.; Li, Y.; Helstrom, E.; Franco, L.J.; Cox, J.L.; Hrdina, A.I.H.; Goss, M.B.; et al. Real-Time Laboratory Measurements of VOC Emissions, Removal Rates, and Byproduct Formation from Consumer-Grade Oxidation-Based Air Cleaners. Environ. Sci. Technol. Lett. 2021, 8, 1020–1025. [Google Scholar] [CrossRef]
- Zeng, Y.; Heidarinejad, M.; Stephens, B. Evaluation of an in-duct bipolar ionization device on particulate matter and gas-phase constituents in a large test chamber. Build. Environ. 2022, 213, 108858. [Google Scholar] [CrossRef]
- Stephens, B.; Siegel, J.A.; Novoselac, A. Operational characteristics of residential and light-commercial air-conditioning systems in a hot and humid climate zone. Build. Environ. 2011, 46, 1972–1983. [Google Scholar] [CrossRef]
- Persily, A.; Gorfain, J. Analysis of Ventilation Data from the U.S. Environmental Protection Agency Building Assessment Survey and Evaluation (BASE) Study; National Institute of Standards and Technology (NIST): Gaithersburg, MD, USA, 2004.
- Offermann, F.J.; Sextro, R.G.; Fisk, W.J.; Grimsrud, D.T.; Nazaroff, W.W.; Nero, A.V.; Revzan, K.L.; Yater, J. Control of respirable particles in indoor air with portable air cleaners. Atmos. Environ. 1985, 19, 1761–1771. [Google Scholar] [CrossRef] [Green Version]
- MacIntosh, D.L.; Myatt, T.A.; Ludwig, J.F.; Baker, B.J.; Suh, H.H.; Spengler, J.D. Whole House Particle Removal and Clean Air Delivery Rates for In-Duct and Portable Ventilation Systems. J. Air Waste Manag. Assoc. 2008, 58, 1474–1482. [Google Scholar] [CrossRef]
- Stephens, B.; Siegel, J.A. Comparison of Test Methods for Determining the Particle Removal Efficiency of Filters in Residential and Light-Commercial Central HVAC Systems. Aerosol Sci. Technol. 2012, 46, 504–513. [Google Scholar] [CrossRef]
- Stephens, B.; Siegel, J.A. Ultrafine particle removal by residential heating, ventilating, and air-conditioning filters. Indoor Air 2013, 23, 488–497. [Google Scholar] [CrossRef]
- Dräger. Dräger-Tubes & CMS Handbook: Soil, Water, and Air Investigations as Well as Technical Gas Analysis; Dräger: Lübeck, Germany, 2011. [Google Scholar]
- Hansel, A.; Jordan, A.; Holzinger, R.; Prazeller, P.; Vogel, W.; Lindinger, W. Proton transfer reaction mass spectrometry: On-line trace gas analysis at the ppb level. Int. J. Mass Spectrom. Ion Process. 1995, 149–150, 609–619. [Google Scholar] [CrossRef]
- Lindinger, W.; Hansel, A.; Jordan, A. Proton-Transfer-Reaction Mass Spectrometry (PTR–MS): On-Line Monitoring of Volatile Organic Compounds at Pptv Levels. Chem. Soc. Rev. 1998, 27, 347–375. [Google Scholar] [CrossRef]
- De Gouw, J.; Goldan, P.D.; Warneke, C.; Kuster, W.C.; Roberts, J.M.; Marchewka, M.; Bertman, S.B.; Pszenny, A.A.P.; Keene, W.C. Validation of proton transfer reaction-mass spectrometry (PTR-MS) measurements of gas-phase organic compounds in the atmosphere during the New England Air Quality Study (NEAQS) in 2002. J. Geophys. Res. Earth Surf. 2003, 108. [Google Scholar] [CrossRef]
- Shaughnessy, R.J.; Sextro, R.G. What Is an Effective Portable Air Cleaning Device? A Review. J. Occup. Environ. Hyg. 2006, 3, 169–181. [Google Scholar] [CrossRef] [PubMed]
- Minneapolis Duct Blaster. The Energy Conservatory Minneapolis Duct Blaster Operation Manual; Minneapolis Duct Blaster: Minneapolis, MN, USA, 2007. [Google Scholar]
- Patel, S.; Sankhyan, S.; Boedicker, E.K.; Decarlo, P.F.; Farmer, D.K.; Goldstein, A.H.; Katz, E.F.; Nazaroff, W.W.; Tian, Y.; Vanhanen, J.; et al. Indoor Particulate Matter during HOMEChem: Concentrations, Size Distributions, and Exposures. Environ. Sci. Technol. 2020, 54, 7107–7116. [Google Scholar] [CrossRef] [PubMed]
- Hakola, H.; Arey, J.; Aschmann, S.M.; Atkinson, R. Product formation from the gas-phase reactions of OH radicals and O3 with a series of monoterpenes. J. Atmos. Chem. 1994, 18, 75–102. [Google Scholar] [CrossRef]
- Clausen, P.A.; Wilkins, C.K.; Wolkoff, P.; Nielsen, G.D. Chemical and biological evaluation of a reaction mixture of R-(+)-limonene/ozone: Formation of strong airway irritants. Environ. Int. 2001, 26, 511–522. [Google Scholar] [CrossRef]
- Forester, C.D.; Wells, J.R. Yields of Carbonyl Products from Gas-Phase Reactions of Fragrance Compounds with OH Radical and Ozone. Environ. Sci. Technol. 2009, 43, 3561–3568. [Google Scholar] [CrossRef]
- Weschler, C.J.; Shields, H.C. The Influence of Ventilation on Reactions among Indoor Pollutants: Modeling and Experimental Observations. Indoor Air 2000, 10, 92–100. [Google Scholar] [CrossRef]


| Test Location | Airflow Rate (m3/h) | Duct Dimensions (cm) | Face Velocity (m/s) |
|---|---|---|---|
| Chamber (IIT) | 343 | 61 × 48 × 48 | 2.75 |
| Laboratory (PSU) | 2210 | 170 × 61 × 61 | 1.6 * |
| Test Date | Test Condition | Operation Duration | Constituents Measured | Temp. (°C) a | RH (%) a | ACH | Neg. Ions a (ions/cm3) | |||
|---|---|---|---|---|---|---|---|---|---|---|
| In | Out | In | Out | h−1 | EAC off | EAC on | ||||
| Natural Condition Tests: VOC/aldehydes during short-term and long-term operation | ||||||||||
| 4 May 2021 | Natural | Short-term | VOC/aldehydes | 27.0 (0.2) | 27.1 (0.1) | 31 (3) | 32 (3) | 2.07 | 1150 (940) | 1370 (1720) |
| 8 May 2021 | Natural | Short-term | VOC/aldehydes | 22.7 (0.3) | 22.9 (0.6) | 24 (2) | 25 (3) | 2.00 | 1380 (1040) | 4850 (2920) |
| 5 July 2021 | Natural | Long-term | VOC/aldehydes | 30.5 (0.7) | 28.5 (0.6) | 39 (1) | 46 (1) | 1.87 | 950 (150) | 2470 (2130) |
| Natural Condition Tests: PM and O3 during short-term and long-term operation | ||||||||||
| 2 July 2021 | Natural | Short-term | PM and O3 | 29.1 (0.6) | 27.8 (0.6) | 36 (2) | 41 (2) | 1.92 | 790 (510) | 4220 (1680) |
| 15 July 2021 | Natural | Long-term | PM and O3 | 28.4 (0.3) | 28.2 (0.6) | 48 (2) | 51 (3) | n/a | 770 (130) | 930 (240) |
| Perturbation Tests: PM injection and decay following long-term operation | ||||||||||
| 7 July 2021 | Perturbation | Short-term | PM | 29.5 (0.3) | 29.2 (0.5) | 41 (1) | 44 (3) | 1.93 | 610 (110) | 1200 (330) |
| 12 July 2021 | Perturbation | Long-term | PM | 27.7 (0.4) | 27.6 (0.6) | 51 (1) | 54 (2) | 1.94 | 800 (190) | 580 (260) |
| Date | Duration | Air Cleaner Off | Air Cleaner On | ||||
|---|---|---|---|---|---|---|---|
| Inside Chamber (ppb) | Outside Chamber (ppb) | Mean I/O Ratio | Inside Chamber (ppb) | Outside Chamber (ppb) | Mean I/O Ratio | ||
| 4 May 2021 | Short-term | 3.8 (0.4) | 8.9 (0.4) | 0.43 (0.05) | 4.0 (0.6) | 8.1 (1.4) | 0.50 (0.11) |
| 8 May 2021 | Short-term | 7.9 (1.8) | 13.7 (1.8) | 0.58 (0.15) | 7.8 (1.6) | 13.5 (1.8) | 0.57 (0.14) |
| 5 July 2021 | Long-term | 1.6 (0.4) | 4.0 (0.4) | 0.40 (0.09) | 2.2 (0.6) | 5.1 (1.5) | 0.43 (0.17) |
| Air Cleaner On | Air Cleaner Off | CADR | η | ||||||
|---|---|---|---|---|---|---|---|---|---|
| Experiment | λ + k a (h−1) | R2 | λ (h−1) b | λ + k a (h−1) | R2 | λ (h−1) a | m3/h a | (-) a | |
| Short-term (7 July) | Total SMPS | 2.55 (0.02) | 0.99 | 1.93 (0.006) R2 = 0.99 | 2.52 (0.01) | 0.99 | 1.93 (0.006) R2 = 0.99 | 1.1 (0.8) | 0.3% (3.1%) |
| Total OPS | 2.50 (0.00) | 0.99 | 2.42 (0.02) | 0.99 | 2.6 (0.7) | 0.8% (3.1%) | |||
| PM2.5 | 2.38 (0.01) | 0.99 | 2.35 (0.02) | 0.99 | 1.1 (0.9) | 0.3% (3.2%) | |||
| Long-term (12 July) | Total SMPS | 2.45 (0.02) | 0.99 | 1.94 (0.005) R2 = 0.99 | 2.61 (0.01) | 0.99 | 1.94 (0.005) R2 = 0.99 | −4.6 (0.8) | −1.3% (3.1%) |
| Total OPS | 2.41 (0.01) | 0.99 | 2.53 (0.01) | 0.99 | −4.6 (0.4) | −1.3% (3.0%) | |||
| PM2.5 | 2.33 (0.01) | 0.99 | 2.55 (0.02) | 0.99 | −8.1 (0.7) | −2.4% (3.1%) | |||
| Air Cleaner On | Air Cleaner Off | CADR | η c | ||||||
|---|---|---|---|---|---|---|---|---|---|
| Experiment and Constituent | λ + k (h−1) | λ (h−1) a | Neg. Ions b (Ions/cm3) | λ + k (h−1) | λ (h−1) a | Neg. Ions b (Ions/cm3) | (m3/h) | (%) | |
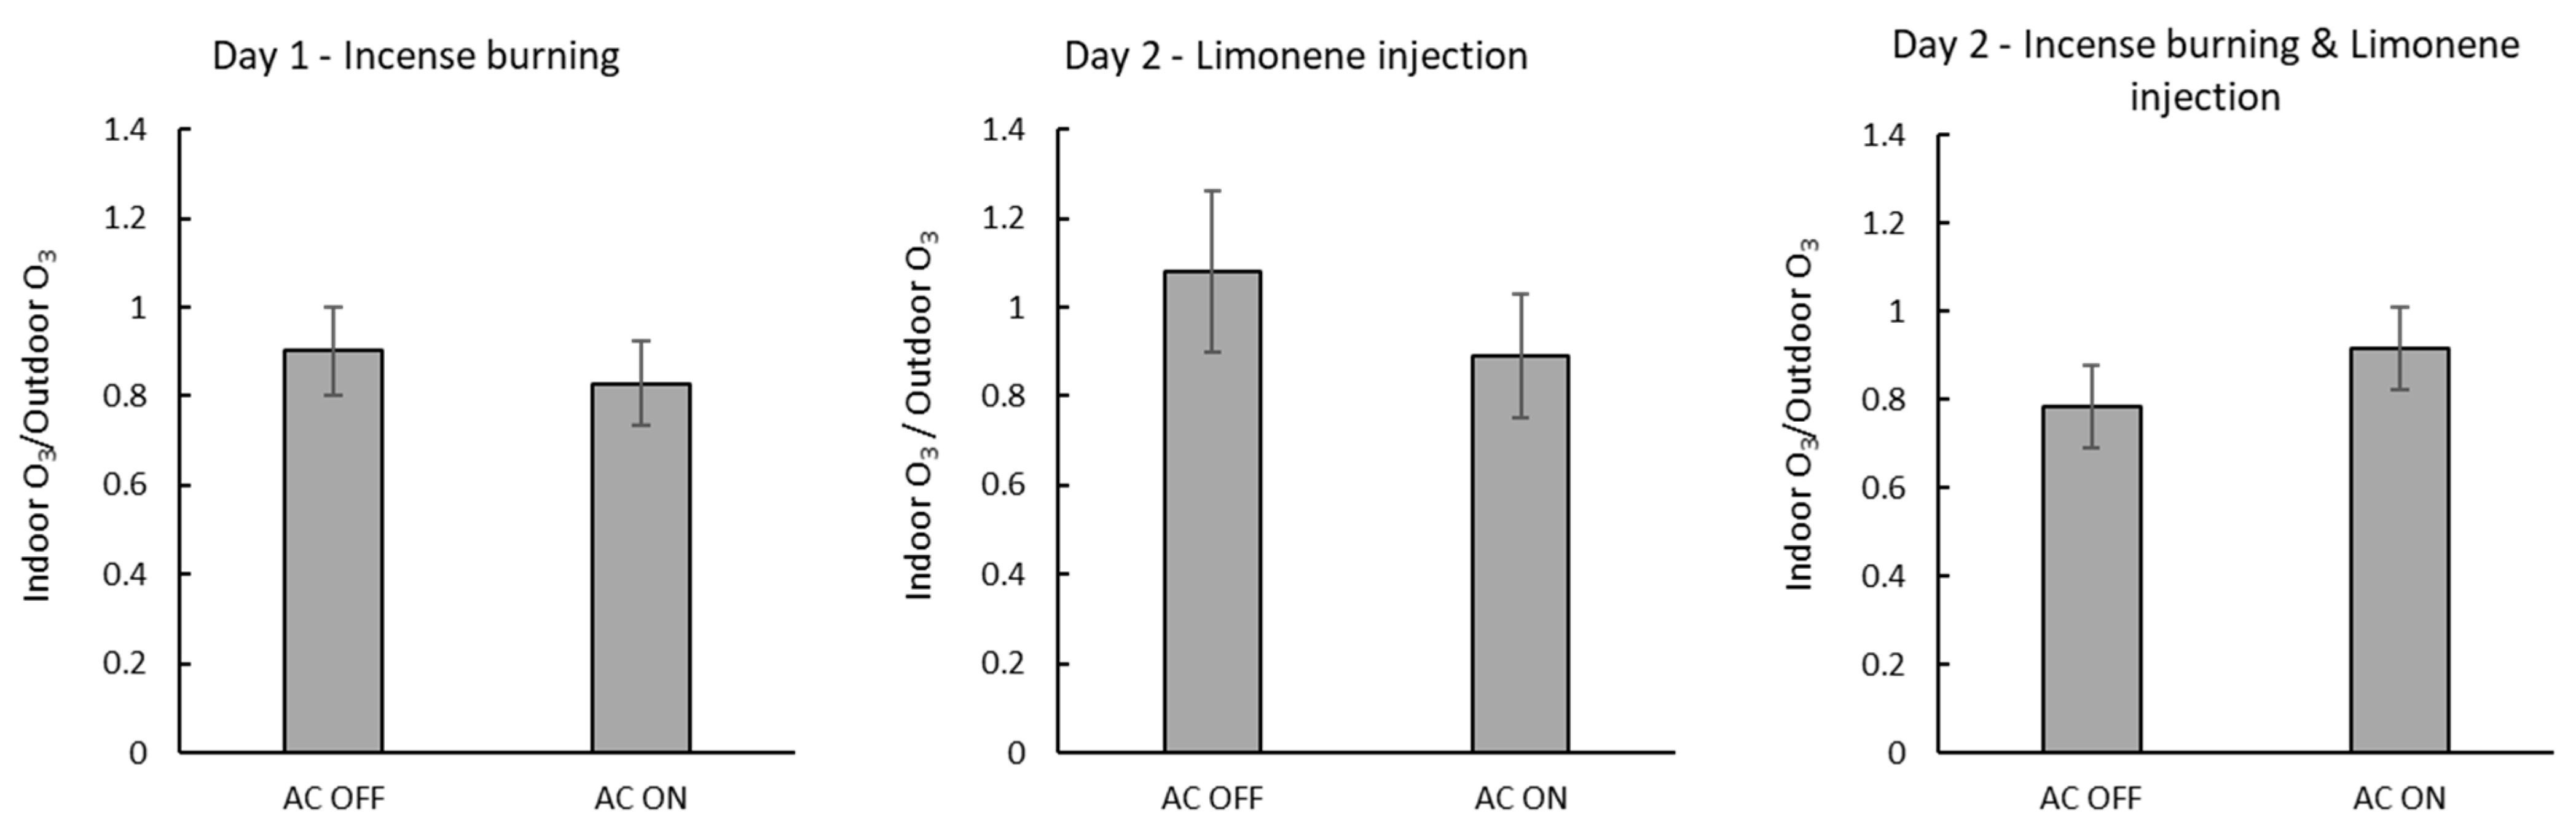
| Day 1: Incense burning | PN0.01–0.03 | 5.67 (0.05) | 6.84 | 16,604 (7298) | 5.72 (0.05) | 6.42 | 486 (114) | −123 (89) | −5.6 (4.0) |
| PN0.03–10 | 7.10 (0.06) | 7.26 (0.08) | −151 (91) | −6.8 (4.1) | |||||
| PN2.5 | 7.10 (0.06) | 7.26 (0.08) | −151 (91) | −6.8 (4.1) | |||||
| Day 2: Limonene injection only | Limonene | 6.23 (0.01) | 6.57 d | 13,494 (3406) | 6.22 (0.01) | 6.46 | 1038 (109) | −29 (86) | −1.3 (3.9) |
| Day 2: Incense burning and limonene injection | PN0.01–0.03 | 5.25 (0.04) | 6.57 d | 9672 (3938) | 5.51 (0.05) | 6.57 d | 665 (149) | −68 (88) | −3.1 (4.0) |
| PN0.03–10 | 5.91 (0.05) | 6.20 (0.05) | −77 (88) | −3.5 (4.0) | |||||
| PN2.5 | 5.91 (0.05) | 6.20 (0.05) | −77 (88) | −3.5 (4.0) | |||||
| Limonene | 6.14 (0.01) | 6.29 (0.01) | −37 (86) | −1.7 (3.9) | |||||
Publisher’s Note: MDPI stays neutral with regard to jurisdictional claims in published maps and institutional affiliations. |
© 2022 by the authors. Licensee MDPI, Basel, Switzerland. This article is an open access article distributed under the terms and conditions of the Creative Commons Attribution (CC BY) license (https://creativecommons.org/licenses/by/4.0/).
Share and Cite
Zeng, Y.; Laguerre, A.; Gall, E.T.; Heidarinejad, M.; Stephens, B. Experimental Evaluations of the Impact of an Additive Oxidizing Electronic Air Cleaner on Particles and Gases. Pollutants 2022, 2, 98-134. https://doi.org/10.3390/pollutants2020010
Zeng Y, Laguerre A, Gall ET, Heidarinejad M, Stephens B. Experimental Evaluations of the Impact of an Additive Oxidizing Electronic Air Cleaner on Particles and Gases. Pollutants. 2022; 2(2):98-134. https://doi.org/10.3390/pollutants2020010
Chicago/Turabian StyleZeng, Yicheng, Aurélie Laguerre, Elliott T. Gall, Mohammad Heidarinejad, and Brent Stephens. 2022. "Experimental Evaluations of the Impact of an Additive Oxidizing Electronic Air Cleaner on Particles and Gases" Pollutants 2, no. 2: 98-134. https://doi.org/10.3390/pollutants2020010