Proceeding Paper

Impurity Ferromagnetism of Pd-Fe and Pd-Co Alloys: Ab Initio vs. Experiment †

1
Institute of Physics, Kazan Federal University, 420008 Kazan, Russia
2
Zavoisky Physical-Technical Institute, FRC Kazan Scientific Center of RAS, 420029 Kazan, Russia
*
Author to whom correspondence should be addressed.
Presented at the 3rd International Online-Conference on Nanomaterials, 25 April–10 May 2022. Available online: https://iocn2022.sciforum.net/.
Mater. Proc. 2022, 9(1), 22; https://doi.org/10.3390/materproc2022009022
Published: 22 April 2022
(This article belongs to the Proceedings of The 3rd International Online-Conference on Nanomaterials)

Abstract

:
We have performed full-stack research of Pd1−xFex and Pd1-xCox (x = 0.01–0.1) alloys. At the first stage, the occurrence of impurity ferromagnetism in the considered alloys was studied employing the density functional theory (DFT). At the second stage, magnetic impurities of Fe and Co atoms were implanted into epitaxial Pd thin films to verify the DFT results. The magnetic properties of implanted Pd films were investigated by a Vibrating Sample Magnetometer (VSM) in the temperature range from 5 to 300 K. It has been established that VSM results are in good agreement with ab initio calculations. In particular, 4 and 5 µB for Co found from VSM for x = 0.025 and x = 0.035 agree well with DFT value of 5.5 µB for x = 0.025.

1. Introduction

The impurity ferromagnetism of strongly paramagnetic palladium aroused great interest among theoreticians and experimentalists back in the last century due to the fact that the effective magnetic moment per one magnetic impurity, for example, iron, turned out to be anomalously large, up to 12 Bohr magnetons (µB) [1,2,3]. To date, the revival of interest in Pd-Fe alloys was caused mainly by their potential use as a weak ferromagnet in superconducting magnetic random-access memory (MRAM) based on Josephson junctions [4,5,6,7,8,9,10]. Despite the long history of studies of such structures, the region of low-impurity concentrations has not yet been sufficiently studied. Thus, recently, new features of the phase diagram of a palladium–iron alloy were discovered experimentally in the low concentration region, ≤10 at %. In particular, it was demonstrated that ion implantation of iron into epitaxial palladium films can lead to the formation of a multiphase magnetic system [11,12]. Pd-Fe alloys synthesized by ion implantation with an average iron content in the range of 2–8 at % are metastable with respect to ferromagnetism and formed phases. As a result of thermal annealing of the samples under high vacuum conditions, an increase in the magnetization of the films and an increase in the Curie temperature were observed as well as the formation of additional stable phases. In addition, some discrepancies were found with older works from this area [11].
Theoretical calculations could help correlate recent results with older work and shed light on the mechanisms of magnetization formation in palladium-iron alloys. This project is based on fundamental studies of the structural and magnetic properties of Pd1−xAx alloys (x ≤ 10 at %, A = Fe and Co) using computer simulation within the framework of the density functional theory (DFT). Theoretical investigation has been performed in a close collaboration with an experimental group dealing with the growth and analysis of thin films. In the present paper, DFT results will be presented along with Vibrating Sample Magnetometer (VSM) measurements for both Pd-Fe and Pd-Co alloys with an impurity content of up to 10 at %.

2. Materials and Methods

2.1. DFT Calculation Details

Ab initio calculations were based on the density functional theory (DFT) [13,14] realized in the VASP code [15,16,17] integrated into the MedeA® software environment of Materials Design [18]. Exchange and correlation effects were accounted for by the generalized gradient approximation (GGA-PBE) [19]. The Kohn–Sham equations were solved using the plane–wave basis set (PAW) [19]. The following computation parameters were used: the cut-off energy was 400 eV, the force tolerance was 0.5 eV/nm and the SC energy was 10−5 eV. The Brillouin zones were sampled using Monkhorst–Pack grids [20], including 3 × 3 × 3 k-points. We performed spin-polarized calculations in all cases, initializing Fe and Co atoms to have 3.63 µB and 1.5 µB, respectively, and Pd atoms to be in the paramagnetic state (0 µB). The structures were modeled as 3 × 3 × 3-unit cells consisting of a filled FCC host matrix formed by Pd atoms, with Fe and Co ions substituting octahedrally coordinated sites only (as shown in Figure 1). All atom positions were fully relaxed.

2.2. The Experiment Description

The epitaxial Pd films were produced by molecular-beam epitaxy (MBE) in ultrahigh vacuum conditions of 5 × 10⁻¹⁰ mbar on epi-ready (Ra < 0.5 nm) (100)-MgO single-crystal with dimensions of 5 × 10 × 0.5 mm3 provided by Crystal GmbH. Pd were evaporated from a Createc Fischer effusion cell with a precise temperature control of ±0.1 °C. During the deposition process, the temperature of the Pd was constant (1305 °C) and the growth rate was 11.4 nm/hour. Film growth was carried out in three stages (by analogy with the work in Ref. [8]). At the first stage, the substrate temperature was 400 °C and the first layer of 10 nm thick was deposited. At the second stage, the substrate temperature was 150 °C and a final layer that was 30 nm thick was deposited. Finally, the film was annealed in vacuum at a temperature of 600 °C for 20 min. The structural perfection of the film was monitored in situ at each stage by low-energy electron diffraction and ex situ by X-ray diffraction. A series of 40 nm epitaxial Pd films were grown under the same conditions. Then, samples were taken out of the vacuum for a further ion implantation procedure. Afterwards, 40 keV Fe+ (or Co+) ions were implanted with different doses (determines the impurity content) into fresh-grown epitaxial Pd films. Thus, two series of samples were synthesized, which differed from each other in the implanted type of chemical impurity (see Table 1). Pd-Fe and Pd-Co alloy films synthesized by ion implantation were additionally annealed in ultrahigh vacuum (9 × 10⁻⁹ mbar) at a temperature of 600 °C for 2 h. Such annealing was carried out to make the samples stable and get rid of radiation defects. After annealing, all samples were cut into several parts using a diamond saw with a non-magnetic base, and one piece of each sample was measured by VSM in the temperature range from 5 to 300 K.

3. Results

3.1. DFT Calculations

Fe impurity in the Pd matrix has been investigated in our previous research [21]. Here, we focus on the comparison with Co impurity. The calculated total magnetization per impurity is shown in Figure 2 versus impurity content. At low impurity concentration (x = 0.01 to x = 0.03 for Fe and to x = 0.02 for Co), we obtained a negligible cell magnetization. At such low concentrations, Co and Fe were found to be non-magnetic. The average magnetization of impurities versus impurity content is shown in Figure 3, which is consistent with Figure 2. In this low-concentration region, non-magnetic impurities do not affect the magnetization of the surrounding Pd matrix as observed in Figure 4, where the maximum of magnetic moment per Pd atom is displayed versus impurity content. For Co at x = 0.03, we observed an unexpected peak. The possible reason is considered in the Section 4.
In the second region above x = 0.03, Fe impurities magnetic moments increase and come to a plateau with a constant value of 3.25 µB, which is close to the bulk value. In contrast, Co curves in this region are at the bottom, and an increase in magnetic moments starts at higher concentrations, which could be related to different electronic structures of magnetic impurities.
Finally, above x = 0.08, Co curves approach Fe tendencies. We assume that above x = 0.12, Co magnetization could come to plateau as well as Fe curves; however, that will be checked in further research.

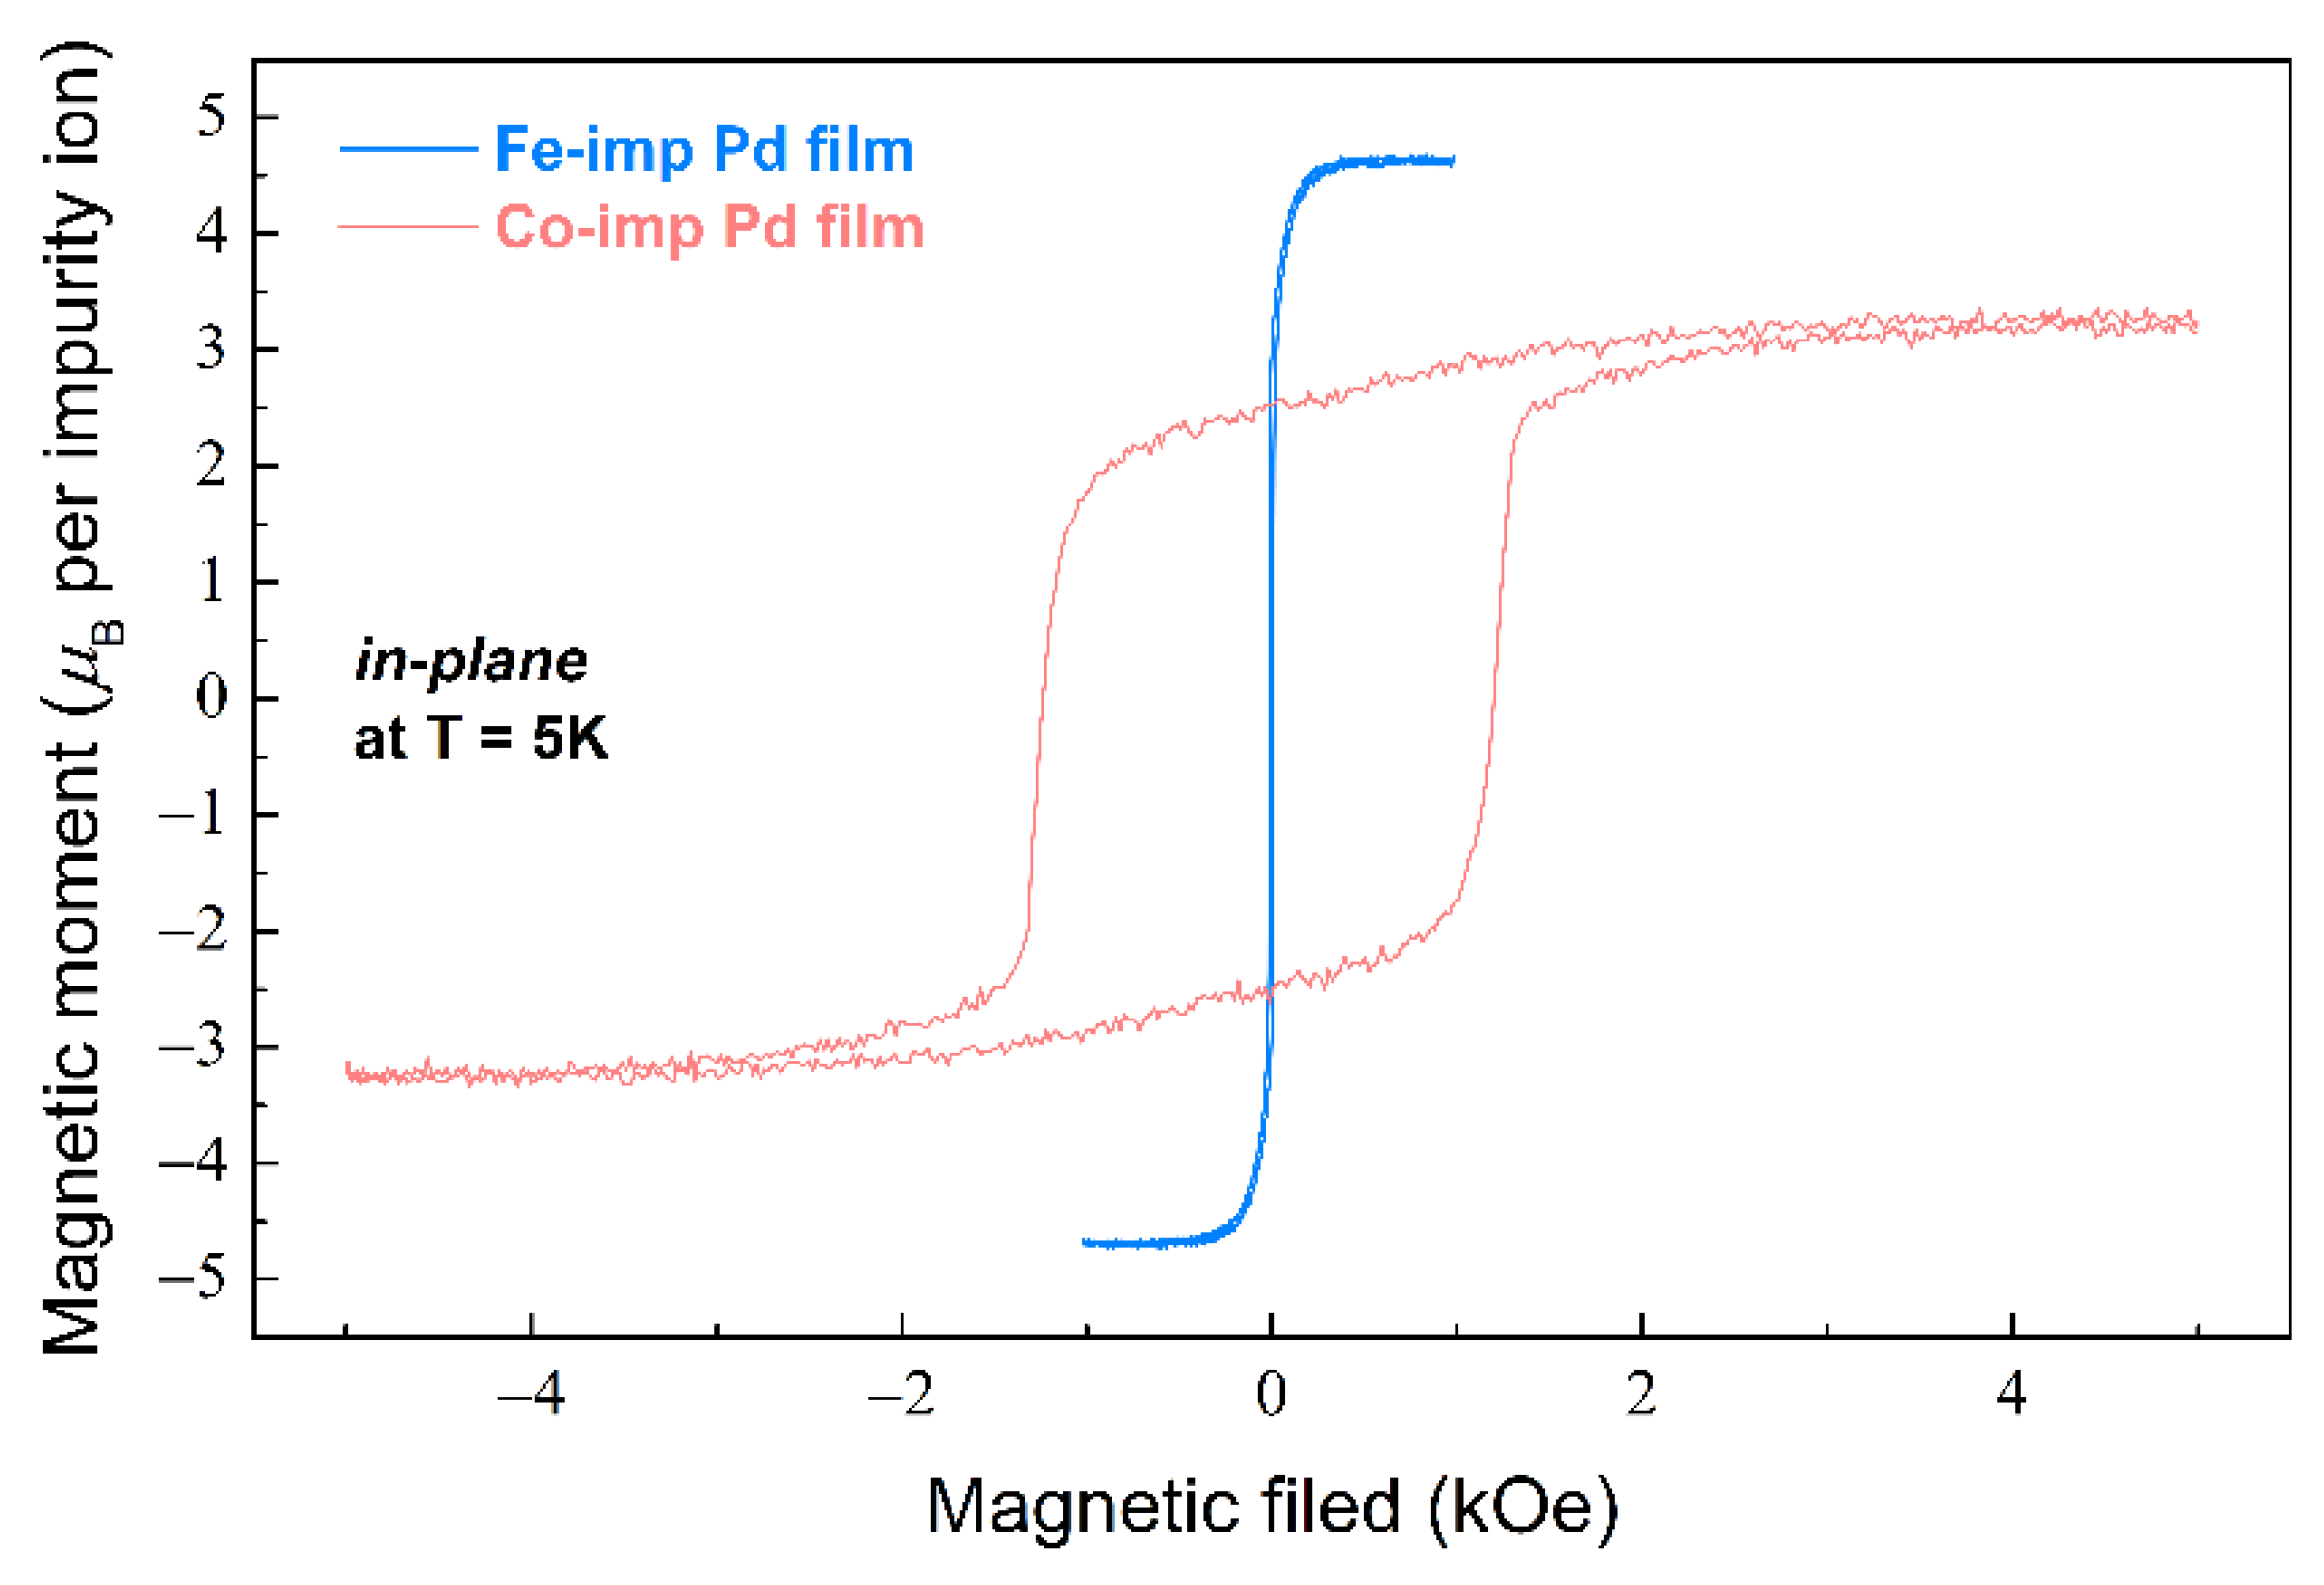
3.2. Magnetostatic Measurements

The static magnetic properties of the Fe- and Co-implanted Pd films were measured utilizing the Vibrating Sample Magnetometer (VSM) in the temperature range of 5–300 K with the magnetic field applied either in-plane or out-of-plane of the films. To determine the Ms of the Pd-Fe and Pd-Co alloy films, the net diamagnetic contribution of the MgO substrate was subtracted from the raw VSM data. Then, the saturation magnetic moment Ms was recalculated to the number of Bohr magnetons (μB) per implanted Fe+ or Co+ ion. As expected, the magnitude of the Ms and the Curie temperature TC will increase with an increase in the implantation dose (impurity concentration). Note that the average impurity concentration in implanted samples was taken from experimental distribution profiles obtained by X-ray photoelectron spectroscopy in combination with sequential Ar-ion etching of the sample surface (profiles are not presented here) and for the doses of 0.5, 1.0, and 3.0 × 10¹⁶ ions/cm2 were corresponded to x = 0.025, x = 0.035, and x = 0.075, respectively. Figure 5 shows magnetic hysteresis loops for the FePd-3 and CoPd-3 samples. It is clearly seen that the magnetic hysteresis loops recorded for Pd films implanted with Fe+ or Co+ ions differ significantly in the magnitude of the Ms, magnetic anisotropy and coercive field Hc. A significant difference is observed in the magnitude of the Hc for Co-implanted Pd film (CoPd-3); this value is ≈1300 Oe, while for the FePd-3, this value is just ≈9 Oe (Figure 5). Such a difference in the magnitude of the Hc is associated with a fundamental difference in the magnetocrystalline anisotropy of iron and cobalt impurities. Moreover, the Hc of Co-implanted Pd films significantly depends on the implantation dose (Co concentration); in particular, for CoPd-2, it is ≈700 Oe, and for CoPd-1, it is ≈250 Oe.

4. Discussion

As was discussed in our previous research [21], the low-concentration region behavior, in particular the zero magnetic moments of impurities, is in consistence with the theory of impurity ferromagnetism [22]. However, as was shown previously for Fe impurity, there is a discrepancy in the low-concentration region between ab initio and experiments (Figure 2a in Ref. [21]). One possible reason is the fact that the calculations were performed assuming 0 K, and we obtained Fe and Co solute atoms after optimization as being non-magnetic at low impurity concentrations, whereas experimental measurements were carried out at final temperatures, in particular 5 K.
From DFT calculations, it follows that at the concentrations above x = 0.03 for Fe, the total magnetization (Figure 2) along with impurity magnetic moments (Figure 3) and maximal Pd magnetic moments (as shown in Figure 4) increase, reaching the wide maximum of total magnetization per impurity being equal to ≈8 µB. The calculated averaged magnetization of impurities for Fe reaches a plateau with a constant value of ≈3.25 µB (Figure 3), which is lower than the theoretical maximum, but it is higher than the value of 2.8 µB obtained in [1] and close to the value of 3.5 µB obtained by Neutron diffraction experiments [23,24]. After the peak point, the total magnetization (Figure 2) for the Fe curve decreases very slow in agreement with experiments and theoretical predictions [21].
In contrast, Co curves for total magnetization (Figure 2), as well as Co magnetic moments (Figure 3) and generated magnetic moments at Pd atoms (Figure 4), have a local maximum. This feature at x = 0.03 for Co was reproduced by several configurations with different atom positions with the same concentration, and the result shown in the plots was obtained by averaging. It well might be related to the following. At x = 0.03, within the homogeneous distribution of impurities, a Co-Co distance is ≈8.5 Å. In our previous publication, it was discussed that magnetization depends on the impurity-to-impurity distance [21]. We assumed that with a particular arrangement of the impurity, the maximum number of polarized palladium atoms participate in the long-range magnetic order (thereby creating an infinite cluster), which leads to a noticeable change in the magnetic properties—an increase in the magnetization. That was also found in experiments when annealing led to the homogeneous distribution and an incensement of magnetization and Curie temperature [11]. The magnetization dependence on impurities positions was also calculated for Co, demonstrating an increase in magnetization with distance. However, the maximum was not reached due to the size of simulation cell, and we could only assume that the peak is somewhere around 9 Å, which is close to the distance between impurities for x = 0.03. This coincidence could be the reason for the peak at the concentration of x = 0.03.
From the magnetic hysteresis loops obtained at 5 K, it follows that for Fe-implanted samples, the total magnetization is about 4.5 µB (Figure 5), which is higher than for a Co value of 3.5 µB. Those values are in comparative agreement with DFT values of ≈8 µB for Fe and ≈5.5 µB for Co.
In the third region above the concentration of x = 0.09, the Co curve goes up again, reaching 5 µB for total magnetization and the highest generated magnetic moments at Pd atoms of 0.40 µB. Higher concentrations have to be checked, since the maximum has not been reached here. We expect that the maximum and plateau will be reached in accordance with a saturation moment of 10 µB, as published in Table 2.1 of Ref. [2] above 0.07 at.%.
Finally, at higher concentrations, both Fe and Co curves are becoming closer (Figure 2, Figure 3 and Figure 4), which might be the reassurance of correct results.

5. Conclusions

A comparison of experimental data and theoretical calculation of the concentration dependences of the magnetization of Pd-Fe and Pd-Co alloys with an impurity content of up to 10 at % showed their qualitative agreement with each other. At similar concentrations of magnetic impurity in the palladium matrix, in the experiment and in the calculation, a maximum of the magnetic moment per impurity was observed. In this case, the observed differences between the calculated and experimental data may be due to the fact that the magnetic impurity is distributed inhomogeneously in the implanted palladium matrix [11]. The cumulative analysis of the obtained data suggests that DFT method can be used to study Pd-Fe and Pd-Co alloys.

Author Contributions

Conceptualization, A.G. and I.P.; methodology, I.P. and A.K.; software, I.P. and A.K.; validation, A.G. and I.Y.; formal analysis, I.P. and A.K.; investigation, I.P.; resources, I.P.; data curation, I.P. and A.G.; writing—original draft preparation, I.P.; writing—review and editing, A.G. and I.Y.; visualization, A.G.; supervision, R.K.; project administration, R.K.; funding acquisition, R.K. All authors have read and agreed to the published version of the manuscript.

Funding

The experimental part of this work was supported by RFBR Grant No. 20-02-00981. Theoretical calculations were supported by the Kazan Federal University Strategic Academic Leadership Program (Priority-2030).

Institutional Review Board Statement

Not applicable.

Informed Consent Statement

Not applicable.

Data Availability Statement

Not applicable.

Acknowledgments

Computing resources were provided by Laboratory of Computer design of new materials in Kazan Federal University.

Conflicts of Interest

The authors declare no conflict of interest.

References

  1. Crangle, J. Ferromagnetism in Pd-rich palladium-iron alloys. Philos. Mag. 1960, 5, 335–342. [Google Scholar] [CrossRef]
  2. Nieuwenhuys, G.J. Magnetic behaviour of cobalt, iron and manganese dissolved in palladium. Adv. Phys. 1975, 24, 515–591. [Google Scholar] [CrossRef]
  3. Wohlfarth, E.P. Handbook of Magnetic Materials; North-Holland Publishing Company: London, UK, 1980; Volume 1, p. 75. [Google Scholar]
  4. Ryazanov, V.V. Josephson superconductor—Ferromagnet—Superconductor π-contact as an element of a quantum bit (experiment). Uspekhi Fiz. Nauk 1999, 42, 825–827. [Google Scholar] [CrossRef]
  5. Larkin, T.I.; Bol’ginov, V.V.; Stolyarov, V.S.; Ryazanov, V.V.; Vernik, I.V.; Tolpygo, S.K.; Mukhanov, O.A. Ferromagnetic Josephson switching device with high characteristic voltage. Appl. Phys. Lett. 2012, 100, 222601. [Google Scholar] [CrossRef] [Green Version]
  6. Ryazanov, V.V.; Bol’ginov, V.V.; Sobanin, D.S.; Vernik, I.V.; Tolpygo, S.K.; Kadin, A.M.; Mukhanov, O.A. Magnetic Josephson junction technology for digital and memory applications. Phys. Procedia 2012, 36, 35–41. [Google Scholar] [CrossRef] [Green Version]
  7. Vernik, I.V.; Bol’ginov, V.V.; Bakurskiy, S.V.; Golubov, A.A.; Kupriyanov, M.Y.; Ryazanov, V.V.; Mukhanov, O.A. Magnetic Josephson junctions with superconducting interlayer for cryogenic memory. IEEE Trans. Appl. Supercond. 2013, 23, 1701208. [Google Scholar] [CrossRef] [Green Version]
  8. Esmaeili, A.; Yanilkin, I.V.; Gumarov, A.I.; Vakhitov, I.R.; Yusupov, R.V.; Tatarsky, D.A.; Tagirov, L.R. Epitaxial thin-film Pd1−xFex alloy—A tunable ferromagnet for superconducting spintronics. Sci. China Mater. 2021, 64, 1246–1255. [Google Scholar] [CrossRef]
  9. Mohammed, W.M.; Yanilkin, I.V.; Gumarov, A.I.; Kiiamov, A.G.; Yusupov, R.V.; Tagirov, L.R. Epitaxial growth and superconducting properties of thin-film PdFe/VN and VN/PdFe bilayers on MgO(001) substrates. Beilstein J. Nanotechnol. 2020, 11, 807–813. [Google Scholar] [CrossRef]
  10. Yanilkin, I.V.; Mohammed, W.M.; Gumarov, A.I.; Kiiamov, A.G.; Yusupov, R.V.; Tagirov, L.R. Synthesis, characterization, and magnetoresistive properties of the epitaxial Pd0.96Fe0.04/VN/Pd0.92Fe0.08 superconducting spin-valve heterostructure. Nanomaterials 2021, 11, 64. [Google Scholar] [CrossRef] [PubMed]
  11. Gumarov, A.I.; Yanilkin, I.V.; Yusupov, R.V.; Kiiamov, A.G.; Tagirov, L.R.; Khaibullin, R.I. Iron-implanted epitaxial palladium thin films: Structure, ferromagnetism and signatures of spinodal decomposition. Mater. Lett. 2021, 305, 130783. [Google Scholar] [CrossRef]
  12. Gumarov, A.I.; Yanilkin, I.V.; Rodionov, A.A.; Gabbasov, B.F.; Yusupov, R.V.; Aliyev, M.N.; Khaibullin, R.I.; Tagirov, L.R. Manifestations of Spinodal Decomposition into Dilute Pd1-xFex “Phases” in Iron-Implanted Palladium Films: FMR Study. Appl. Magn. Reson. 2022, 53, 875–886. [Google Scholar] [CrossRef]
  13. Hohenberg, P.; Kohn, W. Inhomogeneous Electron Gas. Phys. Rev. 1964, 136, B864–B871. [Google Scholar] [CrossRef] [Green Version]
  14. Kohn, W.; Sham, L.J. Self-Consistent Equations Including Exchange and Correlation Effects. Phys. Rev. 1965, 140, A1133–A1138. [Google Scholar] [CrossRef] [Green Version]
  15. Kresse, G.; Furthmüller, J. Efficiency of ab-initio total energy calculations for metals and semiconductors using a plane-wave basis set. Compur. Mater. Sci. 1996, 6, 15–50. [Google Scholar] [CrossRef]
  16. Kresse, G.; Furthmüller, J. Efficient iterative schemes for ab initio total-energy calculations using a plane-wave basis set. Phys. Rev. B 1996, 54, 11169–11186. [Google Scholar] [CrossRef]
  17. Kresse, G.; Joubert, D. From ultrasoft pseudopotentials to the projector augmented-wave method. Phys. Rev. B 1999, 59, 1758–1775. [Google Scholar] [CrossRef]
  18. Materials Design, Inc. MedeA, version 3.4; MedeA is a Registered Trademark of Materials Design, Inc.: San Diego, CA, USA, 2012. [Google Scholar]
  19. Perdew, J.P.; Burke, K.; Ernzerhof, M. Generalized Gradient Approximation Made Simple. Phys. Rev. Lett. 1996, 77, 3865–3868. [Google Scholar] [CrossRef] [Green Version]
  20. Blöchl, P.E. Projector augmented-wave method. Phys. Rev. B 1994, 50, 17953–17979. [Google Scholar] [CrossRef] [Green Version]
  21. Piyanzina, I.; Gumarov, A.; Khaibullin, R.; Tagirov, L. Ab initio Investigation of Impurity Ferromagnetism in the Pd1−xFex Alloys: Concentration and Position Dependences. Crystals 2021, 11, 1257. [Google Scholar] [CrossRef]
  22. Korenblit, I.Y.; Shender, E.F. Ferromagnetism of disordered systems. Sov. Phys. Uspekhi 1978, 21, 832–851. [Google Scholar] [CrossRef]
  23. Low, G.G. The electronic structure of some transition metal alloys. Adv. Phys. 1969, 18, 371–400. [Google Scholar] [CrossRef]
  24. Aldred, A.T.; Rainford, B.D.; Stringfellow, M.W. Magnetic Moment Distribution in Dilute Alloys of Nickel in Palladium. Phys. Rev. Lett. 1970, 24, 897–900. [Google Scholar] [CrossRef]
Figure 1. Supercell of Pd matrix used in our calculations with denoted polarized Pd atoms around the Fe or Co solute ions after the optimization procedure. Red sphere of atom corresponds to Fe/Co, light blue to Pd, and blue to predominantly polarized Pd atoms.
Materproc 09 00022 g001
Figure 2. Total magnetization of Pd1−xFex and Pd1−xCox (x = 0.01–0.10) systems calculated per impurity atom versus impurity content in the 3 × 3 × 3 Pd supercell.
Materproc 09 00022 g002
Figure 3. Calculated average magnetization of Fe and Co in Pd1−xFex and Pd1−xCox (x = 0.01–0.10) systems versus impurity content in the 3 × 3 × 3 Pd supercell.
Materproc 09 00022 g003
Figure 4. Maximal calculated magnetic moment at Pd atom in Pd1−xFex and Pd1−xCox (x = 0.01–0.10) systems versus impurity content in the 3 × 3 × 3 Pd supercell.
Materproc 09 00022 g004
Figure 5. Magnetic hysteresis loops for 40 nm epitaxial Pd film implanted by Fe+ ions (blue curve) or Co+ ions (red curve) with the dose of 3.0 × 10¹⁶ ions/cm2.
Materproc 09 00022 g005
Table 1. Experimental samples synthesized by implantation of Fe+ (or Co+) ions into epitaxial Pd films.
SampleImplanted Ion Implantation Energy (keV)Dose
(×1016 ions/cm2)
FePd-1Fe400.5
FePd-21.0
FePd-33.0
CoPd-1Co400.5
CoPd-21.0
CoPd-33.0
Publisher’s Note: MDPI stays neutral with regard to jurisdictional claims in published maps and institutional affiliations.

