1. Introduction
Hot served food items are maintained around a temperature of 60 °C. Delay in delivery of food packages caused due to interventions in supply chain activities reduces the temperature of food products. Such products can be complemented with phase change material (PCM) pouches which assure temperature maintenance. PCM absorbs a large amount of heat at its phase transition temperature and releases heat to a cooler environment to establish a hot food temperature. Generally, PCMs used for packaging applications undergo a solid to liquid phase transition. These PCMs require an additional envelope to avoid leakage. The secondary envelopes of commercially available PCMs come in the form of rigid slabs or flexible pouches. These envelopes are made from non-biodegradable plastic. Many research groups have used PCM in delivering temperature-sensitive food products. Wang et al. used [
1] microencapsulated PCM stored in a zip lock bag to transport meat package from a plastic crisper while maintaining a temperature around 4 °C. The microencapsulated PCM was in powder form. It required a zip lock bag of plastic crisper size to maintain a uniform weight of PCM along walls. This arrangement increased temperature retention time from 3 min to 30 min. Energy consumption of reefer transported food items was reduced by combining PCM into the insulation walls of vehicles [
2,
3,
4]. PCM encapsulated into metal cold plates ensured uniform distribution of PCM along the reefer’s walls. These plates were charged at the phase transition temperature of PCM by passing refrigerant through it. These cold plates were designed in fixed dimensions by large scale manufacturers. Such composite structures are suitable for transporting food items without refrigeration in 6–9 h. These heavy plates are useful only for big containers. Improvement in insulation performance increases temperature maintenance time. The combination of the vacuum insulation panel and PCM panel in a small container package can maintain the temperature in the range of 2–8 °C for 72 h without any refrigeration system [
5]. Even hot beverage cups maintain sipping temperature for a longer duration with the combination of PCM layer and insulation layer [
6].
In this paper, a PCM composite was prepared with reusable, biodegradable materials. This composite structure is comprised of recycled paper and beeswax. The porous structure of paper helps in shape-stabilizing the beeswax’s phase transformation. The secondary plastic envelope is not required while using the prepared beeswax paper composite. Commercial PCM slabs are manufactured in a limited number of sizes as decided by the manufacturer. These sizes can be a bulkier option for incorporation into small packages. On the other hand, the designed composite can be transformed into the required shape as per package dimensions. This will help in minimizing package weight. Overall, the simple design and method of preparation of beeswax composite make it suitable for low cost commercial applications. The prepared PCM composite assures the temperature maintenance of food items for a longer time in the food delivery process while utilizing less energy.
2. Materials and Methods
2.1. Materials
Beeswax (Anaha™, Panaji, India) was procured. Commercially available paper board obtained from the local market (Mumbai, India). Tween 80 (S D Fine-Chem limited, Mumbai, India) was obtained. Sodium benzoate (Shree Lakshmi chemicals, Banglore, India) was purchased. DI water was used for experimental work. A four-channel temperature data logger was assembled and programmed with Arduino UNO based microcontroller (Adiy™, Rajguru electronics private limited, Mumbai, India). The data logger measures temperature with a precision of 0.01 °C. Two cartons of dimensions 19 cm × 13 cm × 25 cm were used. An insulation sheet of expanded polystyrene was procured from the local market (Mumbai, India). Two smaller cartons of dimensions 16 cm × 10 cm × 22.5 cm were purchased from the local market (Mumbai, India).
2.2. Method of Preparation
Paperboards were cut into pieces, and boiled water was added to prepare a 5% solution. The solution was kept overnight to obtain the paper pulp slurry. The slurry was mechanically ground. Beeswax was melted at 70 °C. The boiled water was added to the molten wax for preparing a 5% solution. The emulsifier tween 80 and the antimicrobial agent sodium benzoate were added to the solution in the quantity one pecent and two pecent respectively. The mixture was stirred for 30 min at 70 °C on a hot plate magnetic stirrer (Bexco, Haryana, India). Prepared paper pulp added to beeswax dispersion and stirred for 30 min at 70 °C. The quantity of pulp varied to prepare dispersion with 0%, 20%, 40%, 60%, and 80% beeswax concentration. Prepared dispersion was filtered with filter paper of pore size 8 to 10 microns. The suspension was filtered by vacuum filtration with a Buchner funnel. The material that remained above filter paper was peeled off and kept in a silicone mold of 9 cm × 9 cm × 0.2 cm size. It was then hot pressed with fabric covering. This process was useful in fabricating sheets of required dimensions. The prepared sheets were further dried for seven days.
2.3. Characterization Techniques
2.3.1. Leakage Test
The highest concentration of beeswax showing no leakage was determined with the leakage test. The leakage can be determined by quantitative and qualitative methods. In the qualitative method, the circular sheet samples were heated to 70 °C. The leakage of molten beeswax observed can be observed visually. It gave the twenty percent range of beeswax concentration with the lowest leakage level. In this range, three composites were prepared by increasing beeswax concentration in steps of 5%. These samples will help to determine the highest quantity of beeswax that can be incorporated into the paper. The quantitative leakage test was performed for all samples. The quantitative analysis is based on the gravimetric principle. One to two grams of composite material and a small tissue paper was filled in a test tube. The test tube was heated to 70 °C. The weight of paper before and after heating was tested. If the weight increases, it indicates leakage from the composite.
2.3.2. Differential Scanning Calorimetry
About 5 mg of sample was weighed on electronic weighing balance (AB204, Mettler Toledo, Tokyo, Japan) used for the analysis. The machine can weigh ±0.1 mg precisely. Differential scanning calorimeter (DSC 3, Mettler Toledo, Tokyo, Japan) was used. To remove the thermal history of the sample, the sample was heated from room temperature to 200 °C at a heating rate of 10 °C/min under a nitrogen atmosphere. The sample was held at 200 °C for 2 min. The melting characteristics of the sample were analyzed in the next scan. The scanning was performed from 0 °C to 200 °C at a heating rate of 10 °C/min under a nitrogen atmosphere.
2.3.3. T-History Method
The experimental setup consisted of two identical test tubes consisting equal amount of glycerine (reference) and sample PCM, heating assembly and temperature sensors. The sample and reference were heated to 70 °C and allowed to cool down to room temperature. The temperature drops in the reference and sample, in the temperature range 70 °C to 27 °C, were recorded. These values were used to plot temperature-time curves of the PCM sample and reference.
The specific heat and thermal conductivity of the solid PCM are determined using the following formula:
where
is mass of reference material,
mt is mass of tube material,
is mass of PCM, c
p is the specific heat capacity of PCM sample,
is the specific heat capacity of reference material,
is the specific heat capacity of tube material,
is the area under the cooling curve of PCM and
is the area under the cooling curve reference material.
The thermal conductivity of the solid PCM was calculated using the formula:
where k
p is the effective thermal conductivity of the PCM, c
p is the specific heat of the PCM,
is the density of the PCM,
is the radius of the test tube,
is the heat of fusion of PCM as obtained from the differential scanning calorimetry (DSC) results and
is the temperature of melting and atmosphere, respectively. The time of solidification of the molten PCM is denoted by
.
2.3.4. Morphological Analysis
The morphology of samples was observed with the scanning electron microscope (SEM). FEI Quanta 200 SEM model was used for studying morphology.
2.3.5. Heat Release Performance in Carton
Heat release performance of PCM composite sheets was compared with a control sample. The test was performed in a room with an ambient temperature of 29 °C. The arrangement of the test components is given in
Figure 1. In the PCM-recycled paper sample, PCM composite sheets were placed at six faces of the outer carton. Each side of the carton is surrounded by 15 gm of PCM composite sheet layers. In six faces, the carton had 60 gm of PCM. An insulation sheet was placed beside each PCM composite sheet. A smaller sized inner carton was placed in this assembly. A glass containing 50 mL of boiled water was placed inside the inner carton. A control sample was prepared with the same procedure without PCM sheets. The temperature of water in the center of both cartons and ambient temperature was measured with the temperature data logger. The data logger was sealed inside the carton for measuring the temperature of water without heat loss. The data logger was connected to a laptop which acts as a data acquisition unit. It records the temperature in 30 s intervals. The temperature change in the water of both samples was measured simultaneously with the data logger.
3. Results and Discussion
With the increasing content of beeswax, the enthalpy of phase transition increases. This implies that an increase in thermoregulation capacity is possible with high beeswax loading in the recycled paper composite. However, the limit of maximum beeswax incorporation in the recycled paper composite is constrained by leakage. The composite samples containing 60% and 80% beeswax concentration showed visual leakage at 70 °C in the qualitative test. The leakage can be observed in
Figure 2. The lower concentration of fibers in these samples could not hold molten beeswax. The qualitative test proved the 40–60% range as the optimum beeswax concentration level for the composite. For determining the exact amount of beeswax concentration, the leakage test was performed on composite sheets with 45%, 50% and 55% beeswax concentration. These samples were made following the previously mentioned method. The results of the qualitative leakage test on the backside of the paper can be seen in
Figure 2. The pure beeswax sample was fully molten. Samples above 45% beeswax concentration showed leakage. Only 45% of beeswax composite did not show leakage.
The quantitative leakage test was performed to confirm the qualitative leakage test’s results. Samples with 20% and 40% beeswax concentration showed negligible leakage. Samples with 60% and 80% beeswax concentration showed a 12.66% and 20.38% increase in paper weight, respectively. The leakage test indicated that samples with 60 and 80% beeswax content showed severe leakage which is unsuitable for practical applications. Pores of paper cannot prevent leakage of PCM above its melting point. Leakage tests showed a 3.83% and 9.25% weight increase for 50% and 55% beeswax containing composites. Negligible leakage was obtained with 45% beeswax-recycled paper composite. Both qualitative and quantitative leakage tests confirmed 45% beeswax concentration as optimum. Thus, 45% beeswax is considered as the highest concentration that can be incorporated in paperboard with the mentioned technique.
The DSC thermograms of beeswax, beeswax composite containing 45% beeswax concentration, and paper are given in
Figure 3. Beeswax is a bio-based material composed of long-chain acids and esters [
7]. The long-chain compounds require a large quantity of heat for the melting process. This amount can be measured with DSC. Beeswax showed a melting enthalpy of 216.09 J/g. When micrograins of beeswax are enclosed in the porous paper, its crystalline structure is modified. The thermal characteristics change due to structural variation. Thus, the melting enthalpy of composite with 45% beeswax content was reduced to 102.51 J/g. A smaller quantity of latent heat was required for phase transition of modified crystalline structure, while a higher amount of latent heat was needed to transform the crystalline phase. The structural change also affected phase transition temperature. The beeswax and its composite underwent phase transition at 59.92 °C and 61.11 °C, respectively. The cellulosic paper did not undergo any structural change in beeswax’s phase change temperature range.
A small quantity of samples was used for DSC analysis to give accurate results of thermal properties. However, practical applications use a large amount of material. The thermal properties could vary due to the non-homogeneity of samples. Thus, thermal tests performed using a higher amount of sample will be more useful. The T-history method is advantageous in this respect. It measures the thermal performance of larger sample weights. In this test, the temperature-time profile of the sample is compared with reference material for determining thermal characteristics. As shown in the temperature-time curve in
Figure 4, beeswax has a larger area under the curve depicting the highest heat storage capacity. With decreasing beeswax content, the area under the temperature-time curve reduces. This means that a lower amount of heat is stored when paper content in the composite is higher. The thermal conductivity of beeswax and composite samples with 45%, 40% and 20% beeswax was calculated as 0.285 W/mK, 0.157 W/mK, 0.141 W/mK, and 0.119 W/mK, respectively. These values are comparable to observed values in the literature [
8]. As the beeswax concentration decreases, the conductivity decreases. The beeswax is filled inside the pores of paper which otherwise is filled with air. That is why the increase in beeswax concentration increases the thermal conductivity of composite structures.
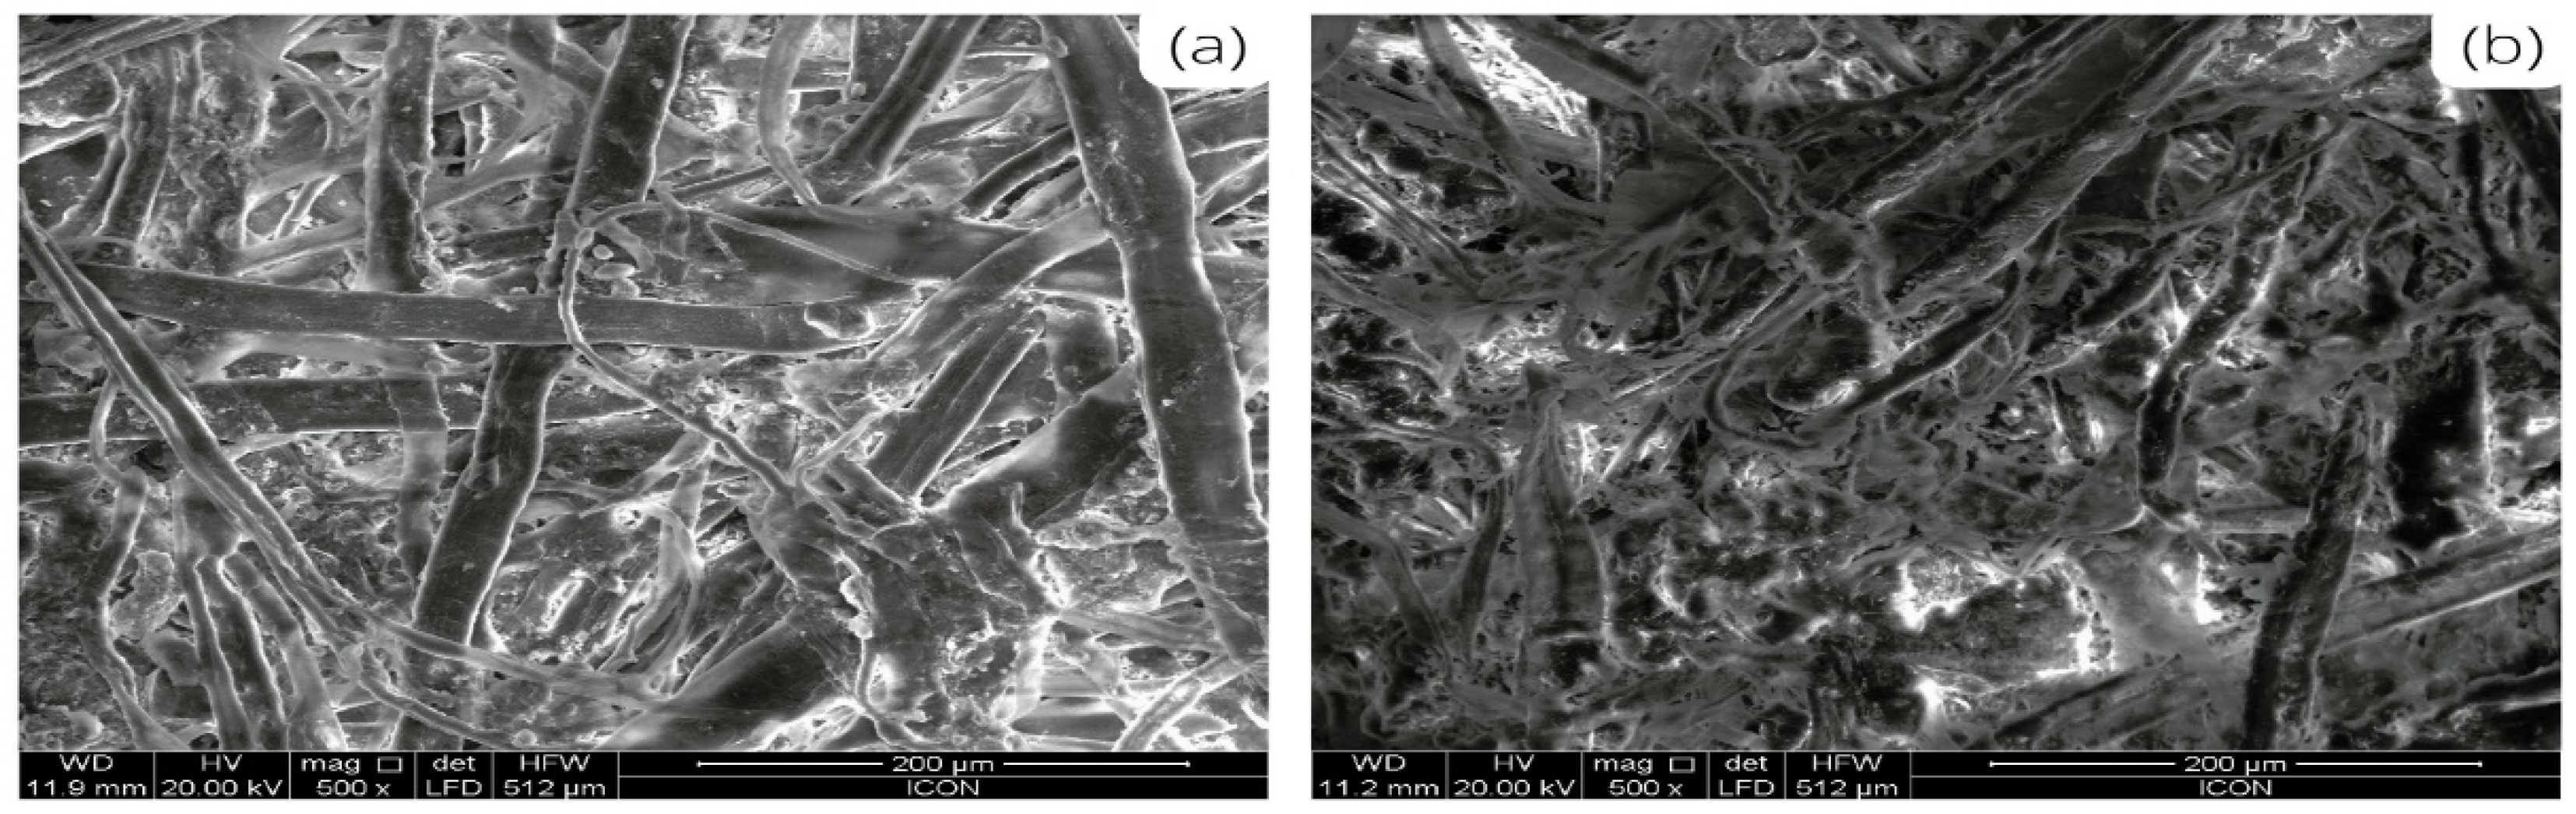
SEM analysis of the recycled paper is represented in
Figure 5a. The morphology of recycled paper consisted of pores. The morphology of composite containing 45% beeswax concentration is shown in
Figure 5b. The mesh structure of the paper was filled with beeswax. However, the fiber strands are visible. Beeswax was not on the surface of fibers. Otherwise, the wax would have leaked away in the molten state. So, it can be concluded that wax was only present in the pores of the paper. The porous structure helps in tethering leakage of molten beeswax. The formability of recycled paper-beeswax composite to different shapes and sizes combined with beeswax micrograins in paper pores is advantageous for thermal energy storage applications.
The effectivity of PCM composite sheets on the temperature of enclosed water was studied with the heat release performance test in a carton.
Figure 6 gives the temperature-time profile of the water in the beeswax composite contained carton and control sample carton. The time of temperature measurement was the same for the samples. The starting points of temperature measurement for PCM composite samples and control samples were 76 °C and 70 °C, respectively. The initial temperature variation in control and composite samples was due to time lag in adjusting the data logger inside cartons. This point was considered as 0 s point. Hereon time measurement started. The Composite assembly took 6823 s for reaching ambient temperature. Control assembly took 6259 s to reach ambient temperature. An increase in time for reaching ambient temperature confirms the thermal energy storage phenomenon of PCM composite sheets. Initially, PCM temperature drops around 38 °C due to absorption of heat by PCM. This temperature was lesser than the control assembly. It was due to the higher thermal conductivity of beeswax composite sheets. Higher thermal conductivity also increases heat loss. Since the outer side of sheets was surrounded by insulation sheets, the heat travels only towards the glass of water in the inner direction. Thus, at 2362 s, the temperature started to increase with heat release from PCM. The temperature increased to a maximum of 43.8 °C. The time for reaching this temperature was 3265 s. It was expected that the maximum temperature of the water should be the phase transition temperature of composite, i.e., 59.92 °C. However, the distance traveled by heat from the PCM composite sheet to the center resulted in heat loss. Additionally, the edges of the inner carton hindered heat passage and contributed to heat loss. After reaching 43.8 °C, the temperature started decreasing and slowly reached ambient temperature. The composite assembly kept the inside temperature at a higher value for more time than the control assembly. This higher temperature inside the carton is from the heat release from PCM to the inside chamber. This phenomenon can be used to maintain a higher temperature in case of delayed delivery. The use of more weight of PCM composite sheets can increase temperature maintenance time. Reducing the distance between PCM composite sheets and food items can help in maintaining food near phase transition temperature of composite.


