1. Introduction
One of the most common uses of pit voids left by large scale mining operations, such as surface lignite mining, is the formation of pit lakes by flooding pit voids after mine closure. Pit lakes offer the opportunity to enhance the recreational or ecological benefits by relandscaping and revegetating the shoreline, creating aquatic life and maintaining water quality [
1,
2,
3].
Pit voids are filled by artificial flooding or allowing the pit voids to fill naturally through hydrological processes such as precipitation or groundwater infiltration. Pit flooding, which is the most popular type of reclamation for open pits, induces groundwater rebound with short- and long-time consequences, such as soil instabilities causing landslides and subsidence. To ensure the safe use of pit lakes by the public, it is necessary to assess the risk of instability in these areas [
4,
5].
The main aim of this study is to develop a probabilistic risk assessment methodology to evaluate the risks associated with the flooding process of the pit and particularly on slope failure. The proposed methodology consists of two distinct phases. Initially, the risk analysis and the risk assessment are performed, while in the second phase spatial analysis of risk and creation of the related maps are implemented.
In the first phase, the bow-tie analysis is used to analyze the critical initiating event (slope failure) and the systemic risk assessment method to estimate the risk for the population, the environment and the infrastructure. The spatial analysis of the risk includes the discretization of the area under study into squares, the estimation of the risk in each one and the creation of the corresponding risk maps by using appropriate spatial interpolation techniques. The methodology is implemented by specialized software that has been created in a Matlab environment for rapid deduction and representation of such risk assessments. The developed methodology was applied in the area of pit lake Most in the Czech Republic.
2. Development of Probabilistic Risk Assessment (PRA) Methodology
The first step for every risk assessment methodology is to descriptively define the boundary of the system under study. In this case, it includes the pit lake and the surrounding area which could be affected. The proposed methodology consists of three parts described below: hazard analysis by employing the bow-tie method, risk estimation by using the systematic risk assessment methodology and then spatial analysis of the risk and creation of the resulting maps.
2.1. Bow-Tie Analysis for Slope Failures
Bow-tie analysis is a risk analysis technique widely used in high-hazard industries (e.g., chemical, oil–gas industry) and more recently in mining [
6,
7]. The central point of a bow-tie diagram is the initiating critical event which represents the point in time when there is a loss of control. The next step is to determine the causes of the initiating event and the potential consequences of the event. For each cause, both the control measures and/or barriers, which can reduce the probability of the initiating event occurring (preventive measures), and the control measures which can be taken to reduce the severity of the consequences of each initiating event (corrective measures) are then identified. One of the particular strengths of the bow-tie method is that it provides an easily understood overview of the risk controls linked to initiating events [
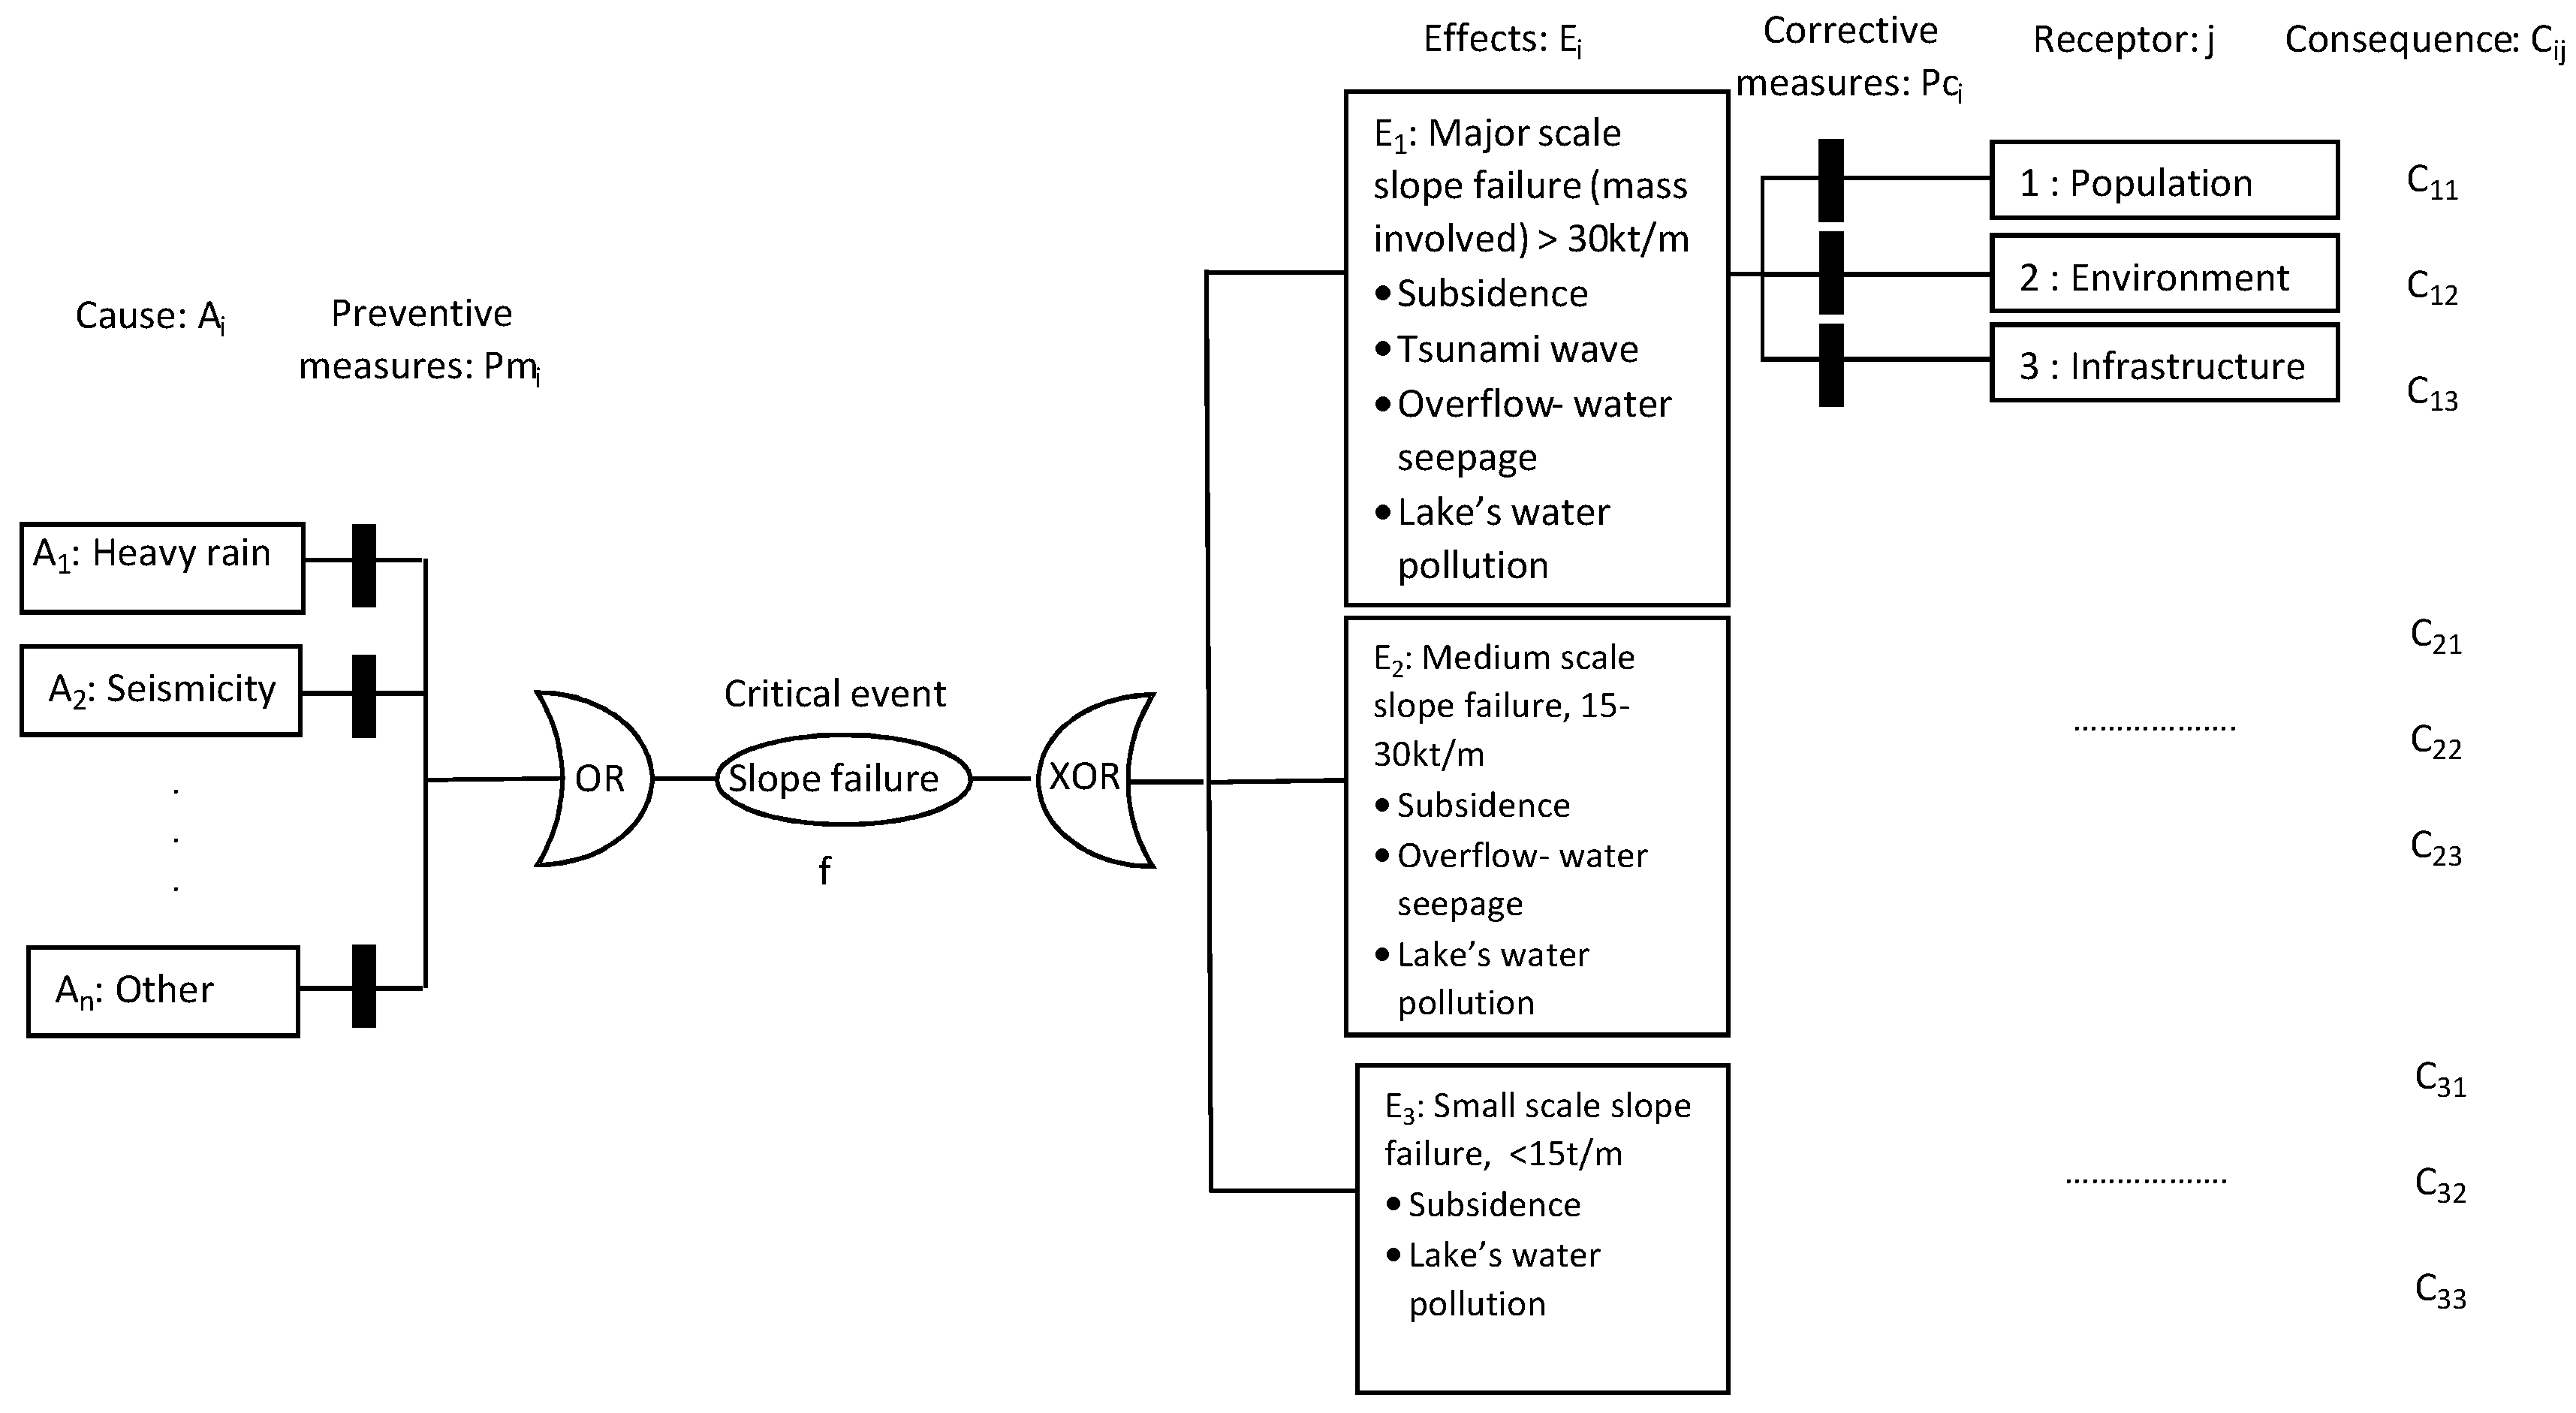
8]. Thus, a bow-tie diagram combines a fault and an event tree for the identification of causes, effects and consequences related to the examined initiating critical event.
In this study, the developed bow-tie diagram (
Figure 1) considers the slope failure as the critical initiating event. The fault tree (left side of bow-tie diagram) examines the causes,
Ai, which can trigger the slope failure. These include both external causes (e.g., heavy rainfall, seismicity) and internal causes (e.g., soil erosion, water level variations). The fault tree also includes the preventive measures,
Pmi, such as the hydrological protection measures and the consideration of the regional seismicity during design. The right part of the bow-tie diagram contains the events with their effects,
Ei, the corrective measures,
Pmi, and the consequence,
Cij, of the effects on the
j receptors. The considered receptors were the population, the environment and the infrastructure. Three different scale slope failures, characterized as major, medium and small [
9] were considered and their effects were examined.
2.2. Systemic Risk Assessment (SRA) Methodology
Systemic Risk Assessment (SRA) uses the probability
f of an initiating critical event, the probabilities
PEij of effect
Ei on receptor
j and the consequence
Cij of effect
Ei on receptor
j [
10]. The risk
Rij of effect
Ei on
j receptor is:
The probability
PEi is calculated from the vulnerability
Vij of receptor
j on effect
Ei and the probability of failure of the corresponding protective measure
PMi.
The risks
Rj for receptor
j and
Ri for effect
i are:
where:
i = 1, 2, …, n are the effects and
j = 1, 2, … m are the receptors. Equation (3) is valid when effects
Ei are mutually exclusive. Finally, the total risk
R for all receptors and effects is:
The probability of slope failure f is deduced from the value of safety factor (SF) of the pit slope [
9].
The estimation of vulnerability
Vij of each receptor
j on effect
Ei is based on its distance from slope failure location and is calculated by using the inverted logistic S curve:
where,
a,
b and
c are the parameters of the inverted logistic S curve and
dr is the relative distance (explained below in
Section 2.3).
For the estimation of the consequences
Cij on population, environment and infrastructure a five-level scale, shown in
Table 1, is used [
10].
2.3. Spatial Analysis and Cretaion of Risk Map
For the spatial analysis of the risk and the creation of the risk maps, firstly the affected area
A is determined. As shown in
Figure 2 this area is defined by boundaries
L1 and
L2, indicating, respectively, the shoreline of the lake and the external limit of the surrounding area which is affected by slope failures. The area
A is discretized into small squares and for each square the minimum distances
d1 and
d2 from boundaries
L1 and
L2, respectively, are estimated (
Figure 2). Then the relative distance
dr =
d1/(
d1 +
d2) is calculated.
Consequently, area A is divided into domains, Sk, where each domain Sk encompasses adjacent subareas with similar geotechnical characteristics. The safety factor SF of the slopes of each domain is estimated, as well as the corresponding probability of failure fk. The probability, fk, is assigned to all squares belonging to domain Sk. In addition, the vulnerability for each square is calculated by using Equation (6) and finally the risk Equation (5). The resulting risk maps are then created by using spatial interpolation techniques.
3. Application of PRA Methodology in the Most Pit Lake
Lake Most is situated in the central part of the Most Basin, approximately 2 km to the north from the city Most (Czech Republic). The water reservoir was formed in the endorheic depression of the former mining locations of the large mine Most—Ležáky and minor quarries Richard, Bedřich, Evžen—Ležáky II, Jan, Segen Gottes, Mariahilf. Flooding started in October 2008 and finished in September 2014. The surface level of the lake is 199 m above sea level (±60 cm), and its maximum depth is 75 m. Lake Most covers an area of 309.09 ha with a perimeter of 8956 m, while the lake’s catchment area is 1050 ha. The map of Lake Most is shown in
Figure 3a,b. The internal dump of the former Most mine forms the southern and eastern slopes of the lake, while the mine benches form the northern and western slopes. The main instabilities, such as slope failure and subsidence, are expected in the northern part due to dumping material and additionally to more steep slopes.
For the application of developed PRA methodology in Lake Most, firstly a zone of 400 m wide around the lake was selected to define the affected area A. Area A was discretized into small squares 20 × 20 m
2 and for every square the relative distance,
dr, and consequently the vulnerability was calculated (
Figure 4b). Based on geotechnical criteria the area,
A, was divided into four geotechnical domains. For each domain the safety factor and the resulting probability of failure, as indicated in
Figure 4a, were estimated. Finally, the risk was estimated for each square, assuming that the corrective measures are not applied. For the assignment of the consequences the linear scale of
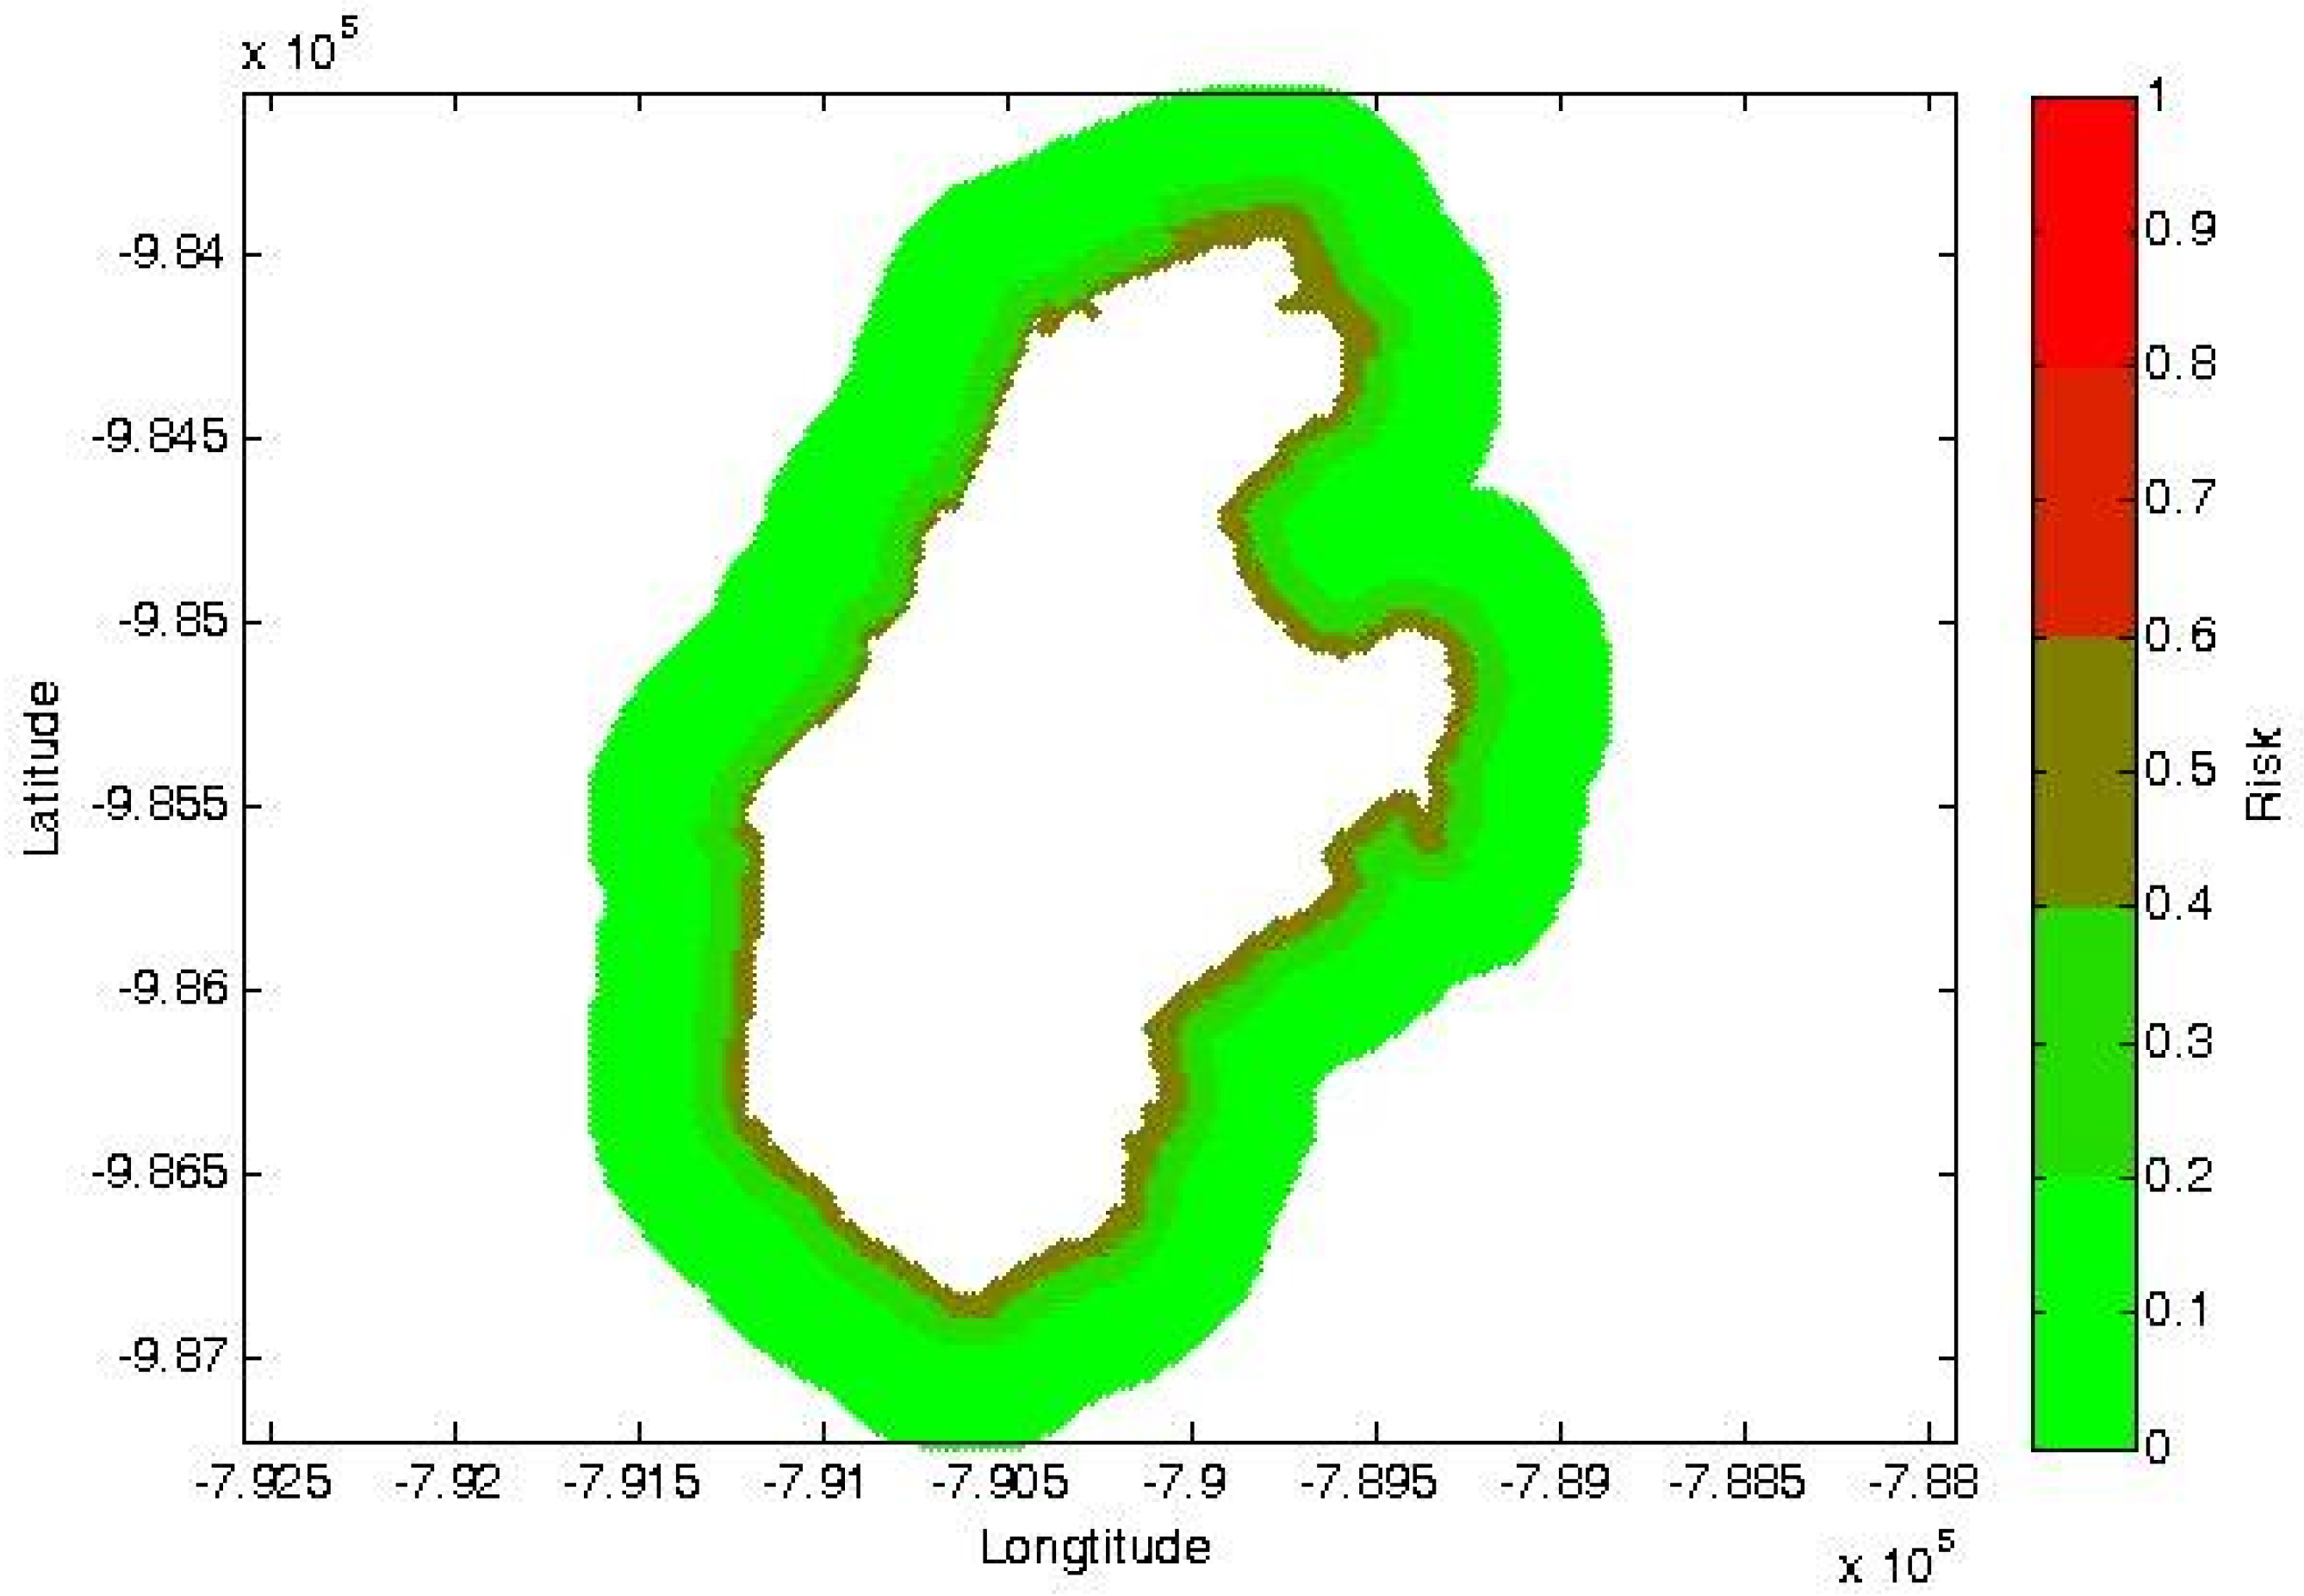
Table 1 was used. The resulting risk map is shown in
Figure 5.
The risk map indicates that the area with the higher risk in Lake Most is the third geotechnical domain (northern part) due to dump material and steeper slopes. In this domain, humans, infrastructure and the environment are more prone to risk within a zone of 100–125 m from the shoreline. This zone is limited to 75 m for the eastern and southern part of the lake (first and second domain) and to 25–50 m for the western part (fourth domain).
4. Conclusions
The developed generic methodology for the assessment of risks related to slope failures of pit lakes was proven helpful since it allows comprehensively analysis of the hazards and estimating the associated risk. The spatial analysis of risk and the created risk maps allow the identification of high risk locations in the examined area. Moreover, the methodology allows the reassessment of risk considering protective and corrective measures in order to evaluate the effect of measures on risk mitigation. The risk assessment performed in Lake Most, without considering any corrective measures, indicated that the northern part of the lake has the highest risk for all receptors.
Author Contributions
Conceptualization, M.G., E.S. and M.A.; methodology, M.G., V.D. and E.S.; software, V.D.; writing—original draft preparation, M.G., V.D.; writing—review and editing, S.R.; supervision, M.G. All authors have read and agreed to the published version of the manuscript.
Funding
This research was funded by European Commission, Research Fund for Steel and Coal, Project RAFF (Risk Assessment of Final pits during Flooding), Grant number 847299.
Institutional Review Board Statement
Not applicable.
Informed Consent Statement
Not applicable.
Data Availability Statement
Not applicable.
Acknowledgments
We acknowledge the VUHU Institute of Czech Republic for providing us the required information and data related to Lake Most.
Conflicts of Interest
The authors declare no conflict of interest. The funders had no role in the design of the study; in the collection, analyses, or interpretation of data; in the writing of the manuscript or in the decision to publish the results.
References
- McCullough, D.C.; Lund, A.M. Opportunities for Sustainable Mining Pit Lakes in Australia. Mine Water Environ. 2006, 25, 220–226. [Google Scholar] [CrossRef]
- Castro, J.M.; Moore, J.N. Pit lakes: Their characteristics and the potential for their remediation. Environ. Geol. 2000, 39, 1254–1260. [Google Scholar] [CrossRef]
- Schultze, M.; Pokrandt, K.-H.; Hille, W. Pit lakes of the Central German lignite mining district: Creation, morphometry and water quality aspects. Limnologica 2010, 40, 148–155. [Google Scholar] [CrossRef] [Green Version]
- Doupé, G.R.; Lymbery, J.A. Environmental Risks Associated with Beneficial End Uses of Mine Lakes in Southwestern Australia. Mine Water Environ. 2005, 24, 134–138. [Google Scholar] [CrossRef]
- Lazar, M. Stability and Ecological Reconstruction of the Land Affected by Mining; Reports of Professorship Surface Mining; Technische Universität Bergakademie: Freiberg, Germany, 2017. [Google Scholar]
- Burgess-Limerick, R.; Horberry, T.; Steiner, L. Bow-tie analysis of a fatal underground coal mine collision. Ergon. Aust. 2014, 10, 1–5. [Google Scholar]
- Chevreau, F.R.; Wybo, J.L.; Chauchois, D. Organizing learning processes on risks by using the bow-tie representation. J. HazMat 2006, 130, 276–283. [Google Scholar] [CrossRef] [PubMed]
- Burgess-Limerick, R. Bowtie Analysis of Mining Fatalities to Identify Priority Control Technologies; Report of NIOSH; The University of Queensland: Brisbane, Australia, 2016. [Google Scholar]
- Gibson, W. Probabilistic methods for slope analysis and design. AustrGeomech 2011, 46, 1–12. [Google Scholar]
- Kontogiannis, T. Ergonomic Approaches in Safety Management and Administration; Tziolas: Thessaloniki, Greece, 2019; p. 768. (In Greek) [Google Scholar]
| Publisher’s Note: MDPI stays neutral with regard to jurisdictional claims in published maps and institutional affiliations. |
© 2022 by the authors. Licensee MDPI, Basel, Switzerland. This article is an open access article distributed under the terms and conditions of the Creative Commons Attribution (CC BY) license (https://creativecommons.org/licenses/by/4.0/).


