
Quantitative Description of the Microstructure of Duplex Stainless Steels Using Selective Etching †

Abstract
:1. Introduction
2. Materials and Methods
3. DSS’s Etchants Overview
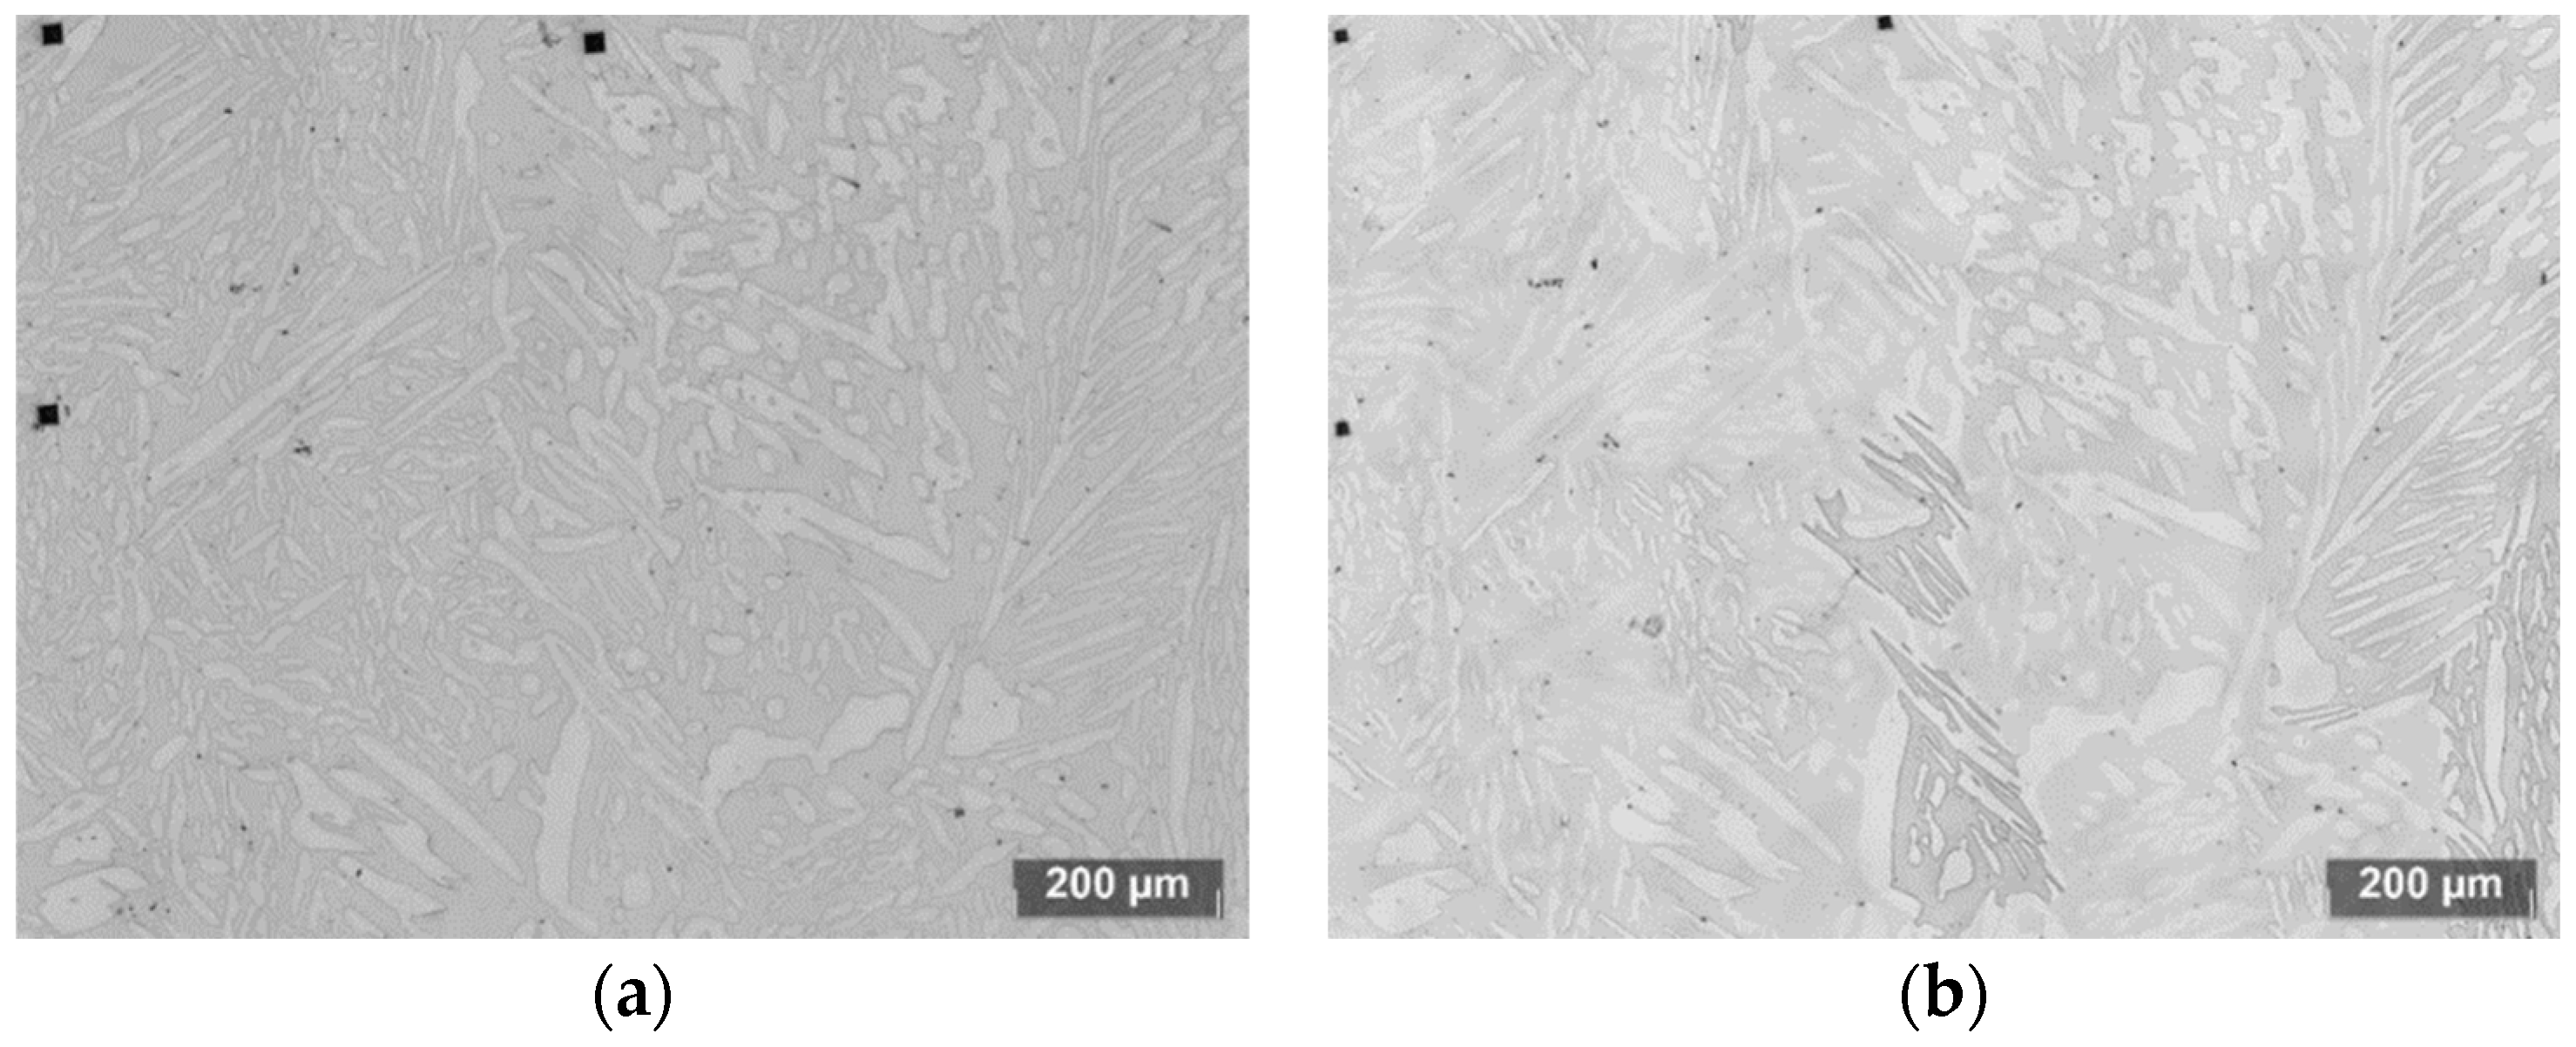
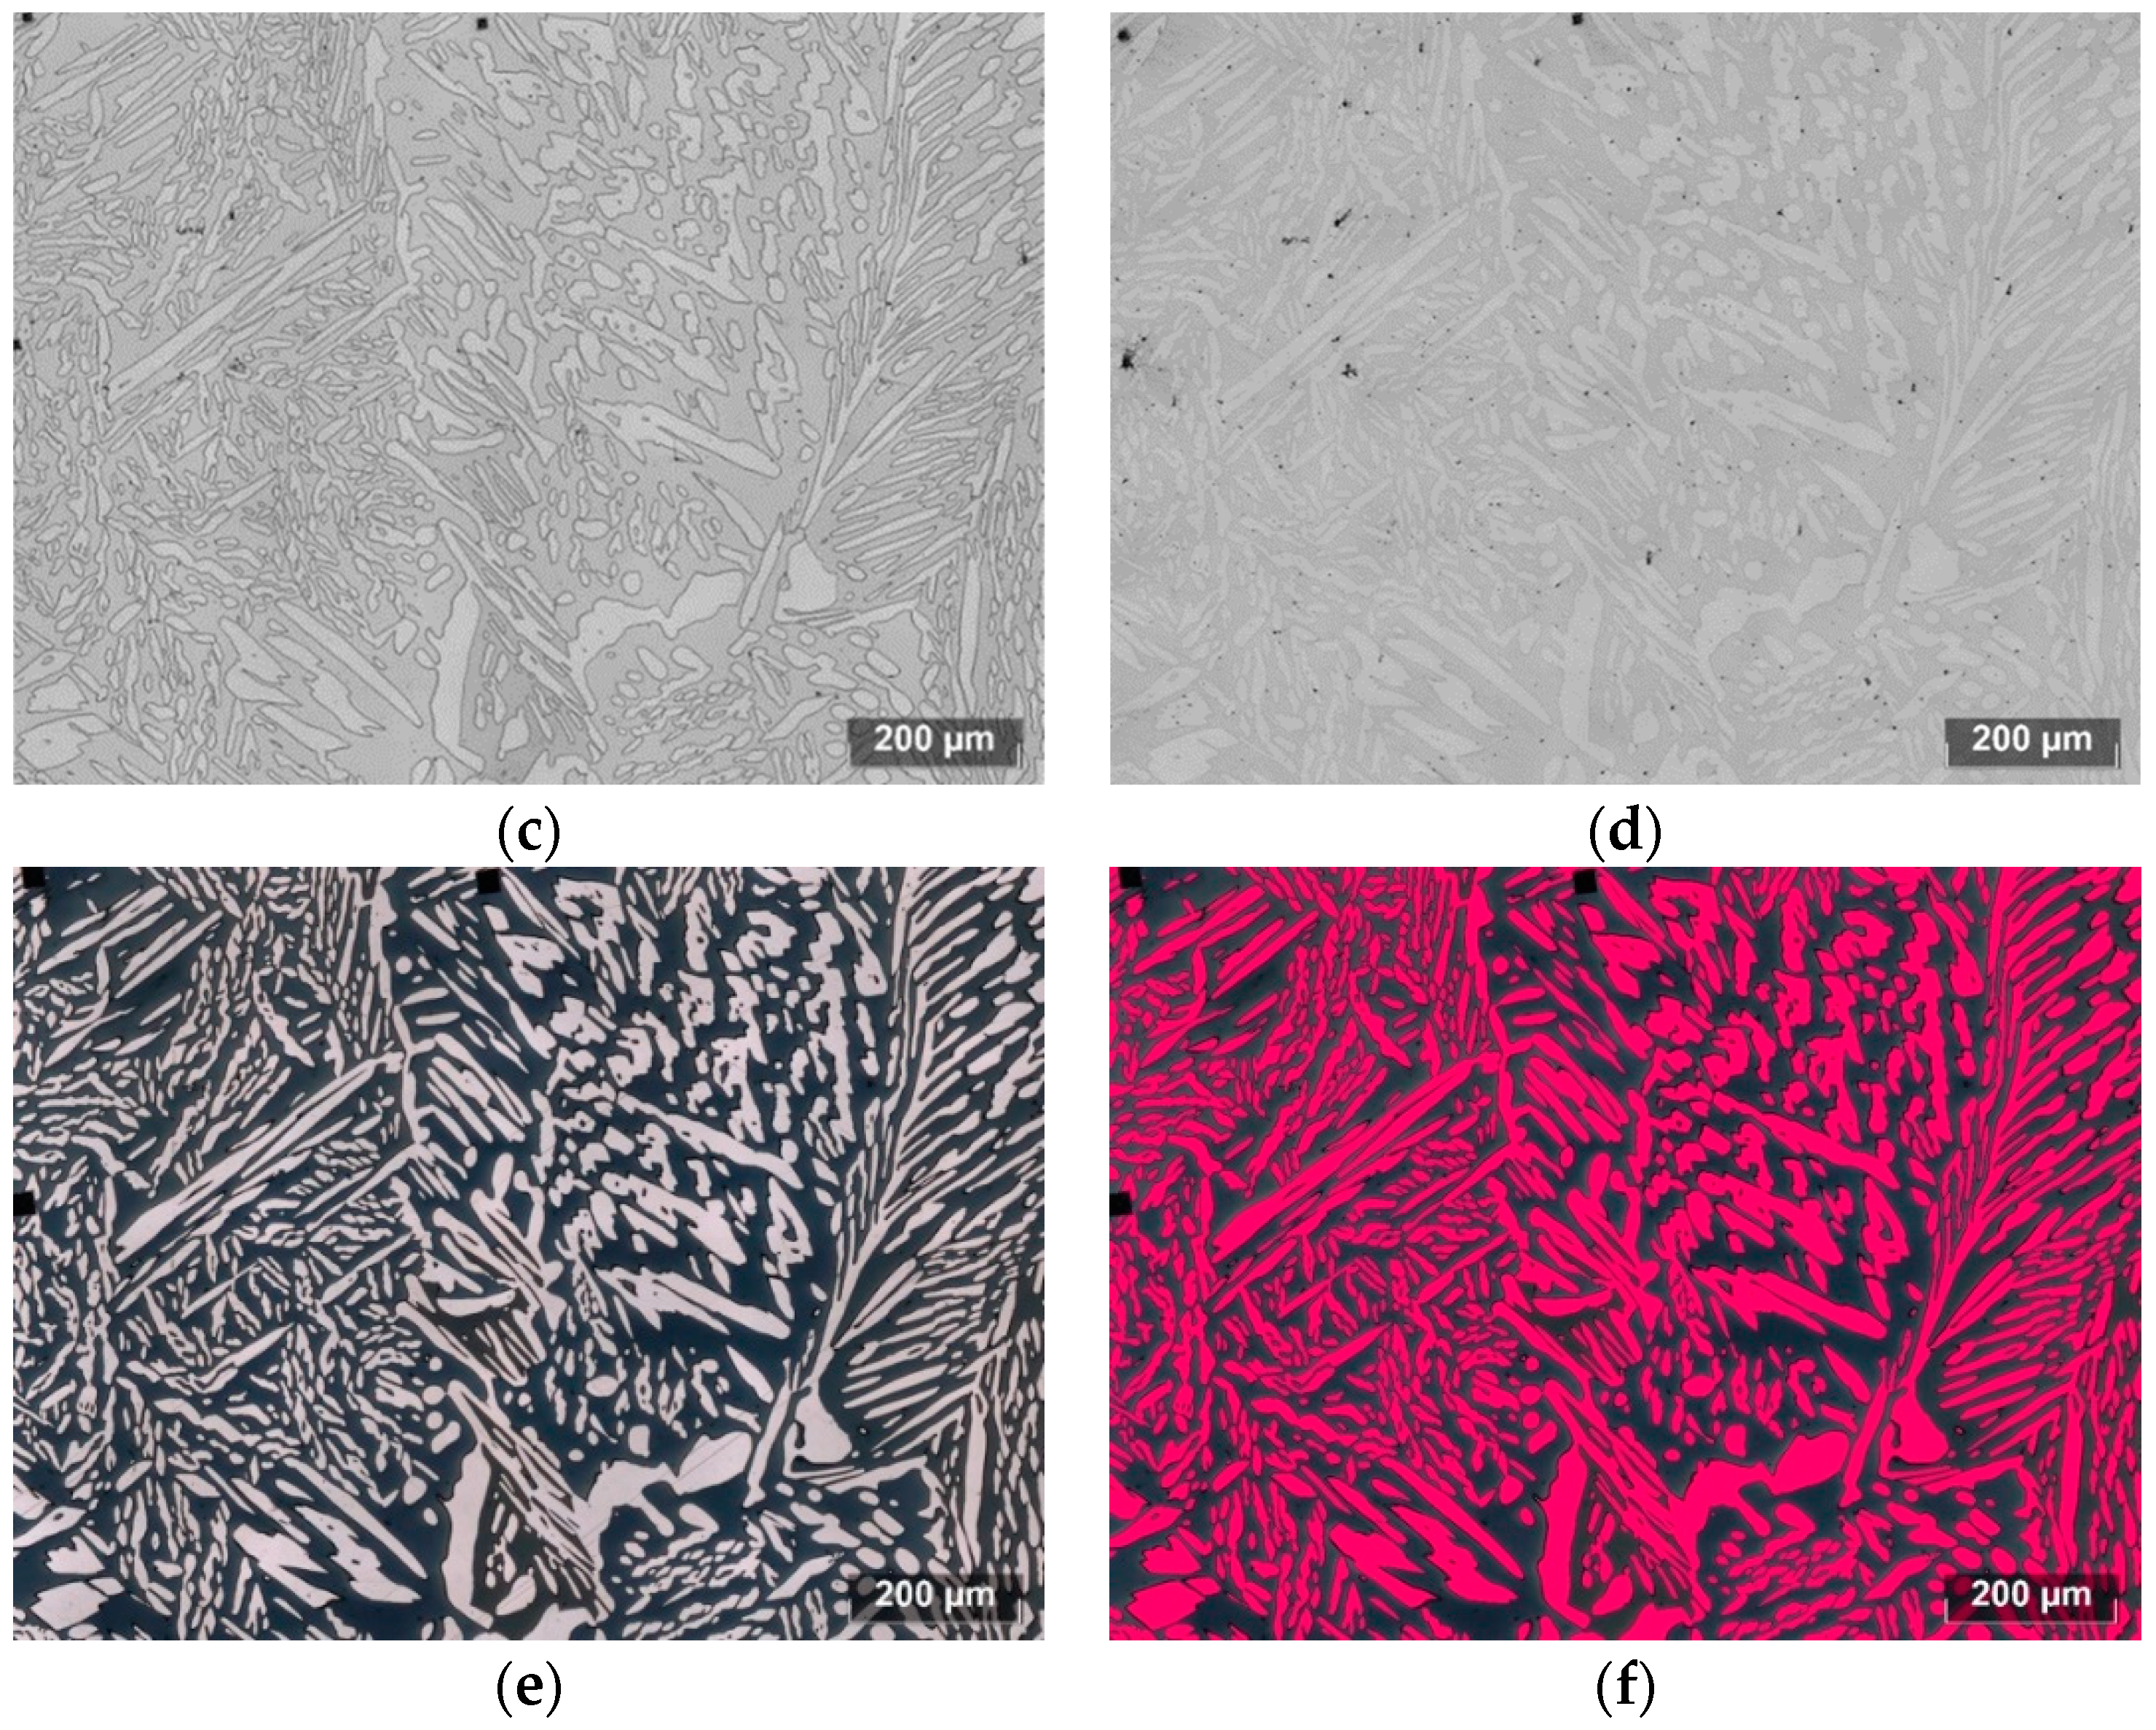
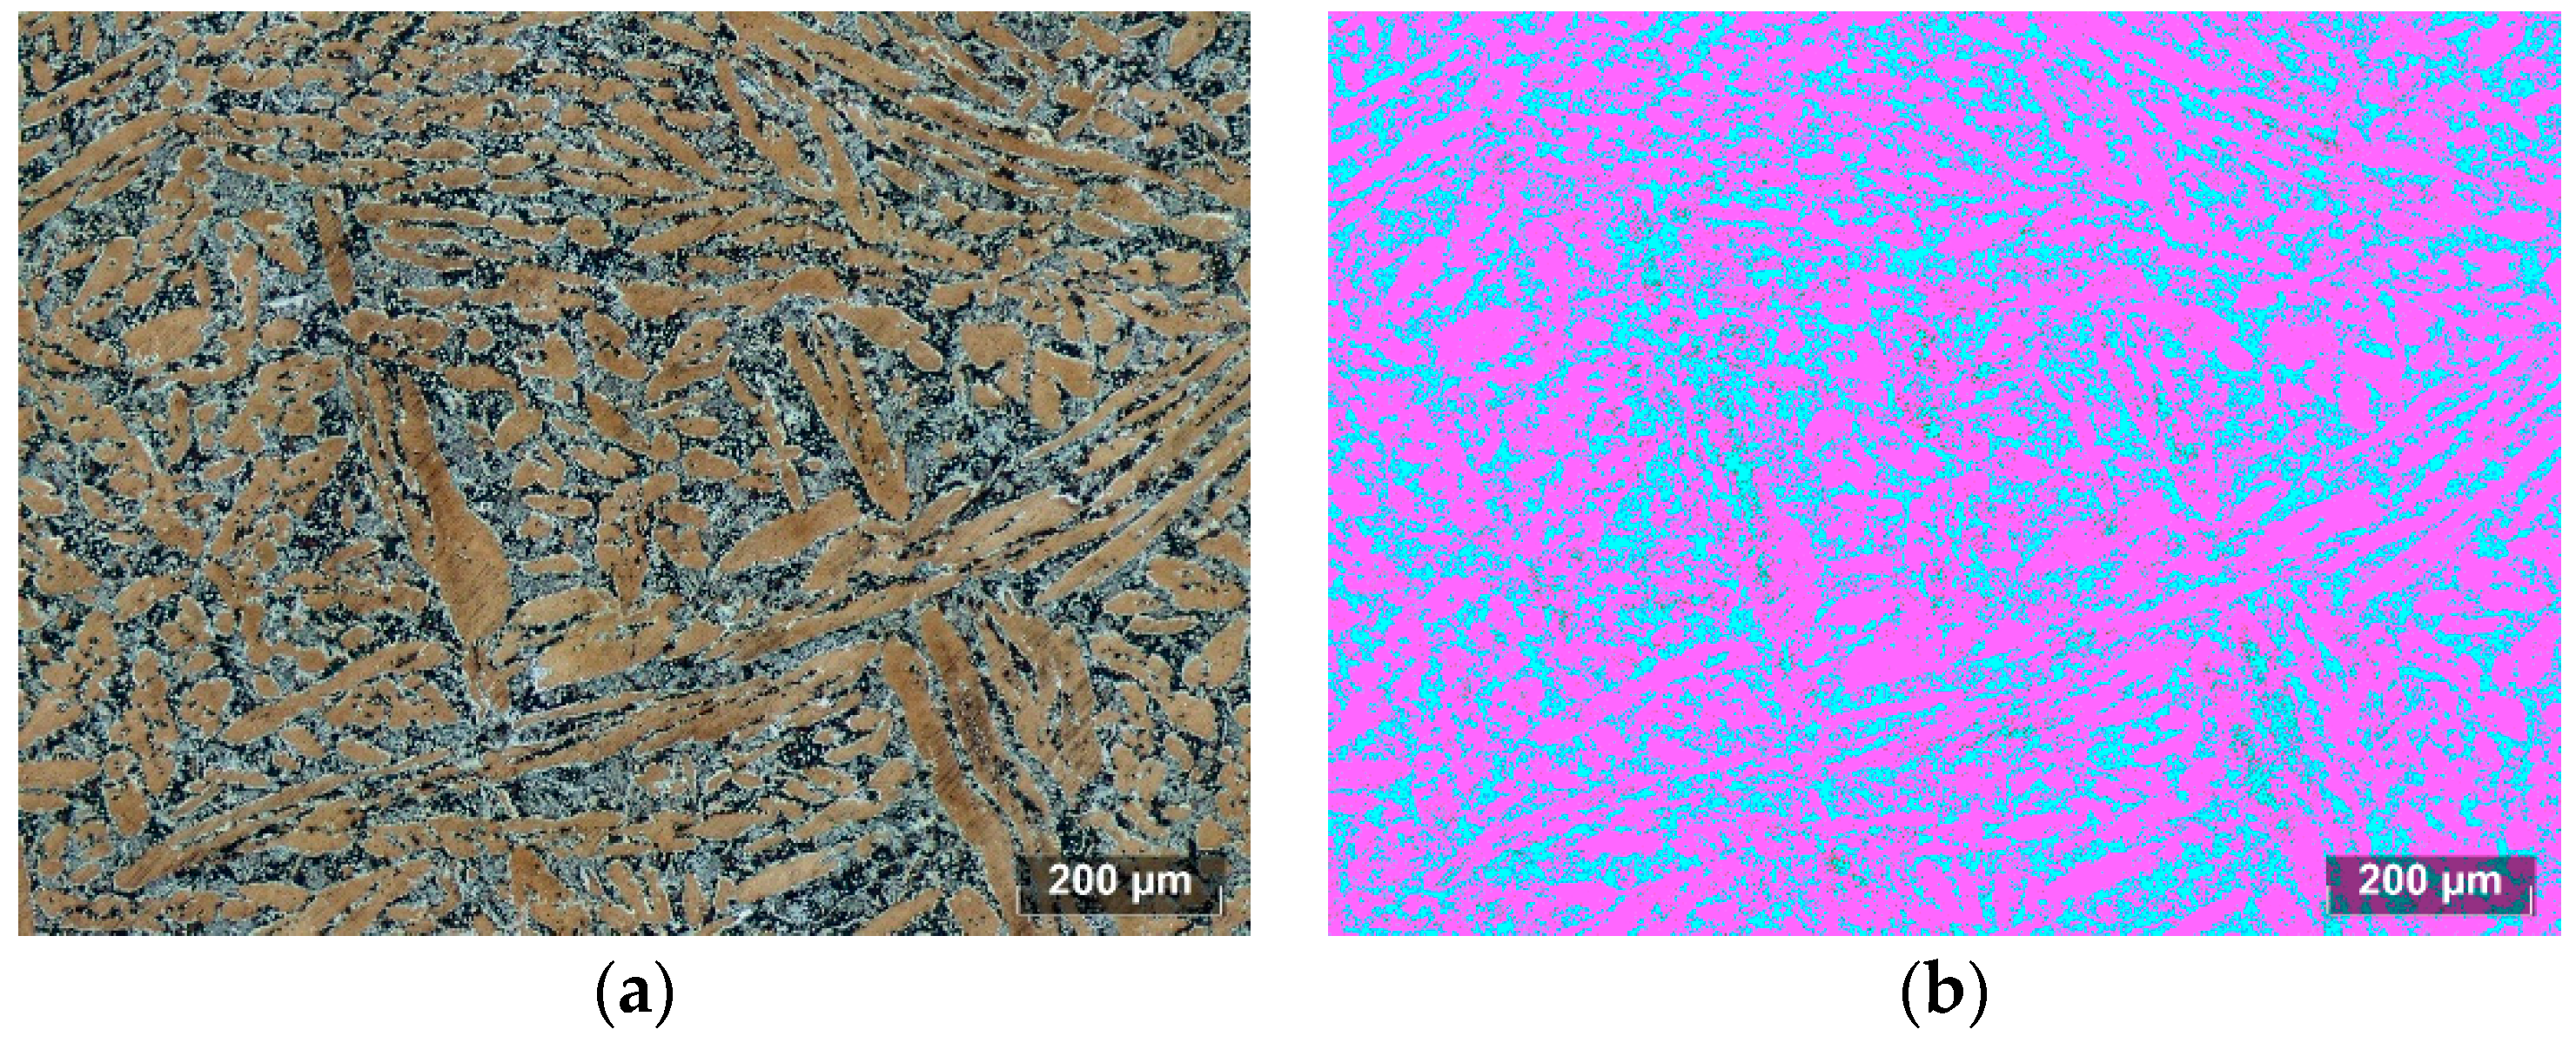
4. Etching Method Development
5. Analysis of DSS Specimens Obtained Using Different Heat Treatments
6. Conclusions
Funding
Informed Consent Statement
References
- Topolska, S.; Łabanowski, J. Effect of microstructure on impact toughness of duplex and superduplex stainless steels. J. Achiev. Mater. Manuf. Eng. 2009, 36, 142–149. [Google Scholar]
- Cojocaru, E.M.; Raducanu, D.; Nocivin, A.; Cinca, I.; Vintila, A.N.; Serban, N.; Cojocaru, V.D. Influence of Aging Treatment on Microstructure and Tensile Properties of a Hot Deformed UNS S32750 Super Duplex Stainless Steel (SDSS) Alloy. Metals 2020, 10, 353. [Google Scholar] [CrossRef]
- Davanageri, M.B.; Narendranath, S.; Kadoli, R. Influence of heat treatment on microstructure, hardness and wear behavior of super duplex stainless steel AISI 2507. Am. J. Mater. Sci. 2015, 5, 48–52. [Google Scholar]
- Forgas Júnior, A.; Otubo, J.; Magnabosco, R. Ferrite quantification methodologies for duplex stainless steel. J. Aerosp. Technol. Manag. 2016, 8, 357–362. [Google Scholar] [CrossRef]
- ASTM E112-13. Standard Test Methods for Determining Average Grain Size; ASTM International: West Conshohocken, PA, USA, 2013; www.astm.org. [Google Scholar]
- ASTM E1245-03(2016). Standard Practice for Determining the Inclusion or Second-Phase Constituent Content of Metals by Automatic Image Analysis; ASTM International: West Conshohocken, PA, USA, 2016; www.astm.org. [Google Scholar]
- ASTM E1268-19. Standard Practice for Assessing the Degree of Banding or Orientation of Microstructures; ASTM International: West Conshohocken, PA, USA, 2019; www.astm.org. [Google Scholar]
- Kazakov, A.A.; Zhitenev, A.I.; Fedorov, A.S.; Fomina, O.V. Development of duplex stainless steels Сompositions. CIS Iron Steel Rev. 2019, 18, 20–26. [Google Scholar]
- Martins, M.; Casteletti, L.C. Sigma phase morphologies in cast and aged super duplex stainless steel. Mater. Charact. 2009, 60, 792–795. [Google Scholar] [CrossRef]
- Andersson, J.O.; Helander, T.; Höglund, L.; Shi, P.; Sundman, B. Thermo-Calc & DICTRA, computational tools for materials science. Calphad 2002, 26, 273–312. [Google Scholar]
- Michalska, J.; Sozańska, M. Qualitative and quantitative analysis of σ and χ phases in 2205 duplex stainless steel. Mater. Charact. 2006, 56, 355–362. [Google Scholar] [CrossRef]
- Llorca-Isern, N.; López-Luque, H.; López-Jiménez, I.; Biezma, M.V. Identification of sigma and chi phases in duplex stainless steels. Mater. Charact. 2016, 112, 20–29. [Google Scholar] [CrossRef]
- Fedorov, A.; Zhitenev, A.; Strekalovskaya, D. Effect of heat treatment on the microstructure and corrosion properties of cast duplex stainless steels. E3S Web of Conferences, 2021; Volume 225, 1003. [Google Scholar]
- Vander Voort, G.F.; Manilova, E.P. Hints for imaging phases in steels. Adv. Mater. Process. 2005, 163, 32–37. [Google Scholar]
- ASTM A1084-15a. Standard Test Method for Detecting Detrimental Phases in Lean Duplex Austenitic/Ferritic Stainless Steels; ASTM International: West Conshohocken, PA, USA, 2015; www.astm.org. [Google Scholar]
- Calliari, I.; Zanesco, M.; Bassani, P.; Ramous, E. Analysis of secondary phases precipitation in duplex stainless steels. 2009. [Google Scholar]
- ASTM E562-19e1. Standard Test Method for Determining Volume Fraction by Systematic Manual Point Count; ASTM International: West Conshohocken, PA, USA, 2019; www.astm.org. [Google Scholar]
- Magnabosco, R. Kinetics of sigma phase formation in a duplex stainless steel. Mater. Res. 2009, 12, 321–327. [Google Scholar] [CrossRef]


| Steel | Element, wt.% | ||||||||
|---|---|---|---|---|---|---|---|---|---|
| C | Si | Mn | Ni | Mo | N | Cu | Ti + Nb + V | Cr | |
| 1 | 0.02 | 0.6 | 1.6 | 6 | 0.50 | 0.04 | 0.17 | 0.06 | 21 |
| 2 | 23 | ||||||||
| 3 | 26 | ||||||||
| 4 | 0.03 | 0.5 | 1.0 | 6 | 4.00 | 0.20 | 2.50 | 0.10 | 23 |
| № | Name | Composition | Notes | Ref. |
|---|---|---|---|---|
| Chemical etching | ||||
| 1 | Inhibited ferric chloride | 100 mL water, 5 g FeCl3, 1 g NaNO3 | It identifies detrimental phases in lean DSSs | [15] |
| 2 | Sodium Hydroxide | 100 mL water, 40 g NaOH | It identifies detrimental phases | [11] |
| 3 | Modified Beraha (Beraha’s sulfamic acid reagent No. 4) | 100 mL water, 3 g K2S2O5, 2 g sulfamic acid, 0.5–1 g NH4F · HF | It identifies phases in high-alloy steels upon immersion for 30–180 s | [14] |
| 4 | Beraha | 20 mL HCl, 80 mL water, 1 g K2S2O5 | It reveals ferrite. Etch by immersion until the formation of tint | [12,14] |
| 5 | Carpenter | 85 mL ethanol, 15 mL HCl | It identifies grain boundaries and σ-phase. Etch by immersion for 15–45 min | [12,14] |
| 6 | Murakami | 100 mL water, 10 g NaOH, 10 g K3Fe(CN)6 | It reveals ferrite when heated up to 80–100 °C, reveals carbides at room temperature | [13,14] |
| 7 | “Glyceregia” | 15 mL HCl, 10 mL glycerol, 5 mL HNO3 | It reveals grain boundaries and σ-phase | [11] |
| Electrolytic etching | ||||
| 8 | HNO3 | 60% nitric acid | It identifies ferrite and σ-phase when etched at 2.2 V for 10 s | [13] |
| 9 | NaOH | 100 mL water, 20 g NaOH | It identifies ferrite and σ-phase when etched at 3 V for 10 s | [14] |
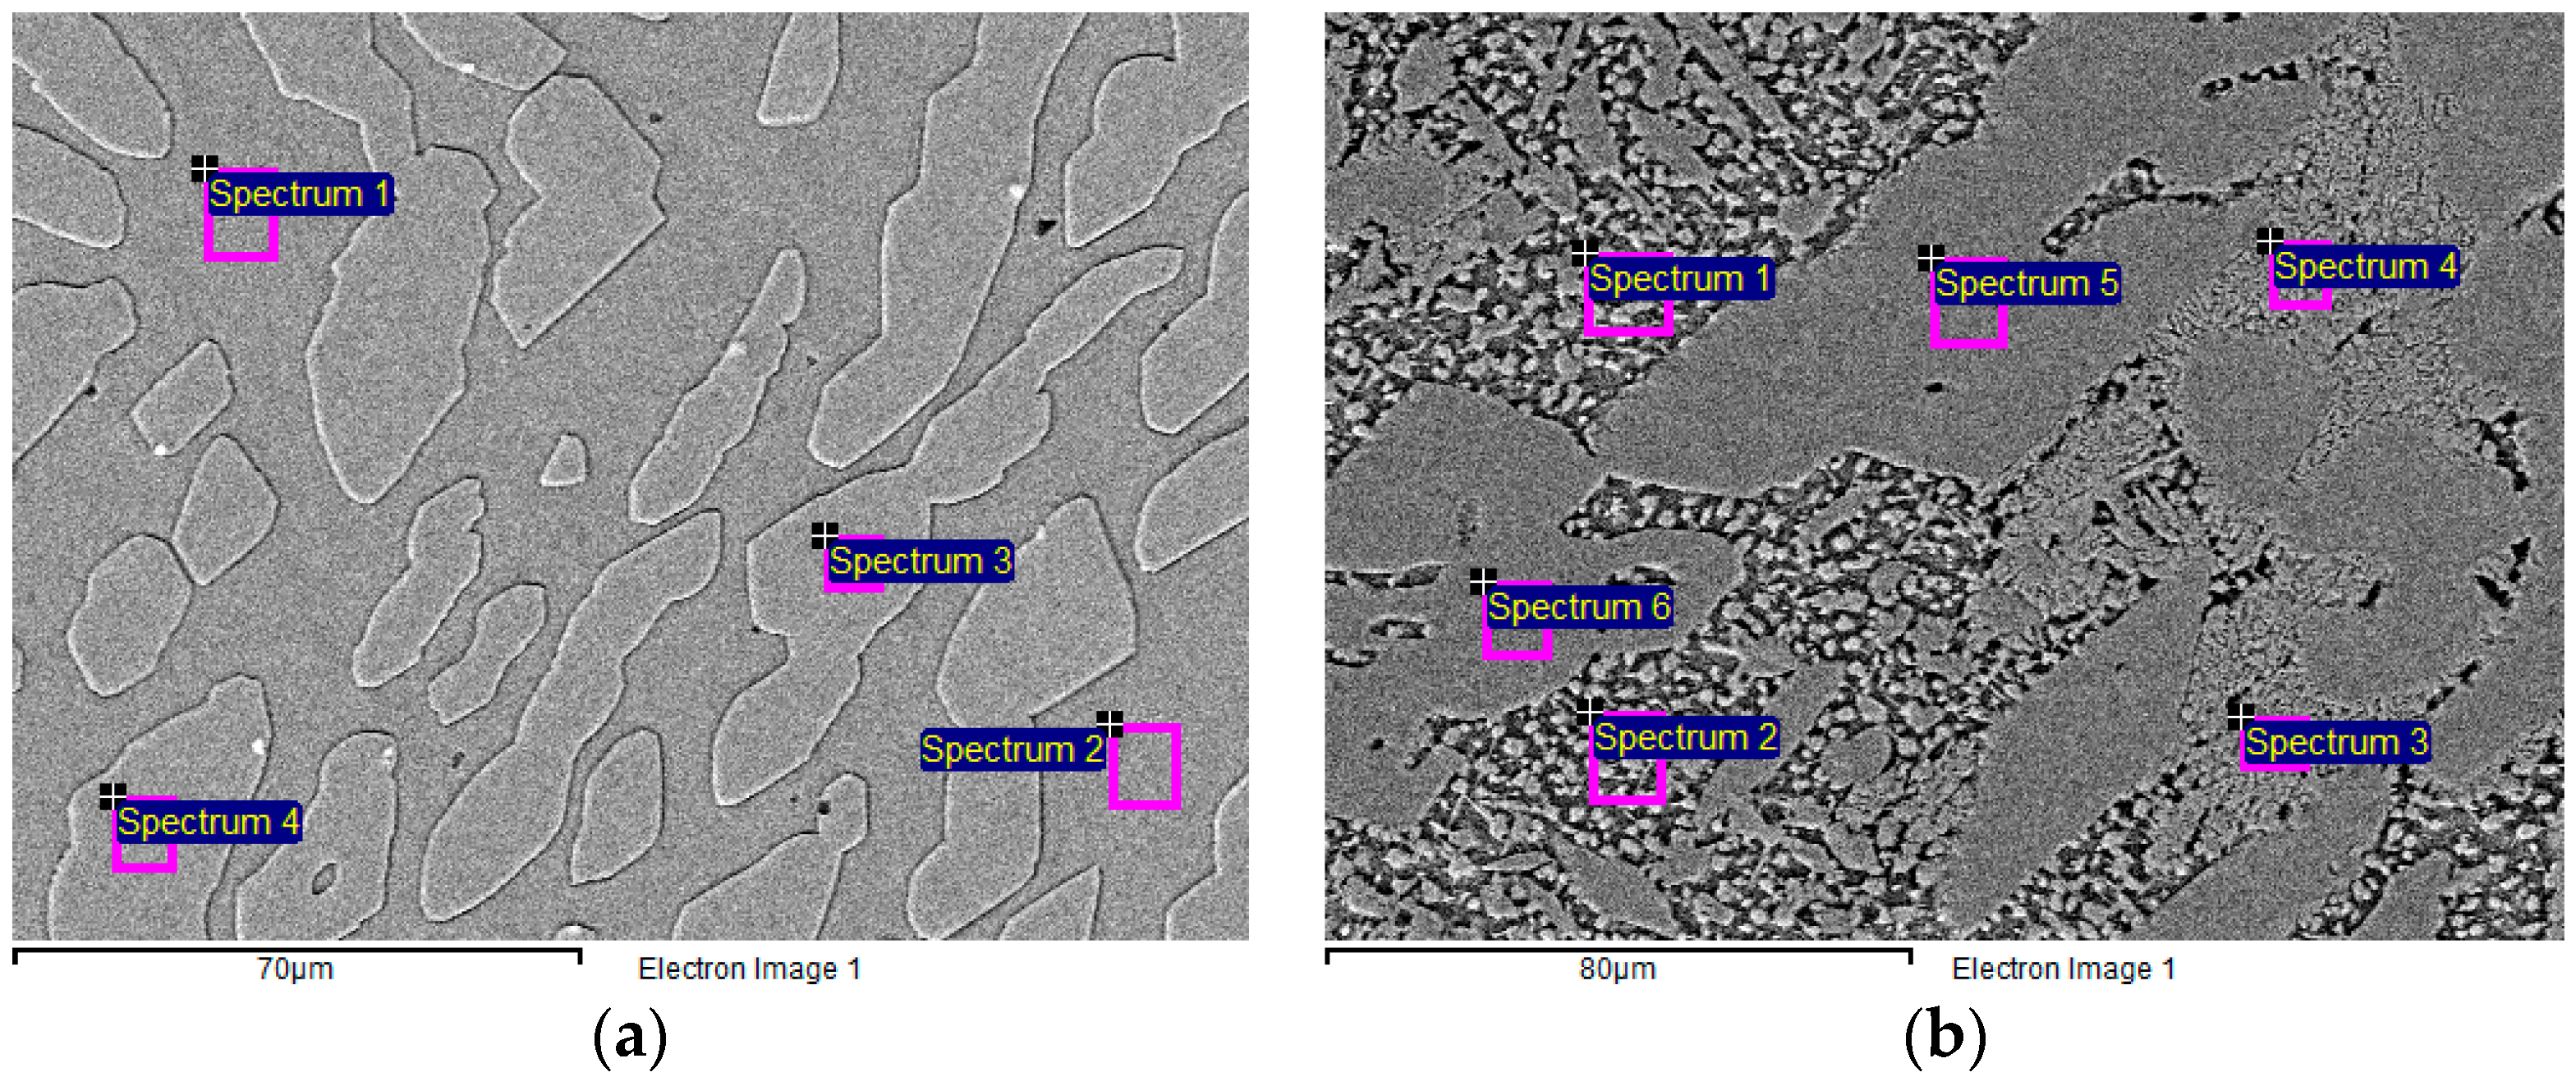
| № | Spectrum (Figure 3) | Element, wt% | Phase | ||||
|---|---|---|---|---|---|---|---|
| Cr | Ni | Mo | Mn | Si | |||
| Steel 1, quenched from 1200 °C (to Figure 3a) | |||||||
| 1 | 1 | 23.3 | 5.4 | 1.9 | 1.5 | 0.7 | δ |
| 2 | 2 | 23.0 | 5.7 | 2.5 | 1.5 | 0.8 | |
| 3 | 3 | 20.1 | 7.5 | 1.0 | 1.8 | 0.7 | γ |
| 4 | 4 | 20.2 | 7.2 | 1.1 | 1.6 | 0.7 | |
| Steel 4, quenched from 1050 °C, annealing at 850 °C for 15 min (to Figure 3b) | |||||||
| 5 | 5 | 25.0 | 8.0 | 4.2 | 1.4 | 0.5 | γ |
| 6 | 6 | 25.0 | 7.7 | 4.6 | 1.4 | 0.6 | |
| 7 | 3 | 28.2 | 5.1 | 8.0 | 1.2 | 0.7 | δ |
| 8 | 4 | 28.5 | 5.1 | 8.1 | 1.1 | 0.6 | |
| 9 | 1 | 25.8 | 6.2 | 12.3 | 1.2 | 0.6 | σ |
| 10 | 2 | 26.0 | 5.8 | 12.4 | 1.2 | 0.7 | |
| Steel | Quenching Temperature | Austenite Content | ||
|---|---|---|---|---|
| Automatic Analysis after Etching with Beraha’s etchant, vol.% | Measurements by the Systematic Manual Point Count Method after Electrolytic Etching with NaOH, vol.% | Thermodynamic Modeling, wt.% | ||
| 1 | 1050 | 61.0 | 64.5 | 67.7 |
| 1100 | 57.8 | 63.0 | 61.2 | |
| 1150 | 52.1 | 53.5 | 52.3 | |
| 1200 | 43.0 | 47.5 | 42.6 | |
| 1250 | 42.7 | 53.5 | 30.2 | |
| 2 | 1050 | 44.8 | 58.5 | 51.9 |
| 1100 | 39.1 | 46.0 | 45.0 | |
| 1150 | 27.4 | 27.5 | 36.7 | |
| 1200 | 18.5 | 15.5 | 26.8 | |
| 1250 | 15.0 | 7.0 | 15.0 | |
| 3 | 1050 | 25.9 | 39.0 | 32.6 |
| 1100 | 17.2 | 27.5 | 25.4 | |
| 1150 | 8.9 | 6.0 | 17.2 | |
| 1200 | 0.2 | 3.0 | 7.9 | |
| 1250 | 0.1 | 0.0 | 0.0 | |
| Holding Time, min | Volume Fraction, % | ||
|---|---|---|---|
| Austenite | Ferrite | σ-Phase | |
| 15 | 62.4 | 17.2 | 20.4 |
| 30 | 64.2 | 18.4 | 17.4 |
| 60 | 42.8 | - | 57.2 |
Publisher’s Note: MDPI stays neutral with regard to jurisdictional claims in published maps and institutional affiliations. |
© 2021 by the authors. Licensee MDPI, Basel, Switzerland. This article is an open access article distributed under the terms and conditions of the Creative Commons Attribution (CC BY) license (https://creativecommons.org/licenses/by/4.0/).
Share and Cite
Fedorov, A.; Zhitenev, A.; Strekalovskaya, D.; Kur, A. Quantitative Description of the Microstructure of Duplex Stainless Steels Using Selective Etching. Mater. Proc. 2021, 3, 4. https://doi.org/10.3390/IEC2M-09387
Fedorov A, Zhitenev A, Strekalovskaya D, Kur A. Quantitative Description of the Microstructure of Duplex Stainless Steels Using Selective Etching. Materials Proceedings. 2021; 3(1):4. https://doi.org/10.3390/IEC2M-09387
Chicago/Turabian StyleFedorov, Aleksandr, Andrey Zhitenev, Darya Strekalovskaya, and Aleksandr Kur. 2021. "Quantitative Description of the Microstructure of Duplex Stainless Steels Using Selective Etching" Materials Proceedings 3, no. 1: 4. https://doi.org/10.3390/IEC2M-09387