Proceeding Paper

Determination of the Reaction Rate Controlling Resistance of Goethite Iron Ore Reduction Using CO/CO2 Gases from Wood Charcoal †

1
Department of Mechanical Engineering, Edo State University Uzairue, 200099 Auchi, Nigeria
2
Department of Mechanical Engineering, University of Ibadan, 200284 Ibadan, Nigeria
*
Author to whom correspondence should be addressed.
Presented at the 1st International Electronic Conference on Metallurgy and Metals, 22 February–7 March 2021; Available online: https://iec2m.sciforum.net.
Mater. Proc. 2021, 3(1), 27; https://doi.org/10.3390/IEC2M-09373
Published: 1 March 2021
(This article belongs to the Proceedings of The 1st International Electronic Conference on Metallurgy and Metals)

Abstract

:
In the present work, an attempt is made to use non-contact charcoal in the reduction of run-off mine goethite ore at heating temperatures above 570 °C. The reduction mechanism was adopted, following Levenspiel’s relations for the shrinking core model at different stages of reduction. The non-contact charcoal reduction approach is adopted to maximize the benefit of using CO/CO2 gases from charcoal for reduction without the need for beneficiation and concentration. The rate-controlling steps for the reduction kinetics of average particle sizes 5, 10, 15, and 20 mm at 570, 700, 800, 900, and 1000 °C were studied after heat treatment of the ore-wood charcoal at a total reduction time of 40 min using activated carbon reactor. Scanning Electron Microscopy (SEM) and Energy Dispersive X-ray (EDX) analyses were done to investigate the spectrometric phase change and metallic components of the ore sample after reduction, respectively. The average percentage of the metallic iron content (56.6, 60.8, and 61.7%) and degree of metallization (91.62, 75.96, and 93.6%) are achieved from the SEM/EDX analysis of the reduced ore sample at reduction temperatures of 570, 800, and 1000 °C, respectively. The results indicate the tendency for high carbon deposit at the wustite stage of the reduction process at the lowest of temperature 570oC and the residence time of at 10 min. This study demonstrates that diffusion through the ash layer is the controlling resistance of the overall reduction process.

1. Introduction

It is a well-established assertion that iron is rated as the fourth most abundant element, Okoro, et al. [1], and it is considered the most abundant rock-forming element, constituting 5% of the earth’s crust, Kiptarus, et al. [2], that is being explored worldwide for engineering applications. To acquire iron metal in its elemental form, the impurities must be removed from its ore via a chemical reduction process since it is rarely found in its free state (Alamsari, et al. [3]; Babich, et al. [4]. The need to extract it from its oxide form and convert it to its pure metallic form through direct or indirect reduction of iron-oxide has become a crucial research concern in recent years [5]. Aside from the many conventional techniques for carrying out reduction reactions on sourced iron ore, the associated reduction reaction kinetics using natural reductants (coal, charcoal, etc.) are attracting intense research interest [6,7]. Arising from the challenges associated with acquisitions of coking coal in many ore mines of iron, research attempts for experimental, investigative analyses of the kinetics of direct reduction of iron ore using reducing gases from charcoal as the reducing agent has become highly quintessential. The attempts are necessary to bypass the coking coal Blast Furnace (BF) process. The use of a BF is considered the popular reduction process for iron ore, worldwide [8]. The blast furnace is a plant used for iron ore reduction by charging iron ore with metallurgical coke (Heikkila et al. [8], Cecca et al. [9]) and the usual limestone for the removal of its impurities. The exorbitant operation cost implications of the BF further hinder the use of the BF process [10,11]. In sequel to the aforementioned, it is vital to have a basic understanding of the basic mechanism involved in the sulfur-free Direct Reduction process using charcoal as the reductant. Some chemical governing equations would be required to estimate reduction time steps of the ore, rate of reaction, reaction control time, conversion factor, swelling extent, degree of metallization, and other relevant parameters at the selected time step intervals and operating temperatures.
The kinetics of the reduction of iron ore generally involve a study of the rate of iron oxide conversion to metallic iron by the removal of oxygen as the chemical reaction rate increases with temperature, whereas in indirect reduction processes, iron is reduced in its solid-state, the maximum temperature is lower than the melting temperature and the reaction rates are slower. In the direct reduction of iron ore, the mechanisms are complex because the oxide is expected to undergo a series of stepwise changes for the process of conversions to be complete [12]. The slowest step in the process is the determinant of the overall reaction rate. This is often referred to as the rate-controlling step. Dydo, et al., [13] reiterates that the path of reduction of hematite iron ore using CO/CO2 at low reduction temperature can take the following schemes: Fe2O3 → Fe3O4 → Fe (below 570°) and Fe2O3 → Fe3O4 → FeO → Fe (above 570°). The mechanism of Fe2O3 → Fe3O4 reduction necessitates the transformation of an oxygen sublattice combined with iron atoms’ dislocation. The second step of Fe3O4 → Fe reduction entails the nucleation sites of the metallic Fe phase. The third step of Fe3O4→ FeO reduction does not require any transformation of the oxygen sublattice. It can take place at higher temperatures of above 570 °C. As a result of the reverse disproportionation reaction, the reduction mechanism becomes a more intricate process in a two-step sequence, such as FeO → Fe3O4 → Fe, or even a three-step sequence, such as FeO → Fe3O4 → FeO → Fe reduction at a temperature higher than 570 °C [14]. Although iron oxide’s reduction behaviors are similar for all characterized iron ores, they are strongly influenced by the particle size, crystallinity, and conditions of the temperature-, time-, and reaction rate control-dependent reduction [15].
In Jozwiak et al. [16] and Kowitwarangkul et al. [17], reduction kinetics of iron ore lumps by H2 and CO mixtures at different chemical compositions are reported. Their study revealed that the reaction rate is linearly proportional to the reactant gases (H2 and CO). Mania [18] and Mania [19] carried out an experimental analysis on the reduction kinetics of different types of samples, such as pellets, fines, and powders by thermo-gravimetric analysis (TGA) methods. The influence of iron oxide density on the reduction extent and reduction rate of hematite ore using the H2–CO gas mixture as the reducing agent was investigated by Levenspiel [20] and Kumar et al. [21]. The outcome garnered from the study describes how the iron ore pellets prepared at different reduction temperatures (700 °C and 950 °C) often contain some carbon deposition [18,22]. Reduction kinetics of iron ore using coal and charcoal placed simultaneously in an externally heated cylindrical container positioned in a muffle furnace have been studied. Reduction temperatures ranging from 850 to 1000 °C were used to study the reduction kinetics potential of coal and charcoal as reductants [19,23]. Despite the laudable research efforts that have been made, as indicated in the foregoing review, the literature neither explains how to ascertain the reaction controlling the resistance of the reduction processes, nor gives a detailed description of the stage-by-stage reaction kinetics of the direct reduction process of the iron ore samples. Therefore, this paper entails the kinetic study of the reduction of a selected goethite iron ore lump by CO/CO2 gases from wood charcoal using a locally fabricated reactor (activated carbon furnace) under isothermal conditions for a specified reduction time. The reduction kinetics of the goethite hematite ore is also extensively investigated by visual inspection using appropriate reduction kinetic equations for solid–solid reactions. The Scanning Electron Microscopy (SEM) and Energy Dispersive X-ray (EDX) analyses are used to determine the rate-controlling resistance of the reaction with the experimental procedure as described below.

2. Materials and Methods

2.1. Experimental Procedure and Sample Preparation

In this present work, three sets of commercially obtained goethite iron ore lumps of several weights and sizes were used. Each set of samples was categorized into Set-I (5–9.99 mm), Set-II (10–14.99 mm), and Set-III (15–20 mm), as shown in Figure 1. The initial sizes and weights of the iron ore samples were measured individually using the digital Vernier caliper and the weighing balance.

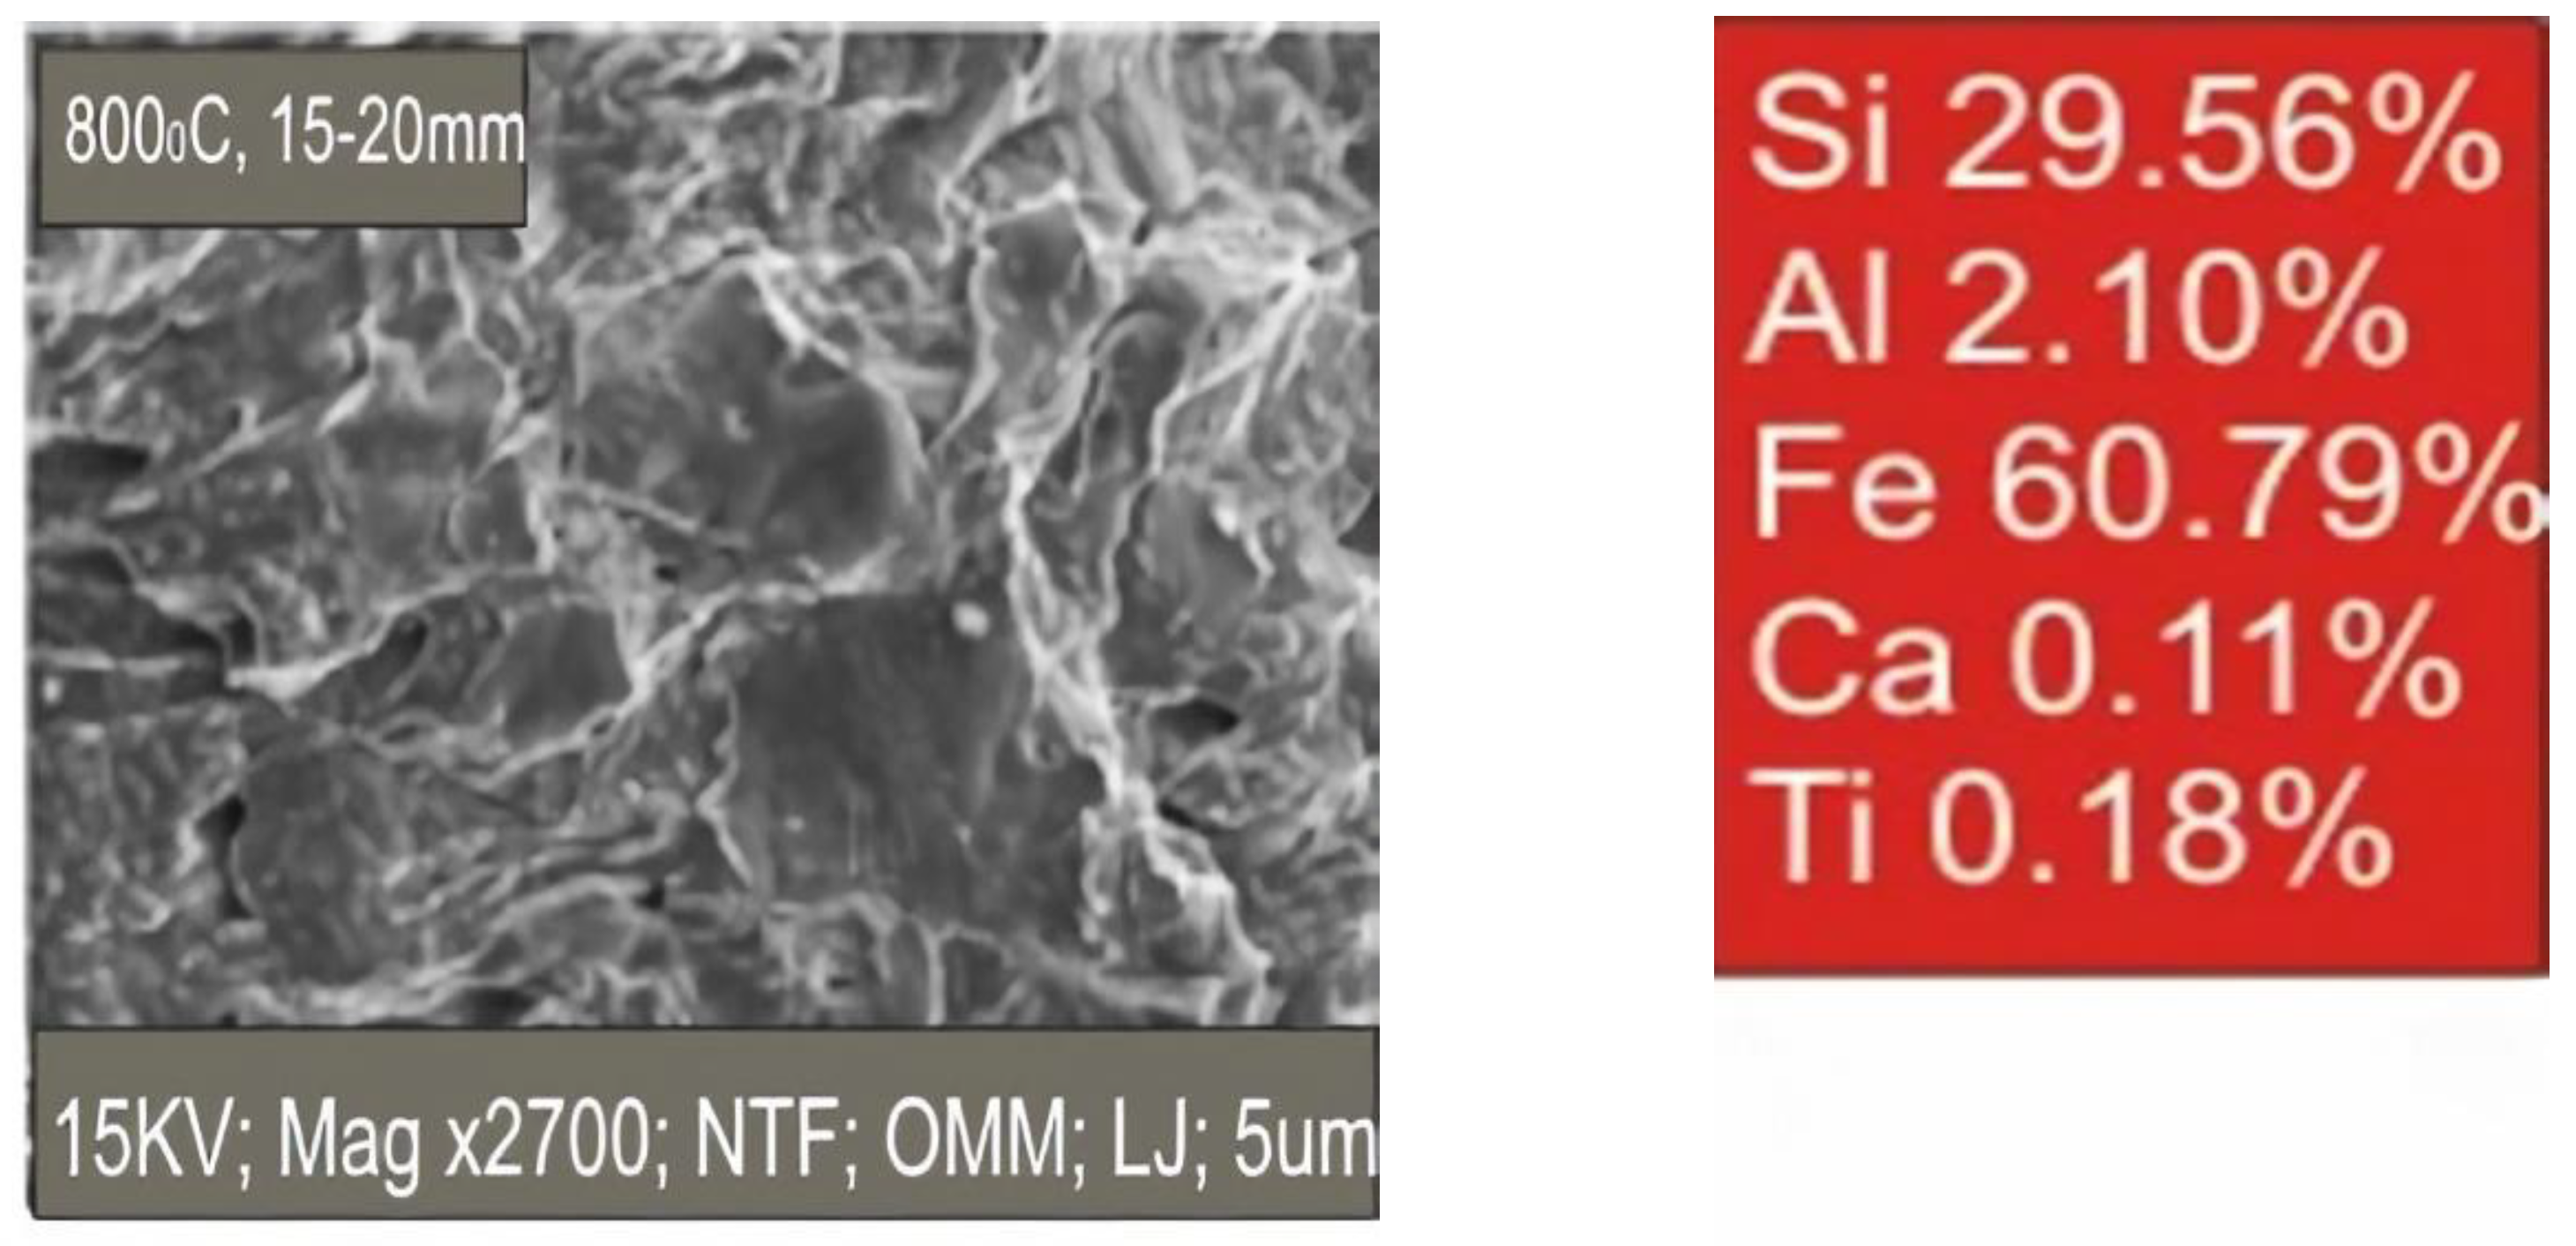
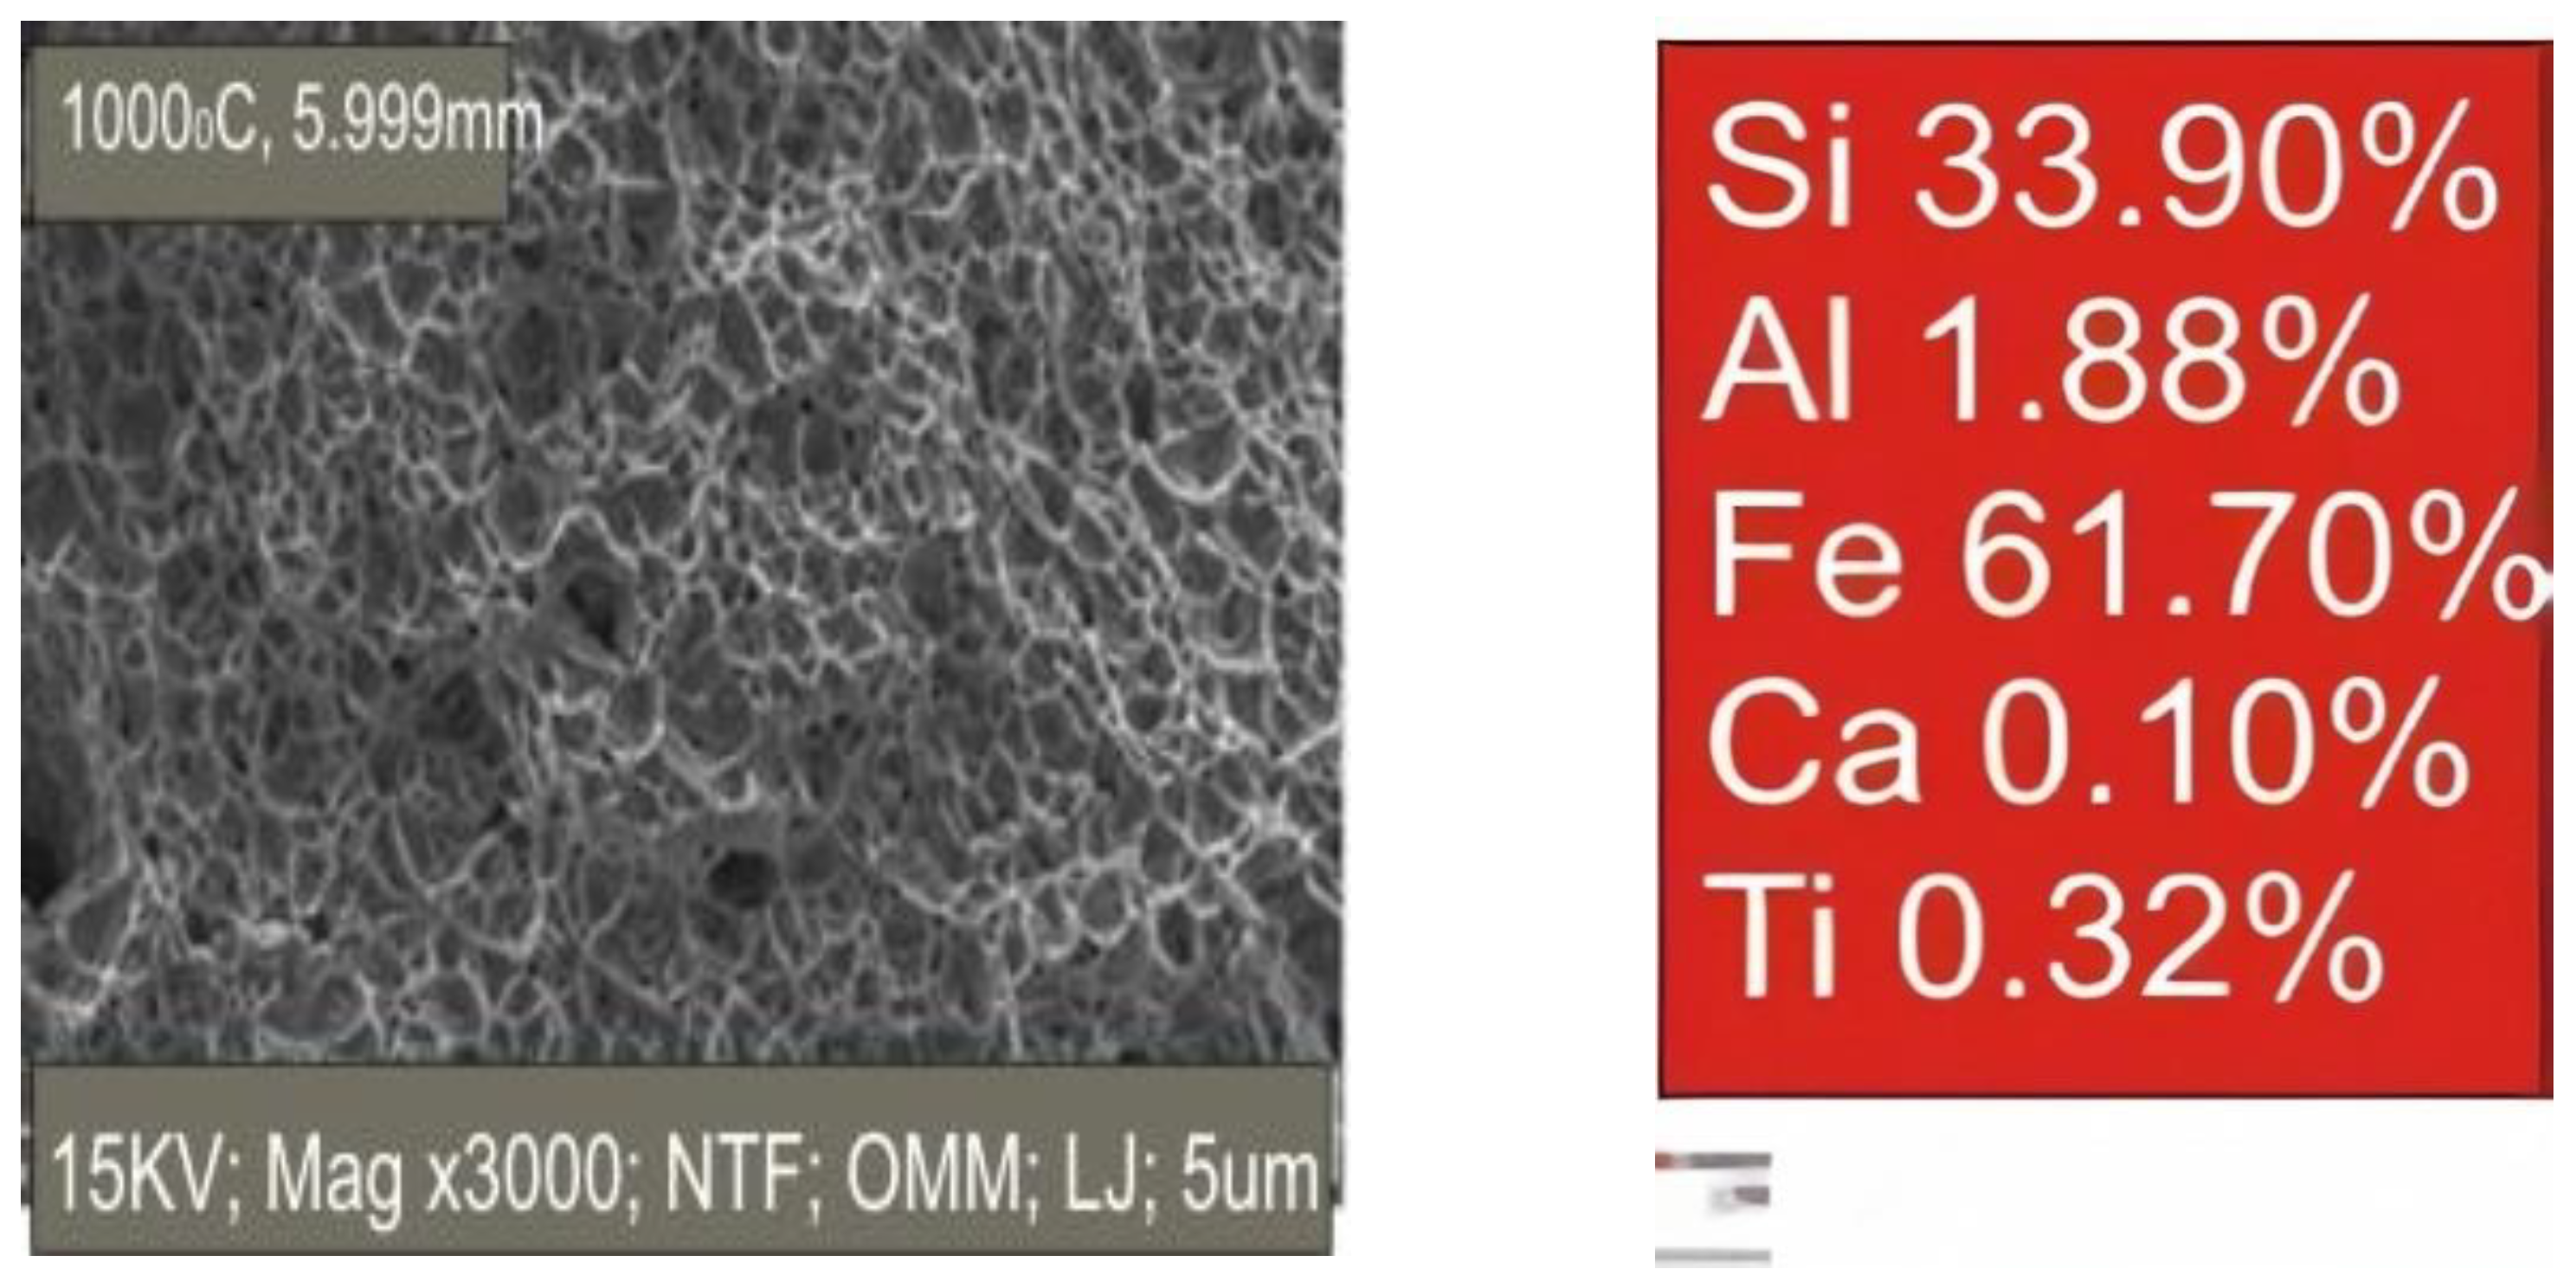
2.1.1. Chemical Composition of Goethite Ore Lump

Similar methods of compositional examination were reported by Al-Eshaikh et al. [24], Ofoegbu, [25], Li et al. [26], Wu et al. [27], Muhammad et al. [28], Sekunowo et al. [29], Babalola et al. [30], and Omole et al. [31]. The composition of the commercially acquired goethite hematite ore lumps was analyzed using an X-ray diffraction diffractometer with the goethite hematite ore chemical formula: Goethite Ore (Fe2H4O5, Fe1.698O3Sn0.228) and Fe2O3•H2O·xH2O, Fe1.698Sn0.228O3 [32]. The particle chemical compositions by weight are shown in Table 1. The sizes of the particles linked with the gas–solid contact surface area. The larger the area was, the tendency to experience a higher reduction degree could be obtained from similar work done [33].

2.1.2. The Reduction Reactor: Activated Carbon Furnace

The Activated Carbon Furnace used in this present work consists of hollow chambers with a rectangular cross-section and convenient spacing, which can readily contain the crucibles made of molded clay with the samples to be heat-treated in the reactor. A reasonable amount of charcoal was placed in the hollow chamber where heat was generated before the reduction time of 10, 20, 30 and 40 min could be measured under an airtight condition at a specified temperature, based on Gibbs free energy temperature profile for hematite reduction to wustite (Ogbezode et al. [32], Mousa et al. [34]) using a digital stop-watch. The properties of charcoal mixed with the ore were not described in this present work, but the effect of carbon monoxide penetration on the different goethite iron ore sample sizes was investigated. The reduced ore samples were also characterized using the SEM/EDX analysis to ascertain the degree of metallization and microstructure elemental composition of the iron ore constituents [35].
The reduced samples were investigated in their lump form after successful measurement of the weight and size (radius) of the sample using the digital Vernier caliper and weighing balance, respectively. The iron ore in the right proportion by weight (grams) was placed into the reactor while the reactor was heated to the right temperatures of 570, 700, 800, 900, and 1000 °C for a partial reduction time step of 10, 20, 30, and 40 min. The heated ore lump samples were cooled under the atmospheric condition, and the size (mm) and weight (grams) measurements were retaken using the same aforementioned measuring instrument. The partially reduced heated samples with the longest reduction time of 40 min for 570, 800 and 1000 °C, were taken to the laboratory where the X-ray Diffraction (XRD), Scanning Electron Microscopy (SEM), and Energy Dispersion X-ray (EDX) techniques were used to reveal the microstructural phases formed at these temperatures, and to further study the variation in the relative composition of the phases in the three different shapes of iron ore–charcoal composite lumps before and after the reduction experiment, as shown in Figures 16–20. The kinetics of the reduction analysis of the specimen is examined for a different residence time step of the particle, rate of reaction, conversion factor, reaction control time, degree of metallization, and swelling extent of the reduced ore; they are progressively determined using useful kinetic equations as previously described. The ratios of the partial reduction time to complete reduction time for the fractional radius of the reduction were ascertained.

2.2. Degree of Reduction and Swelling Extent

The reaction kinetics used in this present work is the shrinking core model equations, as illustrated in Equations (1)–(11). The derived kinetic model equations from the existing literature of Alamsari et al. [3], Levenspiel [20], and Srinivasan [36] showed the relationship between the residence time, reaction control time, and conversion factor expression for various shapes of the direct reduced iron (DRI) particles for the shrinking-core model. All the reduced hematite ore samples maintained their original lump shape, and the degrees of reduction and swelling were calculated by using the following formulas, as deduced by Prakash [37] and Yunyun [38]:
D e g r e e   o f   R e d u c t i o n   ( % ) = ( W o W t W ) × 100 %
where W0 is the initial weight of the sample, Wt is the weight of the sample at time t, and ∞, W is the theoretical weight of the oxygen present in the samples for complete reduction;
S w e l l i n g   i n d e x   ( % ) = ( V f V i V i ) × 100 %
where V i is the initial volume of the pellet/lump ore and V f is the volume of the ore lump after reduction for a given time.

2.3. Kinetics and Mechanism of Reduction

Developed according to Levenspiel’s relations for the shrinking core model, the five steps occurring in succession for fluid–solid and solid–solid reactions are illustrated in Figure 2. For consistency, the description of the five (5) steps involved in the reaction kinetics was adopted as follows:
  • Step 1: Surrounding film diffusion of reactant A through solid particle surface.
  • Step 2: Penetration of A through the blanket of ash to the surface of the unreacted core.
  • Step 3: Reaction of gaseous reactant A with solid at the reaction surface.
  • Step 4: Solid exterior surface by diffusion of gaseous products through ash.
  • Step 5: Diffusion of gaseous products through the gas film back into the main body of the fluid.
In some situations, some of these steps do not exist. For example, if no gaseous products are formed, steps 4 and 5 do not contribute directly to the resistance of the reaction. Additionally, the resistances of the different steps usually vary greatly from one to another. In such cases, there is a need to consider that step with the highest resistance to be the rate-controlling resistance. In this treatment, conversion equations were formulated for spherical particles in which steps 1, 2, and 3, in turn, were rate-controlling stages. The analysis was then extended to non-spherical particles and to situations where the combined effect of these three resistances was required to be considered. The conversion equation for spherical particles in which steps 1, 2, and 3 were the rate-controlling steps was developed. Further analysis was then extended to non-spherical particles in a situation where the combined effect of the three resistances was required to be considered.

2.3.1. Diffusion through Gas Film Controls

Attention is focused on the unchanging exterior surface of a particle from the stoichiometry Equations (1)–(3) as shown in Equations (3) and (4).
A(fluid) + bB(Solid) Fluid product Solid product Fluid and Solid product }
The stoichiometry of the equation: d N B = b d N A
1 S e x d N A d t = 1 4 π R 2 d N B d t = b 4 π R 2 d N B d t = b K g ( C A g C A s ) = b K g C A g = C o n s t a n t
Taking the limit of the integral from R   t o   r c   a n d   0   t o   t i m e   τ ,   where   τ is the time for complete conversion of the particle, then r c = 0 . Therefore, the radius of the unreacted core in terms of fractional time or conversion factor for the complete conversion is given as:
t τ = [ 1 ( r c R ) 3 ] = X B

2.3.2. Diffusion through Ash Layer Controls

Here, the resistance to diffusion through the ash layer is assumed to control the rate of reaction. The relationship between the time and radius of the ore with a constant heat flux is described in Equations (6) and (7).
d N A d t = 4 π r 2 Q A = 4 π R 2 Q A S = 4 π r c 2 Q A C = C o n s t a n t
Integrating across the layer from R to r c and taking the limits C A C = 0   and C A C = C A g where other variables remain constant, thus, taking further integration between R = r c   to r c and from 0 to any particular time ‘t’ at the complete conversion of particle r c = 0 , the required fractional time/conversion factor is expressed as:
t τ = [ 1 3 ( r c R ) 2 + 2 ( r c R ) 3 ]
Recall Equation (5) and substitute it into Equation (7), we have:
t τ = [ 1 3 ( 1 X B ) 2 3 + 2 ( 1 X B ) ]

2.3.3. Chemical Reaction Controls

Consider the chemical reaction itself as the rate resistance control based on the unreacted core unit surface for the stoichiometry. This yields Equation (9).
1 S e x d N A d t = b 4 π r c 2 d N A d t = = b K C A g = C o n s t a n t
Integrate and make t the subject of the relation, and let τ be the required time for complete conversion   r c = 0 .
Therefore, the decrease in radius or increase in fractional conversion in terms of τ is given as:
t τ = 1 r c R
Recall Equation (5) and substitute into Equation (10) to obtain the relationship for time conversion as follows:
t τ = [ 1 ( 1 X B ) 1 3 ]
Equations (5), (8) and (11) are the analogy to the general symbols that refer to the diffusion through gas film diffusion through ash layer c, the chemical reaction controls are the relation used to determine the rate-controlling process to ascertain the possible reduction resistance between the ore particles and the CO/CO2 gases are the rate-controlling resistance, where r c = radius   of   the   unreacted   core ,   t = initial   residence   time ,   τ = final   residence   time ,   R = radius   of   the   particle ,   t τ = time   fraction ,   X B = conversion   rate .
Thus, the derived kinetic reduction equations as expressed above are used to analyze the relationship between the time and radius of the reduced iron ore to ascertain the rate-controlling steps at each stage of the reduction processes, as culled from Levenspiel [20] and Srinivasan [36].

2.4. Method of Data Analysis of Reduced Hematite product

The method of data collection and analysis used in this research work was derived by taking visual inspection of the reduced ore lump, which entails the measuring of the initial and final weight, and particle sizes. Other reduction parameters, such as volume change, which was measured manually, swelling index, and percentage of the degree of reduction in the process are achieved and, using Microsoft Excel version 2010, manually inputted for easy plotting of graphs and variations of other relevant parameters as related to the objectives of this work.
The microstructures and chemical compositions of samples were investigated by using Scanning Electron Microscopy (SEM) equipped with Energy Dispersive X-ray (EDX) spectroscopy. Combustion tests were applied for the analysis of carbon contents in the number of ore lumps reduced by H2-CO mixtures from the charcoal at a specified preheated temperature. X-ray powder diffraction was used for the identification of different phases in samples for their empirical content by chemical composition.

3. Results and Discussion

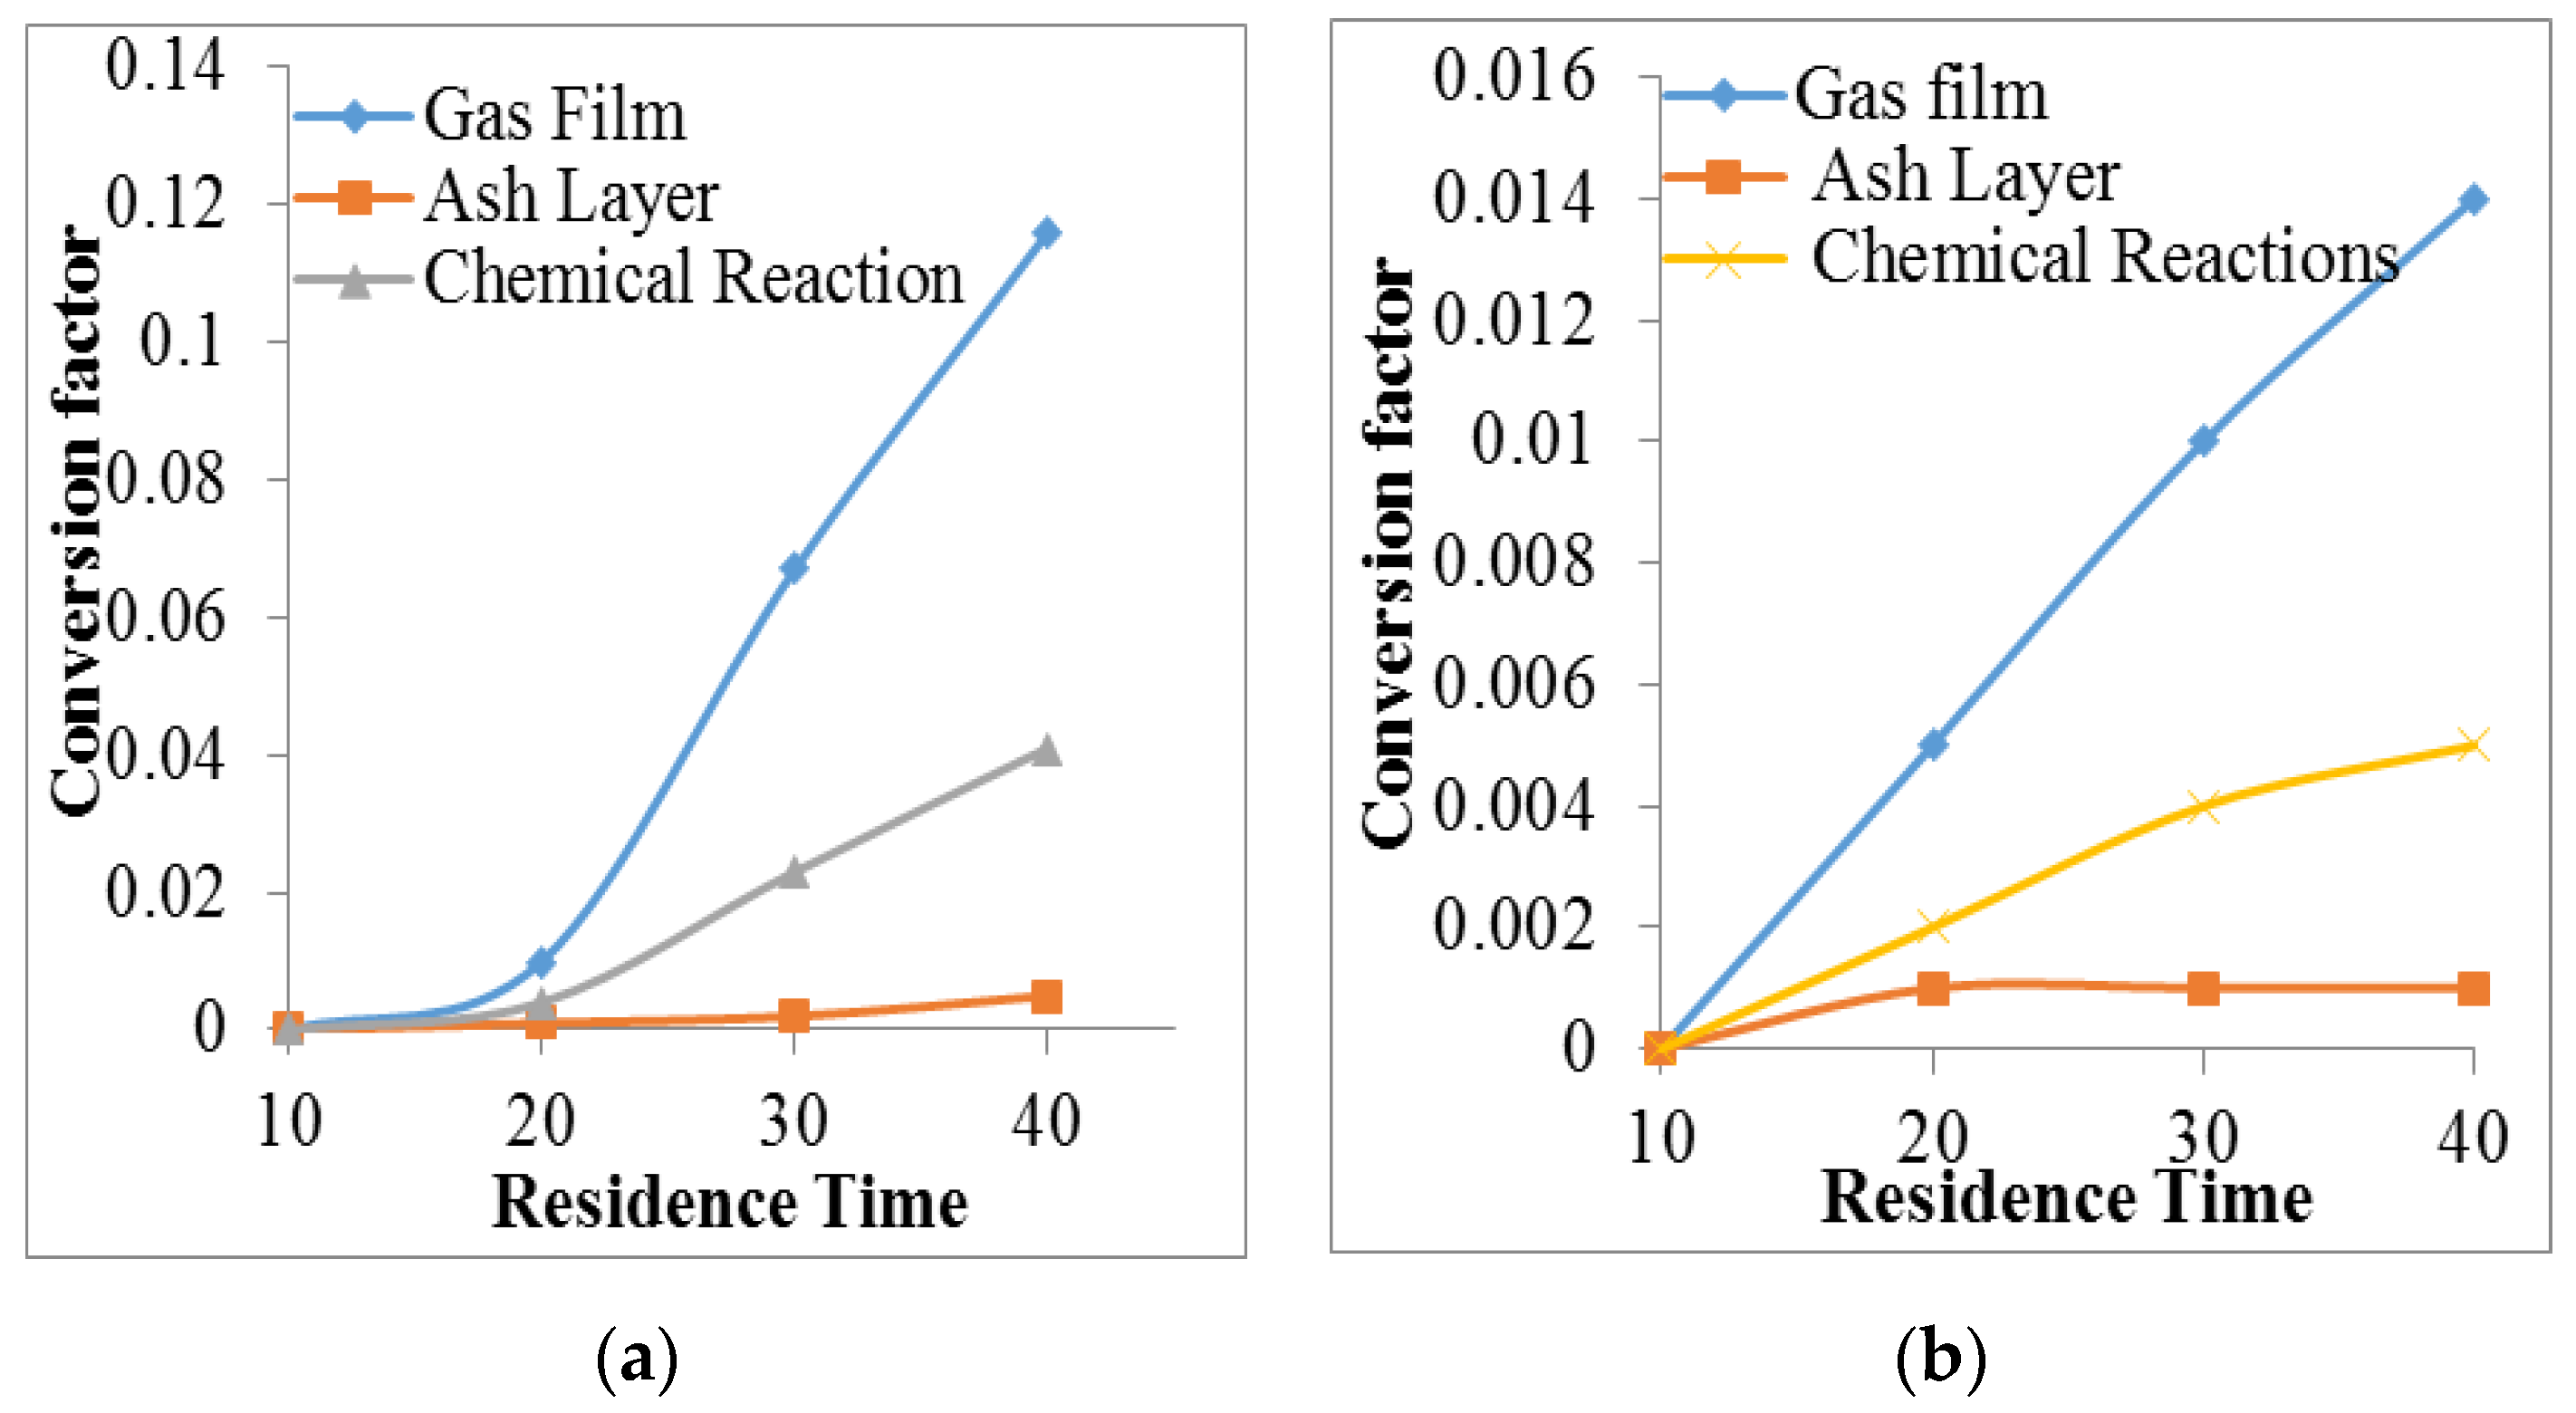
3.1. Effect of Reduction Time on Conversion Factor

The reaction rate conversion factor, which is defined as the ratio between the reaction residence time and reaction control time, is used to determine the rate-controlling stage (i.e., gas film, ash layer, and chemical control stage) of the reduction process of iron oxide to metalized iron, as shown in Figure 3, Figure 4, Figure 5 and Figure 6. This depicts that the rate of conversion increases with the reaction residence time for all sizes of iron oxide undergoing a reduction reaction in the furnace. This is due to an increase in gaseous diffusion into the hematite ore sample, as it stays longer in the reactor over time, irrespective of the size of the iron oxide and furnace temperature.
Consequently, the effect of the conversion factor on the reaction residence time shows that the rate of conversion of hematite to magnetite to wustite to iron is fastest at the gas film stage and the slowest at the ash layer control. This implies that the rate of formation of reducing gas films around the iron ore inside the reactor is fastest compared to the rate of carbon deposition on the outer surface of the ore, irrespective of the sizes of the lump ore and the preset temperature of the furnace. Thus, the rate of formation and infiltration of reducing gas (CO/CO2 and H2) around the lump surface may occur much faster than the formation of the ash layer and chemical reaction stage, as shown in Figure 3, Figure 4, Figure 5 and Figure 6.

3.2. Effect of Reduction Time on Reaction Control Time

The reduction time is the specified time required for the ore lump samples to be exposed to the reduction of gases in the furnace at specified firing temperatures. It is also known as the reaction residence time. Equations (5), (7) and (10) are used to calculate the reaction control time to determine the time required for the complete conversion of hematite to metallic iron. This is also used to know the rate-determining stage of reaction (i.e., gas film, ash layer, and chemical reaction controls) as shown in Figure 7, Figure 8 and Figure 9, considering the iron ore sample of sizes ranging 10–14.99 mm and 15–20 mm, as depicted in Figure 7, Figure 8 and Figure 9, at firing temperatures of 570, 800, and 1000 °C. The graphical illustrations (Figure 7, Figure 8 and Figure 9) show that the total reaction control time increases with the reduction time at the firing temperatures, except at 800 and 1000 °C. A steep slope curve is observed at 570 °C. This indicates the easy bypass of the wustite stage during the reduction of ore samples at a firing temperature below 570 °C with little or less carbide formation of carbon deposition at the said temperature. This may likely be more rampant when iron ore lump of intermediate diameter sizes (10–15 mm) is used.

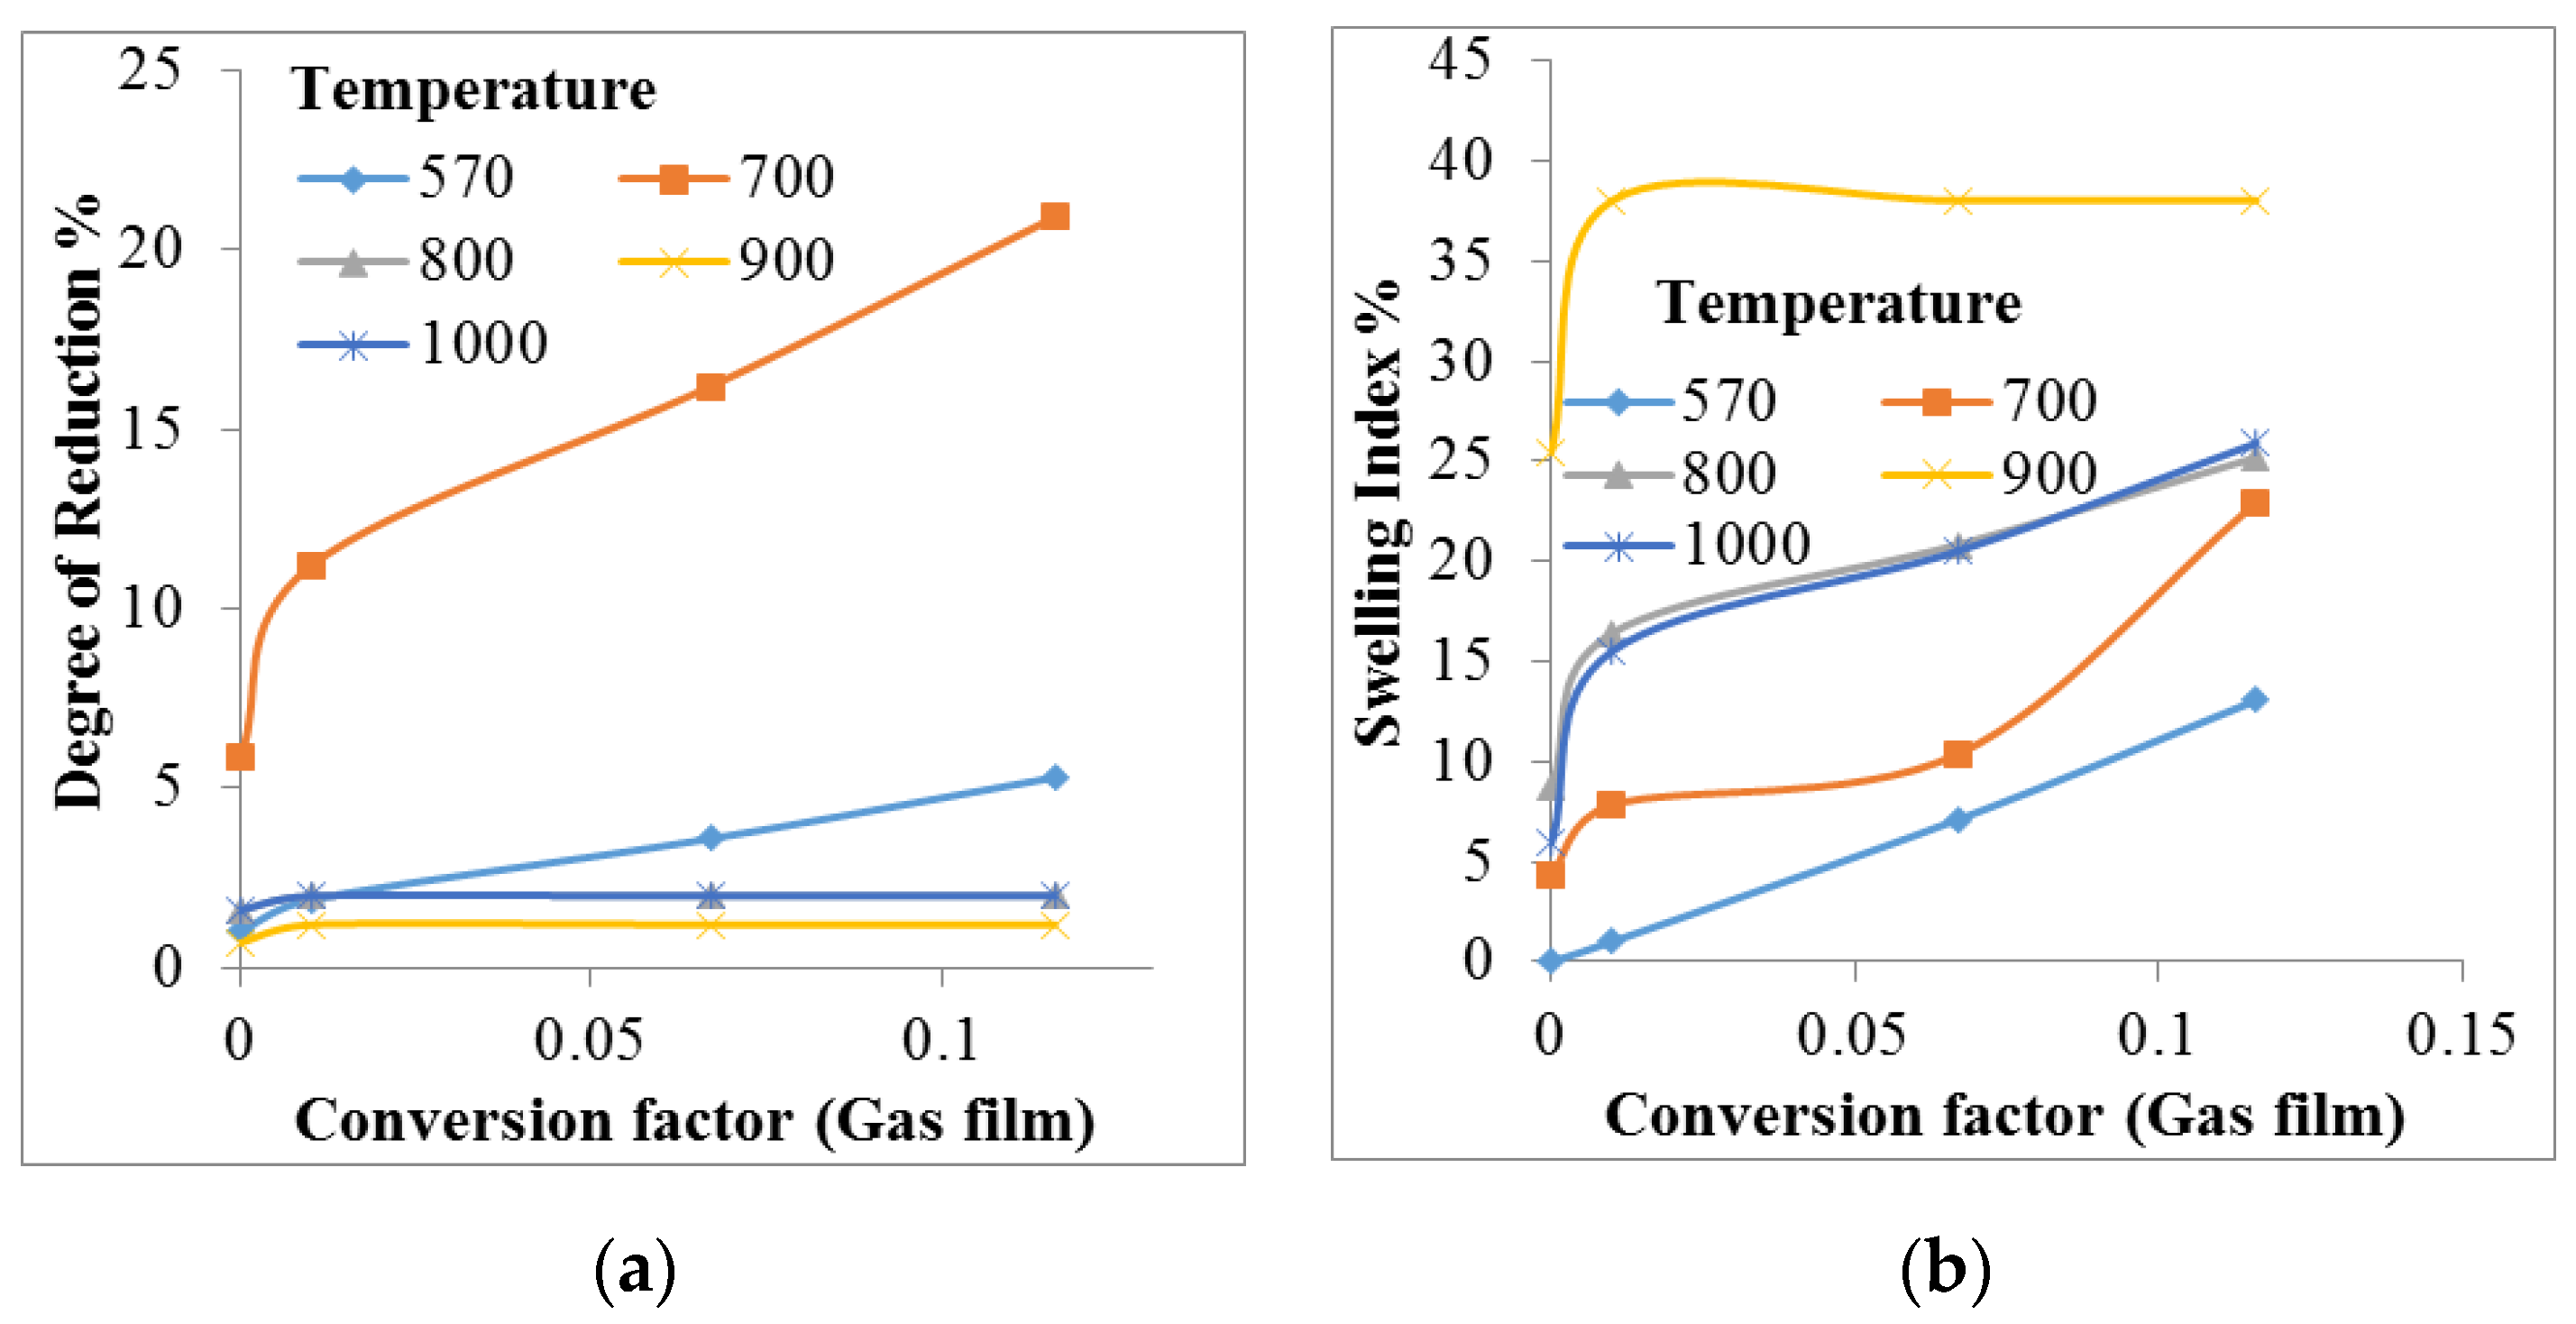
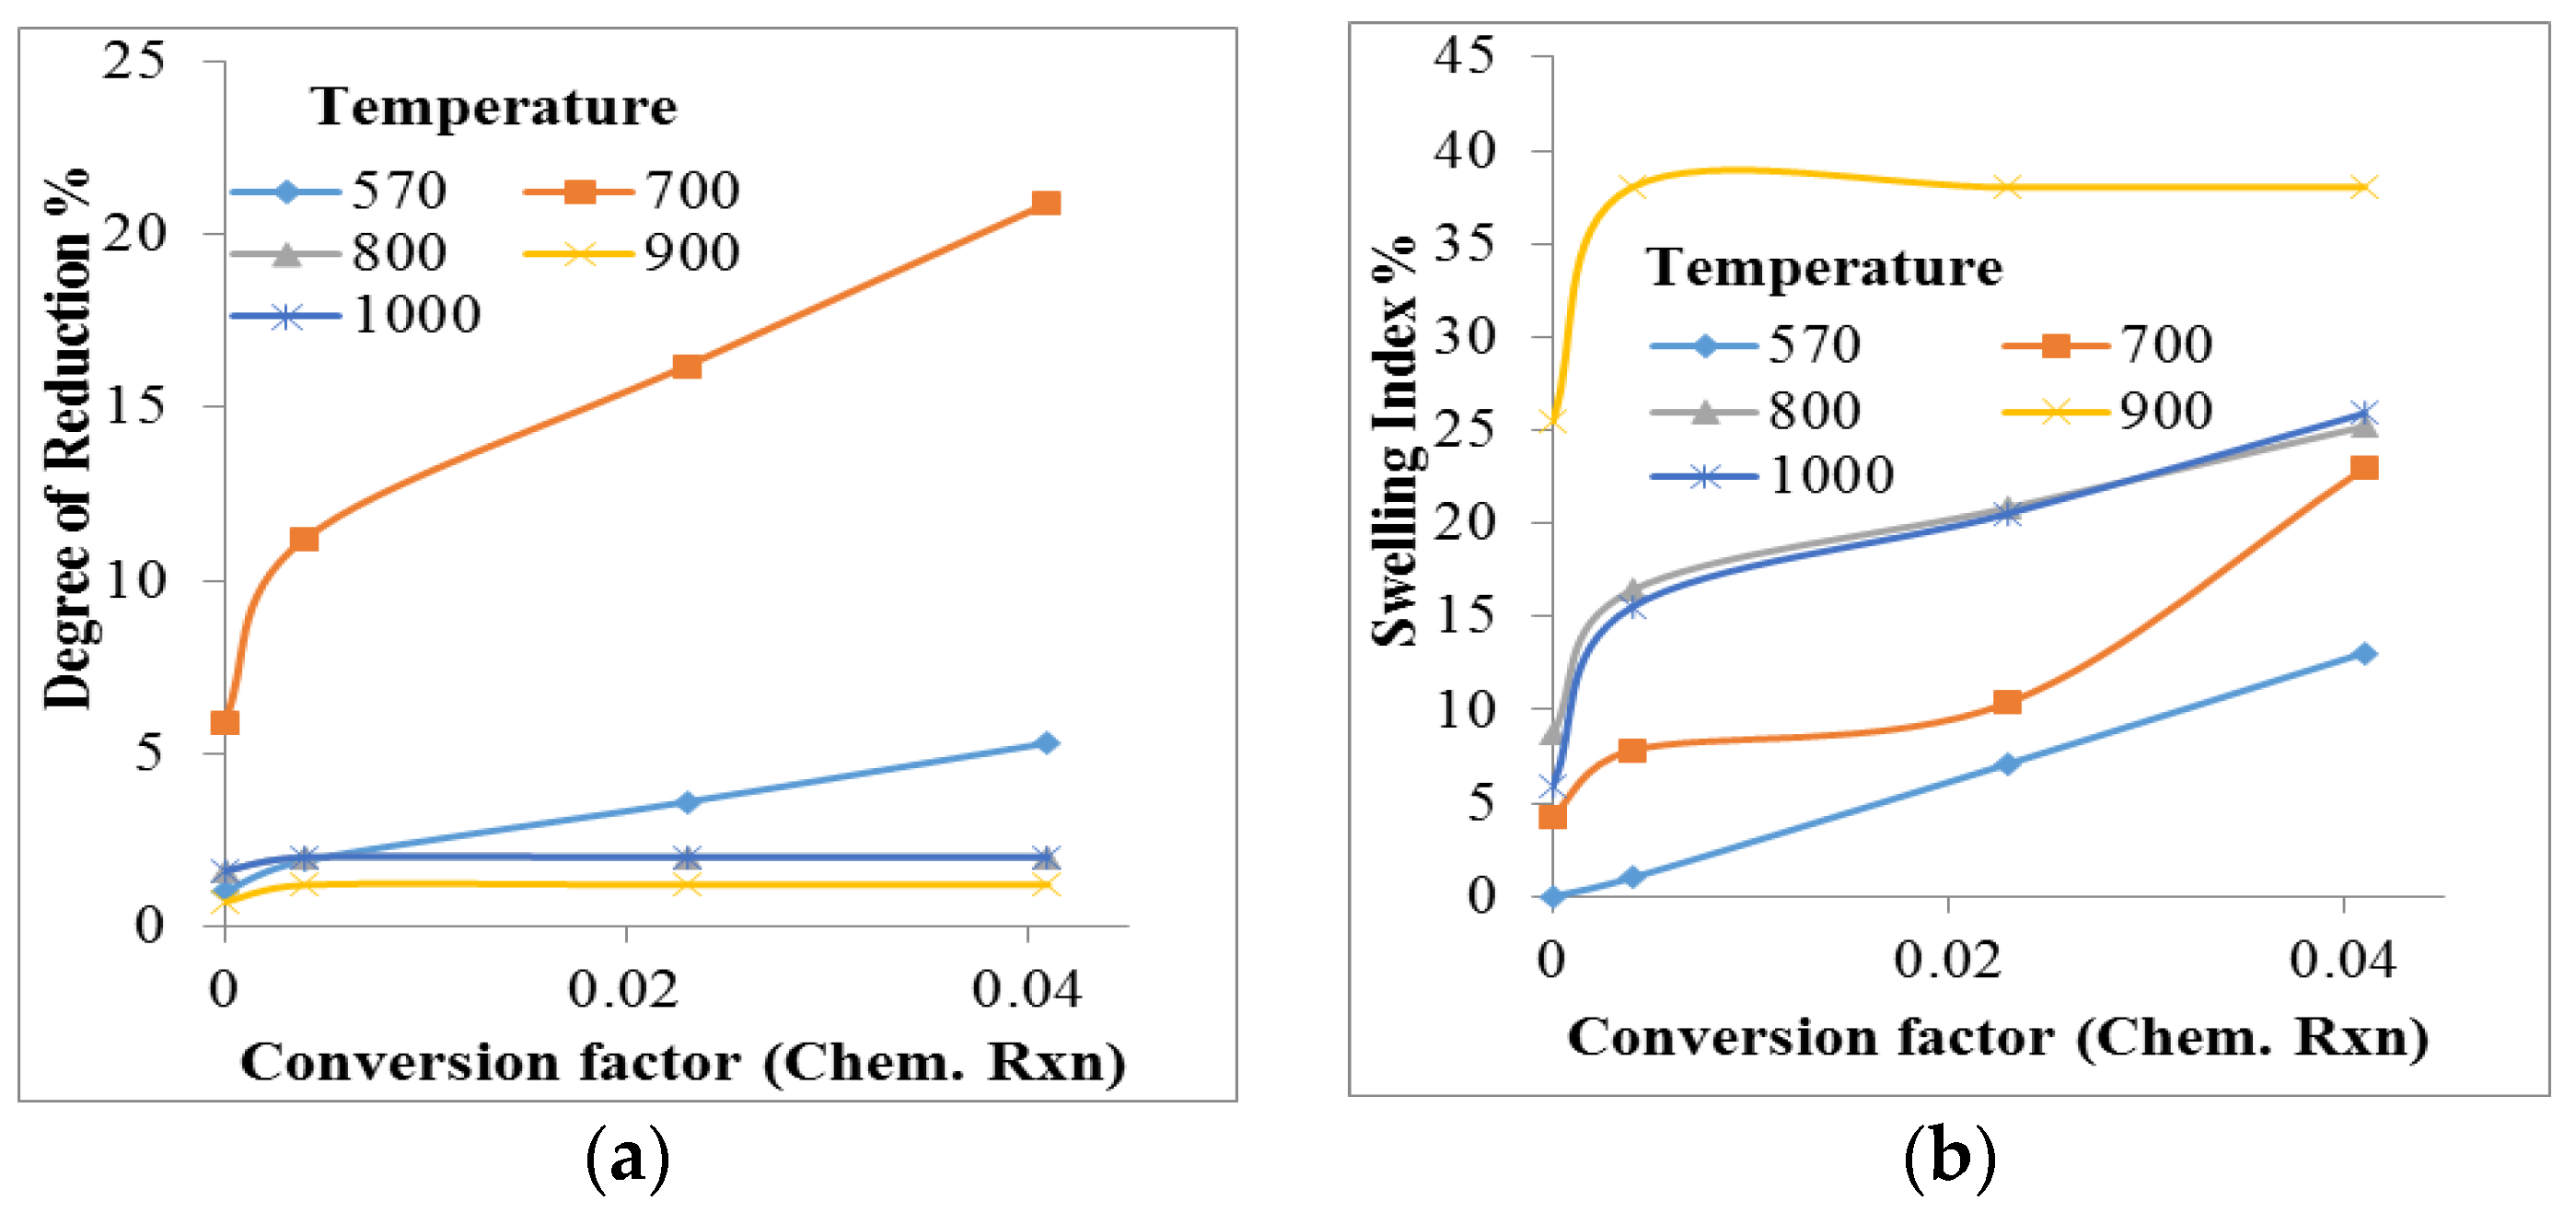
3.3. Effect of Firing Temperature on Degree of Reduction and Swelling Extent

The reduction of iron oxide or any ferruginous raw material with a reducing material involves stepwise reactions, as oxygen atoms mostly undergo severe adjustment, which increases the volume by more than 25 percent. Furthermore, the study of the kinetics of reduction based on the phase–boundary reaction control, as expressed in the equations of the shrinking core model described earlier, in terms of the sample fraction already reacted XB reveals that the rate-controlling stage of the process with respect to the required firing temperature, where a greater degree of reduction can be attained with the minimal swelling extent of the ore lump sample. The change in volume fraction and reacted ore fraction can also be envisaged under isothermal/non-isothermal conditions regardless of the reduction time. Therefore, the result in Figure 9, Figure 10, Figure 11, Figure 12, Figure 13, Figure 14 and Figure 15 depicts the relationship between conversion time factor, degree of reduction, and swelling extent in various phase boundary conditions for the commercially acquired iron ore lump sample on reduction with charcoal for 40 min under an isothermal condition, as used in the present work.

3.3.1. The Gas Film Control

When the resistance of the gas film controls the reactions, the concentration profile for the gas-phase reactant is as shown in Figure 1. The mass transfer of the boundary-layer gas film becomes negligible in the reaction of solids with a gas stream flowing above critical gas velocities. Different kinetic models can be used for the various reduction mechanisms whose graphical illustrations are based on the effect of rate conversion factor on the degree of reduction of the iron ore samples at specified firing temperatures, as shown in Figure 10.
The result obtained in Figure 10 and Figure 11 reveal that, for the smallest sized iron ore lump samples (5–9.99 mm), the rate conversion factor under the gas film condition increases with the degree of reduction and the swelling extent at any firing temperature. Thus, other firing temperatures have proved to maintain their stabilized conditions, regardless of the increment in their degree of reduction and swelling extent, while the case seems different at 700 and 570 °C, respectively. For more samples of medium-sizes (10–14.99 mm), as shown in Figure 10, the required firing temperature for a sustainable increase in the degree of reduction is observed at 700 °C, while subjecting the ore lump sample to temperatures above 800 °C could generate an abnormal swelling index of 30% or more. The highest degree of reduction of more than 40 percent is observed at 570 °C, as shown in Figure 11, and with an increase in the swelling extent at 1000 °C. This indicates that at the wustite stage, the ash layer formation is conveniently bypassed for larger ore samples (15–20 mm) than the smaller sized samples due to the large contact surface area of the ore sample. This, in turn, aids the diffusivity of the reductant gas (CO-H2) mixture into the system for more effective penetration of such gases into the ore lump samples at a low firing temperature.

3.3.2. The Ash Layer Control

The effect of ash layer control on the rate of reduction of iron oxide is based on the phase boundary change of the hematite sample using CO/CO2 and H2 gases as reductants. These have shown an appreciable increase in the degree of reduction and swelling extent of their samples [32,37]. It is also worthy to note that the results illustrated in Figure 13 and Figure 14 indicate an apparent increase in the degree of reduction with a rate conversion factor. This implies that the rates of reaction increase linearly with the hydrogen contents of the gaseous mixtures. Thus, the presence of large CO/CO2 contents in the charcoal, since the reaction was conducted under an airtight condition, may cause an apparent decrease in rates of reaction, as all reduction experiments with CO and H2-CO mixtures are always accompanied by carbon deposition which usually results in ash layer formation on the reduced iron ore samples, which results in low reducing gas penetration, thereby generating a little degree of reduction, high swelling extent, and incomplete reduction.
Figure 13 also affirmed that the large size (15–20 mm) samples do possess the highest degree of reduction at the lowest firing temperature of 570 °C with the highest swelling index at 1000 °C. This may be due to the large, reducing gas-contact surface area of the ore sample. This also established a relationship between the degree of reduction and ore sample size, as the most sustainable firing temperature to derive a progressive increase in the degree of reduction with minimal swelling extent (less than 20%) may likely be achieved at this stage. Figure 12 and Figure 13 also show the progressive tendency for an increase in the degree of reduction at 700 °C, while reduction remains stabilized at other firing temperatures, and the abnormal swelling extent of 50% and above at 1000 °C for the smaller size (5–9.99 mm) ore samples, and greater than 20% at 700 °C with a swelling index of 35% or more for the medium size (10–14.99 mm) ore samples, as obtained experimentally. This indicates the tendency for an increase in large carbon depositions on reduced samples for the small size range (5–9.99 mm) of iron ore lumps.

3.3.3. The Chemical Reaction Control

In the case where a direct chemical reaction controls the rate of reduction of the iron oxide sample, it was noticed that the inlet reducing gas (CO/H2) does have little or no restriction on the ash layer region around the iron ore, which implies that the use of a catalyst, such as quicklime, may not be necessary as the in-gas penetration suffers minimum or less restriction due to the absence of carbide formation in the process (i.e., no carbon deposition). Figure 13 and Figure 14 show a progressive increase in the degree of reduction as a chemical reaction controls the rate of reaction of the reduction process, as the sustainable temperature, which guarantees progressive reduction, was noticed at 570 and 700 °C. This attests to the fact, previously mentioned, that the wustite stage where the ash layer possesses its highest concentration is easily bypassed at a low firing temperature with less carbide formation on the reduced iron ore sample. The size range of the iron oxide also determines its tendency for a faster degree of reduction as iron ore sizes of more than 15 mm can easily be metalized to iron when heat-treated at 700 °C or less. Thus, introducing a firing temperature above 700 °C can generate an abnormal swelling index above 50% where a chemical reaction controls the rate of reaction, regardless of the size of the iron ore samples (5–9.99 mm). This is due to the presence of carbon deposition and ash layer formation which may slow down the reaction rate and degree of reduction of the process. However, the swelling extent of the sample decreases with the ore sample size and increases with the firing temperature.

3.4. Correlation between Degree of Reduction and Swelling Index

The relationship between the swelling index (%) and degree of reduction (%) to the reduction of time is shown in Figure 16, Figure 17, Figure 18, Figure 19 and Figure 20. From the figures, it can be seen that the abnormal swelling extent (25–30%) is observed at around 15–45% reduction at firing temperatures 800, 900 and 1000 °C, which led to the disintegration of the rescued ore sample after a short reduction time of 40 min. The iron particles are shown in Figure 16 and Figure 17 for the FeO → Fe reduction step at 800 and 900 °C, respectively. However, the swelling was highest in the reduced iron ore lump, as observed at 900 and 1000 °C, respectively, but this is quite contrary to similar reports obtained from the existing literature. Thus, the reduction process is expected to be done at high temperatures with high carbon deposition on the ore sample which may likely lead to crack formation in the samples, as shown in Figure 16a and Figure 17a. The SEM/EDX analysis of this present work was done to practically identify the microstructural segregation in the components of the hematite ore lump sample, as well as the presence of silicon in the different shapes and sizes of the reduced iron ore lump. The SEM/EDX analysis of the reduced iron ore presents the spectrum form of the lump-shaped ore–silicon composites as reduced at 570, 800 and 1000 °C, as shown in Figure 18, Figure 19 and Figure 20.
Figure 16. Reduction and SEM micrographs of Set-III hematite lump sample 15–20 mm at reduction time 40 min for 800 °C: (a) Cracks and disintegration; (b) external surface structure; (c) internal surface structure.
Materproc 03 00027 g016
Figure 17. Reduction and SEM micrographs of Set-I for hematite lump sample 5–9.99 mm at reduction time 40 min for 1000 °C. (a) Cracks and disintegration; (b) external surface structure; (c) internal surface structure.
Materproc 03 00027 g017
Figure 18. SEM/EDX micrograph and spectrum view at 570 °C, with size range 5–9.99 mm.
Materproc 03 00027 g018
Figure 19. SEM/EDX micrograph and spectrum view at 800 °C with size range 15–20 mm.
Materproc 03 00027 g019
Figure 20. SEM/EDX micrograph and spectrum view at 1000 °C with size range 5–9.99 mm.
Materproc 03 00027 g020
It is worthy to note that the microstructural spectrum of virtually all the tested samples shows a high percentage of silicon (39.20, 29.59 and 33.90%, respectively). This connotes the presence of a slag region on the reduced ore surface where the reduced iron oxide is mixed with the silicate. It is also observed that the silicon present in the spectrum analyzed in the fired ore-charcoal mixture at 570 and 800 °C is as high as 39.2% and 29.56%, respectively. This also implies some significantly unreduced oxide, especially at 800 °C, due to the presence of a slag zone regardless of the size range of the reduced ore sample, as some micro-spots in the ore-charcoal lump-shaped composite can also be identified. Such a spot only contains metallic irons due to it being devoid of slags after the reduction time steps of 10, 20, 30 and 40 min, which is shown in Figure 20.

3.5. Effect of Rate Controlling Resistance on Reduced Samples

The respective percentages of iron in the metallic composition as derived from Scanning Electron Microscopy (SEM) and Energy Dispersion X-ray (EDX) spectrometry are illustrated in Figure 17, Figure 18, Figure 19 and Figure 20. It can be deduced from the figures that the reaction control stages, or step-by-step mechanism of the reduction process, can fully be ascertained based on these two factors, which include an increase in weight due to carbon deposition and incomplete/partial reduction of the samples. It can be deduced from Figure 21 that the higher infiltration of CO/CO2 gases into the hematite lump sample produces large amounts of oxide which are entrapped in the iron crystal layers, and are a direct possibility for the incomplete reduction of the iron oxide when heat-treated in the reactor. The sharp drop in the degree of metallization of the reduced ore samples is better observed at intermediate temperatures (i.e., 700, 800, 900 °C) of the reduction process. This indicates the tendency for high carbon deposit at the said wustite stage of the reduction process, coupled with the possibility of high oxygen–silicon content as contained in the remains of the heat-treated reduced iron ore samples at the lowest temperature and residence time, at 570 °C and 10 min, respectively.

4. Conclusions

In this study, non-contact direct reduction using wood charcoal fines was carried out at heating temperatures above 570 °C. Levenspiel’s relations for the shrinking core model were used for describing the reduction kinetics and mechanism. The reaction kinetics involves the diffusion through gas film; diffusion through ash layer; and the chemical reaction itself as the rate resistance control based on the unreacted core unit surface. The rate-controlling steps for the reduction kinetics of average particle sizes, 5–20 mm at 570–1000°C, were studied after heat treatment of the ore-wood charcoal in an activated carbon reactor at a total reduction time of 40 min. The conclusions include:
  • The adapted kinetic model provides good analysis for describing the degree of ore reduction, the swelling extent of the reduced iron ore by rate contact, and resident time of reaction.
  • This work was able to show the ash layer as the controlling resistance for the reduction of goethite iron ore with the possibility of high carbon depositions or carbide formation alongside the reduced iron ore. The foregoing discussion indicates an incomplete reduction of the direct reduced iron ore. The most convenient firing temperature to sustain the controlling resistance of the ash layer formation for this work is 700 °C. There is a uniform increase in the degree of reduction in the reduced samples with a steady swelling index; the most firing is likely to be obtained at the temperature of 700 °C.
  • The degree of metallization was found to be enhanced as the CO/CO2 composition, reduction firing temperature, and reduction time, increase. However, a reduction firing temperature of more than 1000 °C is prone to the formation of undesirable sticky iron (whiskers).
  • This study revealed that an increase in firing temperature, as well as reducing time, increases the degree of reduction and swelling extent of the reduction process.
  • It was established that an increase in the fixed carbon content of reduction gases increases the degree of reduction and swelling extent as a final degree of metallization of more than 90 percent was achieved in the overall reduction process at 570 and 1000 °C, compared to the lowest value of metallization degree of 75.6 percent as obtained at 800 °C.

Author Contributions

The following statements should be used: Conceptualization, J.O. and O.O.; methodology, J.O.; software, J.O.; validation, J.O., O.A. and O.O.; formal analysis, J.O.; investigation, J.O.; resources, O.O. and S.O.; data curation, J.O. and O.O.; writing—original draft preparation, J.O.; writing—review and editing, O.A. and O.O.; visualization, O.O.; supervision, O.A. and O.O.; project administration, O.O. and S.O.; funding acquisition, J.O. All authors have read and agreed to the published version of the manuscript.

Institutional Review Board Statement

Not applicable.

Informed Consent Statement

Not applicable.

Acknowledgments

This study was funded by the Petroleum Technology Development Fund, Nigeria (Grant Number: PTDF/ED/LSS/PhD/JEO/0278/19).

Conflicts of Interest

The authors declare no conflict of interest.

References

  1. Okoro, F.E.; Femi-Oyewole, D.; Okunlola, O.; Aniwi, A.A.; Ngassam, N.Y. Iron ore in Australia. Master’s Thesis, Department of Petroleum Engineering Resources and Sustainability, Politecnico, Melbourne, Australia, 2016; pp. 1–14. [Google Scholar]
  2. Kiptarus, J.J.; Muubo, A.M.; Makokha, A.B.; Kimutai, S.K. Characterization of selected mineral ores in the eastern zone of Kenya: A case study of Mwingi North constituency in Kitui-county. Int. J. Min. Eng. Miner. Process. 2015, 4, 8–17. [Google Scholar]
  3. Alamsari, B.; Torii, S.; Trianto, A.; Bindar, Y. Heat and mass transfer in reduction zone of sponge iron reactor. J. Int. Sch. Res. Netw. ISRN Mech. Eng. 2011, 1–12. [Google Scholar] [CrossRef]
  4. Babich, A.; Mousa, E.A.; Senk, D. Reduction behavior of iron ore pellets with simulated coke oven gas and natural gas. Steel Res. Int. 2013, 849, 1085–1097. [Google Scholar]
  5. Barun, M.; Sundeep, K.B. Kinetics of Ore Reduction by Coal and Charcoal. Ph.D. Thesis, National Institute of Technology, Rourkela, Sweden, 2008; pp. 5–35. [Google Scholar]
  6. Donskoi, E.; McElwain, D.L.; Wibberley, L.J. Estimation and modeling of parameters for direct reduction in iron ore/coal composites: Part II. Kinetic parameters. J. Metall. Mater. Trans. 2003, 14, 255–266. [Google Scholar] [CrossRef]
  7. Bonalde, A.; Henriquez, A.; Manrique, M. Kinetic analysis of the iron oxide reduction using hydrogen-carbon monoxide mixtures as reducing agent. ISIJ Int. 2005, 45, 1255–1260. [Google Scholar] [CrossRef]
  8. Heikkila, A.; Ijana, M.I.; Bartusch, H.; Fabritius, T. Reduction of iron ore pellets, sinter, and lump ore under simulated blast furnace conditions. Steel Res. Int. 2020, 4, 1–8. [Google Scholar] [CrossRef]
  9. Cecca, C.D.; Barella, S.; Mapelli, C.; Gruttadauria, A.; Ciuffini, A.F.; Mombelli, D.; Bondi, E. Thermal and chemical analysis of massive use of hot briquetted iron inside basic oxygen furnace. J. Iron Steel Res. Int. 2017, 24, 901–907. [Google Scholar] [CrossRef]
  10. Donskoi, E.; Olivares, R.I.; McElwain, D.L.; Wibberley, L.J. Experimental study of coal-based direct reduction in iron/coal composite pellets in a one-layer bed under non-isothermal asymmetric heating. J. Ironmak. Steelmak. 2006, 33, 24–28. [Google Scholar] [CrossRef]
  11. Dennis, A.; Damien, W.; Fabrice, P.; Oliver, D. A laboratory study of the reduction of iron oxides by hydrogen. arXiv 2006, 2, 111–120. [Google Scholar]
  12. Boris, L.V. Mechanism of carbothermal reduction of iron, cobalt, nickel, and copper oxides. Thermochim. Acta 2000, 360, 109–120. [Google Scholar]
  13. Dydo, P.; Mondal, T.; Piotro, K.; Rizeg, G.; Witkowski, T. Topochemical approach of kinetics of the reduction of hematite to wustite. Chem. Eng. J. 2007, 131, 73–82. [Google Scholar]
  14. Pineau, A.; Kanari, N.; Gaballah, I. Kinetics of reduction of iron oxides by H2 Part I: Low-temperature reduction of hematite. Thermochim. Acta 2007, 447, 89–100. [Google Scholar] [CrossRef]
  15. Pineau, A.; Kanari, N.; Gaballah, I. Kinetics of reduction of iron oxides by H2 Part II. Low-temperature reduction of magnetite. Thermochim. Acta 2007, 456, 75–88. [Google Scholar] [CrossRef]
  16. Jozwiak, W.K.; Kaczmarek, E.; Maniecki, T.P.; Ignaczak, W.; Maniukiewicz, W. Reduction behavior of iron oxides in hydrogen and carbon monoxide atmospheres. Elsevier J. Appl. Catal. 2007, 17–27. [Google Scholar] [CrossRef]
  17. Kowitwarangkul, P.; Babich, A.; Senk, D. Reduction Kinetics of Self-Reducing Pellets of Iron Ore; American Institute of Science and Technology Conference Proceeding: Indianapolis, IN, USA, 2014; pp. 611–622. [Google Scholar]
  18. Mania, K. Reduction of Hematite Pellets with CO-H2 Mixtures. Master’s Thesis, School of Industrial Engineering and Management, Department of Materials Science and Engineering, Royal Institute of Technology, Stockholm, Sweden, 2011; pp. 18–38. [Google Scholar]
  19. Mania, K. Fundamental Studies Related to the Gaseous Reduction of Iron Oxide. Ph.D. Thesis, KTH Royal Institute of Technology, Stockholm, Sweden, 2016; pp. 15–51. [Google Scholar]
  20. Levenspiel, O. Chemical Reaction Engineering, 3rd ed.; John Wiley: New Delhi, India, 1999; Chapter 12; pp. 343–362. [Google Scholar]
  21. Kumar, M.; Baghel, H.; Patel, K.S. Reduction and Swelling of fired hematite iron ore pellets by non-coking coal fines for application in sponge ironmaking. Miner. Process. Extr. Metall. Rev. Int. J. 2012, 34, 249–267. [Google Scholar] [CrossRef]
  22. Liu, W.; Lim, J.; Saucedo, M.A.; Hayhurst, A.N.; Scott, A.S.; Dennis, J.S. Kinetics of the reduction of wüstite by hydrogen and carbon monoxide for the chemical looping production of hydrogen. J. Chem. Eng. Sci. 2014, 12, 149–166. [Google Scholar] [CrossRef]
  23. Modal, K.; Hippo, E.; Lorethoval, H.; Witkowski, T.; Lalvani, S.B. Reduction of iron oxide in a carbon monoxide atmosphere: Reaction controlled kinetics. J. Fuel Process. Technol. 2004, 84, 33–47. [Google Scholar] [CrossRef]
  24. Al-Eshaik, M.A.; Kadachi, A. Elemental analysis of steel products using X-ray fluorescence (XRF) technique. J. King Univ. Eng. Sci. 2011, 23, 75–79. [Google Scholar] [CrossRef]
  25. Ofoegbu, S.U. Characterization studies on Agbaja iron ore: A high-phosphorus content ore. SN Appl. Sci. 2019, 1, 204. [Google Scholar] [CrossRef]
  26. Li, K.; Wen, N.; Zhu, M.; Zheng, M.; Yuan, L. Iron extraction from Oolitic iron ore by a deep reduction process. J. Iron Steel Res. Int. 2011, 18, 9–13. [Google Scholar] [CrossRef]
  27. Wu, E.; Zhu, R.; Yang, S.; Ma, L.; Li, J.; Hou, J. Influences of technological parameters on the smelting-separation process for metalized pellets of vanadium-bearing titanomagnetite concentrates. J. Iron Steel Res. Int. 2016, 23, 655–660. [Google Scholar] [CrossRef]
  28. Muhammad, M.; Fatmaliana, A.; Jalil, Z. Study of hematite mineral (Fe2O3) extracted from natural iron ore prepared by the co-precipitation method. Iop Conf. Ser. Earth Environ. Sci. 2019, 348, 1–5. [Google Scholar] [CrossRef]
  29. Sekunowo, O.I.; Durowaye, S.I.; Lawal, G.I. Synthesis and characterization of iron mill scale particles reinforced ceramic matrix composite. J. King Univ. Eng. Sci. 2019, 31, 78–85. [Google Scholar]
  30. Babalola, B.J.; Maledi, N.; Shongwe, M.B.; Bodunrin, M.O.; Obadele, B.A.; Olubambi, P.A. Influence of nanocrystalline nickel powder on oxidation resistance of spark plasma sintered Ni17Cr6.5Co1.2Mo6Al4W7.6Ta alloy. J. King Univ. Eng. Sci. 2020, 32, 198–204. [Google Scholar]
  31. Omole, S.O.; Oyetunji, A.; Alaneme, K.K.; Olubambi, P.A. Structural characterization and mechanical properties of pearlite-enhanced micro-alloyed ductile irons. J. King Univ. Eng. Sci. 2020, 32, 205–2010. [Google Scholar] [CrossRef]
  32. Ogbezode, J.E.; Oluwole, O.O. Reduction kinetics behavior of goethite iron ore in the CO/CO2 atmosphere from Wood Charcoal. Int. J. Emerg. Eng. Res. Technol. 2019, 7, 11–21. [Google Scholar]
  33. Pavlína, P.; Simona, J. Process engineering in iron production. J. Chem. Process Eng. 2013, 34, 63–76. [Google Scholar]
  34. Mousa, E.A.; Ghali, S. Mathematical analysis of the parameters affecting the direct reduction of iron ore pellets. J. Metall. Eng. 2015, 4, 78–87. [Google Scholar] [CrossRef]
  35. Sharma, M.K.; Solanki, V.; Roy, G.G.; Sen, P.K. Study of reduction behaviour of prefabricated iron ore–graphite/coal composite pellets in rotary hearth furnace. J. Iron Steelmak. 2012, 40, 590–597. [Google Scholar] [CrossRef]
  36. Srinivasan, N.S. Reduction of iron oxides by carbon in a circulating fluidized bed reactor. J. Powder Technol. 2002, 124, 28–39. [Google Scholar] [CrossRef]
  37. Prakash, S. Reduction and sintering of fluxed iron ore pellets-A comprehensive review. J. South. Afr. Inst. Min. Metall. 1995, 96, 3–16. [Google Scholar]
  38. Yunyun, W. Effect of Different Parameters on the Direct Reduction of Natural Iron Ores from Uganda. Master’s Thesis, Department of Material Science and Engineering, Royal Institute of Technology (KTH), Stockholm, Sweden, 2012; pp. 13–28. [Google Scholar]
Figure 1. (a) Goethite iron ore samples prepared at different size ranges; (b) the reactor: activated carbon furnace [24].
Materproc 03 00027 g001
Figure 2. The shrinking core model showing contact surface area of reduction reaction [3,20].
Materproc 03 00027 g002
Figure 3. Determination of rate control stages based on the conversion factor for iron-ore samples of different size ranges at 570 °C. (a) 10–14.99 mm; (b) 15–20 mm.
Materproc 03 00027 g003
Figure 4. Determination of rate control stages based on the conversion factor for iron-ore samples of different size ranges at 700 °C. (a) 10–14.99 mm; (b) 15–20 mm.
Materproc 03 00027 g004
Figure 5. Determination of rate control stages based on the conversion factor for iron-ore samples of different size ranges at 800 °C. (a) 10–14.99 mm; (b) 15–20 mm.
Materproc 03 00027 g005
Figure 6. Determination of rate control stages based on the conversion factor for iron-ore samples of different size ranges at 900 °C. (a) 10–14.99 mm; (b) 15–20 mm.
Materproc 03 00027 g006
Figure 7. Determination rate control stages based on reaction control time for iron-ore samples of different size ranges at 570 °C. (a) 10–14.99 mm; (b) 15–20 mm.
Materproc 03 00027 g007
Figure 8. Determination of rate control stages based on reaction control time for iron-ore samples of different size ranges at 800 °C. (a) 10–14.99 mm; (b) 15–20 mm.
Materproc 03 00027 g008
Figure 9. Determination of rate control stages based on reaction control time for iron-ore samples of different size ranges at 1000 °C. (a) 10–14.99 mm (b) 15–20 mm.
Materproc 03 00027 g009
Figure 10. Effect of particle firing temperature and gas film rate control stage of reduced iron ore lump size ranged 10–14.99 mm. (a) Degree of reduction; (b) the swelling extent.
Materproc 03 00027 g010
Figure 11. Effect of particle firing temperature and gas film rate control stage of reduced iron ore lump size ranged 15–20 mm. (a) Degree of reduction; (b) the swelling extent.
Materproc 03 00027 g011
Figure 12. Effect of particle firing temperature and ash layer rate control stage of reduced iron ore lump size ranged 10–14.99 mm. (a) Degree of reduction; (b) the swelling extent.
Materproc 03 00027 g012
Figure 13. Effect of particle firing temperature and ash layer rate control stage of reduced iron ore lump size ranged 15–20 mm. (a) Degree of reduction; (b) the swelling extent.
Materproc 03 00027 g013
Figure 14. Effect of particle firing temperature and chemical reaction control stage of reduced iron ore lump size ranged 10–14.99 mm. (a) Degree of reduction; (b) the swelling extent.
Materproc 03 00027 g014
Figure 15. Effect of particle firing temperature and chemical reaction control stage of reduced iron ore lump size ranged 15–20 mm. (a) Degree of reduction; (b) the swelling extent.
Materproc 03 00027 g015
Figure 21. Degree of metallization as a function of reduction gas firing temperature at residence time of 40 min.
Materproc 03 00027 g021
Table 1. Chemical analysis of goethite ore lump sample [32].
ElementHematite (Fe2O3)Wustite (FeO)SiO2TiO2MnOOthers
%wt82.650.941.310.050.6914.36
Publisher’s Note: MDPI stays neutral with regard to jurisdictional claims in published maps and institutional affiliations.

