Proceeding Paper

Methodology for the Identification of Nucleation Sites in Aluminum Alloy by Use of Misorientatation Mapping †

by
Sofia Papadopoulou
1,2,*,
Evangelos Gavalas
1 and
Spyros Papaefthymiou
2
1
ELKEME S.A., 61st km Athens-Lamia Nat. Road, 32011 Oinofyta, Viotia, Greece
2
Laboratory of Physical Metallurgy, Division of Metallurgy and Materials, School of Mining & Metallurgical Engineering, National Technical University of Athens, 9, Her. Polytechniou Str., Zografos, 15780 Athens, Greece
*
Author to whom correspondence should be addressed.
Presented at the 1st International Electronic Conference on Metallurgy and Metals, 22 February–7 March 2021; Available online: https://iec2m.sciforum.net/.
Mater. Proc. 2021, 3(1), 11; https://doi.org/10.3390/IEC2M-09251
Published: 18 February 2021
(This article belongs to the Proceedings of The 1st International Electronic Conference on Metallurgy and Metals)

Abstract

:
The fabrication of semi-finished hot and cold rolled sheets includes a complex evolution of both microstructure and texture to meet the demanded mechanical properties and suitable formability characteristics. The desired mechanical properties along with the optimum grain size can be obtained through the control of both recovery and recrystallization processes. This work examines the effect of recovery and recrystallization on the resulting crystallographic texture and on the local plastic deformation. A processing approach for EBSD-KAM (Electron Back Scatter Diffraction—Kernel average misorientation) evaluation is suggested with the purpose of effectively evaluating all the possible misorientation angles in-between the grains and of observing the recovery phenomenon from a different point of view. The results showed that although texture components did not alternate significantly during recovery, the fraction of sub-grain boundaries was increased indicating the completion of recovery at the selected temperature exhibited a maximum value of 90%. The initiation of recrystallization was illustrated by a different aspect, underlying newly formed grains and points which exhibited high misorientation angle, critical for the evolution of the recrystallization process and texture evolution.

1. Introduction

The AA3104 is a strain-hardenable alloy and uses Mn as a main alloying element for mechanical properties and formability improvement. At the same time, it presents good resistance to corrosion [1,2,3]. In addition, chemical composition, the thermomechanical process also plays an important role on the performance of the selected aluminum alloy with regard to specific application requirements [4,5]. In the rolling process, for instance, the effect of the reduction of the rolling passes and of thermal treatments, could be quantified in terms of texture [6,7,8,9,10]. Recovery and recrystallization processes which are present during the various thermomechanical stages are known as among the most important ones, they are not yet fully understood despite being critical with regards to producing suitable microstructure for several applications [11].
Measurements, which are still debatable in the academic community though, are utilized qualitatively in order to measure strain build-up/relief during annealing [12,13,14]. EBSD (electron backscatter diffraction) measurements, and especially KAM (kernel average misorientation) maps, are widely used for measurements and illustration of local plastic deformation, whereas several studies are concerned with the selection of the optimal scanning and processing parameters [13,14,15,16,17,18]. One of these measurements is the KAM (Kernel average misorientation angle), which indicates the local plastic strain within the grains. The higher the KAM value, the greater the GND (geometrically necessary dislocation) concentration; hence, the presence of strained grains.
In the present study, the evolution of KAM during the annealing process at different soaking times is studied. The recrystallized grains exhibit KAM values near 0 [19], whereas grains and points which are deformed exhibit a more complex distribution of misorientation angles. A processing approach considering all the possible misorientation angles and not only those exhibiting maximum 5°, as it has been used to date [15,16,17,18,19,20,21,22], was conducted in order to establish the use of this different criterium for strain analysis purposes of non-recrystallized materials and for the localization of possible crucial points for nucleation.

2. Experimental Procedure

AA 3104 sheet samples were cross-sectioned parallel to rolling direction and the specimens were cold mounted to avoid any annealing effects. Metallographic preparation was conducted by means of grinding and polishing. Optical microscopy examination was conducted by use of a Nikon Epiphot 300 inverted metallographic microscope. Higher magnification microscopic observations were performed by use of a FEI XL40 SFEG Scanning Electron Microscope (SEM) under a 20 kV accelerating voltage, coupled with an EDAX Apollo XF equivalent to Octane Super EDS, silicon drift detector (SDD) with a detecting surface of sensor 60 mm2, in cooperation with TEAM software. Electron backscatter diffraction (EBSD) analysis was performed with an EDAX Hikari XP EBSD, high-speed camera, on the longitudinal cross-sections in order for the orientation of the Al crystals to be revealed as well as to determine the preferred texture components resulting from the applied manufacturing process.
Samples corresponding to the most indicative thermal processes are presented as follows: (a) hot rolled sample, (b) 95% reduction cold rolled sample and the 95% reduction cold rolled sample after annealing at 250 °C and (c) soaking time 90’, (d) soaking time 100’, (e) soaking time 120’ and (f) soaking time 600’.
EBSD scans were collected using a hexagonal grid with a 0.1–0.2 μm step. The SEM magnification was set at 2000–4000× with an accelerating voltage of 20 kV at a working distance 10–12 mm. OIM software was used to process the retrieved EBSD results. The utilized confidence index was 0.1–0.05. IPF (inverse pole figure) diagrams and plots, KAM (kernel average misorientation) maps and GOS (grain orientation spread) maps were also used for the estimation of texture evolution, local plastic deformation and recrystallization percentage.

KAM Maps

KAM maps are measuring the local plastic deformation by considering a pixel as a kernel and by calculating the mean deviation of orientations among this pixel and the first or second neighbors. To date, the existing approach of KAM maps considers a maximum misorientation angle of 5° and diminishes the relative variation through orientation averaging [13]. Different criteria had been selected in order to find the best fit for both the cold rolled and annealed samples. The range which was selected to examine the fluctuation of KAM was 0–65° with a 5° step. KAM was calculated considering the second neighbors and a maximum misorientation of 5° as suggested by the relevant literature, as well as a setting of 65° and by comparing with the first neighbor.

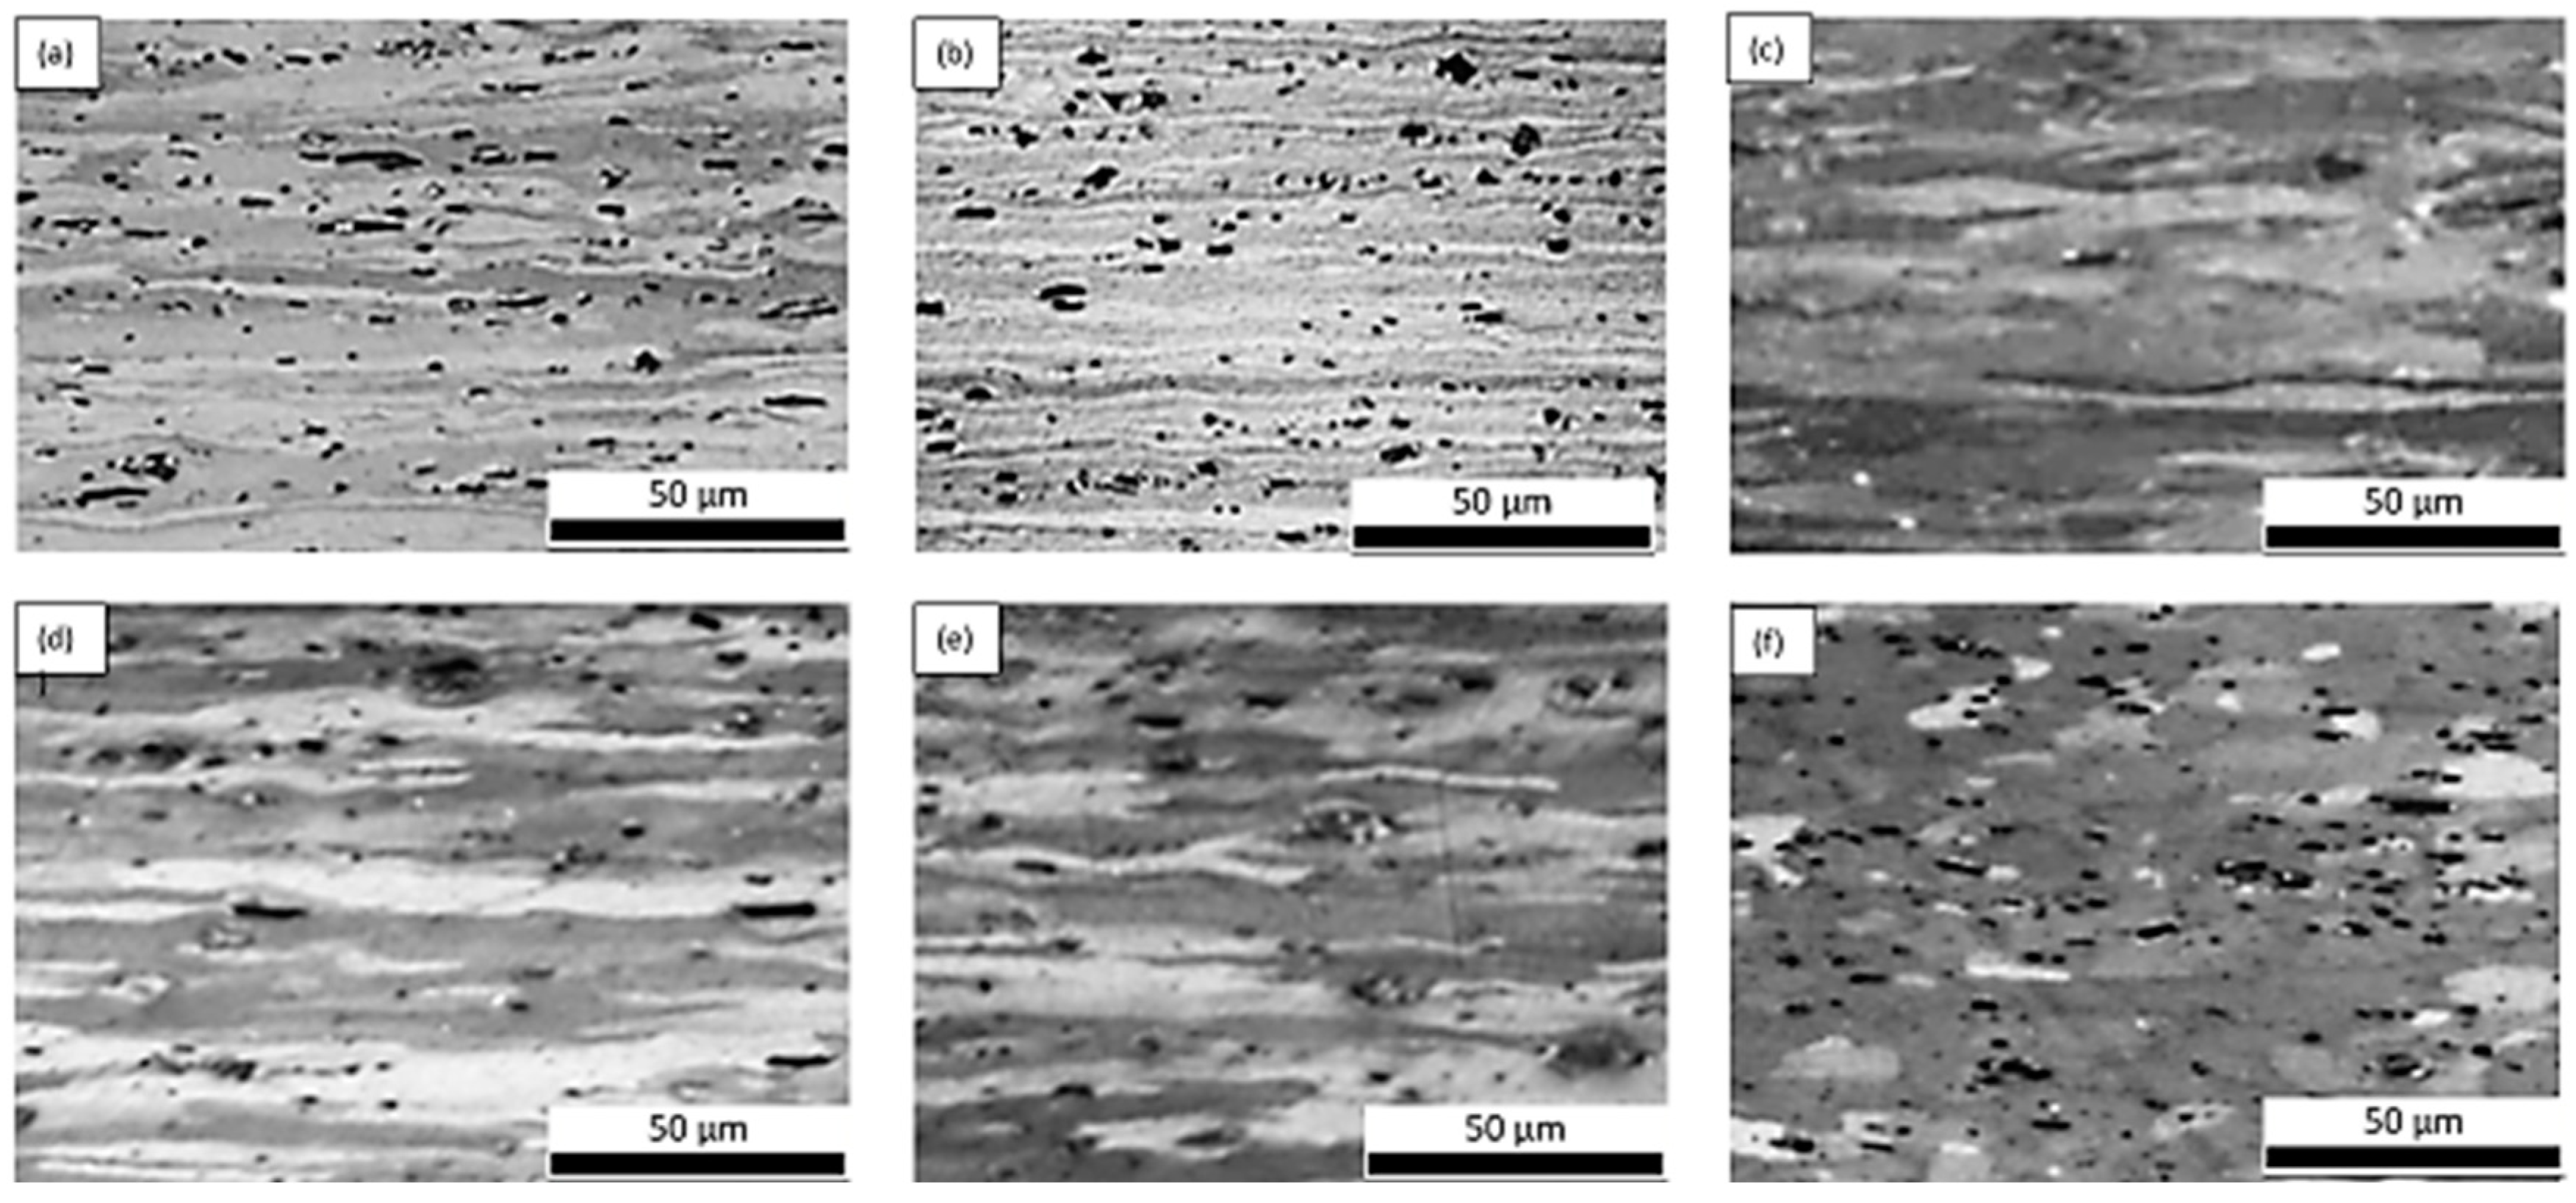
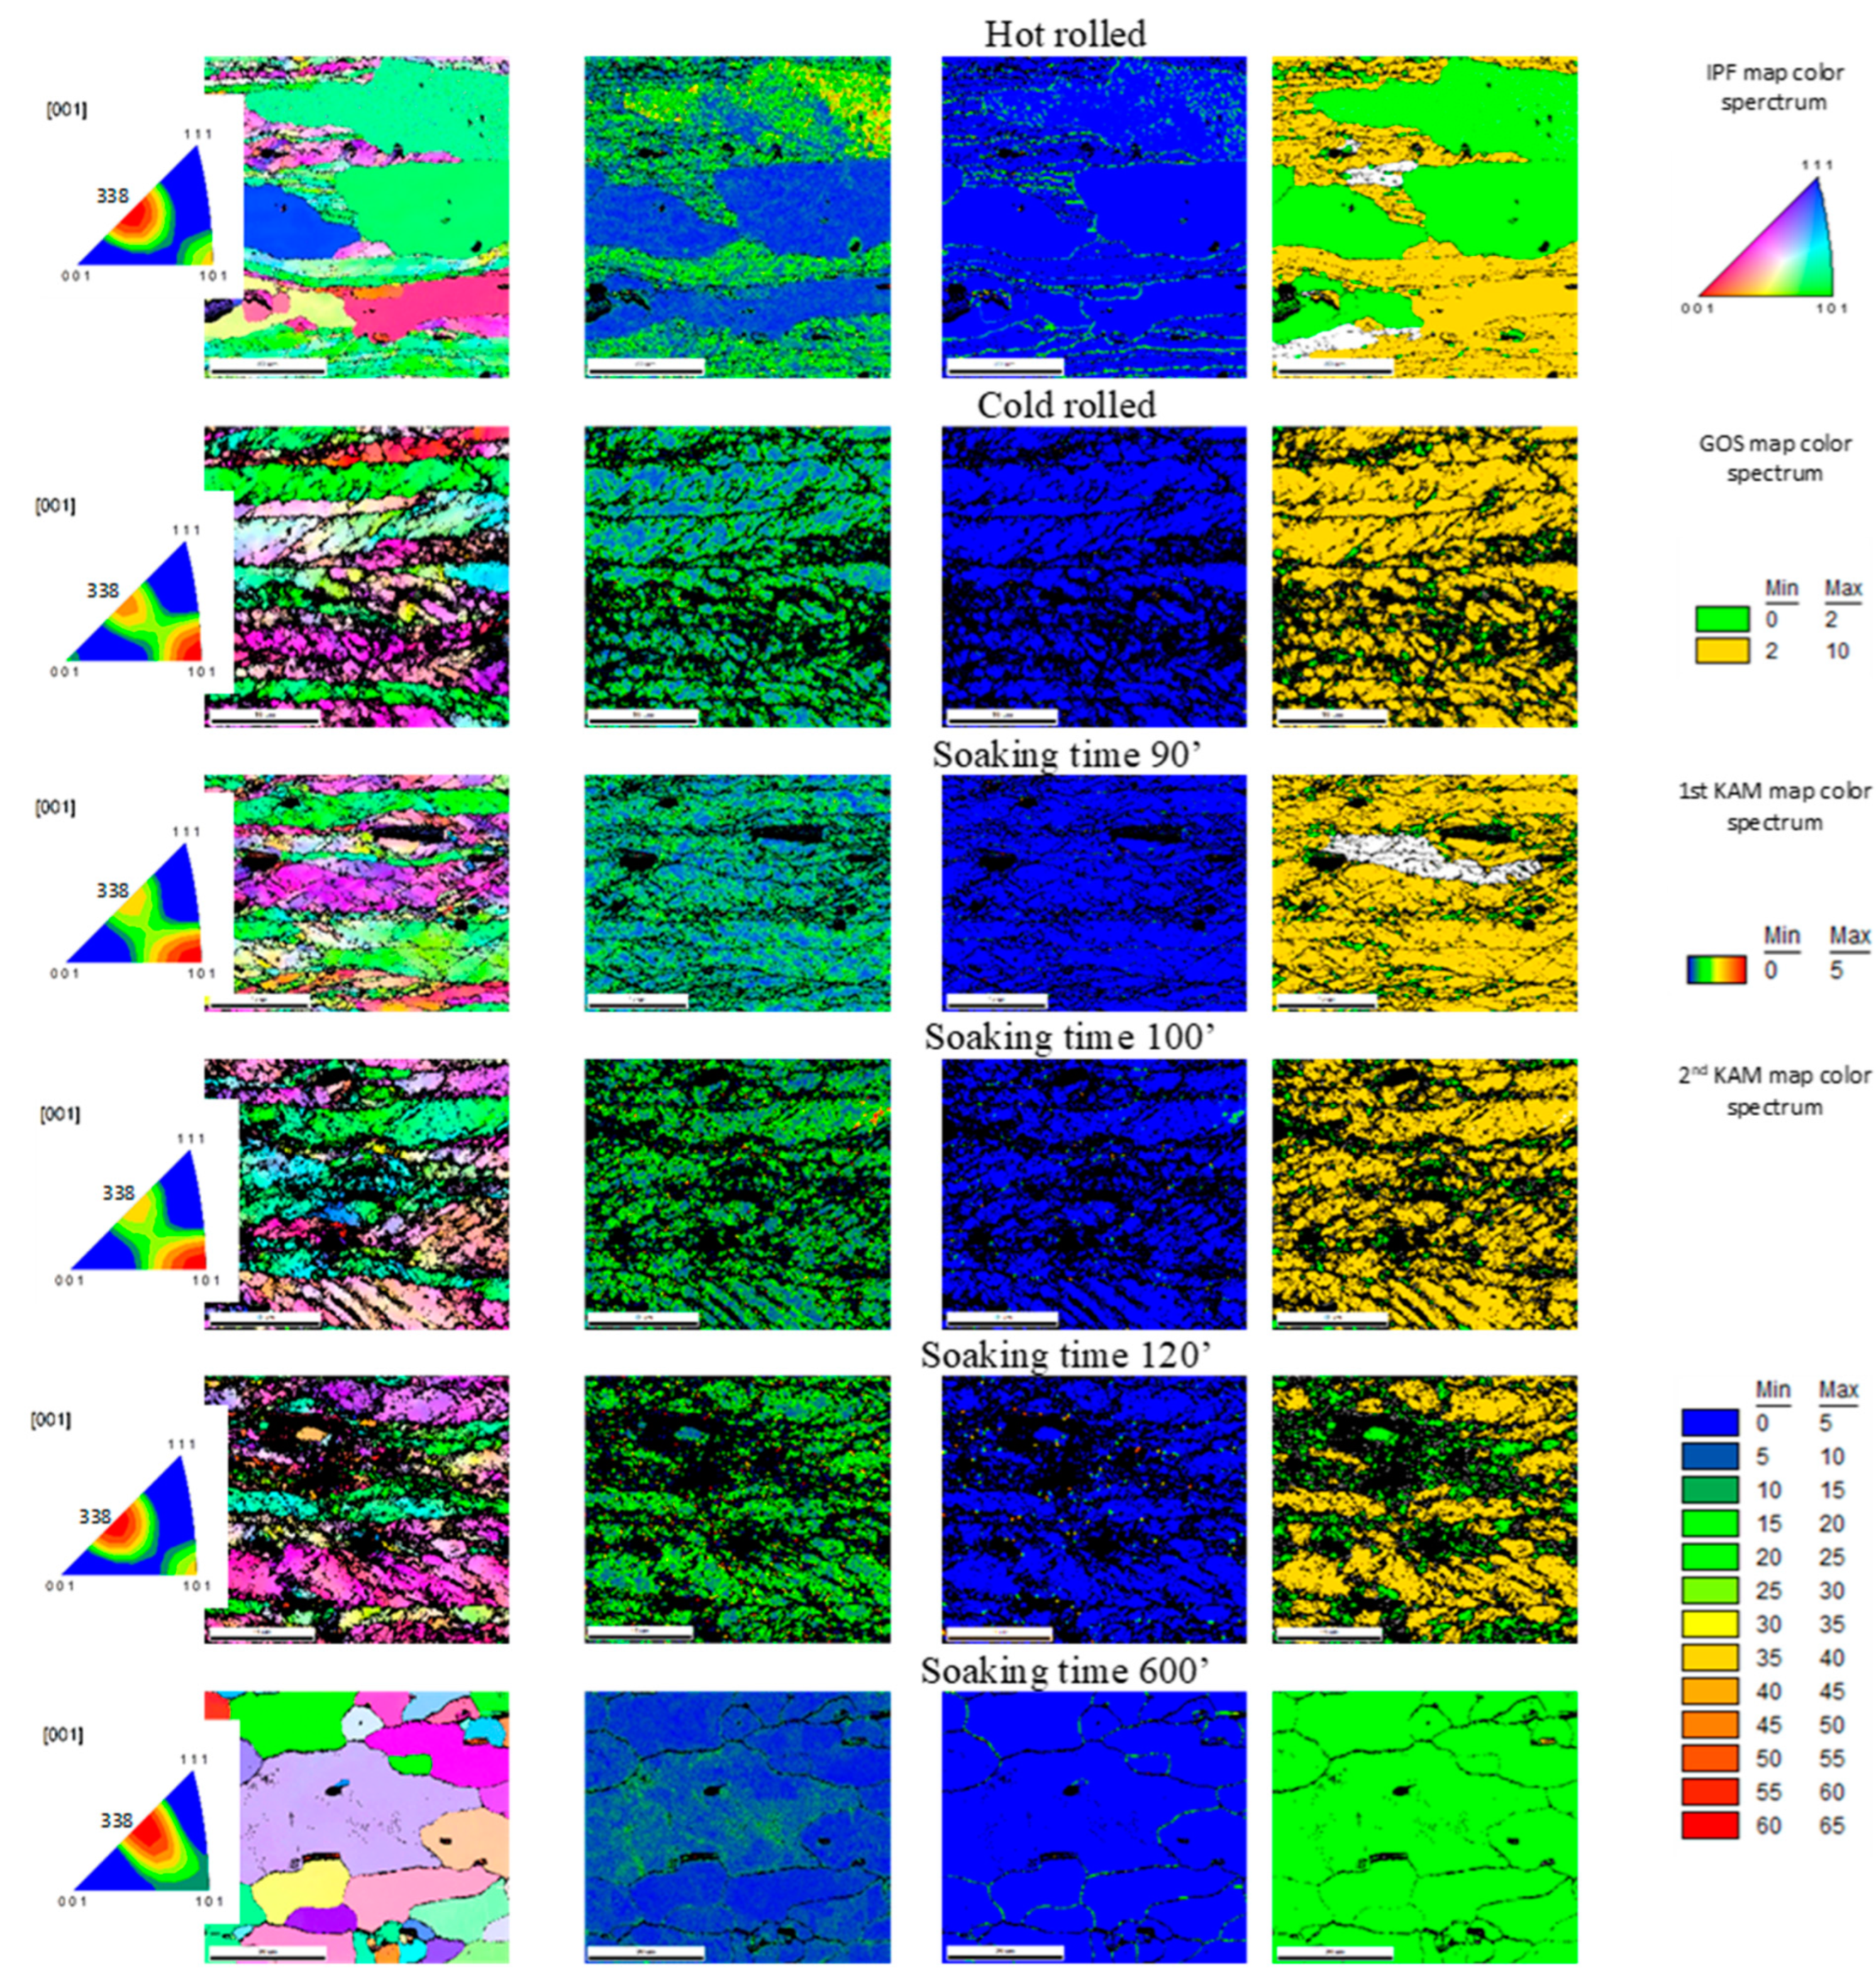
3. Results and Discussion

The hot rolled sample exhibited an elongated microstructure coexisting with few recrystallized large grains (see Figure 1a). After several cold passes, the final microstructure is revealed. The cold rolled sample, after being 95% reduced in thickness, exhibited a “fibrous” microstructure indicating the rolling direction and the high strain rate, Figure 1b. After the first annealing process the microstructure did not alter significantly and retained its directivity towards RD (Figure 1c–e). The final annealing process resulted into a completely recrystallized microstructure characterized by large mostly equiaxed grains (Figure 1d).
In order to observe the recovery evolution and determine its status, KAM and GOS maps were implemented. In particular, KAM maps with different criteria were used. It is noted that the first and the second neighbor as well as the maximum selected angle for the determination of the KAM mean angle and maps exhibit slightly different results. Moreover, in order to observe the misorientation within the grains all possible angles up to 65° were examined.
Two different KAM maps are examined based on
(a)
the second neighbor and a maximum misorientation angle of 5° (as it is used widely in literature) and
(b)
the first neighbor and a maximum misorientation angle of 65°.
These maps are used to characterize the state of each sample and to detect possible crucial points for nuclei formation. The 1st KAM map indicates the zone of high strain. The 2nd KAM map is “stricter” and colors a few areas among the deformed zones green, thus indicating the points with a misorientation higher than 15°. Even red pixels are detected indicating misorientation values higher than 35°. These points are possibly those who lead to nucleation and could be characterized as nuclei. Finally, the GOS map indicates the existence and the gradual growth of nuclei forming recrystallized grains.
In Table 1, the evolution of SGBs (sub-grain boundaries), LAGBs (low-angle grain boundaries) and HAGBS (high-angle grain boundaries) is presented. SGB are reaching a maximum of ≈90%, indicating the completion of recovery and from this point onwards is the initiation of the recrystallization process. Finally, the recrystallized state of the material the fraction of SGBs reaches ≈5%.
As for LAGBs and HAGBs, they exhibit a similar tendency during the process till the final state of the material where the HAGBs dominates with ≈95%.
As for KAM angles, the maximum mean KAM angle is observed for the hot rolled sample (≈2°) and the lowest for the recrystallized one (≈0.7°). All samples but the recrystallized one exhibited a mean KAM angle lower than 1°; thus, its fully recrystallized state was verified.
The cold-rolled sheet in the as received condition had formed a fiber texture starting from (101) orientation towards (338). The fiber texture was maintained except from the final annealing treatment with a soaking time 600’ which exhibited a coarse, equiaxed grain structure (Figure 2).
The IPF maps indicate the dominant orientation at each state in a qualitative way (Figure 2). The hot rolled sample exhibits two main orientations <101> and <338>. During the annealing processes these orientations are maintained along with a fiber of orientations between the two main ones. At the completion of recovery, the observed orientations closely resemble those formed during rolling.
Although the crystallographic texture did not change significantly, intensity varied among the different thermal treatments.
The sub-grain boundaries fractions were lower after hot rolling, whereas they increased significantly after cold rolling and decreased again after the thermal treatments (Table 1).
The correlation between sub-grain boundaries and texture components showed that rolling texture components and recrystallization texture components exhibit an analogous trend at each thermal treatment, while sub grain boundaries exhibited an opposite behavior with regards to their components.
In 3XXX aluminum alloys which have been deformed, a proper recrystallization process shall be utilized resulting into a controlled mean grain size and texture. Cold rolling induces energy in the form of dislocations, whereas this stored energy is released through the re-arrangement of dislocations during recovery yet at the same time no LAGBs and HAGBs occurs. Past this stage, recrystallization provokes the creation of newly formed strain-free grains that continue to grow when additional thermal energy is induced. Those stages are well known; yet, they are not fully understood. The understanding of the movement of SGBs can lead to a more accurate definition of the initiation and completion of the recovery and recrystallization processes [11].
Growth of the sub-grain boundaries depends on the spread of the sub-grain size and LAGBs mobility. The mobility of LAGBs is of great importance in relation the recovery and recrystallization process and especially with regards to the creation of nuclei [19].
Determination of the sub-grain growth is challenging since the size, spread and misorientation of LAGBs are easily disturbed by a number of factors. At the same time, LAGBs exhibit reduced mobility at the recovery stage, thus contributing to the difficulties encountered towards the understanding of the roots or recrystallization [19].
Researchers [23,24,25] who have tried to solve this vacancy observed that certain single crystals that formed microstructures through compression, exhibited sub-grains with a firm range of misorientation capable to provoke extensive recovery before recrystallization. The evolution of EBSD precision has also assisted in the effort for the understanding of the sub-grain’s kinetics. Grains separated by LAGBs are considered to be remnants of deformation when found in a recrystallized material [26,27,28,29,30]. The thermal treatment in all cases led to a high reduction in terms of HAGB fractions. The cold rolled sample exhibited a low percentage of HAGBs and dominant Cu, Brass and S oriented crystallites.
The mean KAM angle in all annealed samples exhibited values less than 1° implying full recrystallization [20] since it is representative of a homogeneous distribution of deformation within the grain, while mean KAM angle values higher than 1° refer to deformed grains [20]. When KAM values vary within the grain, this is due to an inhomogeneous distribution of plastic deformation. When KAM values approach 0° no significant plastic strain is detected after the thermal treatment.
Newly formed grains and areas exhibiting high misorientation angle which are critical for the evolution of the recrystallization process and the position of possible nuclei had been recognized. It is known that sub-grains which are capable of forming new recrystallized grains are those who exhibit high misorientation angle in relation to their neighbors. High misorientation at certain regions such as HAGBs which pre-existed before the thermal treatment can be nucleation points [8].
By reclaiming the retrieved results for the suggested KAM map processing, some interesting points regarding the nucleation process where detected and underlined in the current study.

4. Conclusions

  • The hot-rolled sheet in the as received condition had formed orientations (101) and (338), which were maintained during all the annealing processes and coexisted with the orientations in-between before finally being restored at its initial state after the completion of recrystallization.
  • The SGBs were low after hot rolling any only increased significantly after cold rolling before decreasing again after the thermal treatments.
  • The increase of SGBs from the cold rolled condition until annealing with a soaking time 120′, which occurs mainly in orientations (101), allowed for the accurate definition of the completion point of recovery on the rolled 3104 sheet sample.
  • No significant orientation rotations were observed during the annealing process, whereas the mean KAM angle decreased during annealing.
  • The mobility of LAGBs at soaking times between 90′ and 120′ indicate the evolution of the recovery process.
  • The boundary mobility is found to decrease with a decreasing mean misorientation angle. The mobility of the LAGBs at the recrystallized state were found to be twelve times higher in comparison to the recrystallized state.
  • The KAM approach was focused on the actual misorientation relationships within the grain as well as the detection of the possible nucleation points by use of a simpler way of evaluation, ideal for industrial applications. Multiple samples can be effectively examined in a timely manner; thus, various production stages could be effectively monitored, in terms of microstructure evolution.

References

  1. Das, S.; Yin, W. The worldwide aluminum economy: The current state of the industry. JOM J. Miner. Met. Mater. Soc. 2007, 59, 57–63. [Google Scholar] [CrossRef]
  2. Vargel, C. The Metallurgy of Aluminium. In Corrosion of Aluminium; Elsevier: Amsterdam, The Netherlands, 2004; Chapter A.3; pp. 23–57. [Google Scholar]
  3. Malin, A.; Chen, B. Aluminum Alloys for Packaging; TMS: Pittsburgh, PA, USA, 1993; pp. 251–260. [Google Scholar]
  4. Gloria, A.; Montanari, R.; Richetta, M.; Varone, A. Alloys for Aeronautic Applications: State of the Art and Perspectives. Metals 2019, 9, 662. [Google Scholar] [CrossRef]
  5. Hansen, N.; Huang, X.; Winther, G. Effect of Grain Boundaries and Grain Orientation on Structure and Properties. Metall. Mater. Trans. A 2011, 42, 613–625. [Google Scholar] [CrossRef]
  6. Liu, W.; Morris, J. Texture evolution of polycrystalline AA 5182 aluminum alloy with an initial {0 0 1}<110> texture during rolling. Scr. Mater. 2002, 47, 487–492. [Google Scholar] [CrossRef]
  7. Papadopoulou, S.; Kontopoulou, A.; Gavalas, E.; Papaefthymiou, S. The Effects of Reduction and Thermal Treatment on the Recrystallization and Crystallographic Texture Evolution of 5182 Aluminum Alloy. Metals 2020, 10, 1380. [Google Scholar] [CrossRef]
  8. Engler, O.; Knarbakk, K. Temper rolling to control texture and earing in aluminium alloy AA 5050A. J. Mater. Process. Technol. 2020, 288, 116910. [Google Scholar] [CrossRef]
  9. Kobayashi, R.; Kudo, T.; Tanaka, H. Deformation-texture evolution in deep drawing of cold-rolled 3104 aluminum alloy sheet. J. Jpn. Inst. Light Met. 2019, 69, 387. [Google Scholar] [CrossRef]
  10. Hirsch, J. Textures in Industrial Processes and Products. Mater. Sci. Forum 2011, 702–703, 18. [Google Scholar] [CrossRef]
  11. Doherty, R.; Hughes, D.; Humphreys, F.; Jonas, J.; Jensen, D.J.; Kassner, M.; King, W.; McNelly, T. McQueen and A. Rollett, “Current issues in recrystallization: A review. Mater. Sci. Eng. A 1997, 238, 219–274. [Google Scholar] [CrossRef]
  12. Humphreys, H.M. Recrystallization and Related Annealing Phenomena; Elsevier: Kidlington, UK, 2004. [Google Scholar]
  13. Nolze, G.; Winkelmann, A. About the Reliability of EBSD Measurements: Data Enhancement; EMAS: Trondheim, Norway, 2019. [Google Scholar]
  14. Wilkinson, A. New method for deter-mining small misorientations from electron back scatter diffraction patterns. Scr. Mater. 2001, 44, 2379–2385. [Google Scholar] [CrossRef]
  15. Brough, I.; Bate, P.; Humphreys, F. Optimizing the angular resolution of EBSD. Mater. Sci. Technol. 2006, 22, 1279–1286. [Google Scholar] [CrossRef]
  16. Jiang, J.; Britton, T.; Wilkinson, A. Measurement of geometrically necessary dislocation density with high resolution electron backscatter diffraction: Effects of detector binning and step size. Ultramicroscopy 2013, 125, 1–9. [Google Scholar] [CrossRef] [PubMed]
  17. Kamaya, M. Assessment of local deformation using EBSD: Quantification of ac-curacy of measurement and definition of local gradient. Ultramicroscopy 2011, 111, 1189–1199. [Google Scholar] [CrossRef] [PubMed]
  18. Nolze, G.; Hielscher, R. Orientations –perfectly colored. J. Appl. Crystallogr. 2016, 49, 1786–1802. [Google Scholar] [CrossRef]
  19. Humphreys, F.; Hatherly, M. Recrystallization and Related Annealing Phenomena. Pergamon 1995, 397–398. [Google Scholar]
  20. Wang, C.; Wang, C.; Xu, J.; Zhang, P.; Shan, D.; Guo, B. Interactive effect of microstructure and cavity dimension on filling behavior in micro coining of pure nickel. Nature 2016, 6, 1–10. [Google Scholar] [CrossRef]
  21. Fan, X.; Li, Y.; Xua, C.; Wang, B.; Peng, R.; Chen, J. Improved mechanical anisotropy and texture optimization of a 3xx aluminum alloy by differential temperature rolling. Mater. Sci. Eng. A 2021, 799, 140278. [Google Scholar] [CrossRef]
  22. Takayama, Y.; Yoshimura, T.; Watanabe, H. Relationship between strain stored by compressive deformation and crystallographic orientation in a pure aluminum. ICOTOM IOP Conf. Ser. Mater. Sci. Eng. 2015, 82, 012029. [Google Scholar] [CrossRef]
  23. Ferry, M.; Humphreys, F. Discontinuous subgrain growth in deformed and annealed {110}h001ialumi-num single crystals. Acta Metall. Mater. 1996, 44, 1293–1308. [Google Scholar] [CrossRef]
  24. Huang, Y.; Humphreys, F. Subgrain growth and low angle boundary mobility in aluminum crystals of orientation {110}h001i. Acta Mater. 2000, 48, 2017–2030. [Google Scholar] [CrossRef]
  25. Huang, Y.; Humphreys, F. The annealing behaviour of deformed cube-oriented aluminum single crystals. Acta Mater. 2000, 48, 2543–2556. [Google Scholar] [CrossRef]
  26. Mishin, O.; Godfrey, A.; Jensen, D.J.; Hansen, N. Recovery and recrystallization in commercial purity aluminum cold. Acta Mater. 2013, 61, 5354–5364. [Google Scholar] [CrossRef]
  27. Molotnikov, A.; Lapovok, R.; Gu, C.; Davies, C.; Estrin, Y. Size effects in micro cup drawing. Mater. Sci. Eng. A 2012, 550, 312–319. [Google Scholar] [CrossRef]
  28. Tikhovskiy, D.F.I. Simulation of earing during deep drawing of an Al–3% Mg alloy (AA 5754) using a texture component crystal plasticity FEM. J. Mater. Process. Technol. 2007, 183, 2–3. [Google Scholar] [CrossRef]
  29. Zhao, Z.S.; Mao, W.M.; Roters, F.; Raabe, D. A texture optimization study for minimum earing in aluminium by use of a texture component crystal plasticity finite element method. Acta Mater. 2004, 52, 1003–1012. [Google Scholar] [CrossRef]
  30. Li, S.; Zhang, X.; Zhou, H.; Gottstein, G. Crystallographic analysis of the influence of stress state on earing behavior in deep drawing of face-centered cubic metals. Metall. Mater. Trans. A 1997, 28, 785–793. [Google Scholar] [CrossRef]
Figure 1. Optical micrographs showing (a) hot rolled sample, (b) cold rolled sample, (c) cold rolled and annealed for 90’, (d) cold rolled and annealed for 100’ and (e) cold rolled and annealed for 100’ and (f) cold rolled and annealed for 600’ after Barker’s etch.
Materproc 03 00011 g001
Figure 2. Indicative results of the examined samples exhibiting (from left to right) IPF (inverse pole figure) maps, KAM maps (with maximum misorientation angle 5° and measuring the kernel according to the second neighbor) KAM maps (with maximum misorientation angle 65° and measuring the kernel according to the first neighbor) and GOS (grain orientation spread) maps.
Materproc 03 00011 g002
Table 1. Misorientation grain boundaries and KAM (kernel average misorientation) values measured for the examined samples.
Misorientation Grain BoundariesHot RolledCold RolledSoaking Time 90’Soaking Time 100’Soaking Time 120’Soaking Time 600’
2–5° (%)48.586.683.889.8%72.44.9
5–15° (%)26.96.38.55.914.80.8
15–65° (%)24.67.17.74.312.894.3
KAM
Mean KAM
Angle (°)
2.21.11.31.61.10.7
KAM (%)9156.649.842.871.594.9
Publisher’s Note: MDPI stays neutral with regard to jurisdictional claims in published maps and institutional affiliations.

