
Flood Detection in Complex Surface Mining Areas Using Satellite Data for Sustainable Management †

 , , , and
Abstract
:1. Introduction
2. Materials and Methods
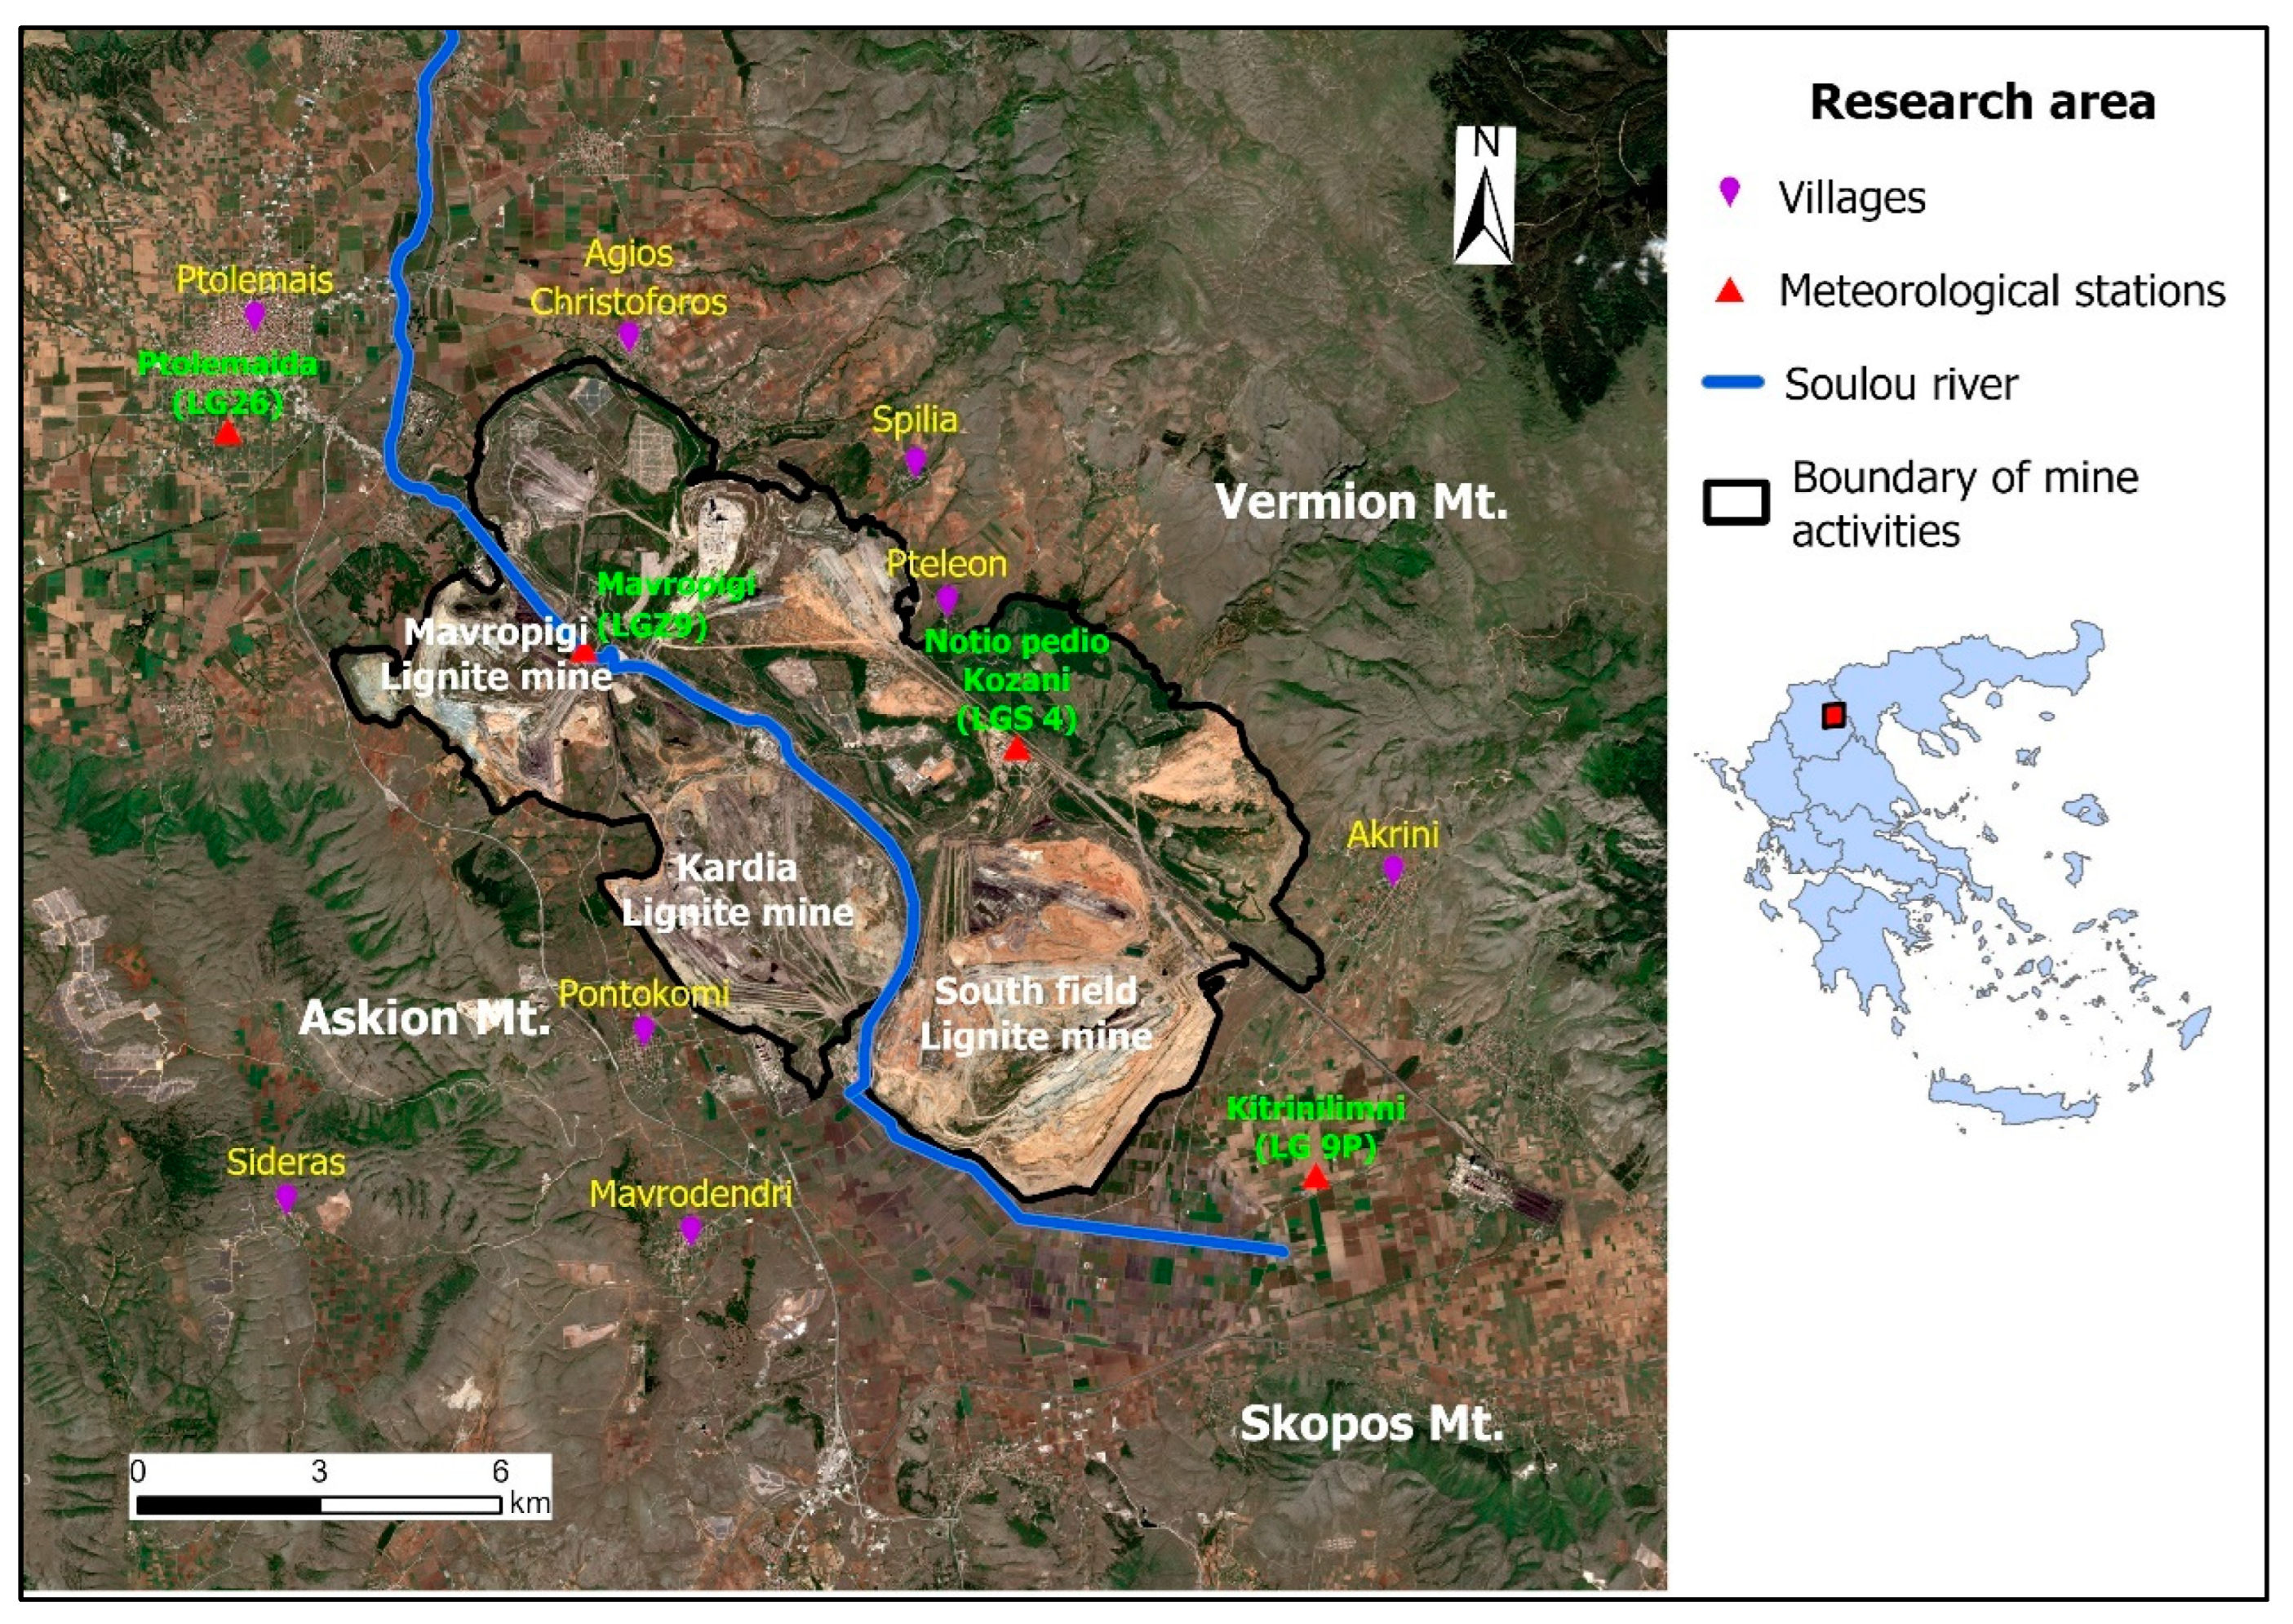
2.1. Research Area
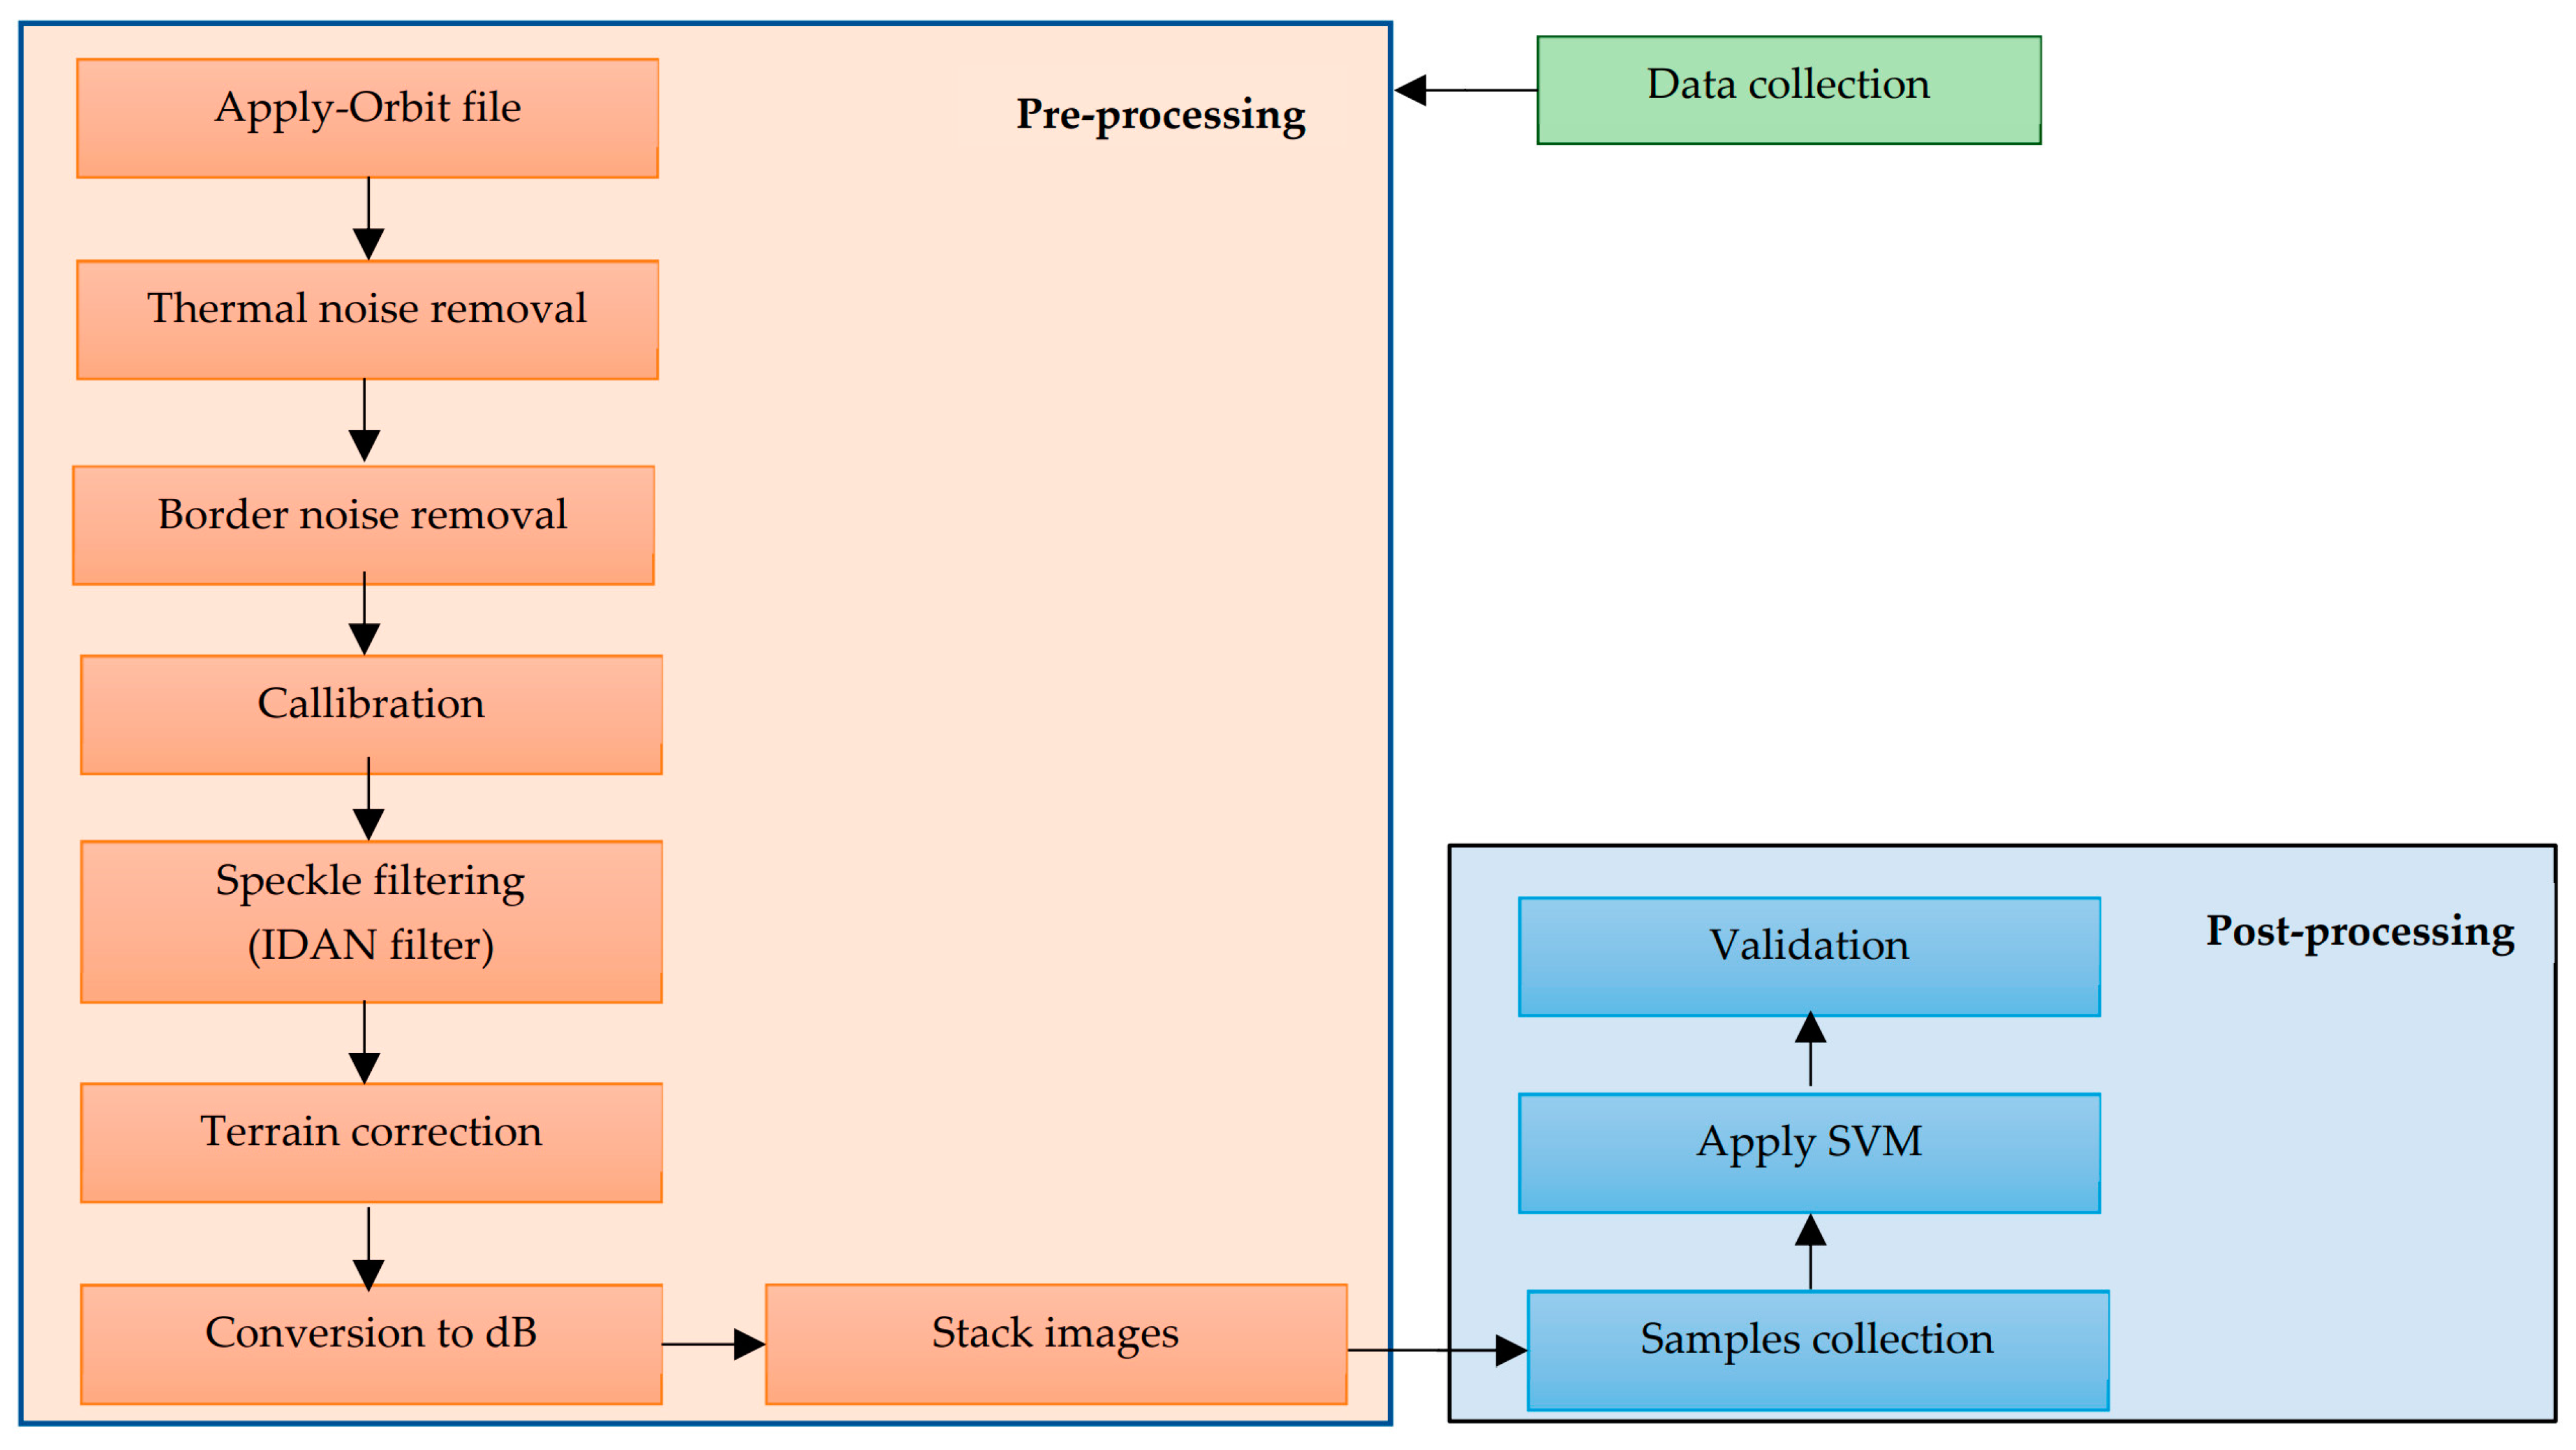
2.2. Methods
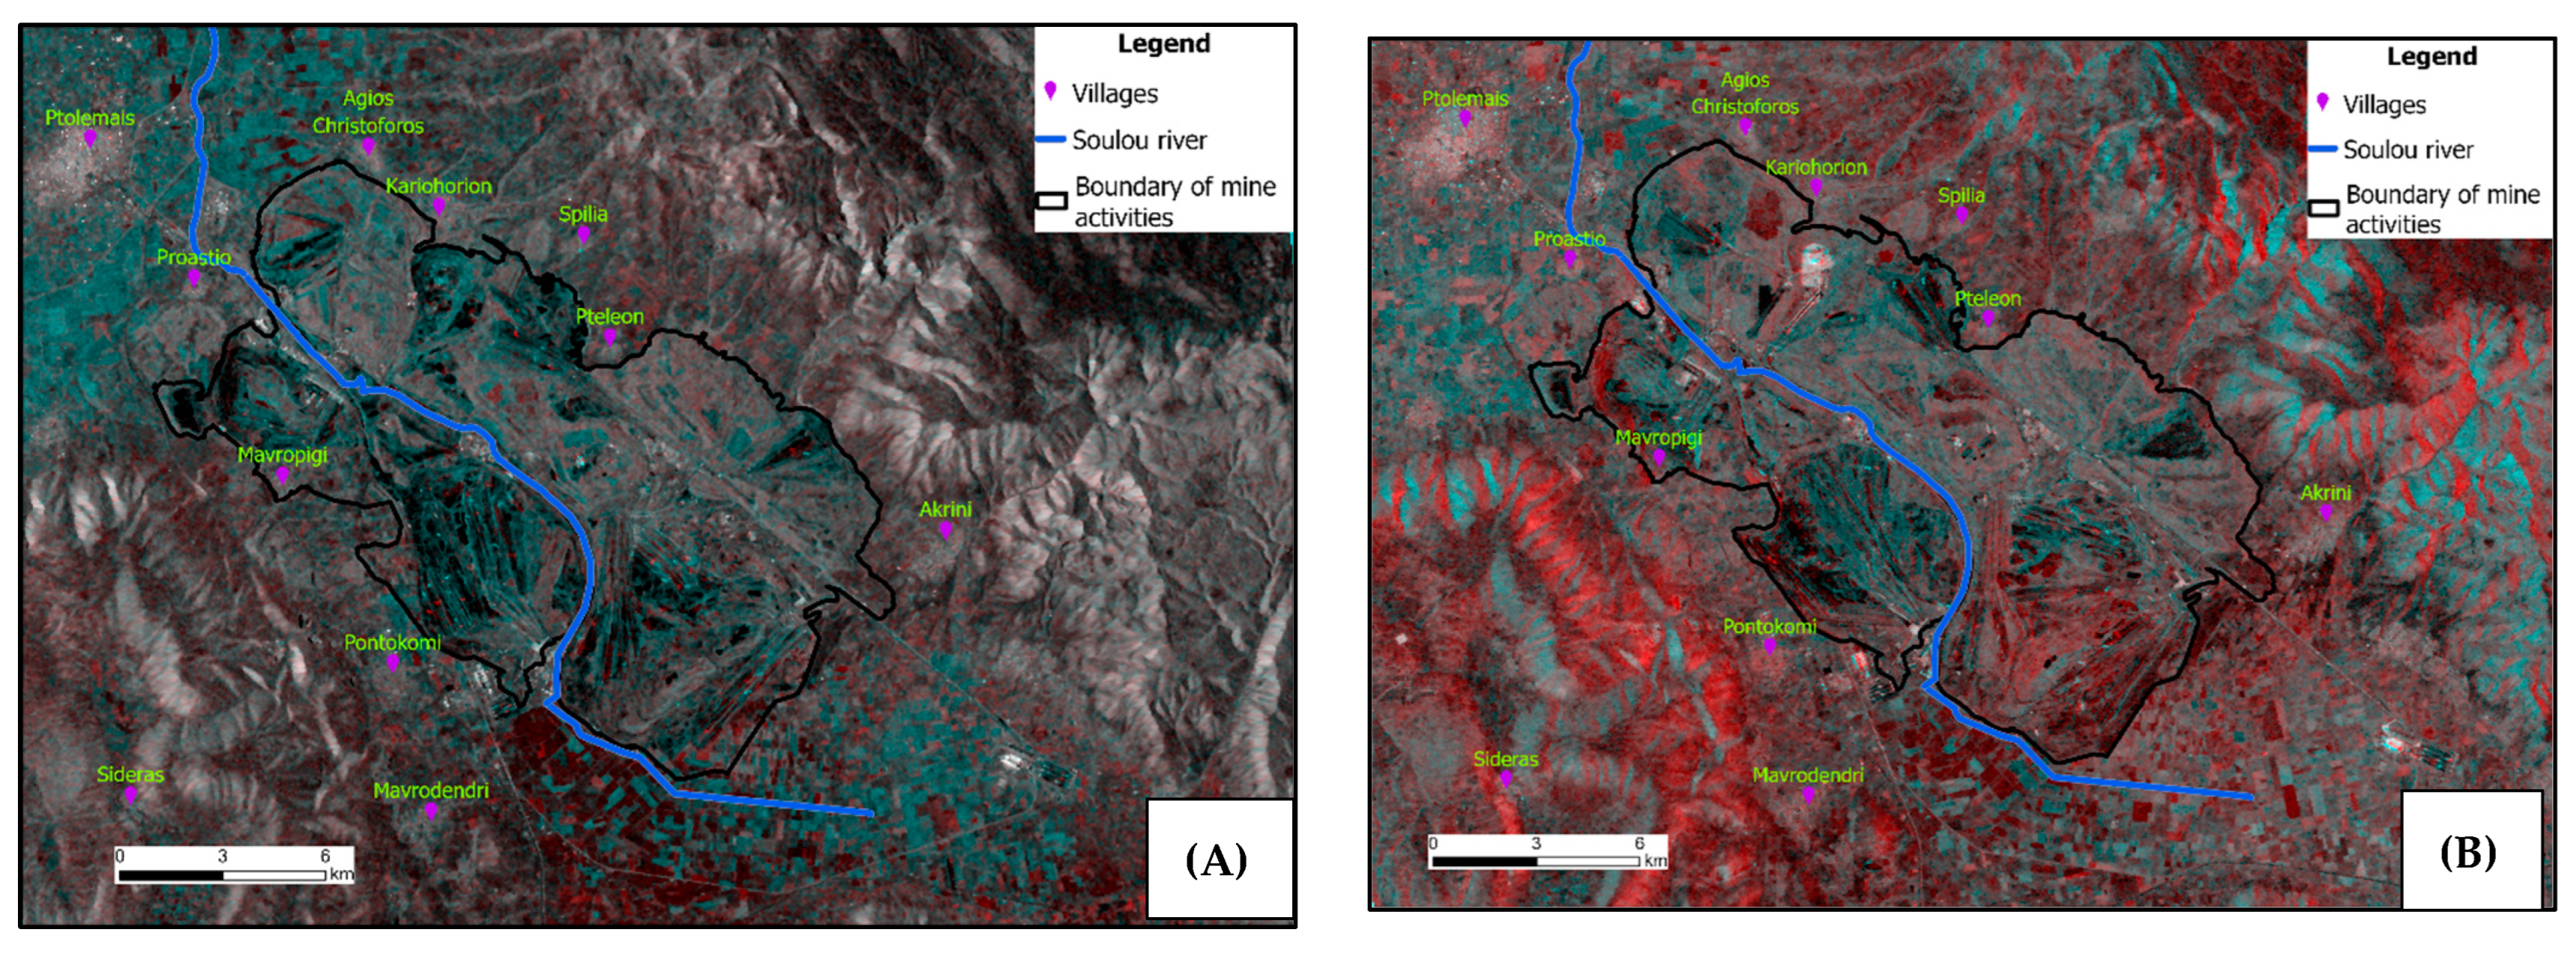
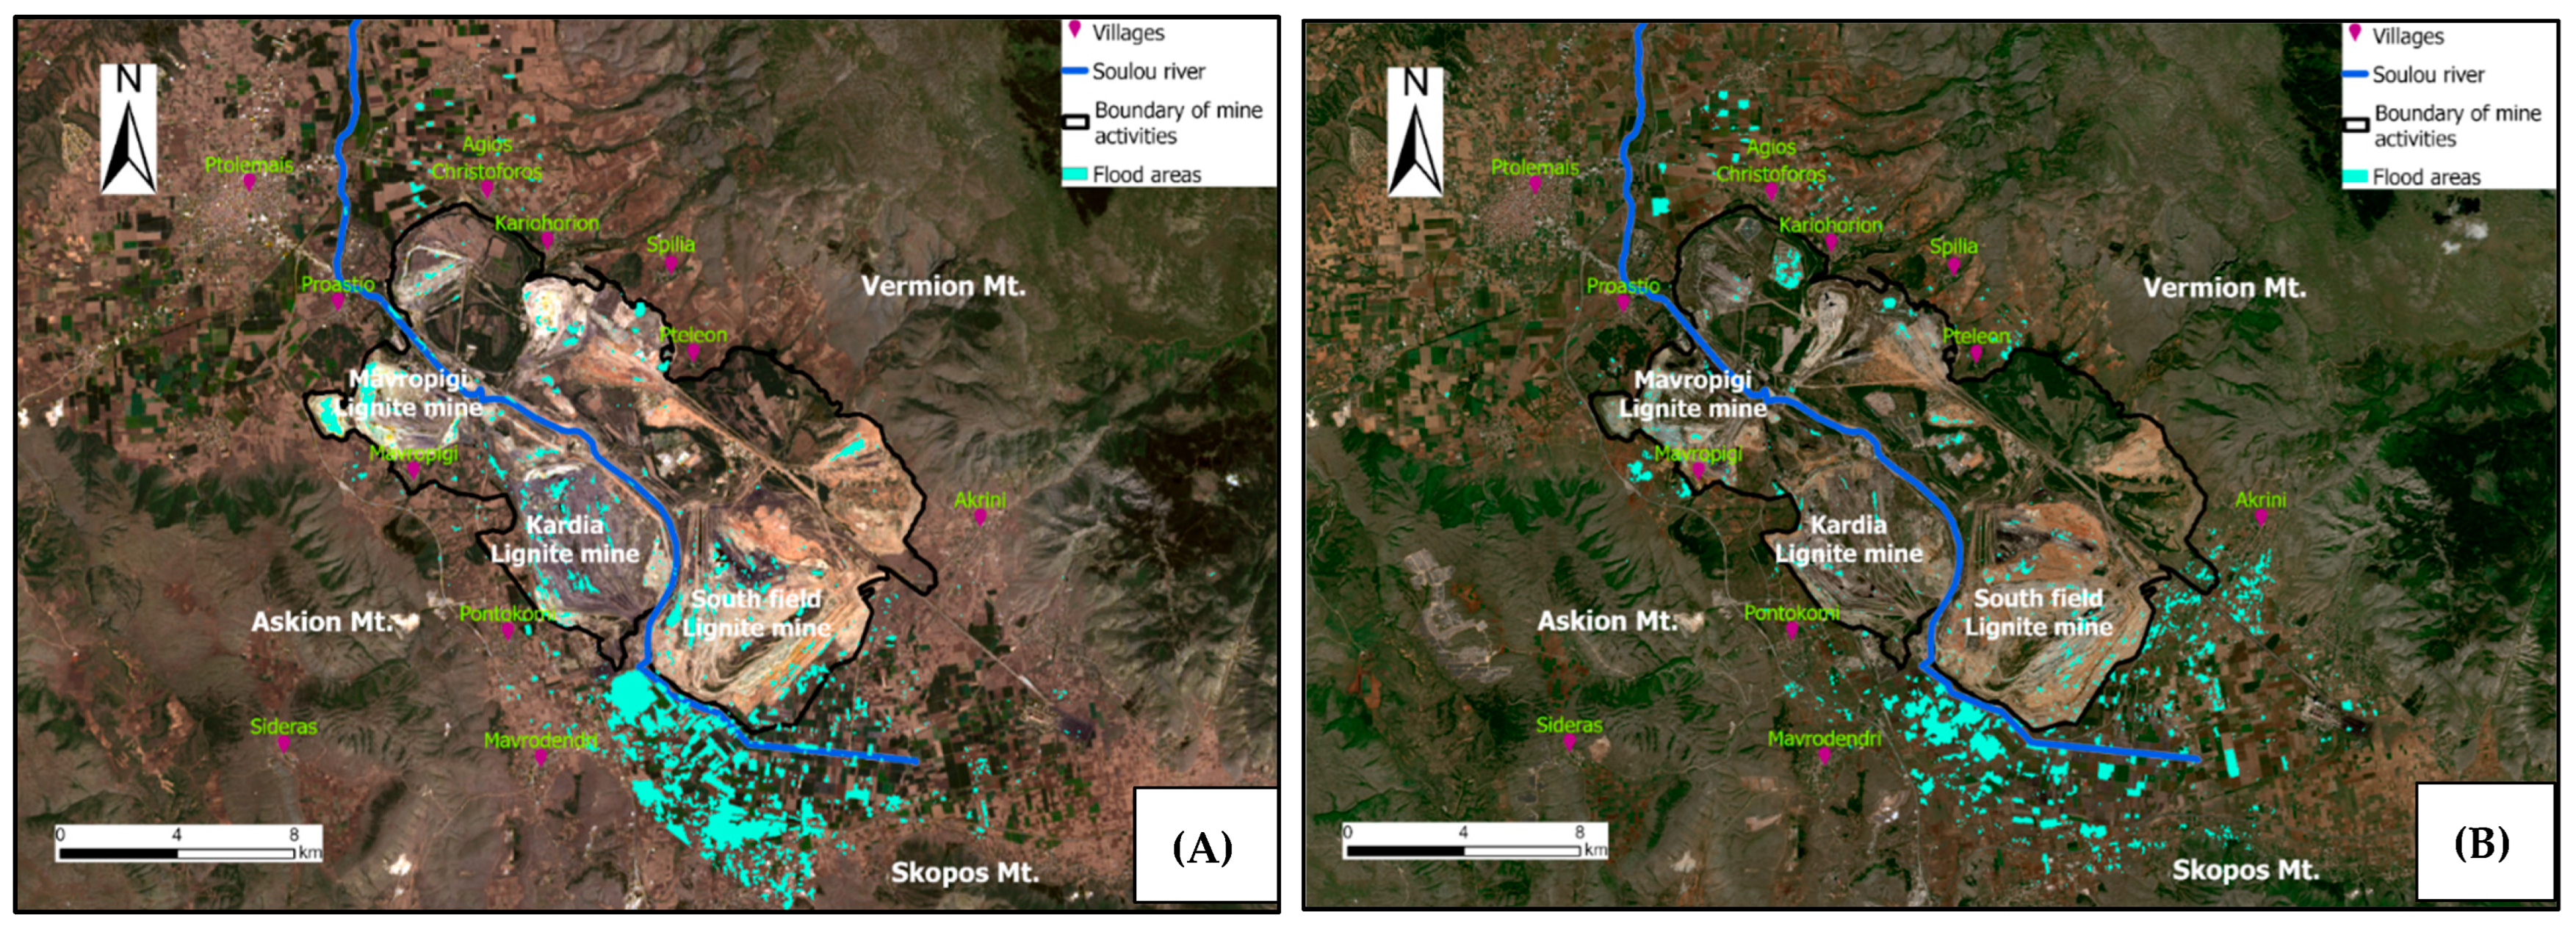
3. Results and Discussion
4. Conclusions
Author Contributions
Funding
Institutional Review Board Statement
Informed Consent Statement
Data Availability Statement
Conflicts of Interest
References
- World Health Organisation. Floods. Available online: https://www.who.int/health-topics/floods#tab=tab_1 (accessed on 4 April 2023).
- Sharifi, A. Development of a Method for Flood Detection Based on Sentinel-1 Images and Classifier Algorithms. Water Environ. J. 2021, 35, 924–929. [Google Scholar] [CrossRef]
- Tran, K.H.; Menenti, M.; Jia, L. Surface Water Mapping and Flood Monitoring in the Mekong Delta Using Sentinel-1 SAR Time Series and Otsu Threshold. Remote Sens. 2022, 14, 5721. [Google Scholar] [CrossRef]
- Pham-Duc, B.; Prigent, C.; Aires, F. Surface Water Monitoring within Cambodia and the Vietnamese Mekong Delta over a Year, with Sentinel-1 SAR Observations. Water 2017, 9, 366. [Google Scholar] [CrossRef]
- Ovakoglou, G.; Cherif, I.; Alexandridis, T.K.; Pantazi, X.-E.; Tamouridou, A.-A.; Moshou, D.; Tseni, X.; Raptis, I.; Kalaitzopoulou, S.; Mourelatos, S. Automatic Detection of Surface-Water Bodies from Sentinel-1 Images for Effective Mosquito Larvae Control. J. Appl. Remote Sens. 2021, 15, 014507. [Google Scholar] [CrossRef]
- D’Addabbo, A.; Refice, A.; Pasquariello, G.; Lovergine, F.P.; Capolongo, D.; Manfreda, S. A Bayesian Network for Flood Detection Combining SAR Imagery and Ancillary Data. IEEE Trans. Geosci. Remote Sens. 2016, 54, 3612–3625. [Google Scholar] [CrossRef]
- Antoniadis, A.; Roumpos, C.; Anagnostopoulos, P.; Paraskevis, N. Planning RES Projects in Exhausted Surface Lignite Mines—Challenges and Solutions. In Proceedings of the International Conference on Raw Materials and Circular Economy, Athens, Greece, 5–9 September 2021; MDPI: Basel, Switzerland, 2022; p. 93. [Google Scholar]
- Louloudis, G.; Roumpos, C.; Louloudis, E.; Mertiri, E.; Kasfikis, G. Repurposing of a Closed Surface Coal Mine with Respect to Pit Lake Development. Water 2022, 14, 3558. [Google Scholar] [CrossRef]
- Awad, M.; Khanna, R. Support Vector Machines for Classification. In Efficient Learning Machines; Apress: Berkeley, CA, USA, 2015; pp. 39–66. ISBN 978-1-4302-5989-3. [Google Scholar]
- Jagtap, P.; Shafiyoddin, S. Comparative Study of Various Single Product Speckle Filters of SAR Dataset of Sentinel-1 Satellite for Speckle Noise Reduction. Int. J. Creat. Res. Thoughts 2021, 9, c87–c95. [Google Scholar]
- Luque, A.; Carrasco, A.; Martín, A.; De Las Heras, A. The Impact of Class Imbalance in Classification Performance Metrics Based on the Binary Confusion Matrix. Pattern Recognit. 2019, 91, 216–231. [Google Scholar] [CrossRef]


| Acquisition Date | Mode | Orbit | Pixel Size | Polarization |
|---|---|---|---|---|
| 27 May 2016 (pre-flood) | IW | Ascending | 10 × 10 | VV-VH |
| 12 September 2016 (post-flood) | IW | Ascending | 10 × 10 | VV-VH |
| 1 June 2022 (pre-flood) | IW | Ascending | 10 × 10 | VV-VH |
| 24 August 2022 (post-flood) | IW | Ascending | 10 × 10 | VV-VH |
| ClassValue | Flood | Non-Flood | Total | U_Accuracy (%) | Kappa |
|---|---|---|---|---|---|
| Flood | 32 | 2 | 34 | 94 | 0 |
| Non-flood | 6 | 460 | 466 | 99 | 0 |
| Total | 38 | 462 | 500 | 0 | 0 |
| P_Accuracy (%) | 84 | 100 | 0 | 98 | 0 |
| Kappa | 0 | 0 | 0 | 0 | 88 |
| ClassValue | Flood | Non-Flood | Total | U_Accuracy (%) | Kappa |
|---|---|---|---|---|---|
| Flood | 22 | 5 | 27 | 81 | 0 |
| Non-flood | 4 | 469 | 473 | 99 | 0 |
| Total | 26 | 474 | 500 | 0 | 0 |
| P_Accuracy (%) | 85 | 99 | 0 | 98 | 0 |
| Kappa | 0 | 0 | 0 | 0 | 82 |
Disclaimer/Publisher’s Note: The statements, opinions and data contained in all publications are solely those of the individual author(s) and contributor(s) and not of MDPI and/or the editor(s). MDPI and/or the editor(s) disclaim responsibility for any injury to people or property resulting from any ideas, methods, instructions or products referred to in the content. |
© 2023 by the authors. Licensee MDPI, Basel, Switzerland. This article is an open access article distributed under the terms and conditions of the Creative Commons Attribution (CC BY) license (https://creativecommons.org/licenses/by/4.0/).
Share and Cite
Karalidis, K.; Louloudis, G.; Roumpos, C.; Mertiri, E.; Pavloudakis, F. Flood Detection in Complex Surface Mining Areas Using Satellite Data for Sustainable Management. Mater. Proc. 2023, 15, 1. https://doi.org/10.3390/materproc2023015001
Karalidis K, Louloudis G, Roumpos C, Mertiri E, Pavloudakis F. Flood Detection in Complex Surface Mining Areas Using Satellite Data for Sustainable Management. Materials Proceedings. 2023; 15(1):1. https://doi.org/10.3390/materproc2023015001
Chicago/Turabian StyleKaralidis, Konstantinos, Georgios Louloudis, Christos Roumpos, Eleni Mertiri, and Francis Pavloudakis. 2023. "Flood Detection in Complex Surface Mining Areas Using Satellite Data for Sustainable Management" Materials Proceedings 15, no. 1: 1. https://doi.org/10.3390/materproc2023015001