1. Introduction
Due to their unique physical, chemical, and electronic properties, metal and polymer nanoparticles can be used in the energy, environmental studies, and biomedicine industries [
1,
2,
3]. It is possible to tune the geometric, optical, and surface properties of the synthesized nanomaterials for specific applications.
The liquid dispersions of nanoparticles have been applied as contrast agents in the imaging and treatment of tumors, in the detection of pathogens of infectious diseases, and in targeted drug delivery [
4].
Gold nanoparticles are chemically stable, biocompatible with living tissues, and non-toxic, such as gold itself [
5]. In addition, nanostructures are endowed with unique catalytic, ferromagnetic, and optical properties. The optical properties of colloidal gold such as absorption, scattering, fluorescence, and Raman scattering (SERS) are determined by plasmonic oscillations of electrons in the metal and can be tuned. During the interaction of a gold nanoparticle with the substance under study, its physicochemical properties, such as the surface plasmon resonance, conductivity, and redox potential, can change. These properties have been applied in the diagnosis and treatment of malignant tumors [
6,
7].
However, it was shown that only a small fraction of the nanoparticle injection dose (<0.7%) reaches the target [
8]. This leads to the conclusion that nanocarriers have some organism barriers to overcome before they can achieve a therapeutic effect.
Under such circumstances, it is necessary to carefully control the monodispersity of the samples used. A large variation in the particle size distribution of a sample will lead to a decrease in the therapeutic effect. For such needs, methods based on light scattering can be applied.
Currently, the most common method for studying various nanostructures is transmission electron microscopy (TEM). Due to its high-resolution capability, TEM allows for the visualization and characterization of the nanoparticle size and shape, and enables the investigation of complex nanostructures. However, it is noted that TEM does not provide information about the hydrodynamic size of particles [
9]. Therefore, if the hydrodynamic size needs to be measured, an approximate value of the thickness of the stabilizing layer covering the particles is added to the measured size values. Moreover, it should be noted that when obtaining measurements using TEM, the data obtained from a small sample are generalized to the entire sample. This implies that the obtained images do not allow for the accurate assessment of the particle concentration.
The scattering of light by particles is a very useful property that has been applied in many areas of science. One of these is the determination of the size of the nanoparticles by analyzing the intensity function of the laser radiation scattered by them. Methods based on light scattering make it possible to analyze the liquid dispersions of the nanoparticles without complex sample preparation, which makes them the most convenient methods for rapid analysis, for example, in technological processes or for tracking the dynamics of processes in the liquid dispersions of nanoparticles such as particle aggregation, various chemical reactions, phase transitions, etc. There are various methods for this analysis. In this paper, we consider the well-studied method of dynamic light scattering and the recently widely used method of nanoparticle tracking analysis.
Dynamic light scattering (DLS) is a method that is used to measure the diffusion coefficient and hydrodynamic radius of nanoparticles in liquid dispersions by analyzing the temporal autocorrelation function of the scattered light intensity. DLS is commonly used for determining particle sizes in transparent dispersions and low concentrations due to multiple scattering at higher concentrations. The DLS measurements can be 90% higher than the TEM readings because they give insight into the functional groups of particles located on the surface by measuring the hydrodynamic particle diameter [
10].
The nanoparticle tracking analysis (NTA) method does not require complex sample preparation and allows for the determination of the nanoparticle size, as well as the characterization of the liquid dispersions such as the particle concentration, presence of large impurities and particle aggregates, and degree of sample polydispersity. However, one of the unique and useful features of the method is the ability to simultaneously measure the light scattering intensity from individual particles, allowing for the differentiation of particles based on the material composition. Thus, particles in the same sample with the same size but a different composition and refractive index can be distinguished [
11].
The NTA method has a wide measurement range for nanoparticle sizes, a wide range of measurement for electrophoretic mobility, and the ability to determine the geometric parameters of nonspherical particles within a measurement time of up to 10 min for one sample.
2. Methods and Materials
2.1. Nanoparticles Samples
Experimental data were obtained by observing the movement of latex and gold nanoparticles of different sizes. Polystyrene latex nanoparticles with the diameter of 180 nm were used as the reference sample. Transmission electron microscopy (TEM) was used to determine the particle sizes. Nanoparticles were dispersed in deionized water to a concentration ranging from 10
7 to 10
9 particles per mL, in order to provide an acceptable concentration for measurements using the NTA method. Information about the sizes of gold nanoparticles is presented in
Table 1.
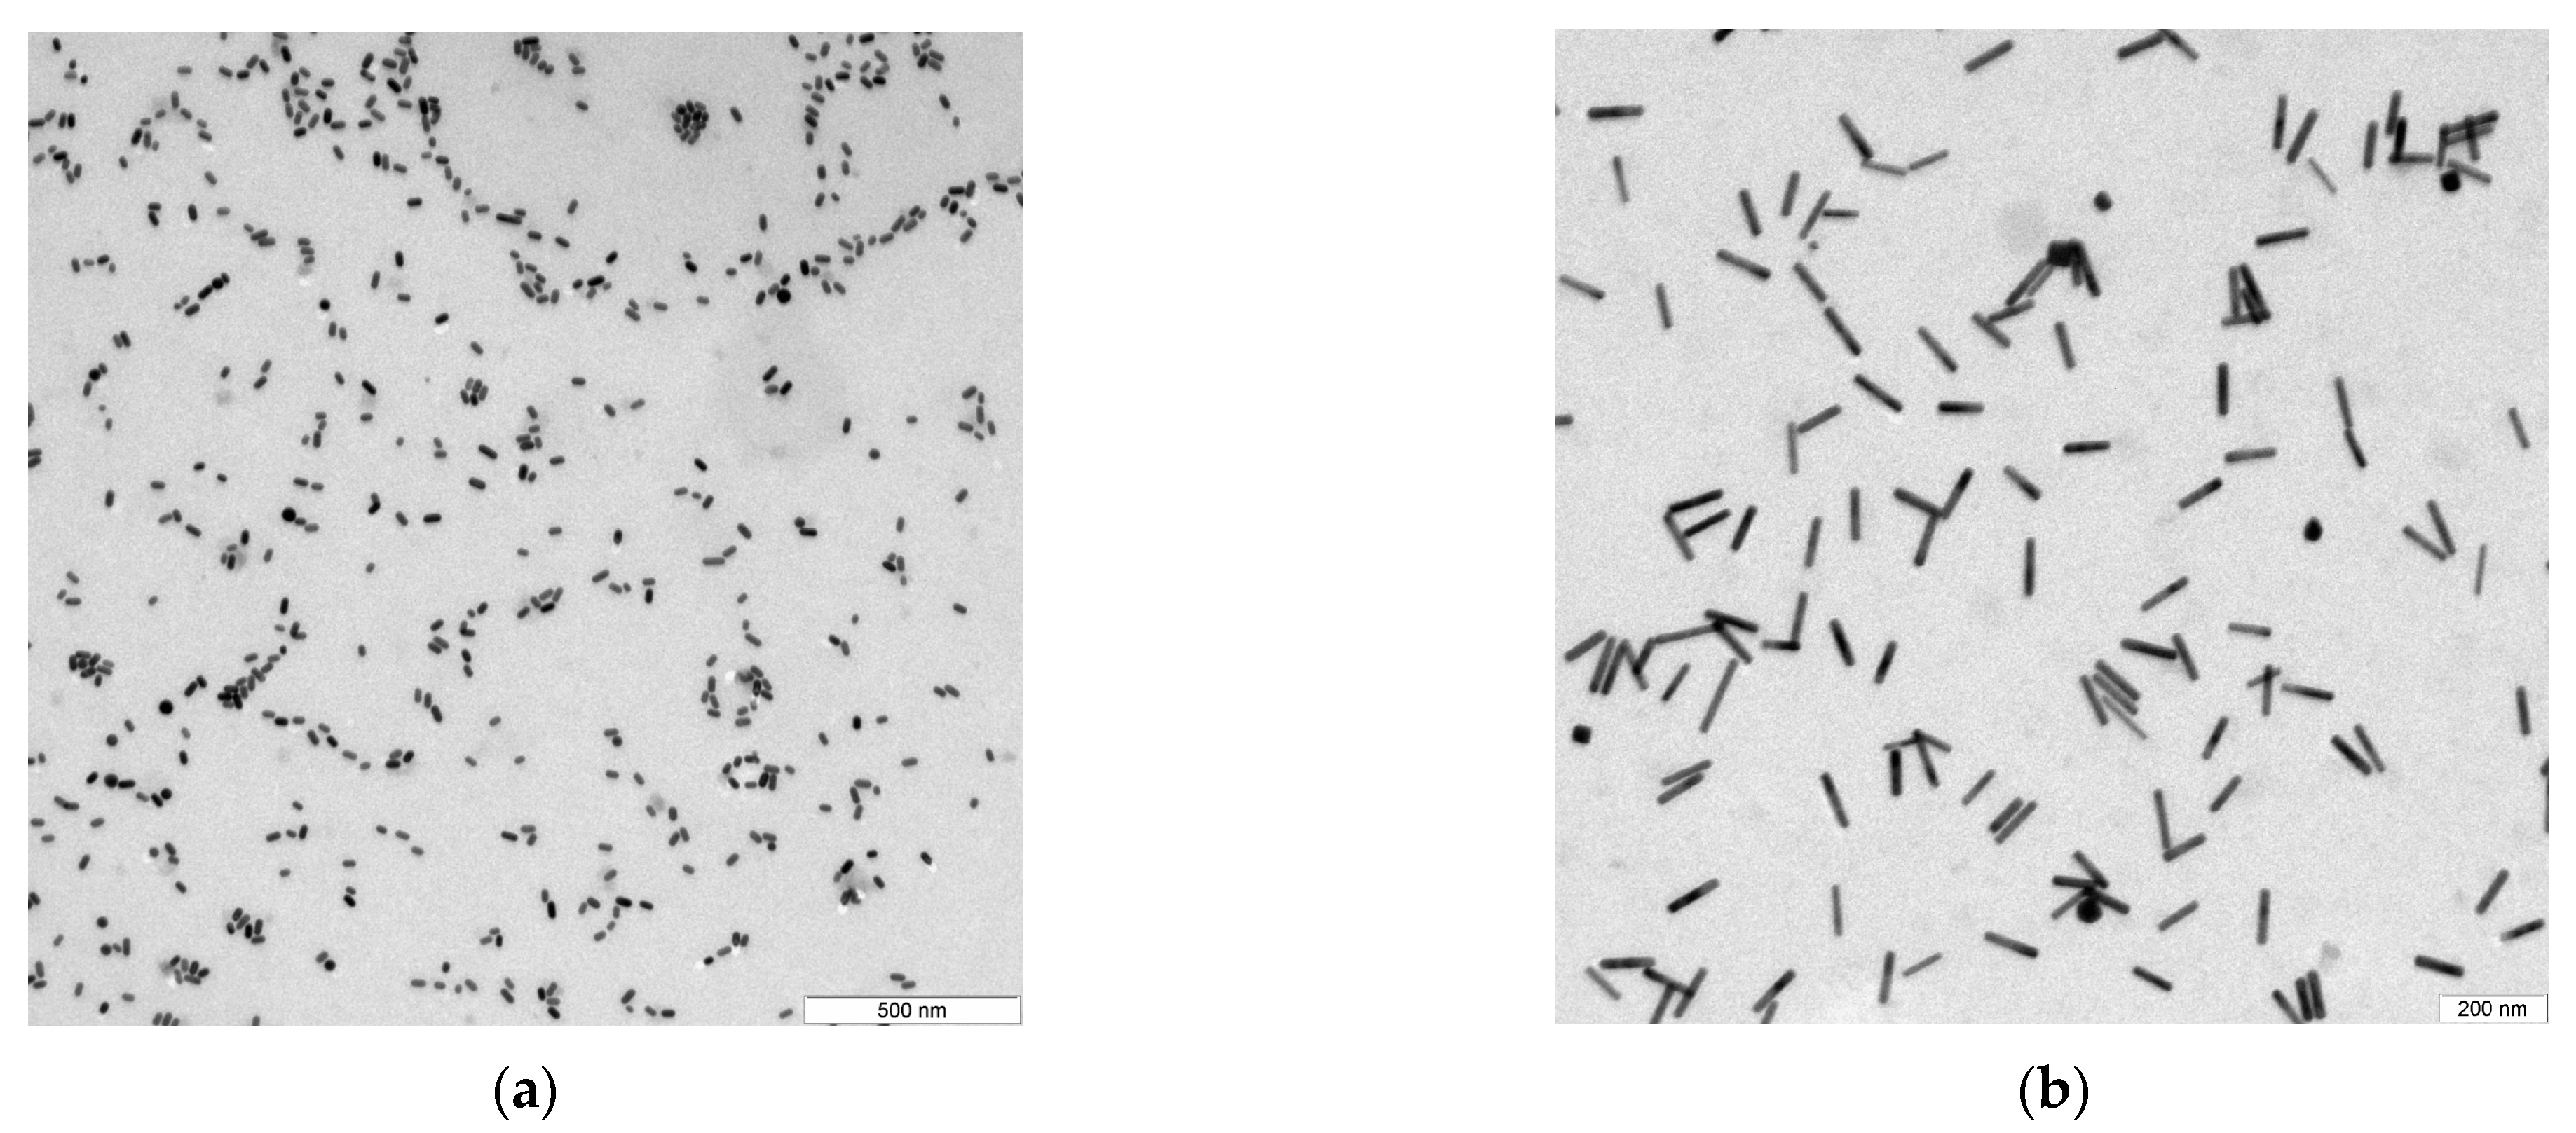
Samples of gold nanorods were studied as well as the spherical nanoparticles, and although the DLS and NTA methods in their pure form are not suitable for measuring such nanoparticles, they allow for the indirect measurement of the characteristics of liquid dispersions (
Figure 1). Samples 2–6 correspond to nanorods with aspect ratios of 2–6, respectively.
2.2. Dynamic Light Scattering
In the dynamic light scattering (DLS) method, the scattering coefficient of the liquid scattering of particles is determined by analyzing the correlation function of the scattered light intensity fluctuations caused by the Brownian motion of the particles. The hydrodynamic radius R can be obtained using the Stokes–Einstein equation [
12].
A Photocor Complex dynamic and static multi-angle light scattering apparatus (Photocor Ltd., Moscow, Russia) was used to measure the size of the nanoparticles using the DLS method.
During the experiment, the samples were irradiated with a laser beam with a wavelength of 657 nm. Water was used as a solvent. The temperature of the samples examined was 24 °C. Autocorrelation function measurements were obtained for a scattering angle of 90°.
The time-dependent correlation function accumulation time was about 20 s per sample. Correlation function analysis measured as a function of time was performed using the distribution analysis method.
2.3. Nanoparticle Tracking Analysis
Nanoparticle tracking analysis (NTA) is a relatively new technology that has become widespread in recent years and has shown that it can reliably measure the hydrodynamic diameter of many nanoparticle types. NTA is increasingly being used in pharmaceuticals, biomedicine, research, and other fields of science and technology [
13,
14].
When the studied sample of liquid dispersion of nanoparticles is irradiated with laser beam, a camera with microscope objective captures a video of the Brownian motion of particles. The analyzing software determines the average distance moved by each particle in two directions (
x,
y). Due to the obtained data, the particle diffusion
Dt coefficient can be determined as follows:
Here, K—Boltzmann coefficient, T—absolute temperature, η—viscosity of medium, and d—the sphere equivalent hydrodynamic diameter of a particle.
The NTA measurements were carried out using a nanoparticle tracking analyzer Photocor Nanotrack (Photocor LLC, Moscow, Russia). The samples were irradiated with a laser with a wavelength of 405 nm. The measurement time was 30 s. The shutter speed and gain parameters for measuring each sample were selected individually to obtain the optimal signal-to-noise ratio in the resulting video recordings of the Brownian motion of particles. To achieve the optimal concentration for conducting studies using the NTA method, before the study, the samples were diluted with distilled water.
2.4. Results Analysis
Statistical analysis of the obtained results was performed using MATLAB (MathWorks, Natick, MA, USA) software package.
3. Results and Discussion
The NTA method is more sensitive to changes in the particle concentration compared to the DLS method. However, at low particle concentrations, it may be difficult to obtain reliable results, and at high concentrations, the analysis of video files may become more complicated due to the large number of particles. The optimal concentration range for the NTA method is approximately from 107 to 1010 particles per mL. Additionally, when analyzing small particles (e.g., with a diameter of about 20 nm), difficulties arise due to the low sensitivity of the camera, which complicates the focusing and analysis of the video files.
The samples of the gold and polystyrene nanoparticles were measured. The research was conducted on three samples of the liquid dispersions of the gold nanoparticles and five samples of the liquid dispersions of the gold nanorods using the NTA method. The results were compared with the measurements obtained using the DLS method. At least five measurements were obtained for each sample. The measurement results for the spherical particles are presented in
Table 2. The sizes obtained using the DLS and NTA methods exceeded the sizes of the TEM by 6–38%, since the hydrodynamic radius of the particles was determined in them.
The mean size for all the samples measured using the DLS method was 10–30% larger than the one measured using the NTA method (
Figure 2). This is because the DLS method is based on the ensemble measurements (a large number of particles measured at the same time), and larger particles scatter light significantly more intensely than the smaller ones. As a result, the mean particle size in the sample measured using the DLS method is biased toward larger particles.
The NTA method can also detect the presence of large particles in a sample, but the limited number of particles analyzed in a single measurement makes it less sensitive to the presence of large particles in the samples than the DLS method.
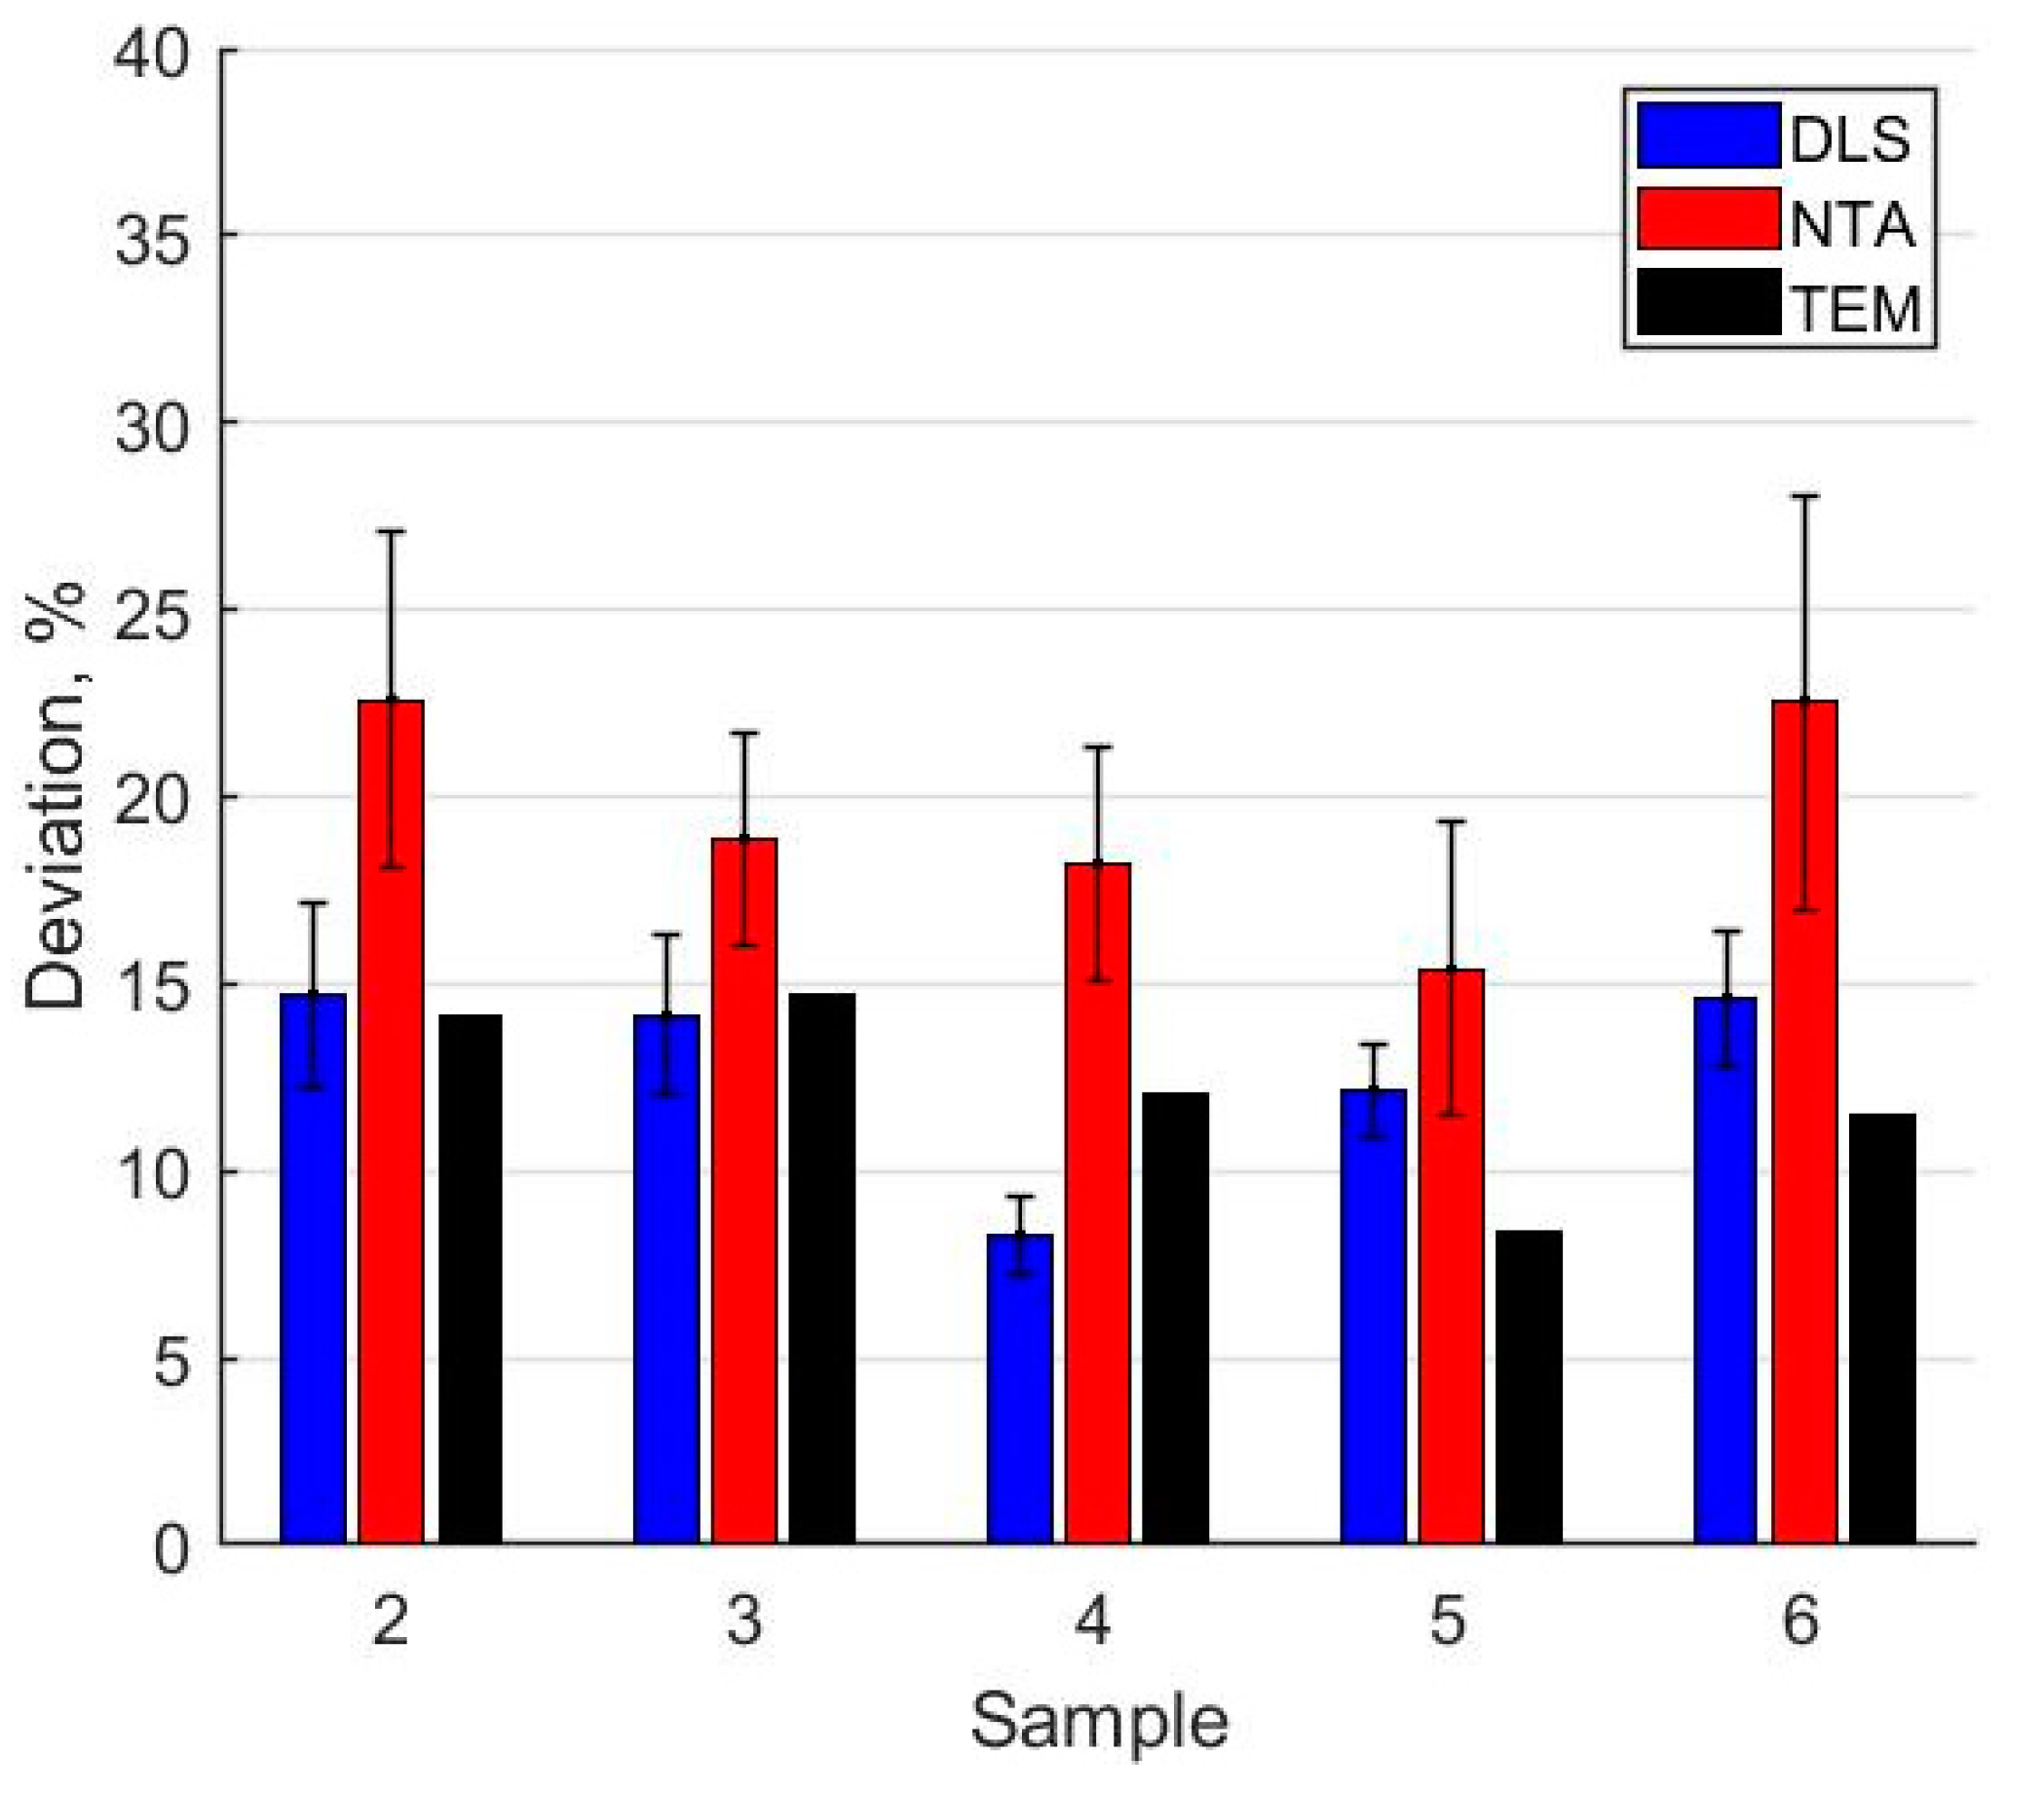
Another important characteristic of the liquid dispersions of nanoparticles is the degree of monodispersity of the samples. The estimation of the spread in particle sizes in the samples based on the results of the TEM image analysis shows that the studied samples can be considered monodisperse with relative deviations of 8–15% in length, and of 7–12% in diameter. However, it is also necessary to consider the fact that a very limited number of particles are taken into account when analyzing TEM images.
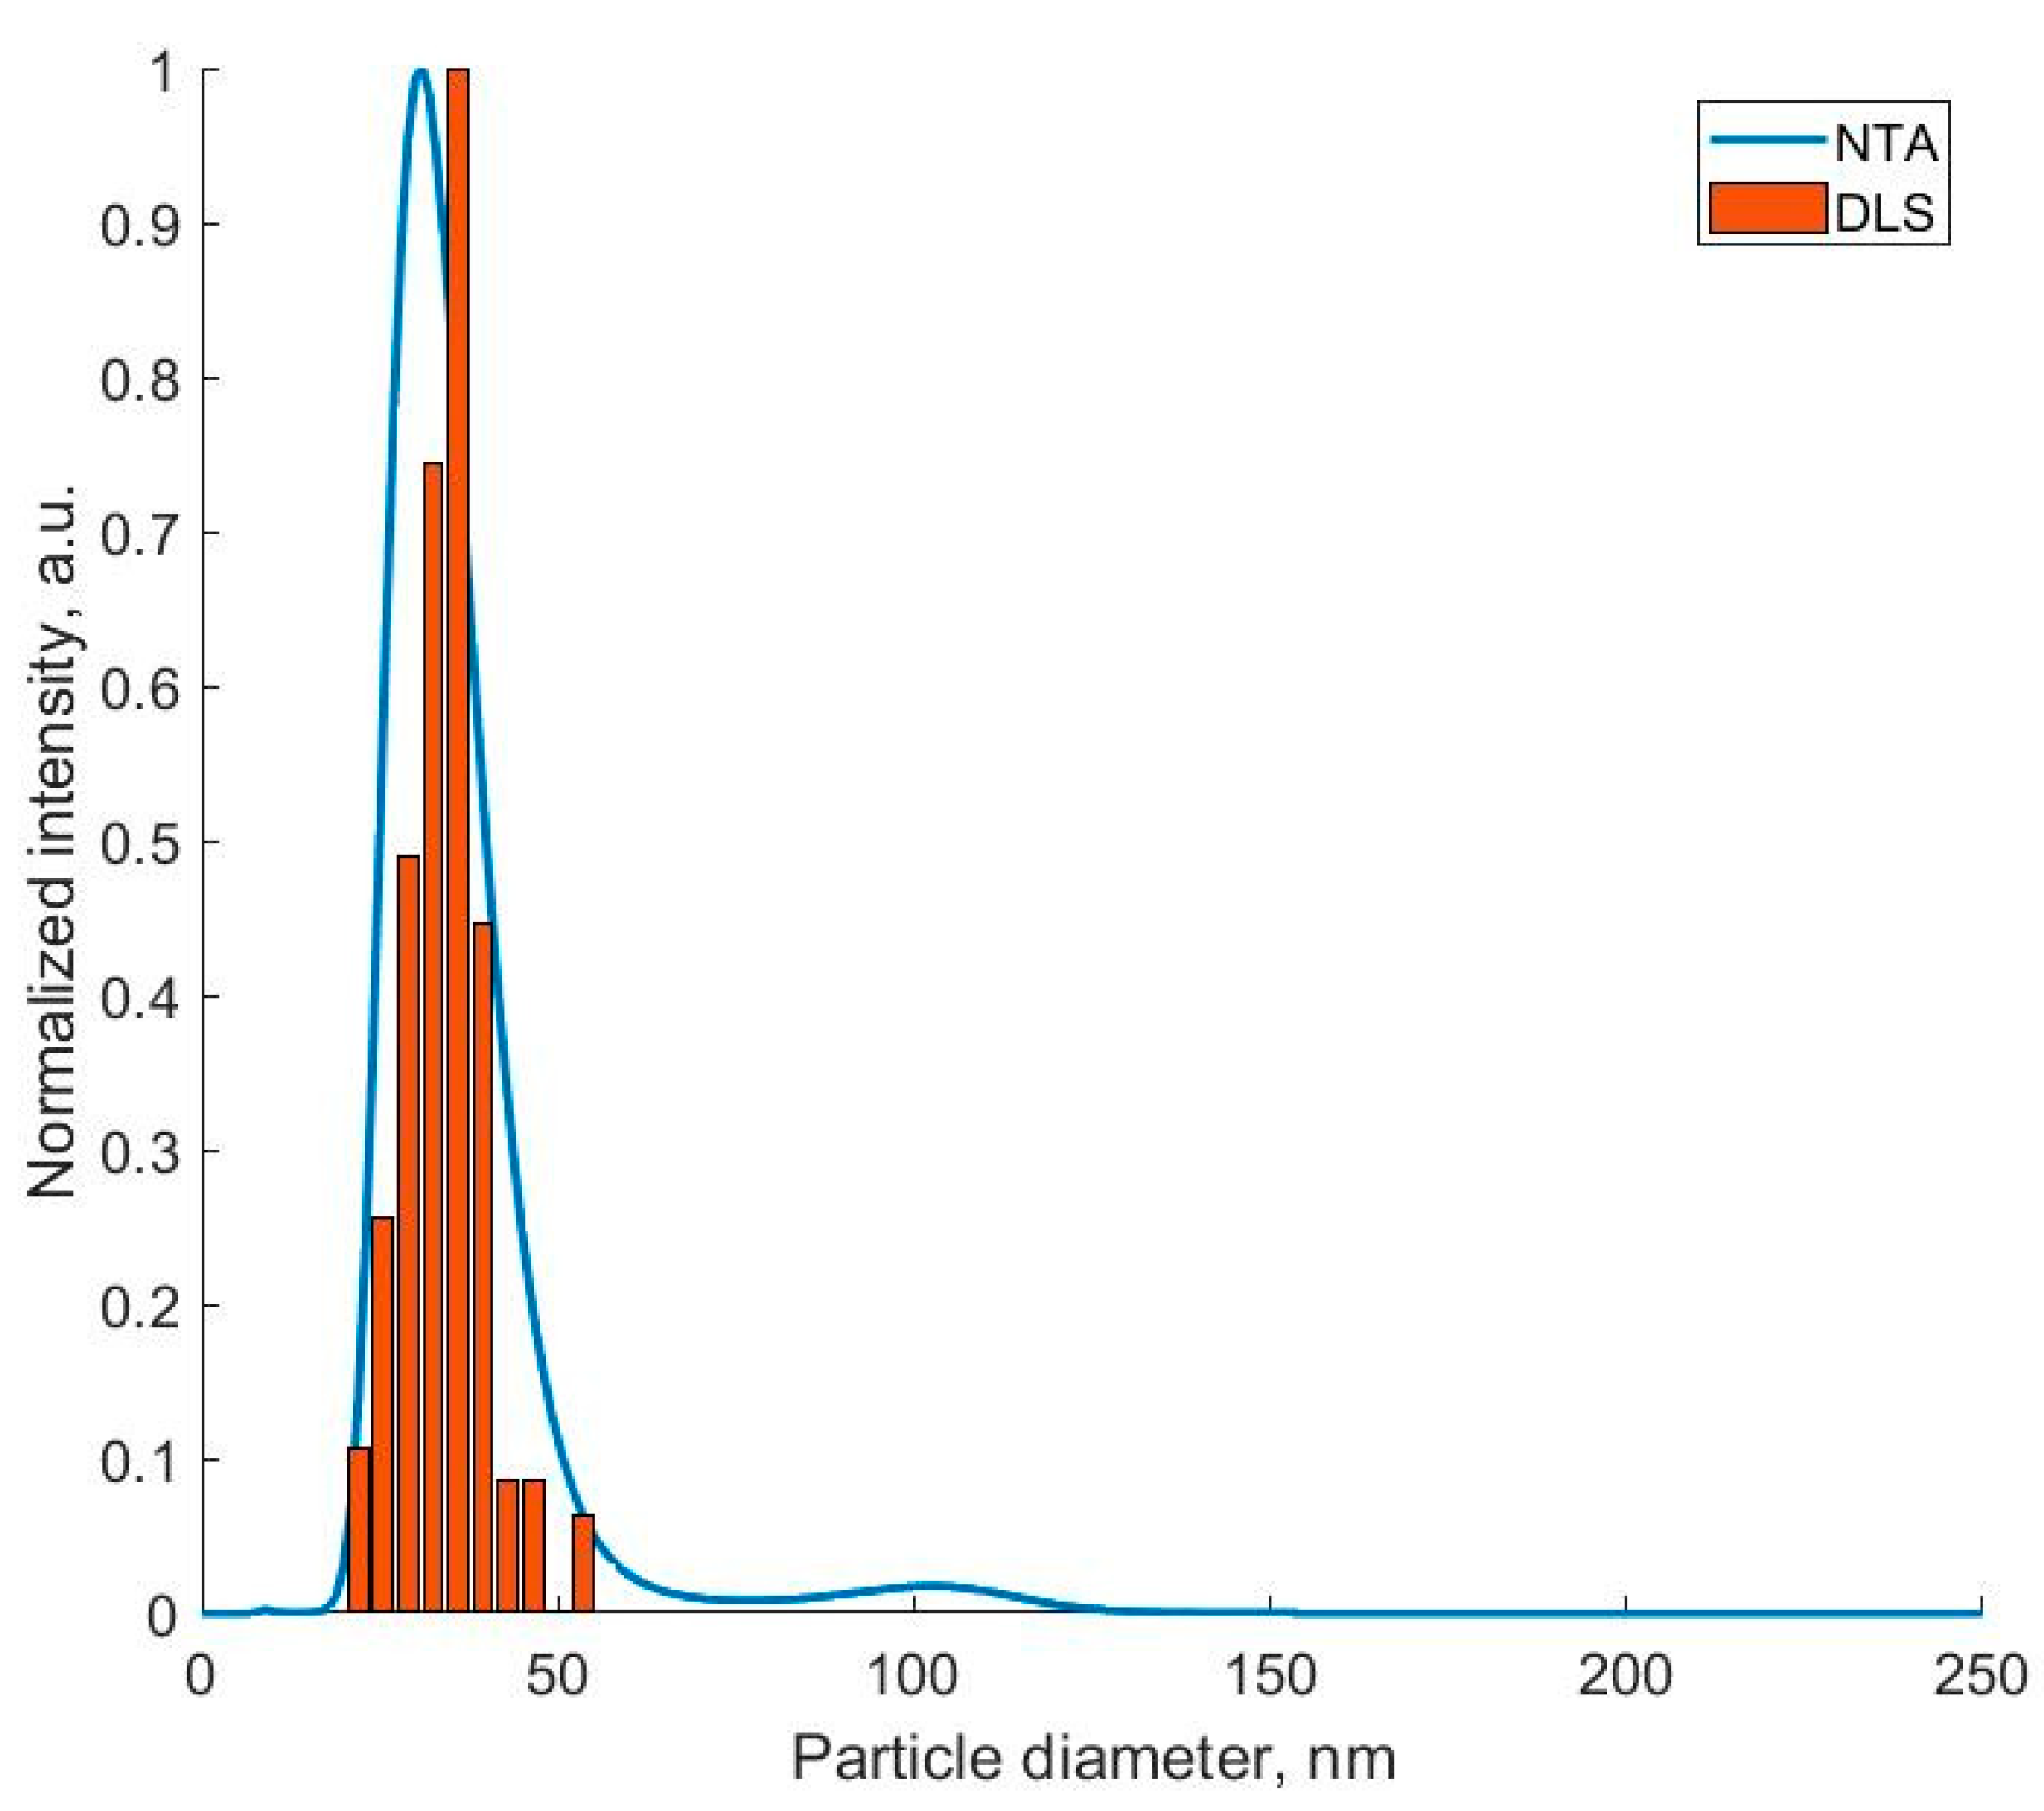
The DLS and NTA methods make it possible to obtain a more statistically reliable estimate of the particle size spread due to a larger number of analyzed particles. Despite the fact that the calculation of the hydrodynamic radius in both methods is carried out in the approximation for particles of a spherical shape, the values of the peak half-width in the particle size distribution makes it possible to estimate the degree of monodispersity of the samples (
Figure 3). It can be seen that the values obtained using different methods are in fairly good agreement with each other; however, the sizes obtained using the NTA method had a greater deviation due to the ability of each particle to analyze tracks.
The measured concentration of nanorods in the samples of the liquid dispersions was from 107 to 109 particles per mL. Due to the generalization of the data obtained from a study of a relatively small sample to the entire sample, the results of the individual measurements of one sample can vary significantly. It was found that in order to obtain statistically reliable results of the concentration measurements using the NTA method, a number of repeated measurements for one sample is required.
4. Conclusions
Methods based on the properties of the Brownian motion and light scattering allow for the analysis of the liquid dispersions of nanoparticles without the need for complicated sample preparation. Thanks to this, they are widely used for the rapid and efficient nanoparticle analysis in many scientific fields. Dynamic light scattering and nanoparticle tracking analysis methods allow for the determination of particle sizes, as well as the characteristics of liquid dispersions, such as the presence of large impurities and particle aggregates, sample polydispersity, and dynamics of internal processes.
The main drawback of both methods is that they are adapted for determining the sizes of exclusively spherical nanoparticles. In the case of non-spherical particles, the depolarized dynamic light scattering method can be applied, in which the rotational diffusion of the particles is additionally measured. At the same time, there is a number of factors that can significantly distort the measurement results.
Dynamic light scattering has a very limited resolving power, which is associated with solving an ill-posed inverse problem in data processing and complicates the processing of the measurement results of particles in polydisperse systems. However, this method is more sensitive to the presence of large impurities or particle aggregates in the sample.
In the nanoparticle tracking analysis method, an observation is made for each individual particle, which allows for more accurate information on the particle sizes to be obtained, including in polydisperse systems. In addition, it allows for the determination of the concentration of nanoparticles in liquid dispersion samples.
The mean size for all the samples measured using the DLS method was 10–30% larger than the one measured using the NTA method.
The obtained results can be used in the study of liquid dispersions of nanoparticles using dynamic light scattering and nanoparticle tracking analysis.
Author Contributions
Conceptualization, P.A.M. and P.V.S.; methodology, P.V.S.; software, I.N.G.; validation, P.A.M. and P.V.S.; investigation, P.A.M.; writing—original draft preparation, P.A.M. and I.N.G.; writing—review and editing, P.V.S.; visualization, I.N.G. All authors have read and agreed to the published version of the manuscript.
Funding
This research received no external funding.
Institutional Review Board Statement
Not applicable.
Informed Consent Statement
Not applicable.
Data Availability Statement
For any data supporting reported results please contact the corresponding author.
Acknowledgments
The authors would like to thank colleagues B. Khlebtsov at the Nanobiotechnology lab. IBPPM RAS for providing us with samples of gold nanoparticles, and N. Sankova, V. Semeykina, and E. Parkhomchuk at the Boreskov Institute of Catalysis SB RAS for providing us with samples of latex nanoparticles.
Conflicts of Interest
The authors declare no conflict of interest.
References
- Alex, S.; Tiwari, A. Functionalized Gold Nanoparticles: Synthesis, Properties and Applications—A Review. J. Nanosci. Nanotechnol. 2015, 15, 1869–1894. [Google Scholar] [CrossRef] [PubMed]
- Louis, C.; Pluchery, O. Gold Nanoparticles for Physics, Chemistry and Biology; Imperial College Press: London, UK, 2012; ISBN 9781848168060. [Google Scholar]
- Rai, P.K.; Kumar, V.; Lee, S.; Raza, N.; Kim, K.-H.; Ok, Y.S.; Tsang, D.C.W. Nanoparticle-Plant Interaction: Implications in Energy, Environment, and Agriculture. Environ. Int. 2018, 119, 1–19. [Google Scholar] [CrossRef] [PubMed]
- Dykman, L.; Khlebtsov, N. Gold Nanoparticles in Biomedical Applications: Recent Advances and Perspectives. Chem. Soc. Rev. 2012, 41, 2256–2282. [Google Scholar] [CrossRef] [PubMed]
- Hough, R.M.; Noble, R.R.P.; Reich, M. Natural Gold Nanoparticles. Ore Geol. Rev. 2011, 42, 55–61. [Google Scholar] [CrossRef]
- Stylianopoulos, T.; Jain, R.K. Design Considerations for Nanotherapeutics in Oncology. Nanomed. Nanotechnol. Biol. Med. 2015, 11, 1893–1907. [Google Scholar] [CrossRef] [PubMed]
- Shmarakov, I.; Mukha, I.; Vityuk, N.; Borschovetska, V.; Zhyshchynska, N.; Grodzyuk, G.; Eremenko, A. Antitumor Activity of Alloy and Core-Shell-Type Bimetallic AgAu Nanoparticles. Nanoscale Res. Lett. 2017, 12, 333. [Google Scholar] [CrossRef] [PubMed]
- Schmidt, C.; Storsberg, J. Nanomaterials—Tools, Technology and Methodology of Nanotechnology Based Biomedical Systems for Diagnostics and Therapy. Biomedicines 2015, 3, 203–223. [Google Scholar] [CrossRef] [PubMed]
- Reddy, N.K.; Pérez-Juste, J.; Pastoriza-Santos, I.; Lang, P.R.; Dhont, J.K.G.; Liz-Marzán, L.M.; Vermant, J. Flow Dichroism as a Reliable Method to Measure the Hydrodynamic Aspect Ratio of Gold Nanoparticles. ACS Nano 2011, 5, 4935–4944. [Google Scholar] [CrossRef] [PubMed]
- Ahmad, T.; Irfan, M.; Bhattacharjee, S. Parametric Study on Gold Nanoparticle Synthesis Using Aqueous Elaise Guineensis (Oil Palm) Leaf Extract: Effect of Precursor Concentration. Procedia Eng. 2016, 148, 1396–1401. [Google Scholar] [CrossRef]
- Dragovic, R.A.; Gardiner, C.; Brooks, A.S.; Tannetta, D.S.; Ferguson, D.J.P.; Hole, P.; Carr, B.; Redman, C.W.G.; Harris, A.L.; Dobson, P.J.; et al. Sizing and Phenotyping of Cellular Vesicles Using Nanoparticle Tracking Analysis. Nanomed. Nanotechnol. Biol. Med. 2011, 7, 780–788. [Google Scholar] [CrossRef] [PubMed]
- Zheng, T.; Bott, S.; Huo, Q. Techniques for Accurate Sizing of Gold Nanoparticles Using Dynamic Light Scattering with Particular Application to Chemical and Biological Sensing Based on Aggregate Formation. ACS Appl. Mater. Interfaces 2016, 8, 21585–21594. [Google Scholar] [CrossRef] [PubMed]
- Rath, M.E.; Choi, S.; Sayoc, J.; Shin, J.; Hong, S.; Park, J. Validation of Nanoparticle Tracking Analysis in Characterizing Extracellular Vesicle Isolated from Polydisperse Biological Samples. FASEB J. 2019, 33, lb599. [Google Scholar] [CrossRef]
- Kim, A.; Ng, W.B.; Bernt, W.; Cho, N.-J. Validation of Size Estimation of Nanoparticle Tracking Analysis on Polydisperse Macromolecule Assembly. Sci. Rep. 2019, 9, 2639. [Google Scholar] [CrossRef] [PubMed]
| Disclaimer/Publisher’s Note: The statements, opinions and data contained in all publications are solely those of the individual author(s) and contributor(s) and not of MDPI and/or the editor(s). MDPI and/or the editor(s) disclaim responsibility for any injury to people or property resulting from any ideas, methods, instructions or products referred to in the content. |
© 2023 by the authors. Licensee MDPI, Basel, Switzerland. This article is an open access article distributed under the terms and conditions of the Creative Commons Attribution (CC BY) license (https://creativecommons.org/licenses/by/4.0/).


