Proceeding Paper

Fluorescence Enhancement Dependence on Refractive Index Variation in a Nanostructured Plasmonic Surface †

by
Francesco Floris
1,*,
Margherita Angelini
1,
Eliana Manobianco
2,
Paola Pellacani
2 and
Franco Marabelli
1
1
Department of Physics, University of Pavia, Via Bassi 6, 27100 Pavia, Italy
2
Plasmore S.r.l, Via Vittorio Emanuele II 4, 27100 Pavia, Italy
*
Author to whom correspondence should be addressed.
Presented at the 4th International Online Conference on Nanomaterials, 5–19 May 2023; Available online: https://iocn2023.sciforum.net.
Mater. Proc. 2023, 14(1), 41; https://doi.org/10.3390/IOCN2023-14529
Published: 5 May 2023
(This article belongs to the Proceedings of The 4th International Online Conference on Nanomaterials)

Abstract

:
Nanostructured plasmonic surfaces have been the subject of many biosensing applications exploiting surface-enhanced fluorescence in the last few years. For this reason, we investigated the refractive index dependence of the coupling mechanism between the plasmonic modes and the fluorescence processes. The results show that the fluorescence emission spectral shape is controlled by the plasmonic field distribution, together with the enhancement of its signal. By altering the refractive index at the plasmonic active surface, the resonance conditions of the plasmonic modes change, resulting in a reshaping of fluorescence emission and a different spectral distribution of the largest enhancement regions.

1. Introduction

In the past years, a wide variety of ways to enhance the fluorescence signal have been explored, giving rise to the field of surface-enhanced fluorescence (SEF) [1]. Among the usual SEF-based systems, thanks to the technological improvement in nanofabrication, nanostructured plasmonic surfaces are one of the most useful tools to simultaneously couple the plasmonic modes and manipulate the emission geometry [2,3,4,5,6,7,8]. In our recent work [9], we studied the coupling mechanism between fluorescence absorption and emission processes of the commercial ATTO700 dye [10] and the plasmonic modes of a custom nanostructured surface. The results, supported by a complete optical characterization and finite-difference time-domain (FDTD) simulation analysis, showed that fluorescence emission is subject to a change in shape that depends on the plasmonic field distribution, with an enhancement region corresponding to the location of the main plasmonic modes. In real biosensing applications, the plasmonic resonance conditions are altered in dependence on a change in refractive index, usually caused by the flow of a buffer solution on the functionalized surface. In our latest work [11], to mimic a real biosensing measurement, we investigated the effect of the refractive index on fluorescence enhancement by flowing a 2% EtOH solution on the active plasmonic surface of the sample. The results, in accordance with the findings in [9], showed that the fluorescence emission and enhancement are reshaped consistently by the refractive index changes (from nAIR = 1.000 to nEtOH = 1.334) induced on the plasmonic field distributions.

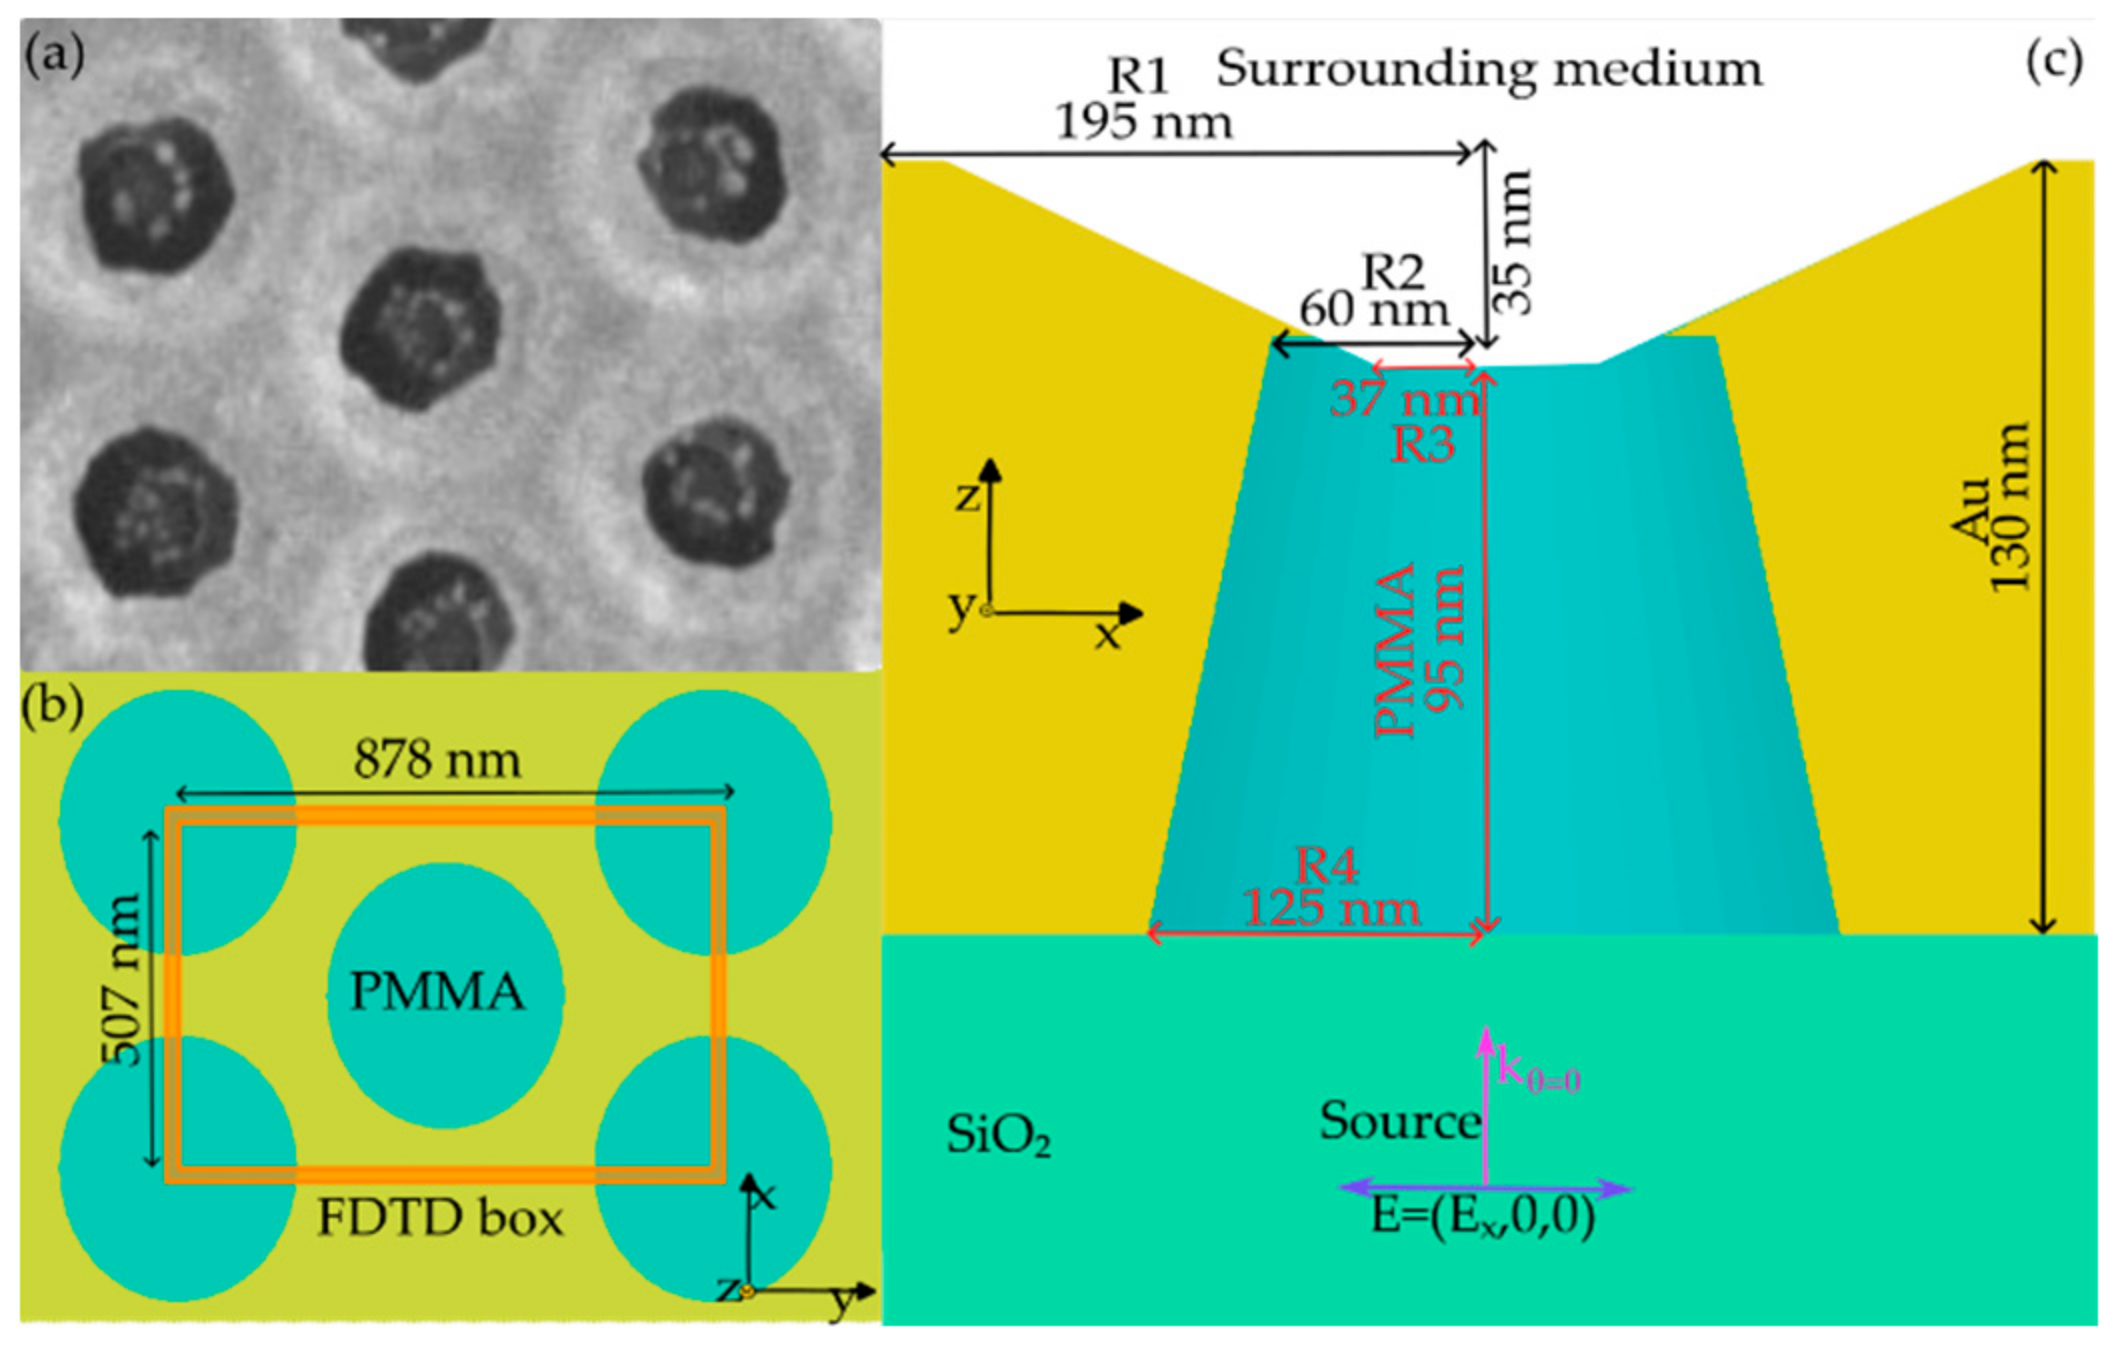
2. Materials and Methods

The plasmonic surface under study was fabricated by a standardized process based on colloidal nanolithography [12]. The resulting nanostructure is made of hexagonally stacked poly (methyl methacrylate) (PMMA) nanopillars embedded in a thick gold film onto a commercial SiO2 slide as substrate (see Figure 1a). Two main interfaces can be distinguished in the structure: a front side (FS), defined by the PMMA/Au/Surrounding medium interface, and a back side (BS), namely the Au/SiO2 interface. A 10 µmol solution of the commercial ATTO700 dye was drop-cast on the FS of the nanostructured surface and on a bare SiO2 slide [9]. The plasmonic response of the nanostructure was characterized by measuring broadband (600:1000 nm) variable-angle (from 0 to 60 degrees) transmittance (T) with a commercial Fourier transform spectrometer equipped with a micro reflectometer. The source spot impinged on the plasmonic sample from the BS to properly focus it. The sample was then enclosed in a microfluidic cell to perform the measurements with the 2% EtOH solution. Fluorescence was excited by pumping at 632 nm and collected with an HORIBA LabRAM Dilor HR Evolution spectrometer (HORIBA France SAS, Longjumeau, France) equipped with an Olympus HS BX40 microscope (Olympus Corporation, Tokyo, Japan). A microscope objective with NA = 0.25 was used to properly focus the pumping spot at the FS and BS and consequently collect the resulting fluorescence signal with an epifluorescence geometry. The NA value corresponds to a maximum solid angle of excitation/collection of 15° with little effect on the pump angle due to the small mode field diameter of the laser beam, but it becomes important in the signal collection. Since the interaction of light with the plasmonic modes has a strong angular dependence [1], the fluorescence emission of the dye interacting with the plasmonic modes is also affected by a similar dependence. Furthermore, the selection of a low NA enables us to focus on the contribution of the lower angle features, mainly related to the plasmonic band gap opening, together with the effect of the main resonances. The spectrum was then acquired with an HORIBA Jobin Yvon’s Symphony Peltier-cooled CCD camera (HORIBA France SAS). In parallel, SEM images combined with nanofabrication information were used to build a reliable FDTD model of the structure in terms of periodicity and nanopillar resonator shape. The hidden structural parameters (Figure 1c) were retrieved with a custom sweep script in Lumerical Ansys [13] by tuning the spectral features of the experimental T with the simulated one, simultaneously considering the shift induced by the change from air to the 2% EtOH solution [9,10]. The electric field (EF) expansions were computed at the main spectral features by placing several 2D frequency-domain and power monitors within the nanopillars. To understand the coupling mechanism between the plasmonic modes and fluorescence processes, the EF lying on an x-z cross-section of the nanopillars was considered for consistency with the linear polarization state of the source set along the x direction (Figure 1c). In addition, the EF magnitude spectral profile at the dye location was also evaluated with an x-y 2D monitor, as explained in [9], to provide consistent validation of the structural model and give a sufficiently accurate description of the real system for the purpose of the present study.

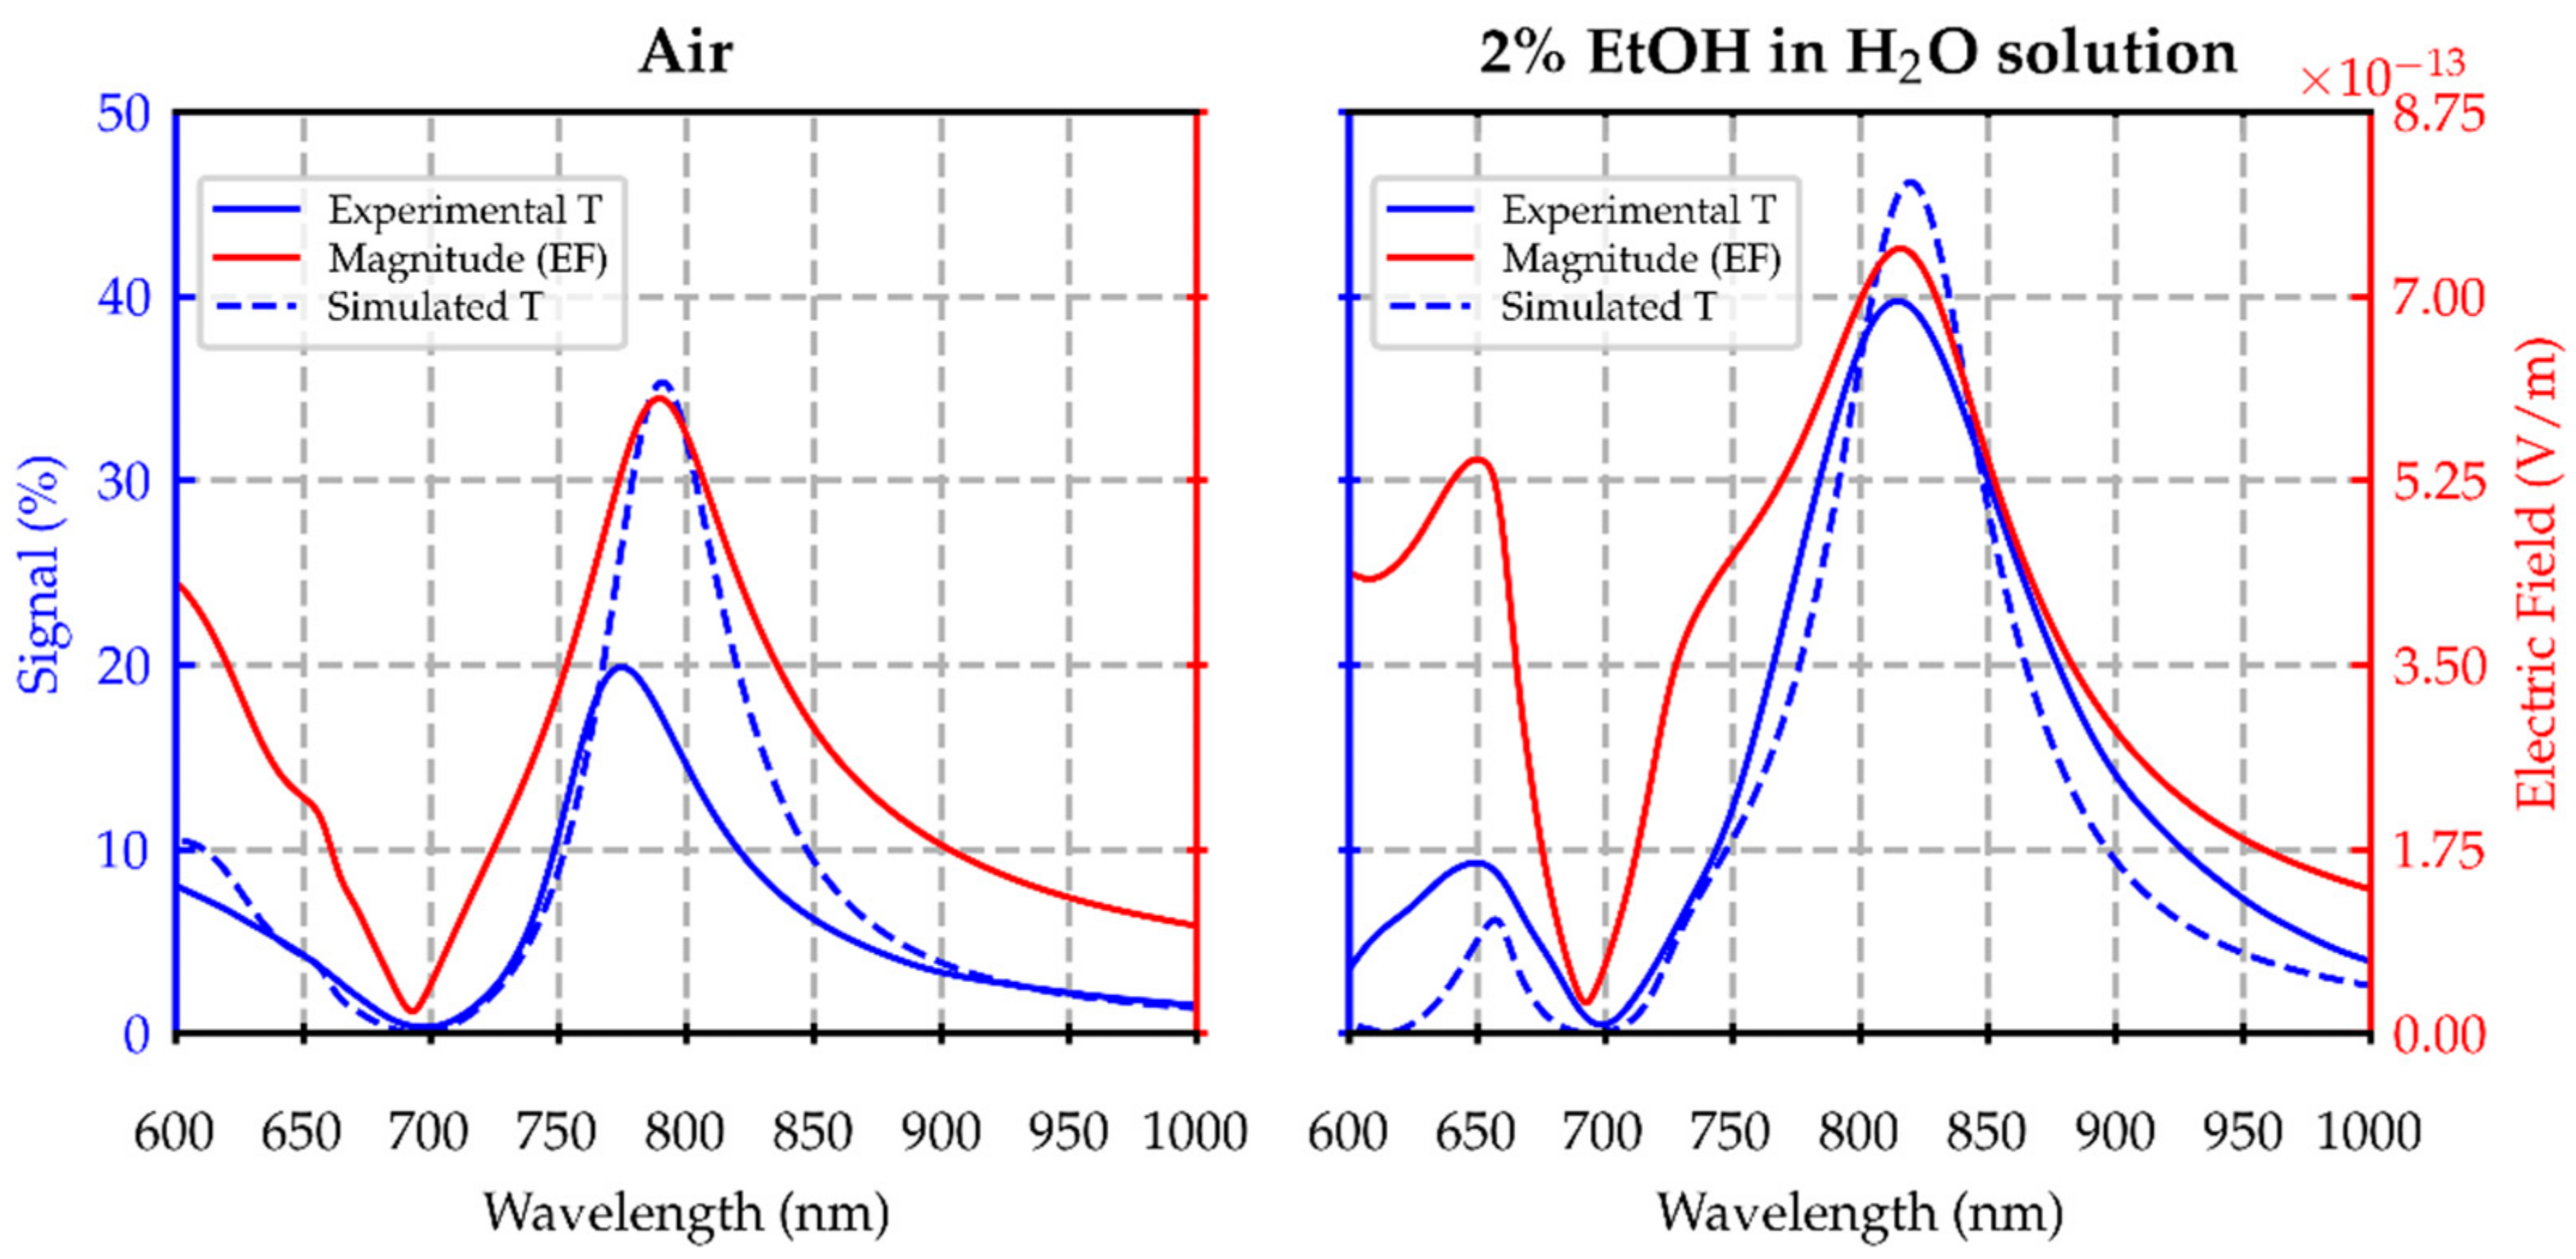
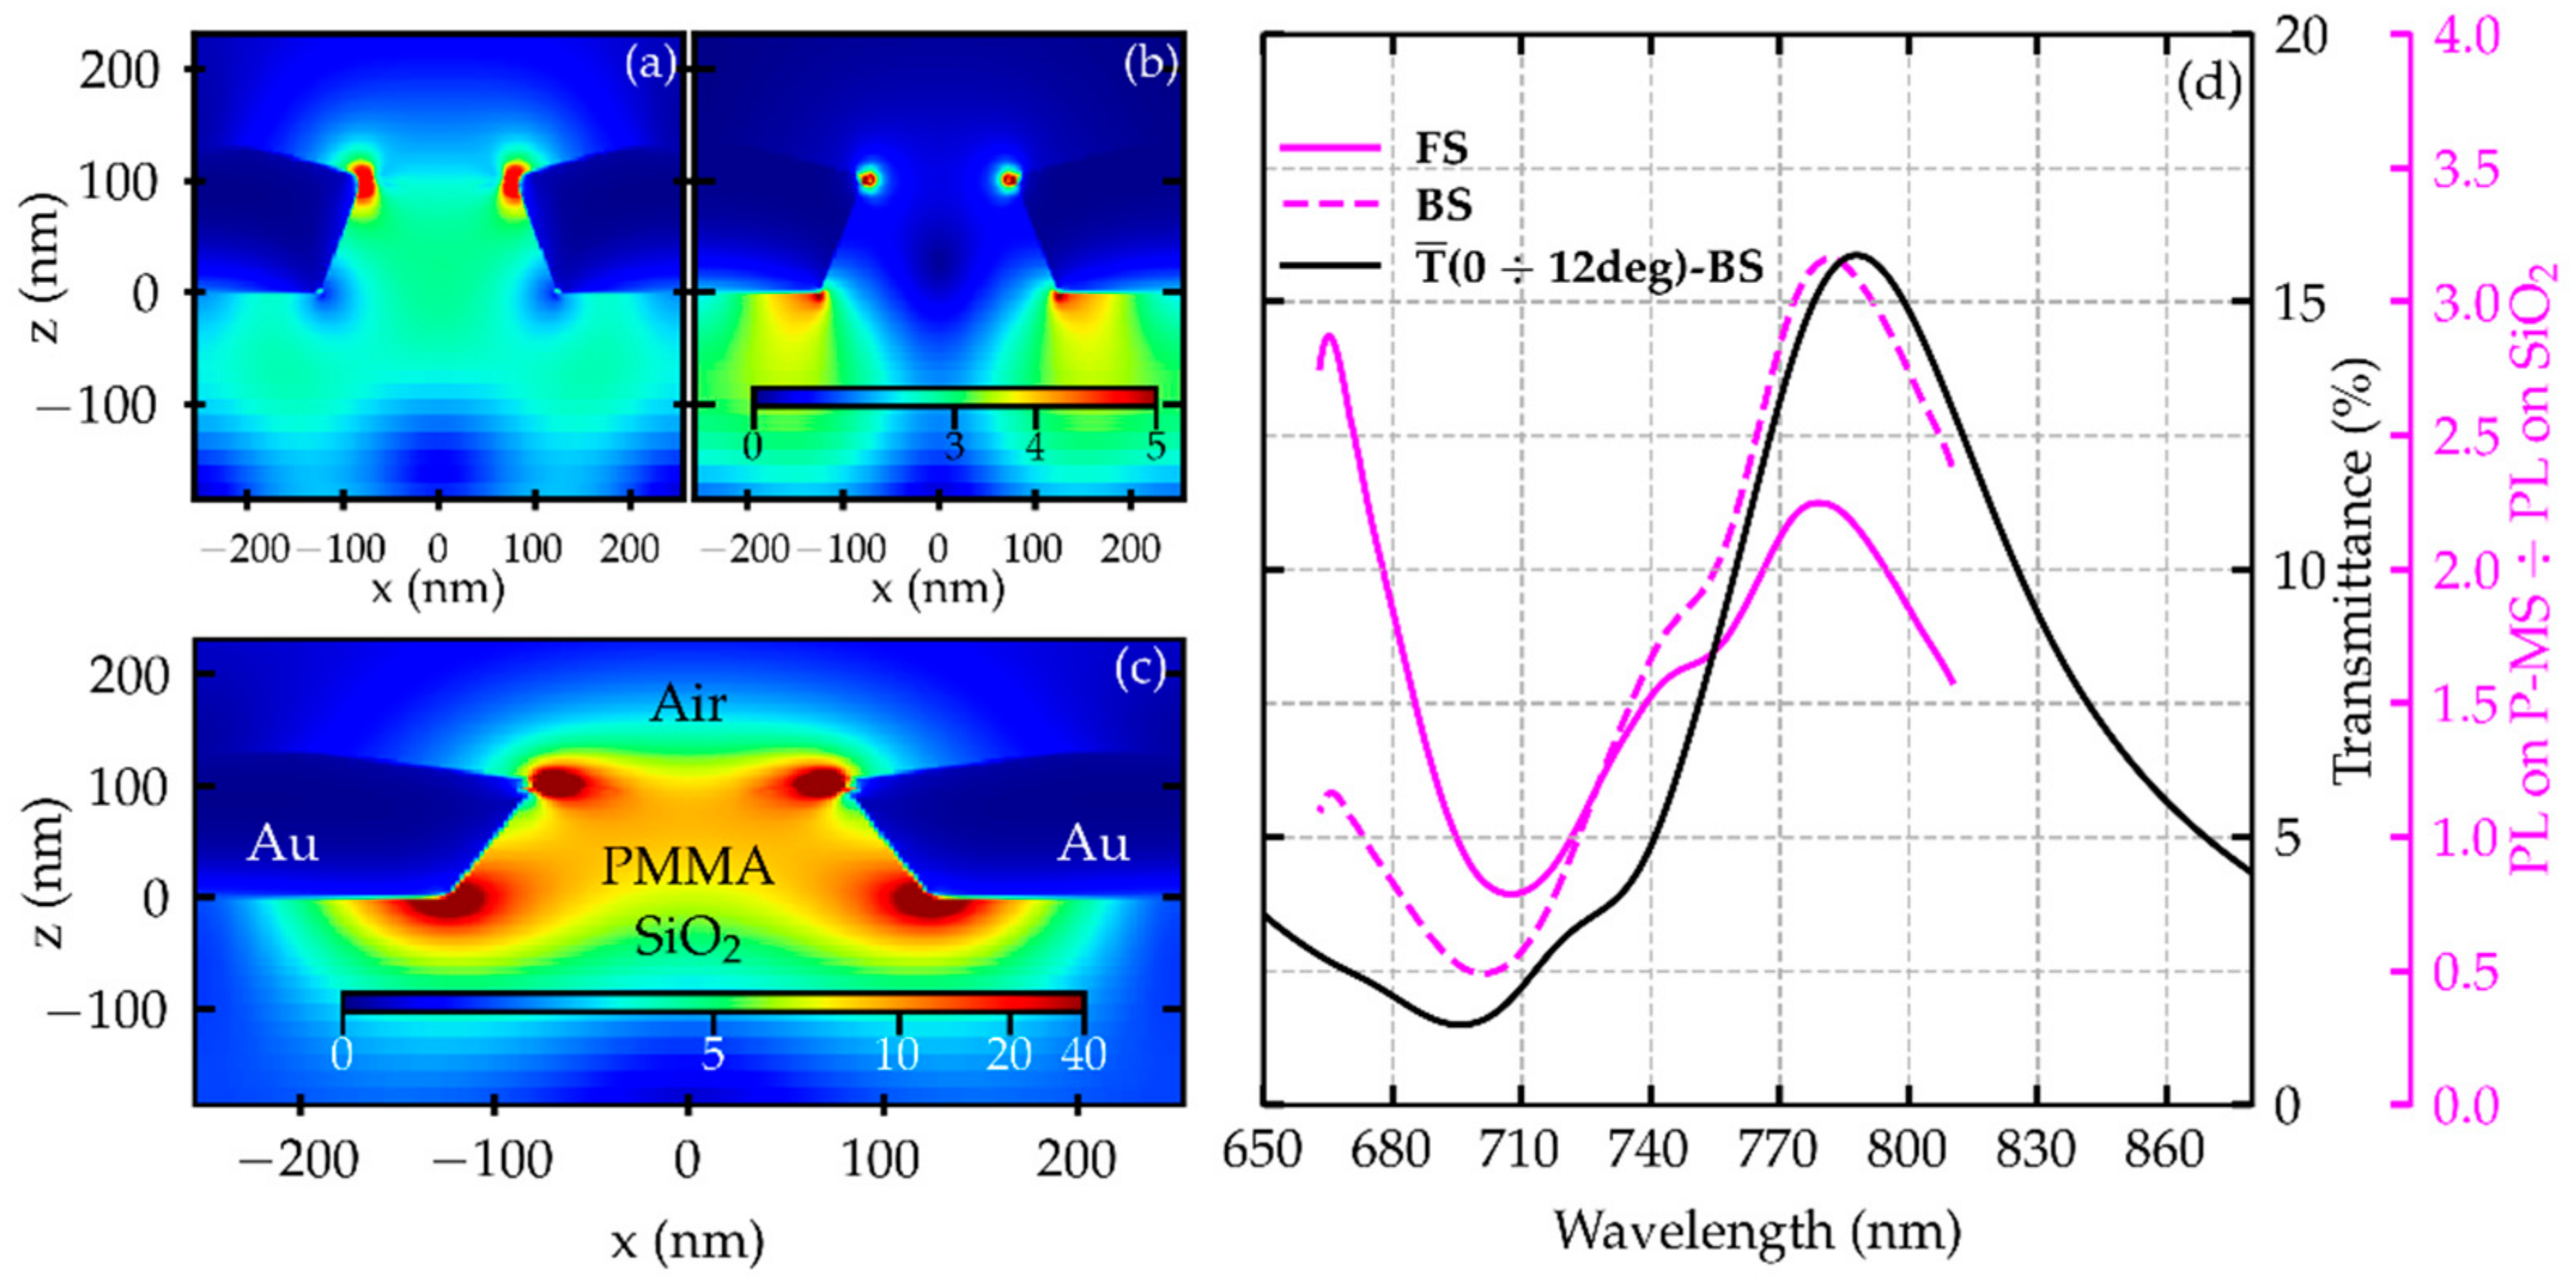
3. Results and Discussion

In Figure 2, the simulated and experimental T along with the calculated EF spectral profile are compared at the dye location, corresponding to z = 130 nm. On the left panel, the curves referring to air as the surrounding medium are reported, while on the right one, the 2% EtOH solution case is reported. In both cases, good agreement between the simulated and experimental T spectra was obtained. The EF magnitude spectral profile follows the shape and features of the T spectra, suggesting the reliability of the FDTD model. Entering the details of the spectral features, two main wavelengths can be identified for both the surrounding media: the dip around 700 nm, corresponding to the plasmonic band gap (PBG) opening for the Au/SiO2 plasmon polaritons, and the peak corresponding to the main plasmonic resonance, which is redshifted from 787 to 820 nm when passing from air to the 2% EtOH solution. The fluorescence signals were measured for both the nanostructured surface and the bare SiO2 slide, each one normalized to its own peak. To better highlight the coupling mechanism contribution of the plasmonic modes, we evaluated the ratio of the normalized fluorescence spectra measured on the plasmonic surface with respect to the SiO2.
The ratios alongside the T spectra are reported in Figure 3d and Figure 4d for the 2% EtOH solution and for air, respectively. The T curves allow a more precise identification of the spectral features with the plasmonic modes. The curves were averaged over the angles of incidence from 0 to 12 degrees to lie within the NA value of the microscope objective. This enables a direct comparison with the fluorescence ratios, aiming at the identification of the reciprocal spectral features. Moreover, this direct comparison is supported by the conformal behavior of the experimental T with the simulated T and EF magnitude (Figure 2), suggesting that it provides a reasonable assessment of the EF spectral distribution at the dye location. Guided by these observations, we computed the EF expansions in the x-z plane at the wavelength points identifying the main spectral features, namely the plasmonic resonances (787 nm for air and 820 nm for the 2% EtOH solution) and Au/SiO2 polaritons PBG (700 nm), together with the pumping wavelength, reported in Figure 3 and Figure 4 for the 2% EtOH solution and for air, respectively. In the 2% EtOH solution, the fluorescence ratios follow the shape of the T spectra, displaying maxima in correspondence with the main plasmonic modes (650 nm and 820 nm) and minima near the PBG for Au/SiO2 polaritons (700–720 nm). The maxima are redshifted with respect to air, while the minima hold their position, consistent with both the T and EF behaviors in Figure 2. Regarding the measurement configuration, in the 2% EtOH solution, the BS ratio displays larger values above the PBG for Au/SiO2 polaritons, as in the air, while the FS ratio is monotonically decreasing above it. These effects can be understood by looking at the EF distributions. Starting from the main plasmonic resonance (panels (c) of Figure 3 and Figure 4), the double-paired circular hot-spot shape is maintained, slightly distributed more towards the FS in the 2% EtOH solution. Consistent with the findings in [9], the results suggest that above the Au/SiO2 PBG, fluorescence excited at the FS is enhanced and preferentially emitted towards the BS by the lower hot spot for both media. The minimum observed in the region of the PBG opening for Au/SiO2 polaritons could be assigned to the mirror-like behavior of the nanostructure that prevents an efficient excitation and re-emission of fluorescence, noticeable both in the EF distributions and in their lower magnitude values (panels (b) of Figure 3 and Figure 4). The different behavior of the FS ratio in the 2% EtOH solution could be explained by considering the interplay of fluorescence excitation and emission with the H2O/Au polaritons, whose PBG falls within 620–640 nm. Their effect becomes visible in the EF spectral enhancement at lower wavelengths (580 to 680 nm) in Figure 2. In fact, the EF expansion at the pumping wavelength (632 nm) that falls in this region reveals that the fields are more localized and extended at the FS for the 2% EtOH solution (panel (a), Figure 3) with respect to air (panel (a), Figure 4) [10]. The pump thus enables the excitation of the Au/H2O polaritons at the FS, which contribute to the enhancement of fluorescence emission below the BS polaritons PBG. In this way, the prevailing effect of the Au/H2O polaritons contributes to the emission enhancement below 700–720 nm and favors its directionality towards the FS.

4. Conclusions

The study shows that the refractive index of the surrounding medium strongly influences the enhancement observed in fluorescence emission, also in dependence on the measurement scheme. In fact, when switching from air to the 2% EtOH solution, different plasmonic modes are excited. Interestingly, their efficiency in coupling fluorescence either in the excitation or emission process depends on the measurement configuration (FS or BS). Within the framework of a biosensing device, this analysis offers several suggestions concerning the combination between excitation wavelength and dye, together with the most convenient measurement scheme, and also in relation to the plasmonic response of the nanostructure, which can be tuned by the tailoring of its geometrical parameters.

Author Contributions

Conceptualization, F.M. and F.F.; methodology, F.F.; software, F.F. and M.A.; validation, F.F., F.M. and M.A.; formal analysis, M.A.; investigation, M.A.; resources, E.M. and P.P.; data curation, M.A.; writing—original draft preparation, M.A. and F.F.; writing—review and editing, F.M., F.F. and M.A.; visualization, F.M., F.F. and M.A.; supervision, F.M. and F.F.; project administration, F.M.; funding acquisition, F.M. All authors have read and agreed to the published version of the manuscript.

Funding

This research was co-funded by the European Union’s Horizon 2020 project h-ALO (“Photonic System for Adaptive Multiple-analyte Monitoring of Food Quality”), grant agreement No 101016706.

Institutional Review Board Statement

Not applicable.

Informed Consent Statement

Not applicable.

Data Availability Statement

Not applicable.

Conflicts of Interest

The authors declare no conflict of interest.

References

  1. Fort, E.; Grésillon, S. Surface enhanced fluorescence. J. Phys. D Appl. Phys. 2008, 41, 13001–13031. [Google Scholar] [CrossRef]
  2. Brolo, A.G.; Kwok, S.C.; Moffitt, M.G.; Gordon, R.; Riordon, J.; Kavanagh, K.L. Enhanced fluorescence from arrays of nanoholes in a gold film. J. Am. Chem. Soc. 2005, 127, 14936–14941. [Google Scholar] [CrossRef] [PubMed]
  3. Guo, P.F.; Wu, S.; Ren, Q.J.; Lu, J.; Chen, Z.; Xiao, S.J.; Zhu, Y.Y. Fluorescence enhancement by surface plasmon polaritons on metallic nanohole arrays. J. Phys. Chem. Lett. 2010, 1, 315–318. [Google Scholar] [CrossRef]
  4. Zhang, Q.; Wu, L.; Wong, T.I.; Zhang, J.; Liu, X.; Zhou, X.; Wang, Y. Surface plasmon-enhanced fluorescence on Au nanohole array for prostate-specific antigen detection. Int. J. Nanomed. 2017, 12, 2307–2314. [Google Scholar] [CrossRef] [PubMed]
  5. Min, J.; Son, T.; Hong, J.-S.; Cheah, P.S.; Wegemann, A.; Murlidharan, K.; Weissleder, R.; Lee, H.; Im, H. Plasmon-Enhanced Biosensing for Multiplexed Profiling of Extracellular Vesicles. Adv. Biosys. 2020, 4, 2000003. [Google Scholar] [CrossRef] [PubMed]
  6. Sun, L.L.; Leo, Y.S.; Zhou, X.; Ng, W.; Wong, T.I.; Deng, J. Localized surface plasmon resonance based point-of-care system for sepsis diagnosis. Mater. Sci. Energy Technol. 2020, 3, 274–281. [Google Scholar] [CrossRef]
  7. Poirier-Richard, H.P.; Couture, M.; Brule, T.; Masson, J.F. Metal-enhanced fluorescence and FRET on nanohole arrays excited at angled incidence. Analyst 2015, 140, 4792–4798. [Google Scholar] [CrossRef] [PubMed]
  8. Park, J.E.; Jiyeon, K.; Nam, J.M. Emerging plasmonic nanostructures for controlling and enhancing photoluminescence. Chem. Sci. 2017, 8, 4696–4704. [Google Scholar] [CrossRef] [PubMed]
  9. Angelini, M.; Manobianco, E.; Pellacani, P.; Floris, F.; Marabelli, F. Plasmonic Modes and Fluorescence Enhancement Coupling Mechanism: A Case with a Nanostructured Grating. Nanomaterials 2022, 12, 4339. [Google Scholar] [CrossRef] [PubMed]
  10. Angelini, M.; Manobianco, E.; Pellacani, P.; Floris, F.; Marabelli, F. Refractive Index Dependence of Fluorescence Enhancement in a Nanostructured Plasmonic Grating. Materials 2023, 16, 1289. [Google Scholar] [CrossRef] [PubMed]
  11. Giudicatti, S.; Valsesia, A.; Marabelli, F.; Colpo, P.; Rossi, F. Plasmonic resonances in nanostructured gold/polymer surfaces by colloidal lithography. Phys. Status Solidi A 2010, 207, 935–942. [Google Scholar] [CrossRef]
  12. ATTO-TEC GmbH. Available online: https://www.atto-tec.com/ (accessed on 10 December 2022).
  13. Lumerical Inc. Available online: https://www.lumerical.com/products/fdtd/ (accessed on 20 December 2022).
Figure 1. (a) Scanning electron microscope image of the nanostructured plasmonic surface. Top (b) and side (c) views of the FDTD-optimized structural model. The geometrical parameters are displayed together with their dimensions, the red ones being the hidden parameters retrieved with the procedure described in [1,2].
Materproc 14 00041 g001
Figure 2. Comparison between experimental and simulated transmittance spectra at normal incidence, computed in the x-y horizontal plane placed at z = 530 nm, and the electric field magnitude spectral profile evaluated in the x-y horizontal plane placed at the dye location, corresponding to z = 130 nm. Both z coordinates refer to the Au/SiO2 interface placed at z = 0 nm.
Materproc 14 00041 g002
Figure 3. Electric field expansion computed with the 2% EtOH solution in H2O as the surrounding medium in the x-z plane at 632 nm in panel (a), at 700 nm in panel (b), and at 820 nm in panel (c). Panel (d) displays the ratios of the normalized fluorescence spectra of ATTO700 dye measured on the plasmonic surface with respect to SiO2.
Materproc 14 00041 g003
Figure 4. Electric field expansion computed with air as the surrounding medium in the x-z plane at 632 nm in panel (a), at 700 nm in panel (b), and at 787 nm in panel (c). Panel (d) displays the ratios of the normalized fluorescence spectra of ATTO700 dye measured on the plasmonic surface with respect to the SiO2 reference.
Materproc 14 00041 g004
Disclaimer/Publisher’s Note: The statements, opinions and data contained in all publications are solely those of the individual author(s) and contributor(s) and not of MDPI and/or the editor(s). MDPI and/or the editor(s) disclaim responsibility for any injury to people or property resulting from any ideas, methods, instructions or products referred to in the content.

