
Low-Cost Hydrothermally Synthesized Multifunctional Rare Earth Metal Yttrium Cerium Oxide †


Abstract
:1. Introduction
2. Materials and Methods
3. Result and Discussion
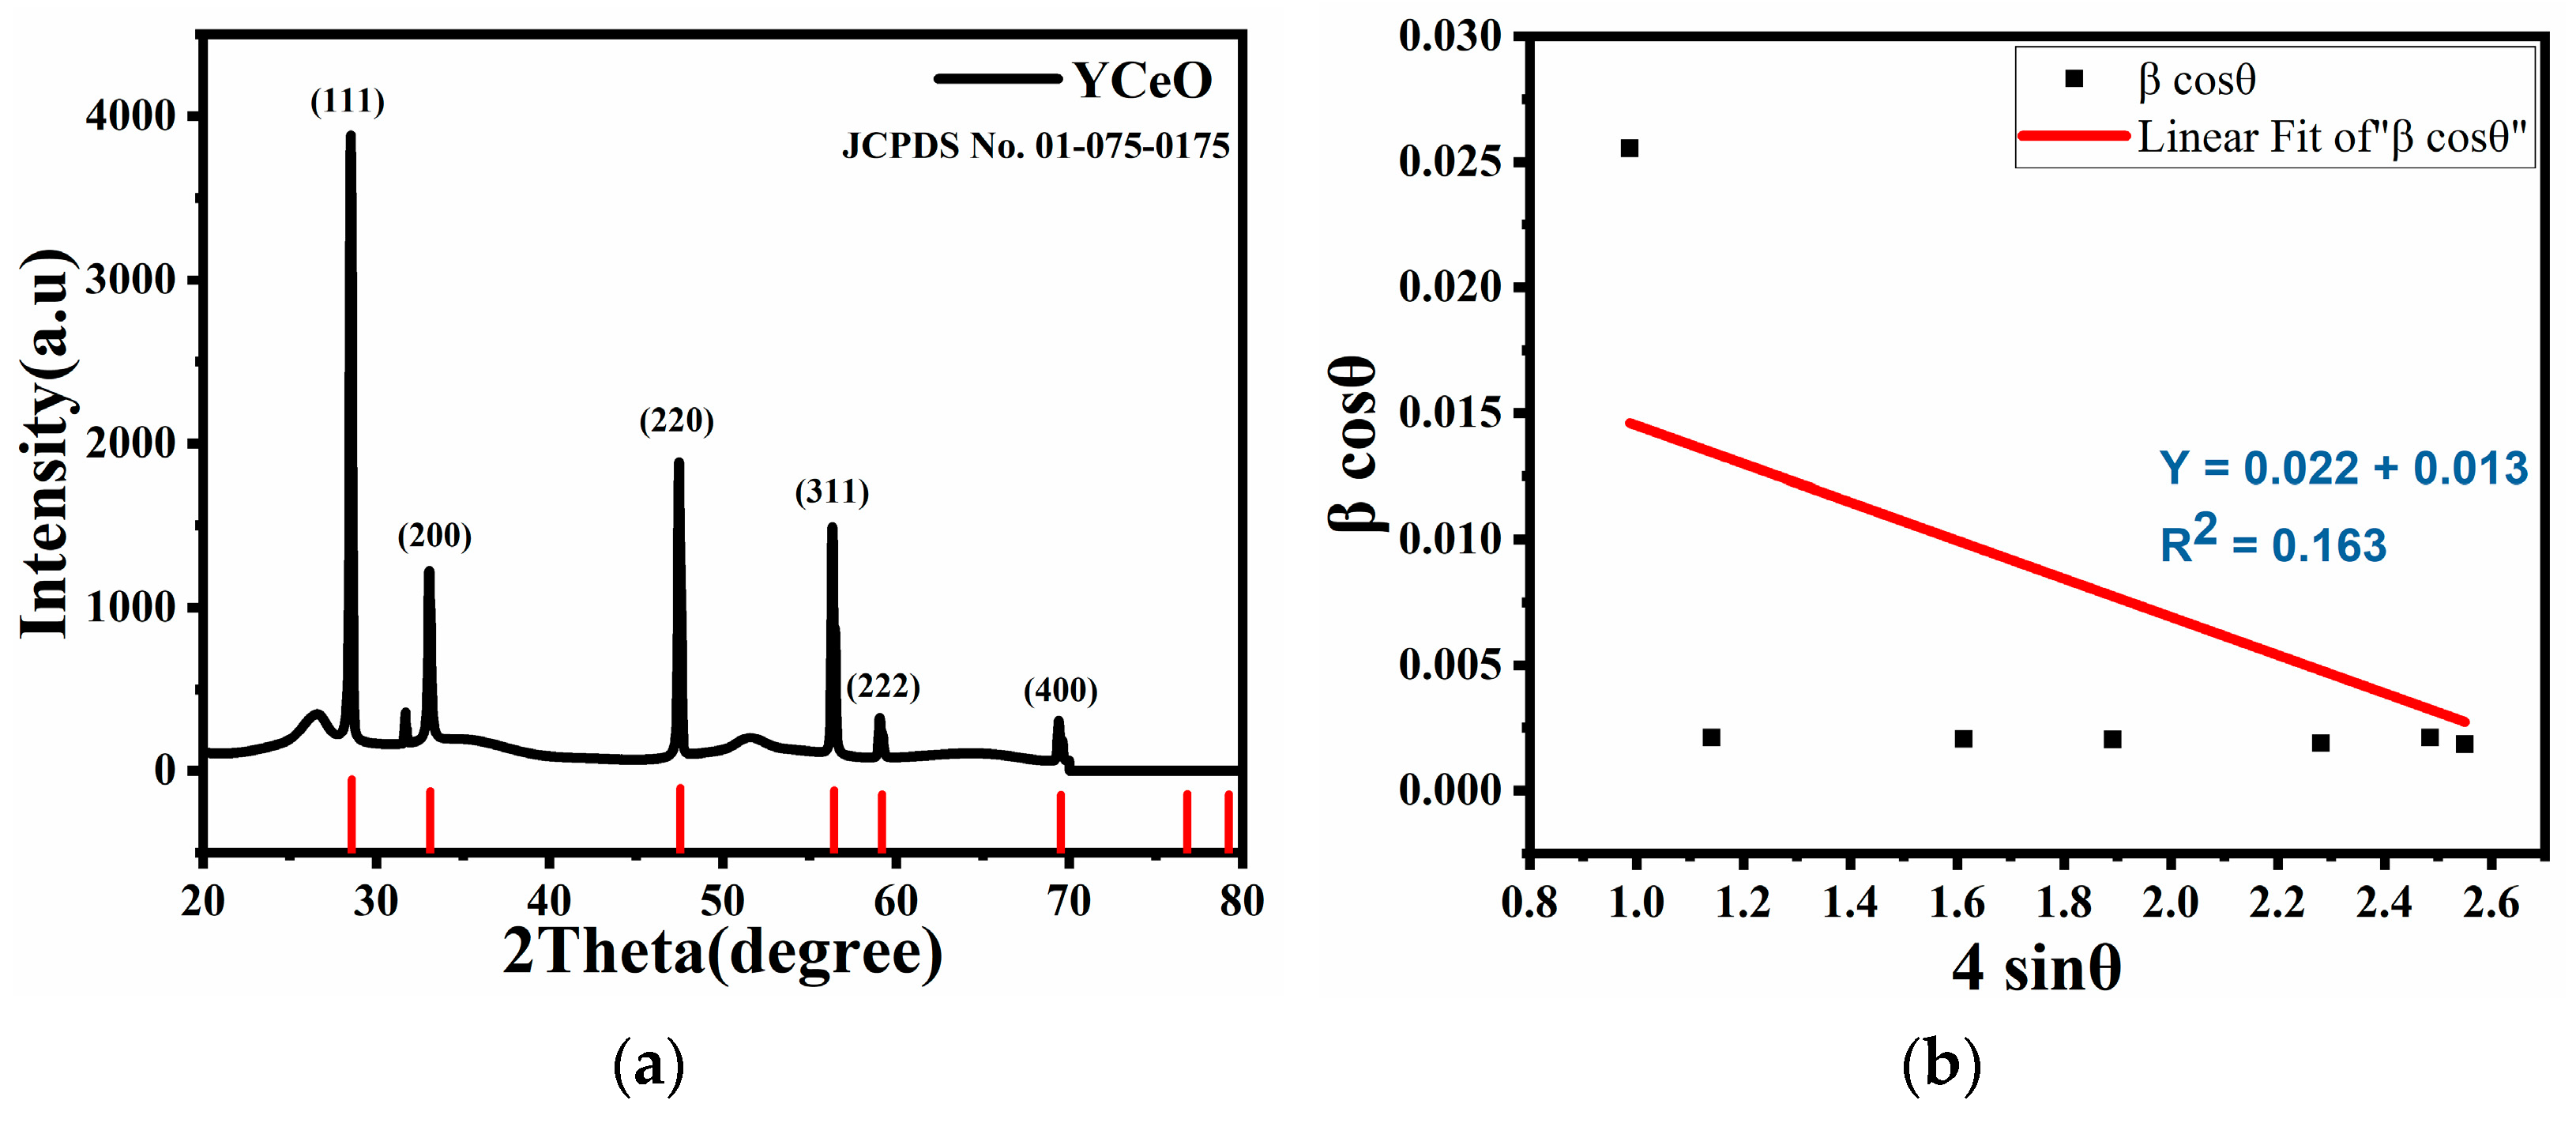
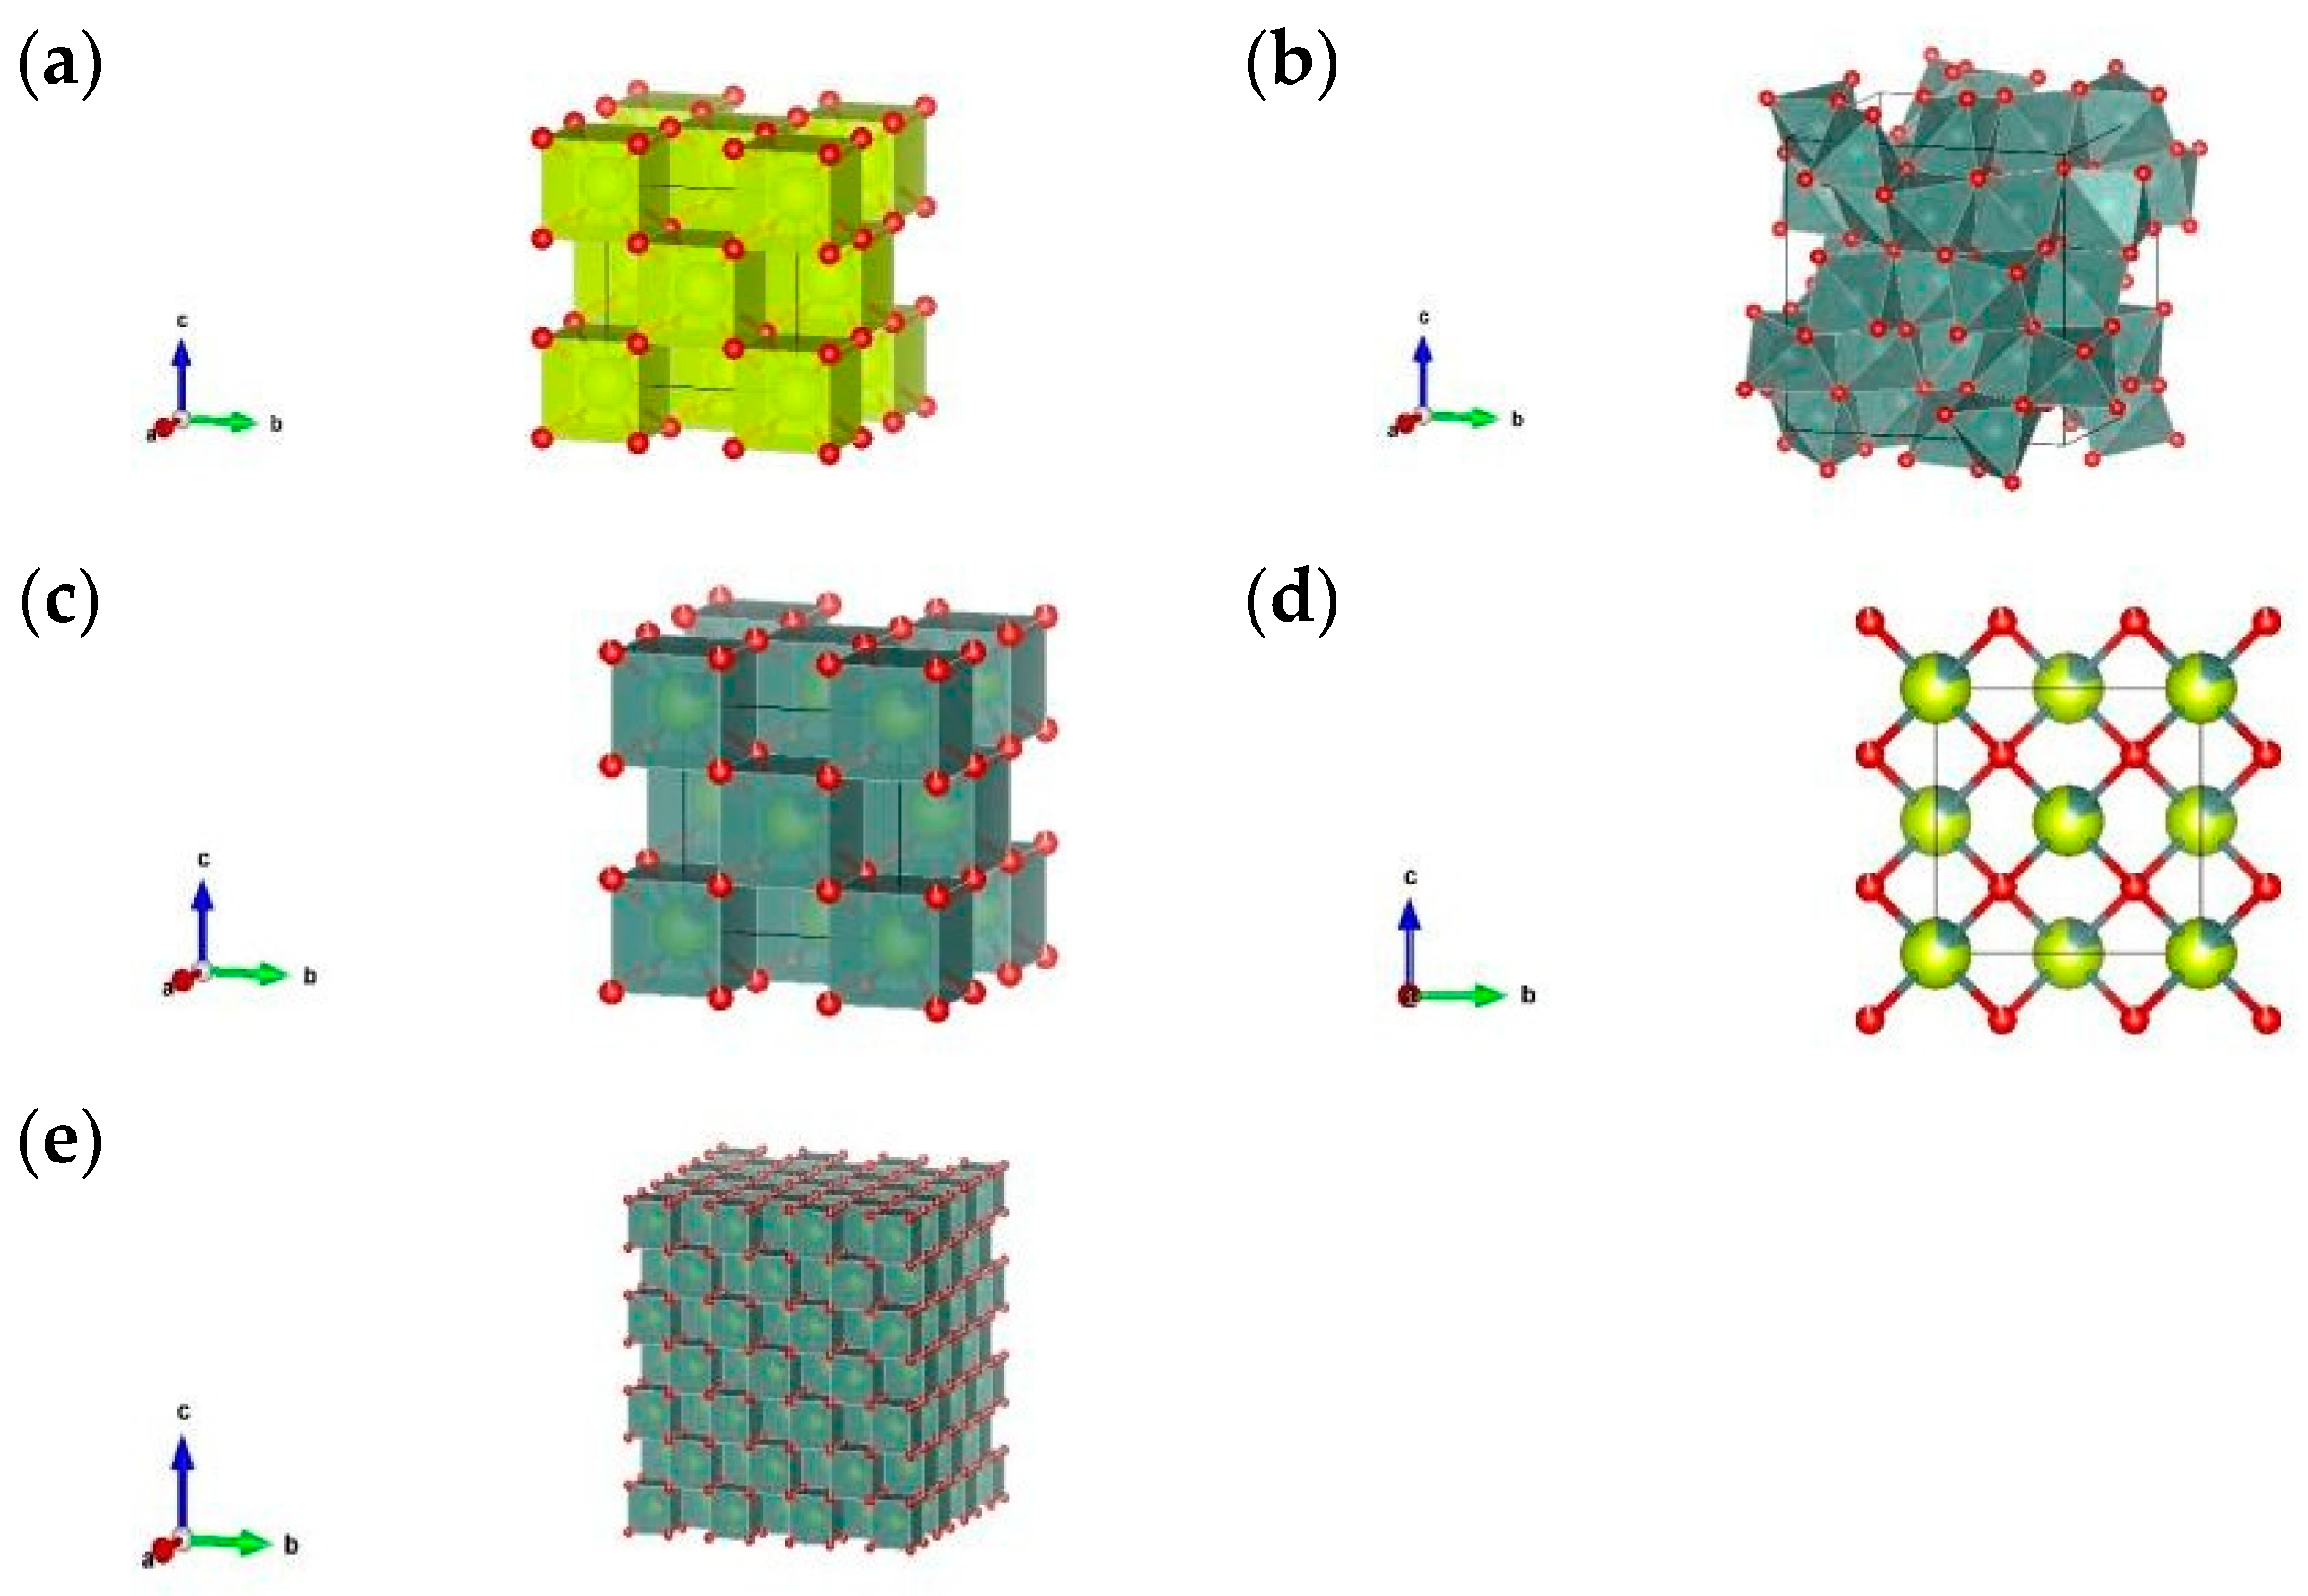
3.1. XRD Analysis
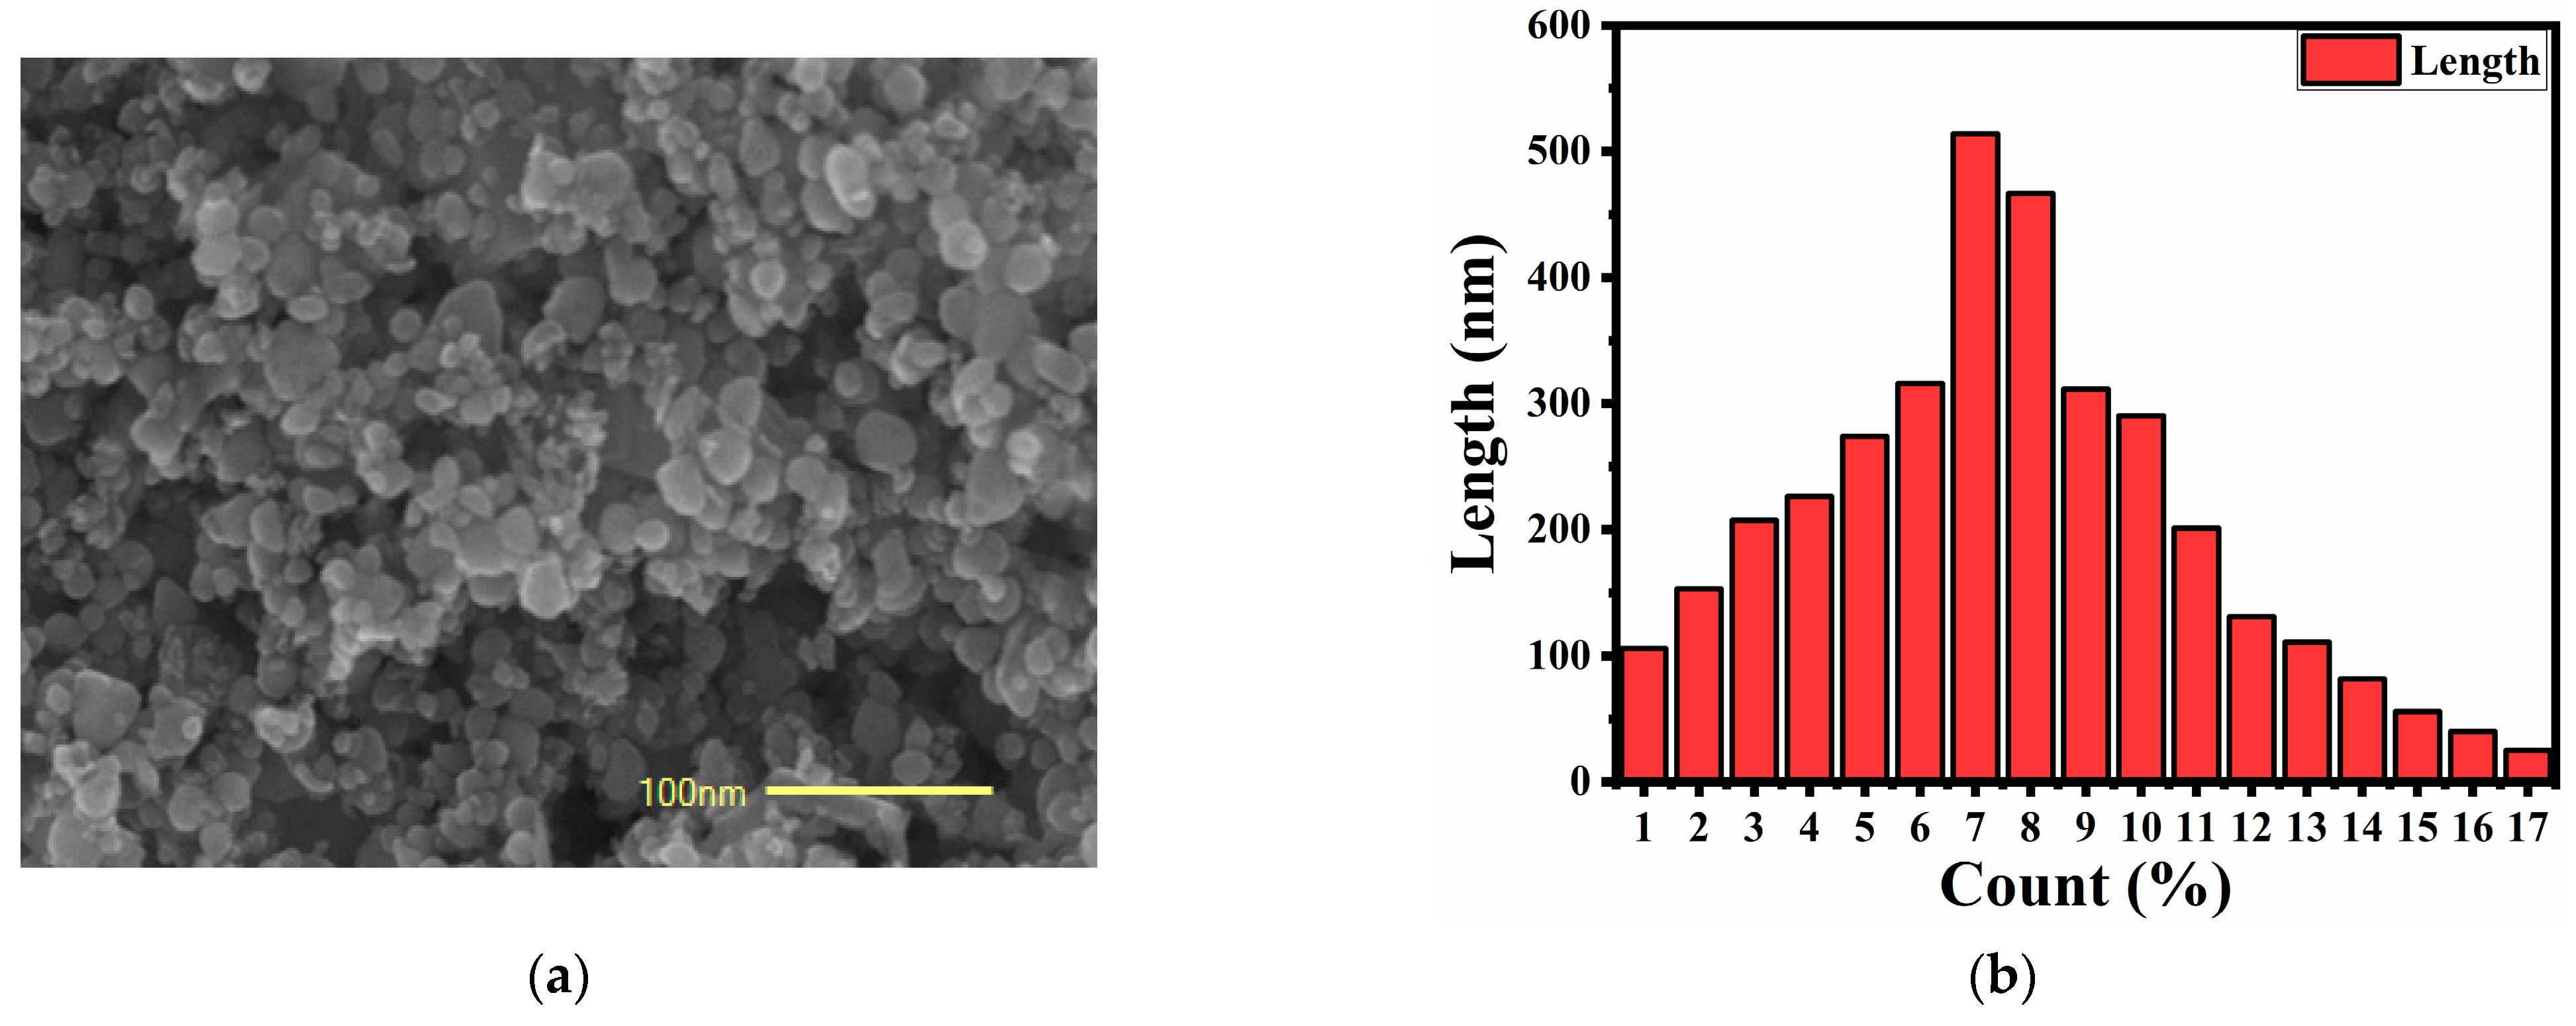
3.2. FE-SEM Analysis
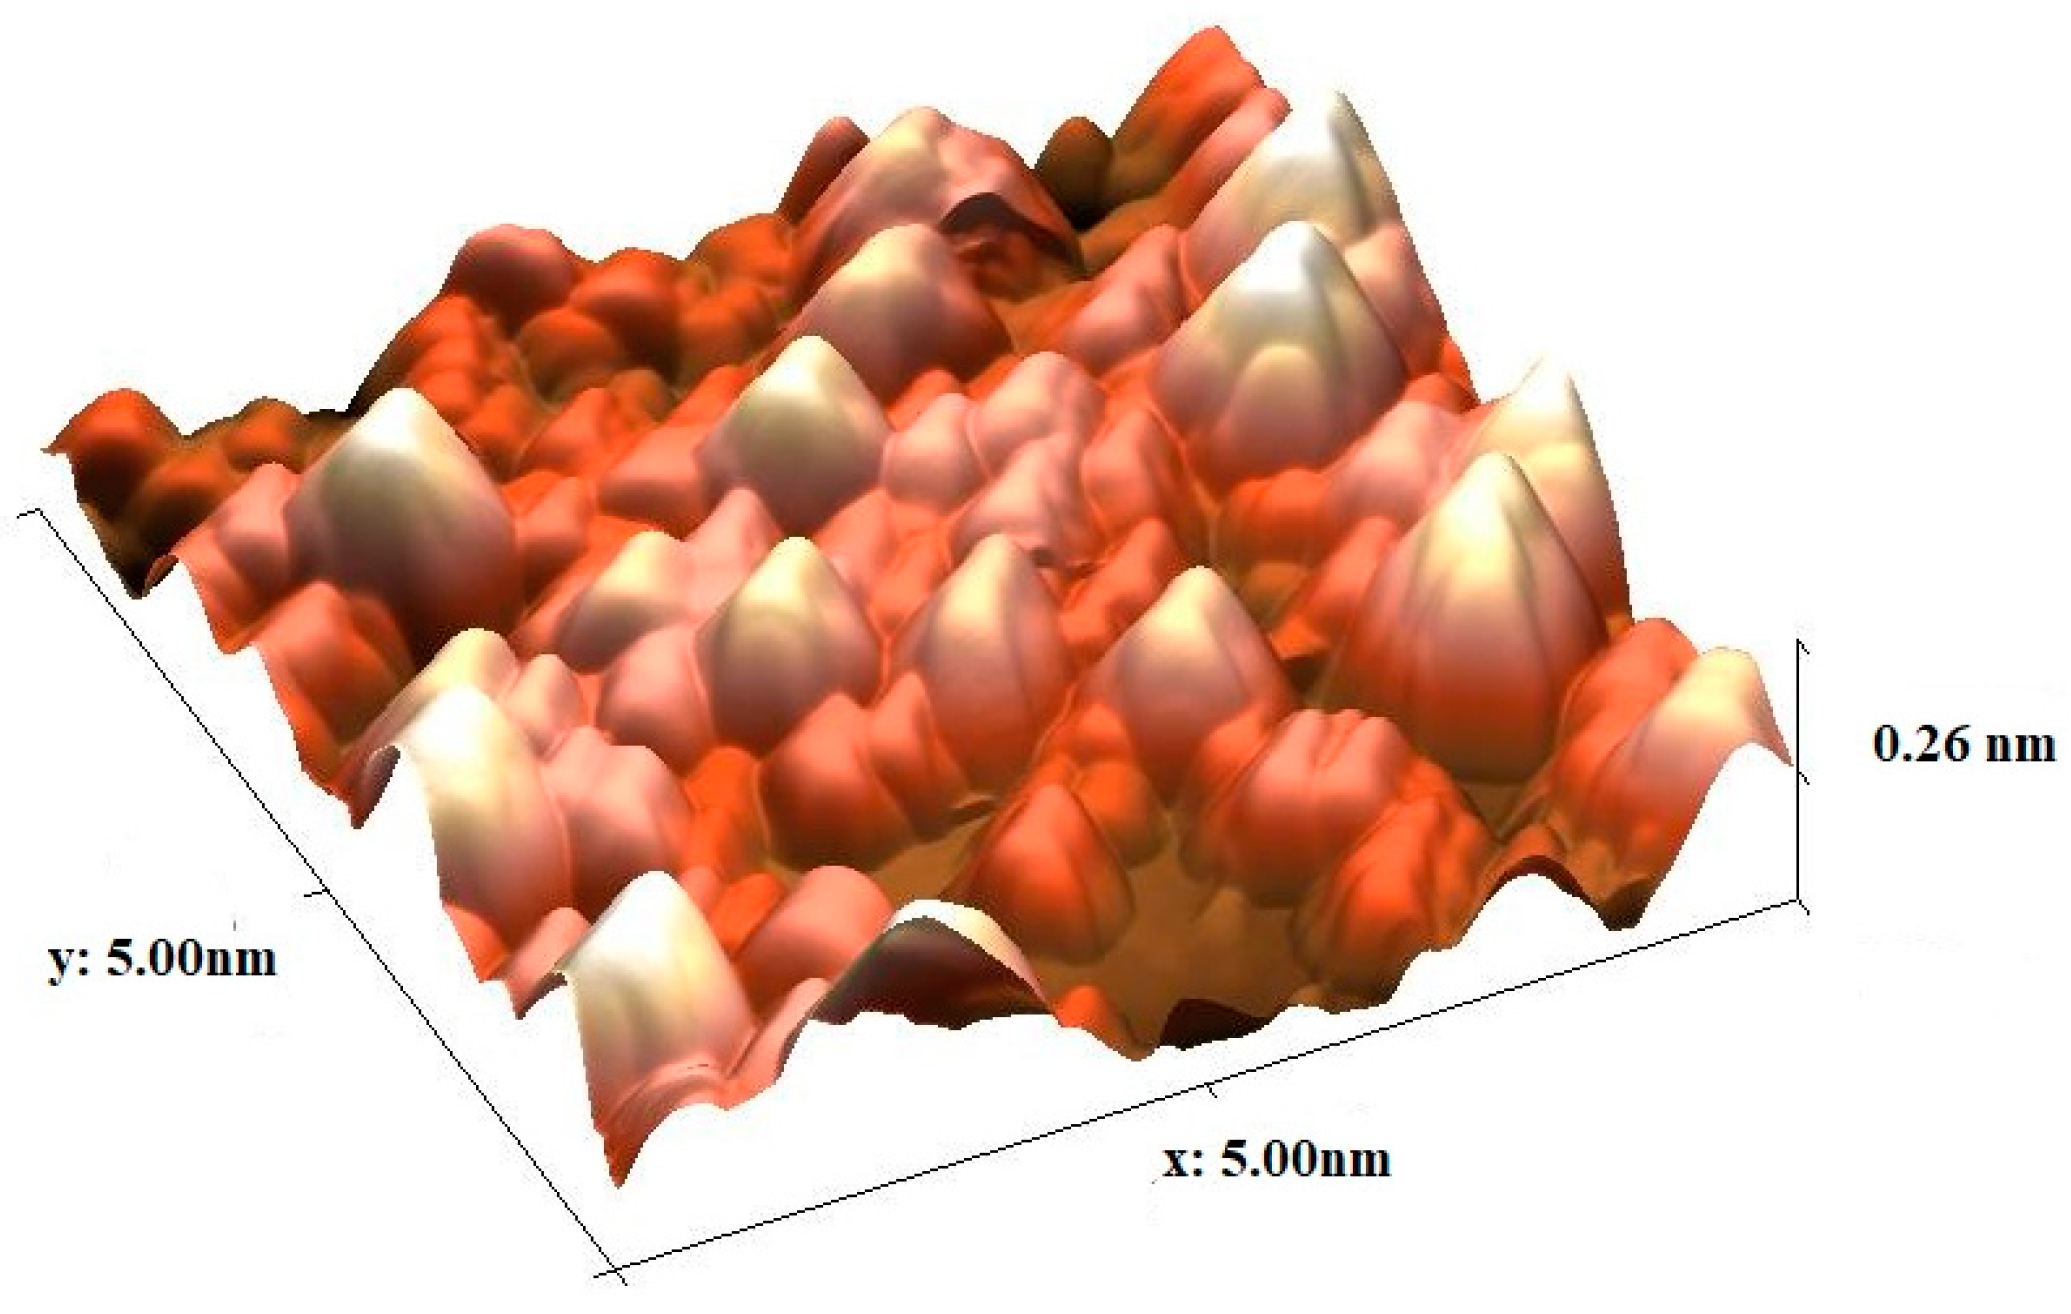
3.3. AFM Analysis
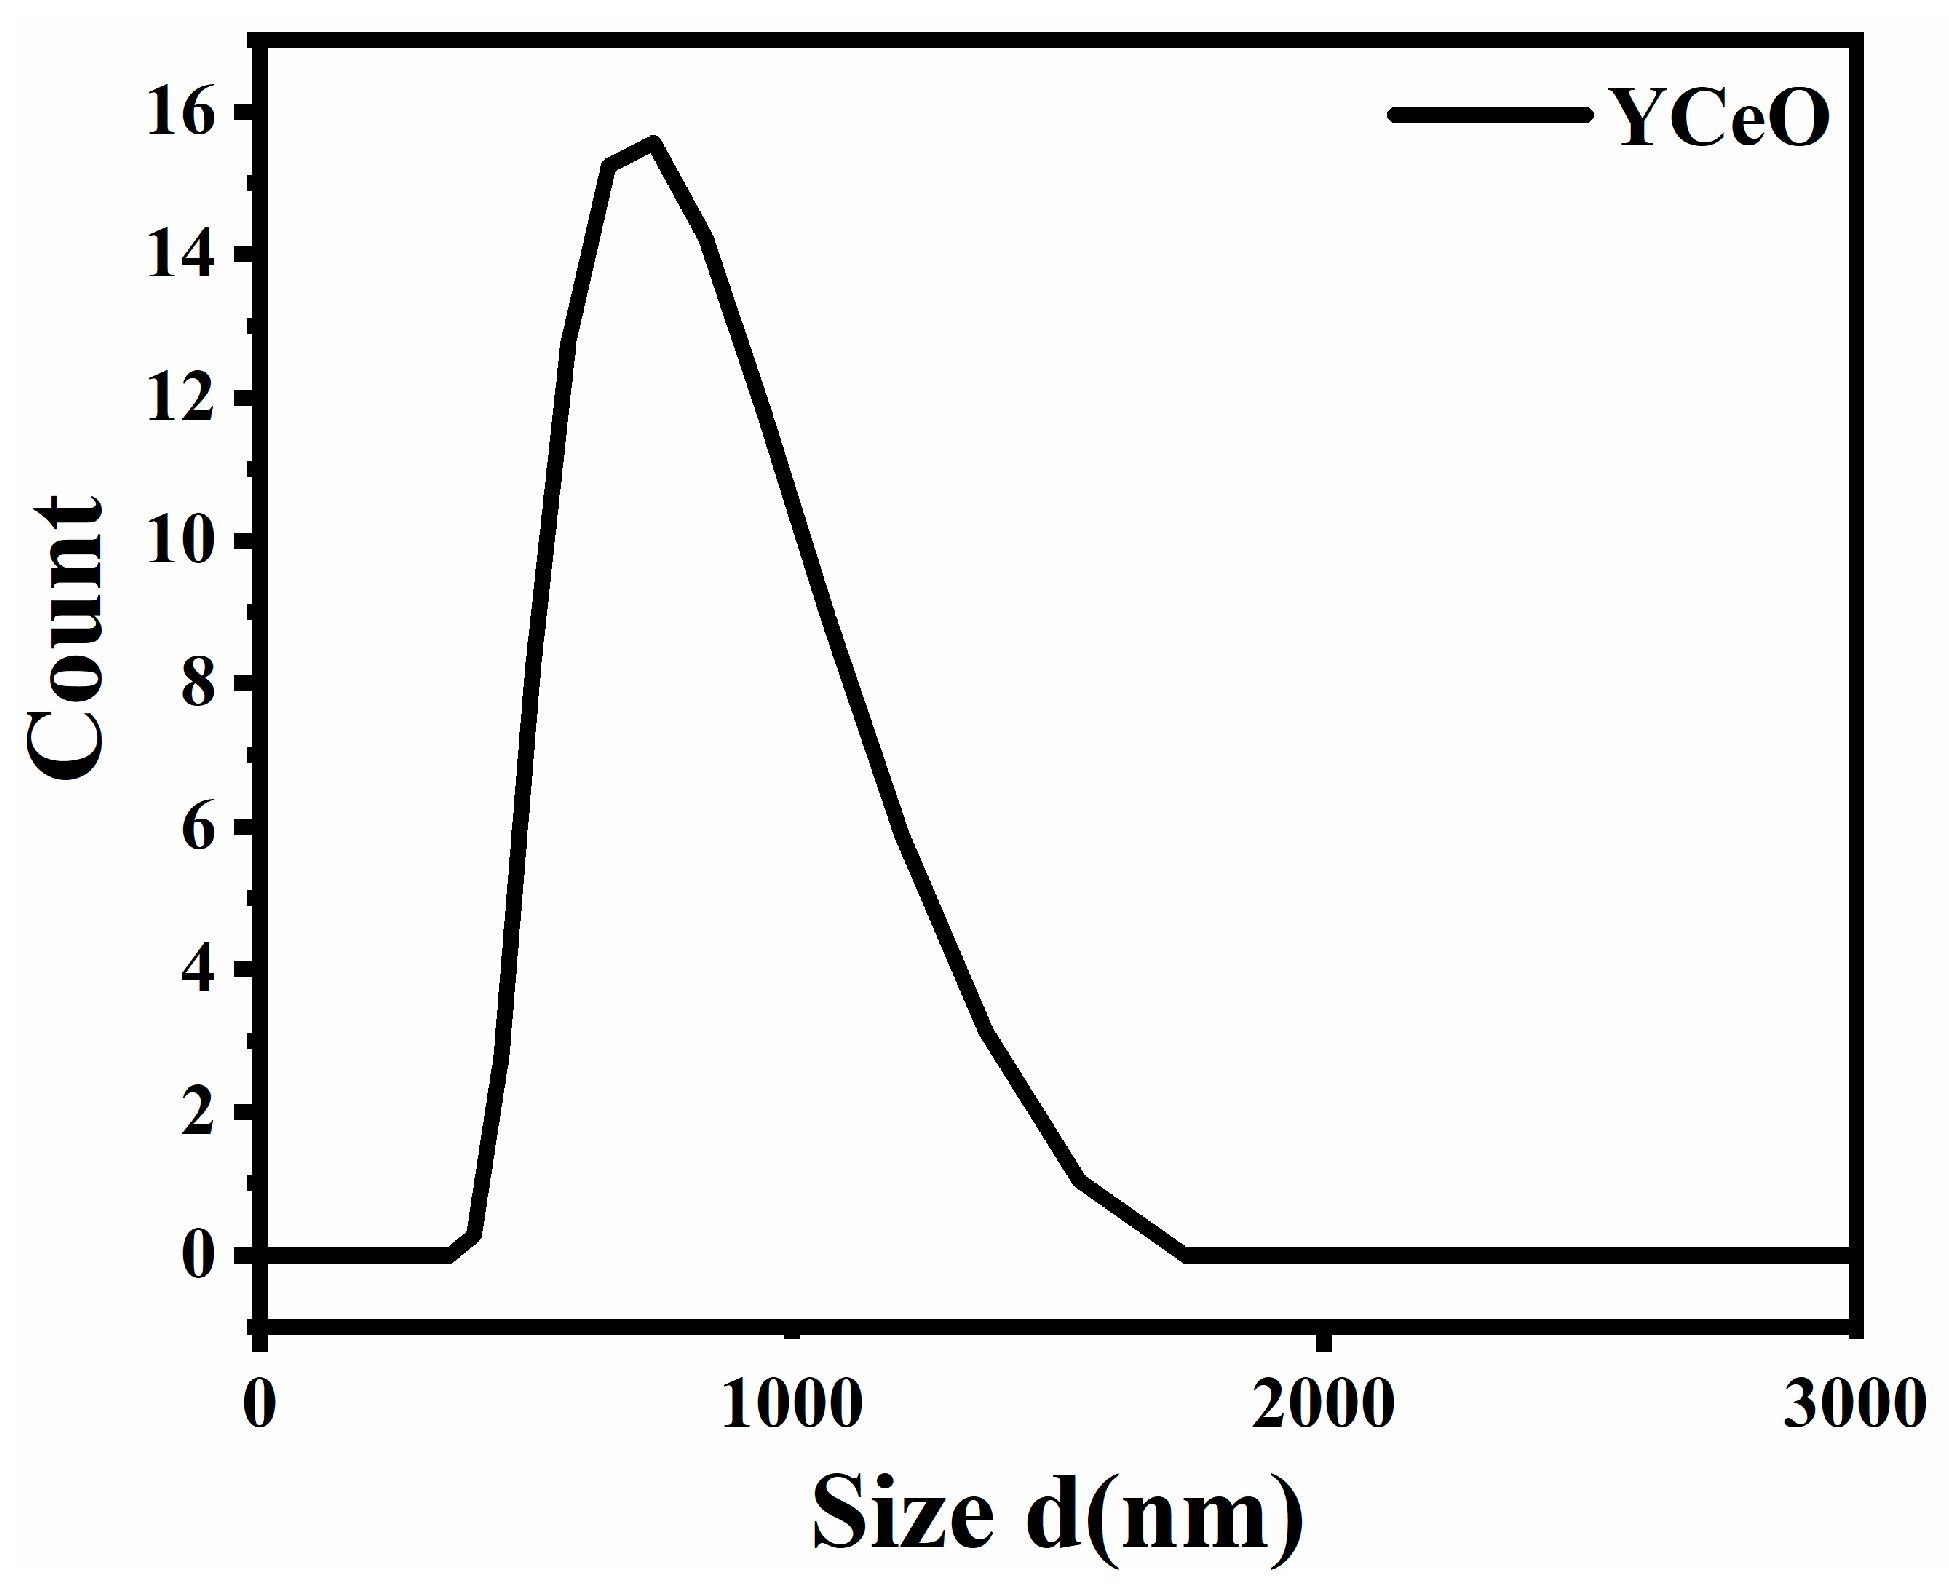
3.4. Nanoparticle Size Analyzer
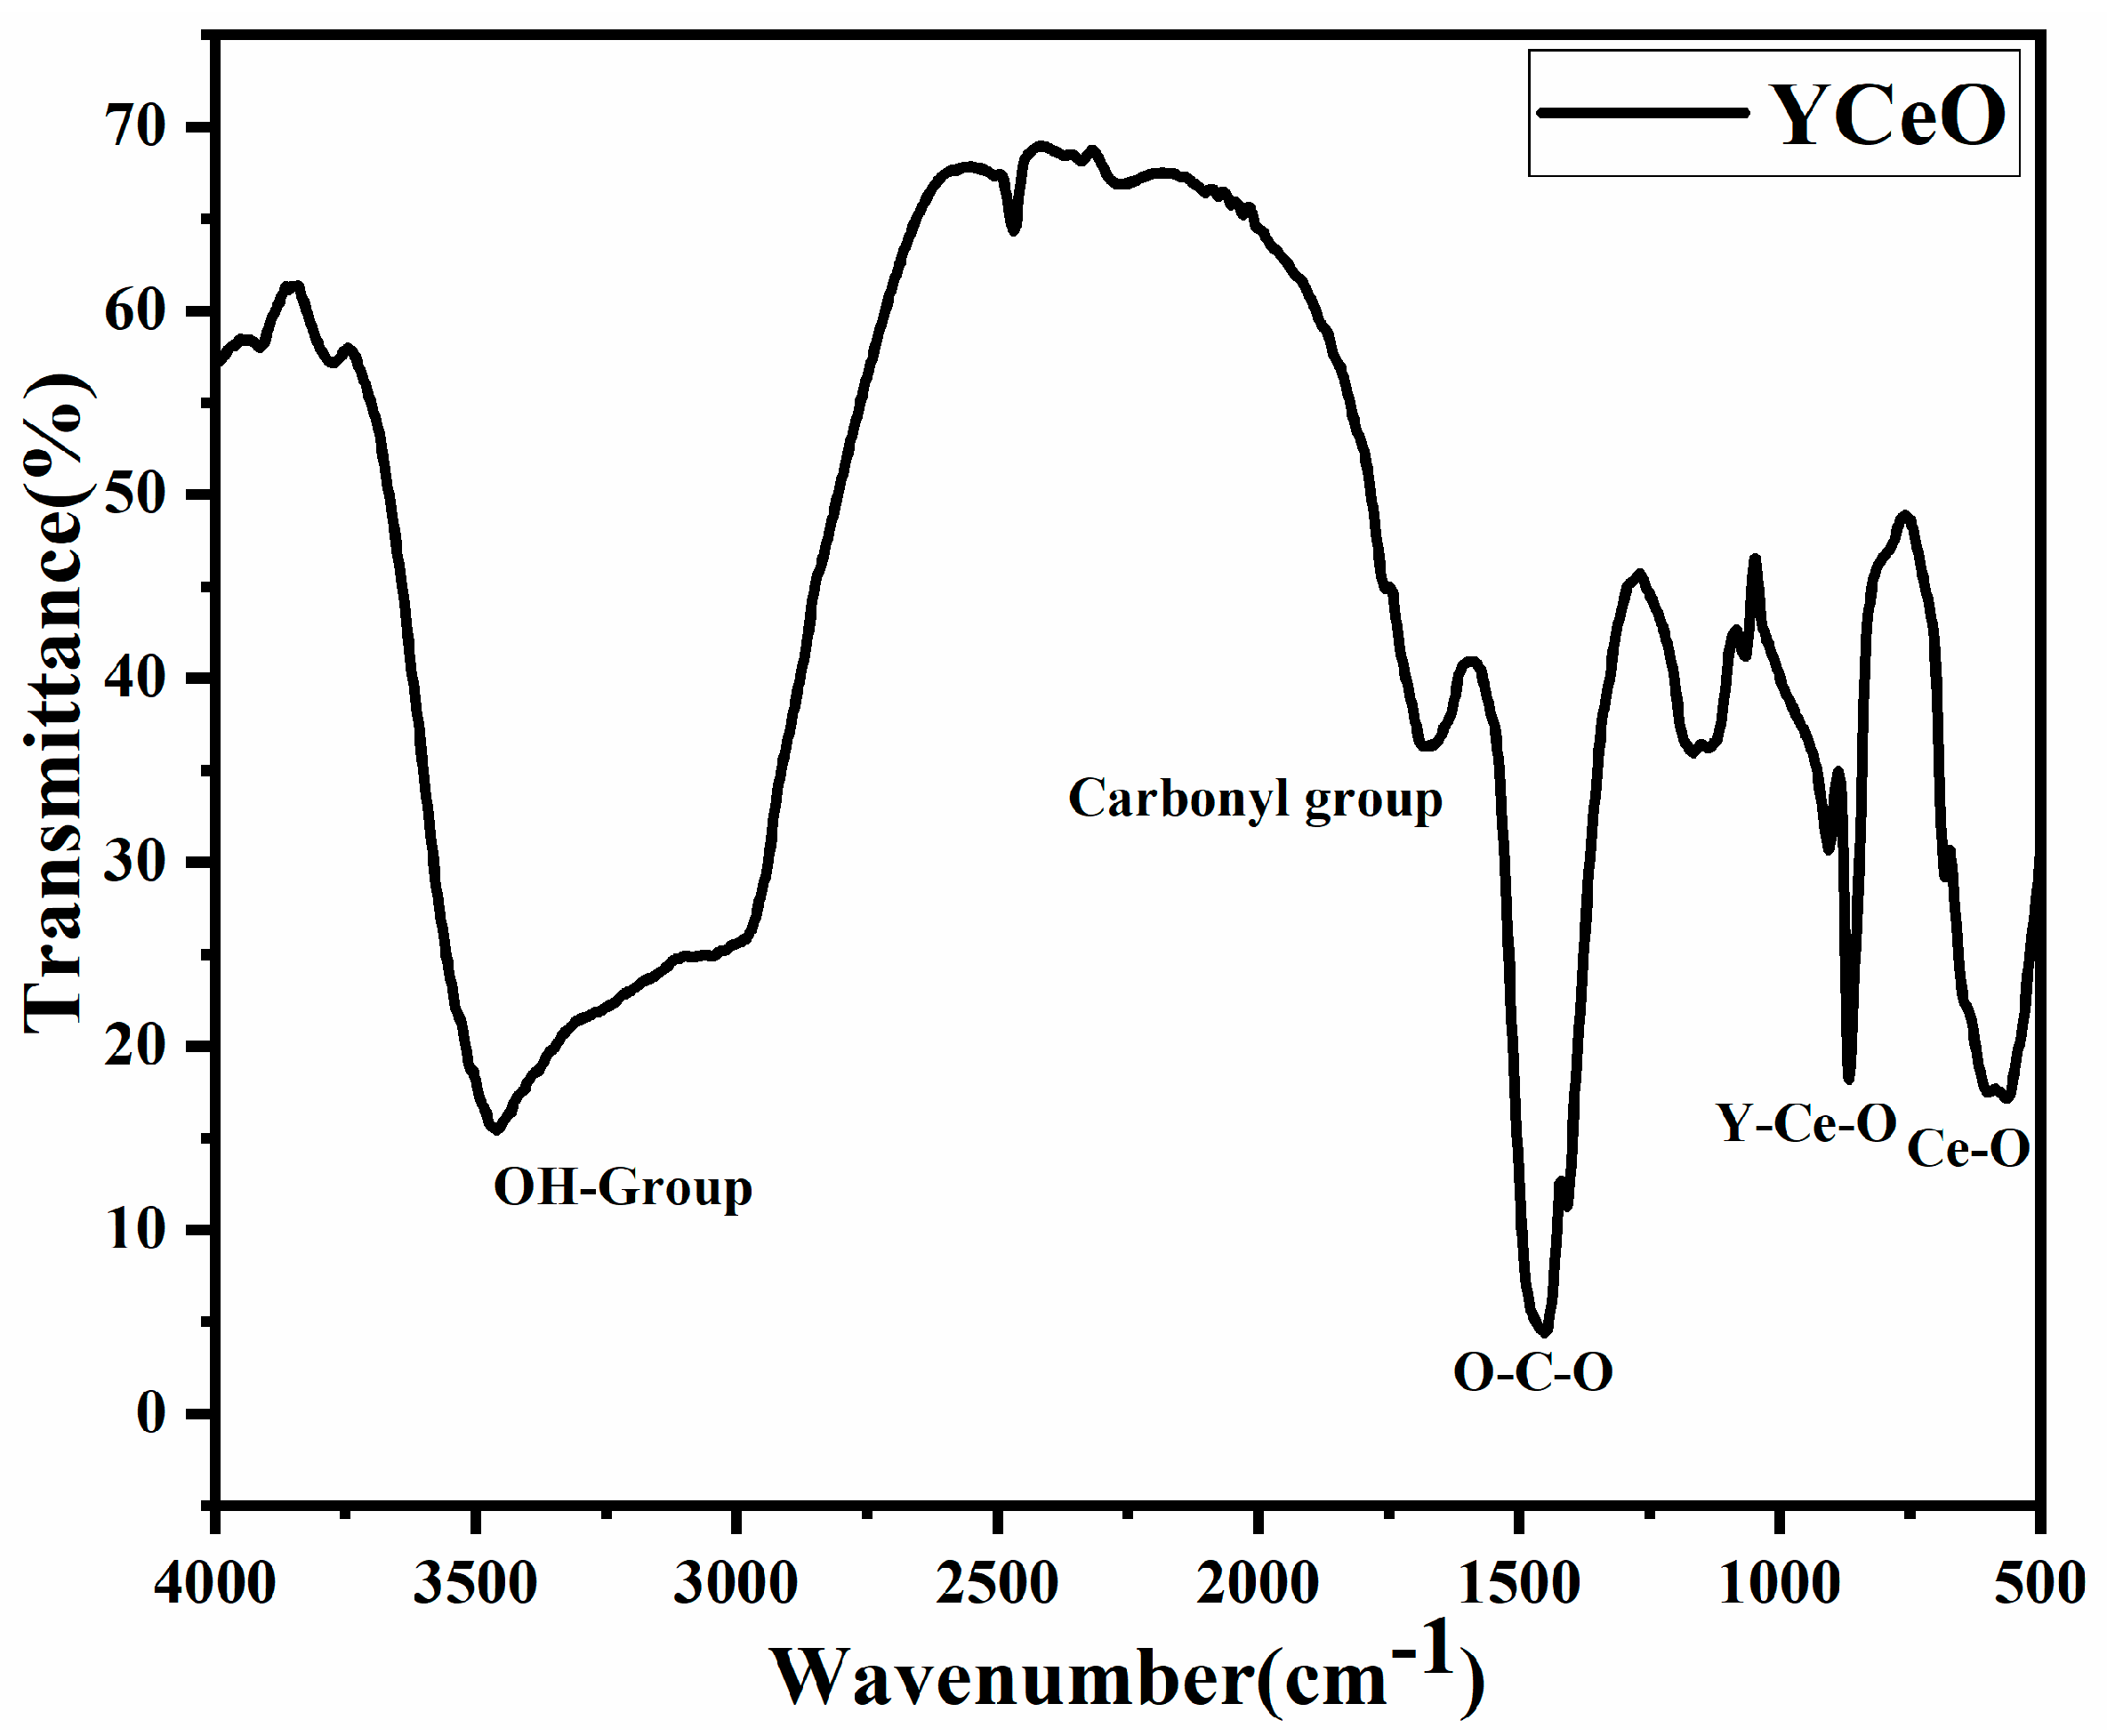
3.5. FTIR Spectroscopy Analysis
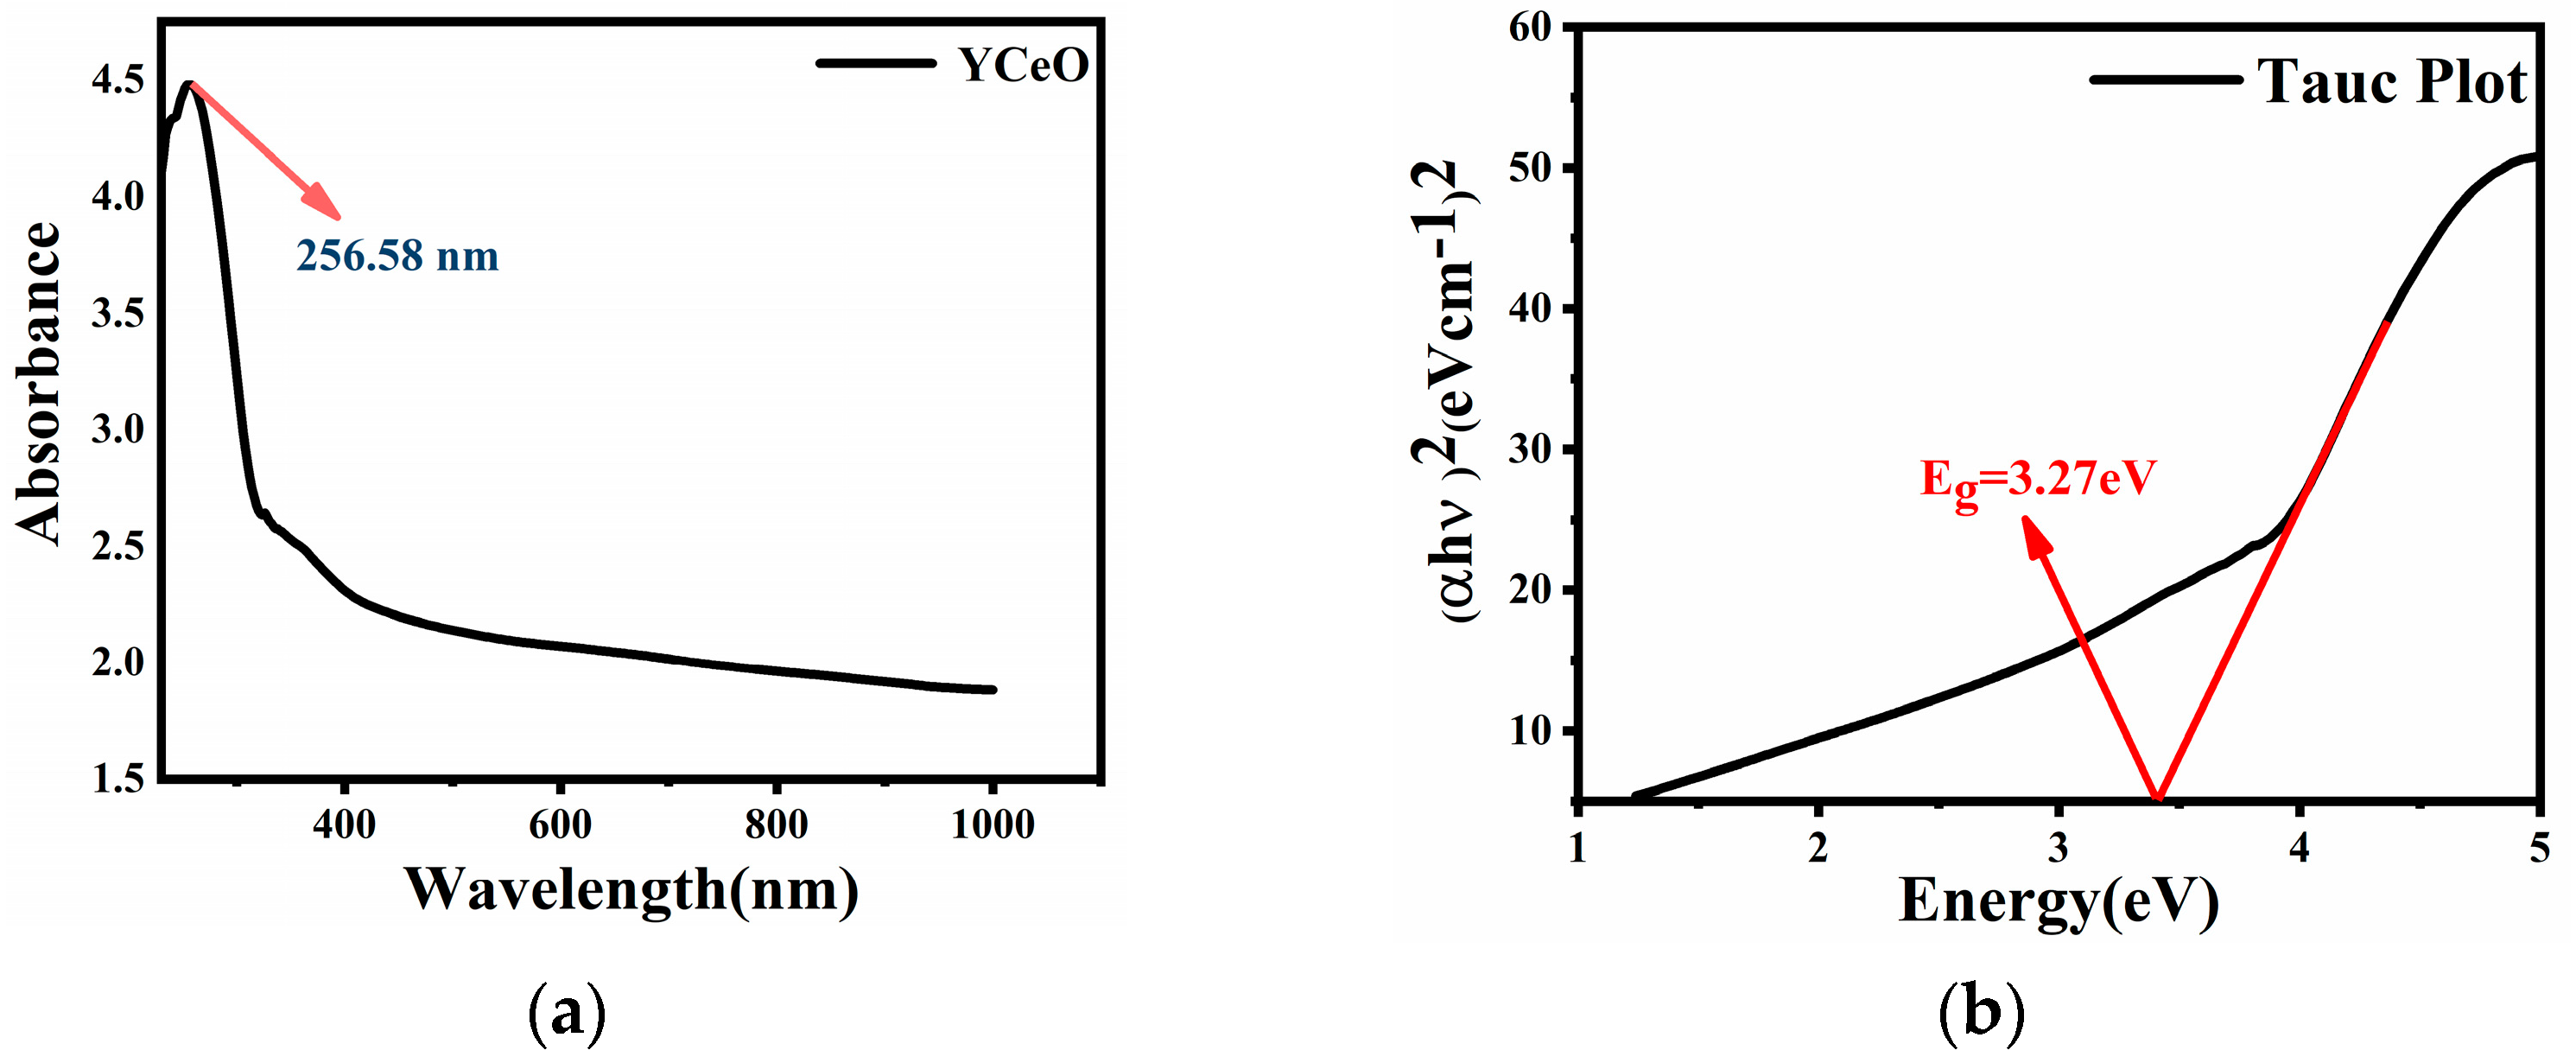
3.6. UV-Visible Spectroscopy Analysis
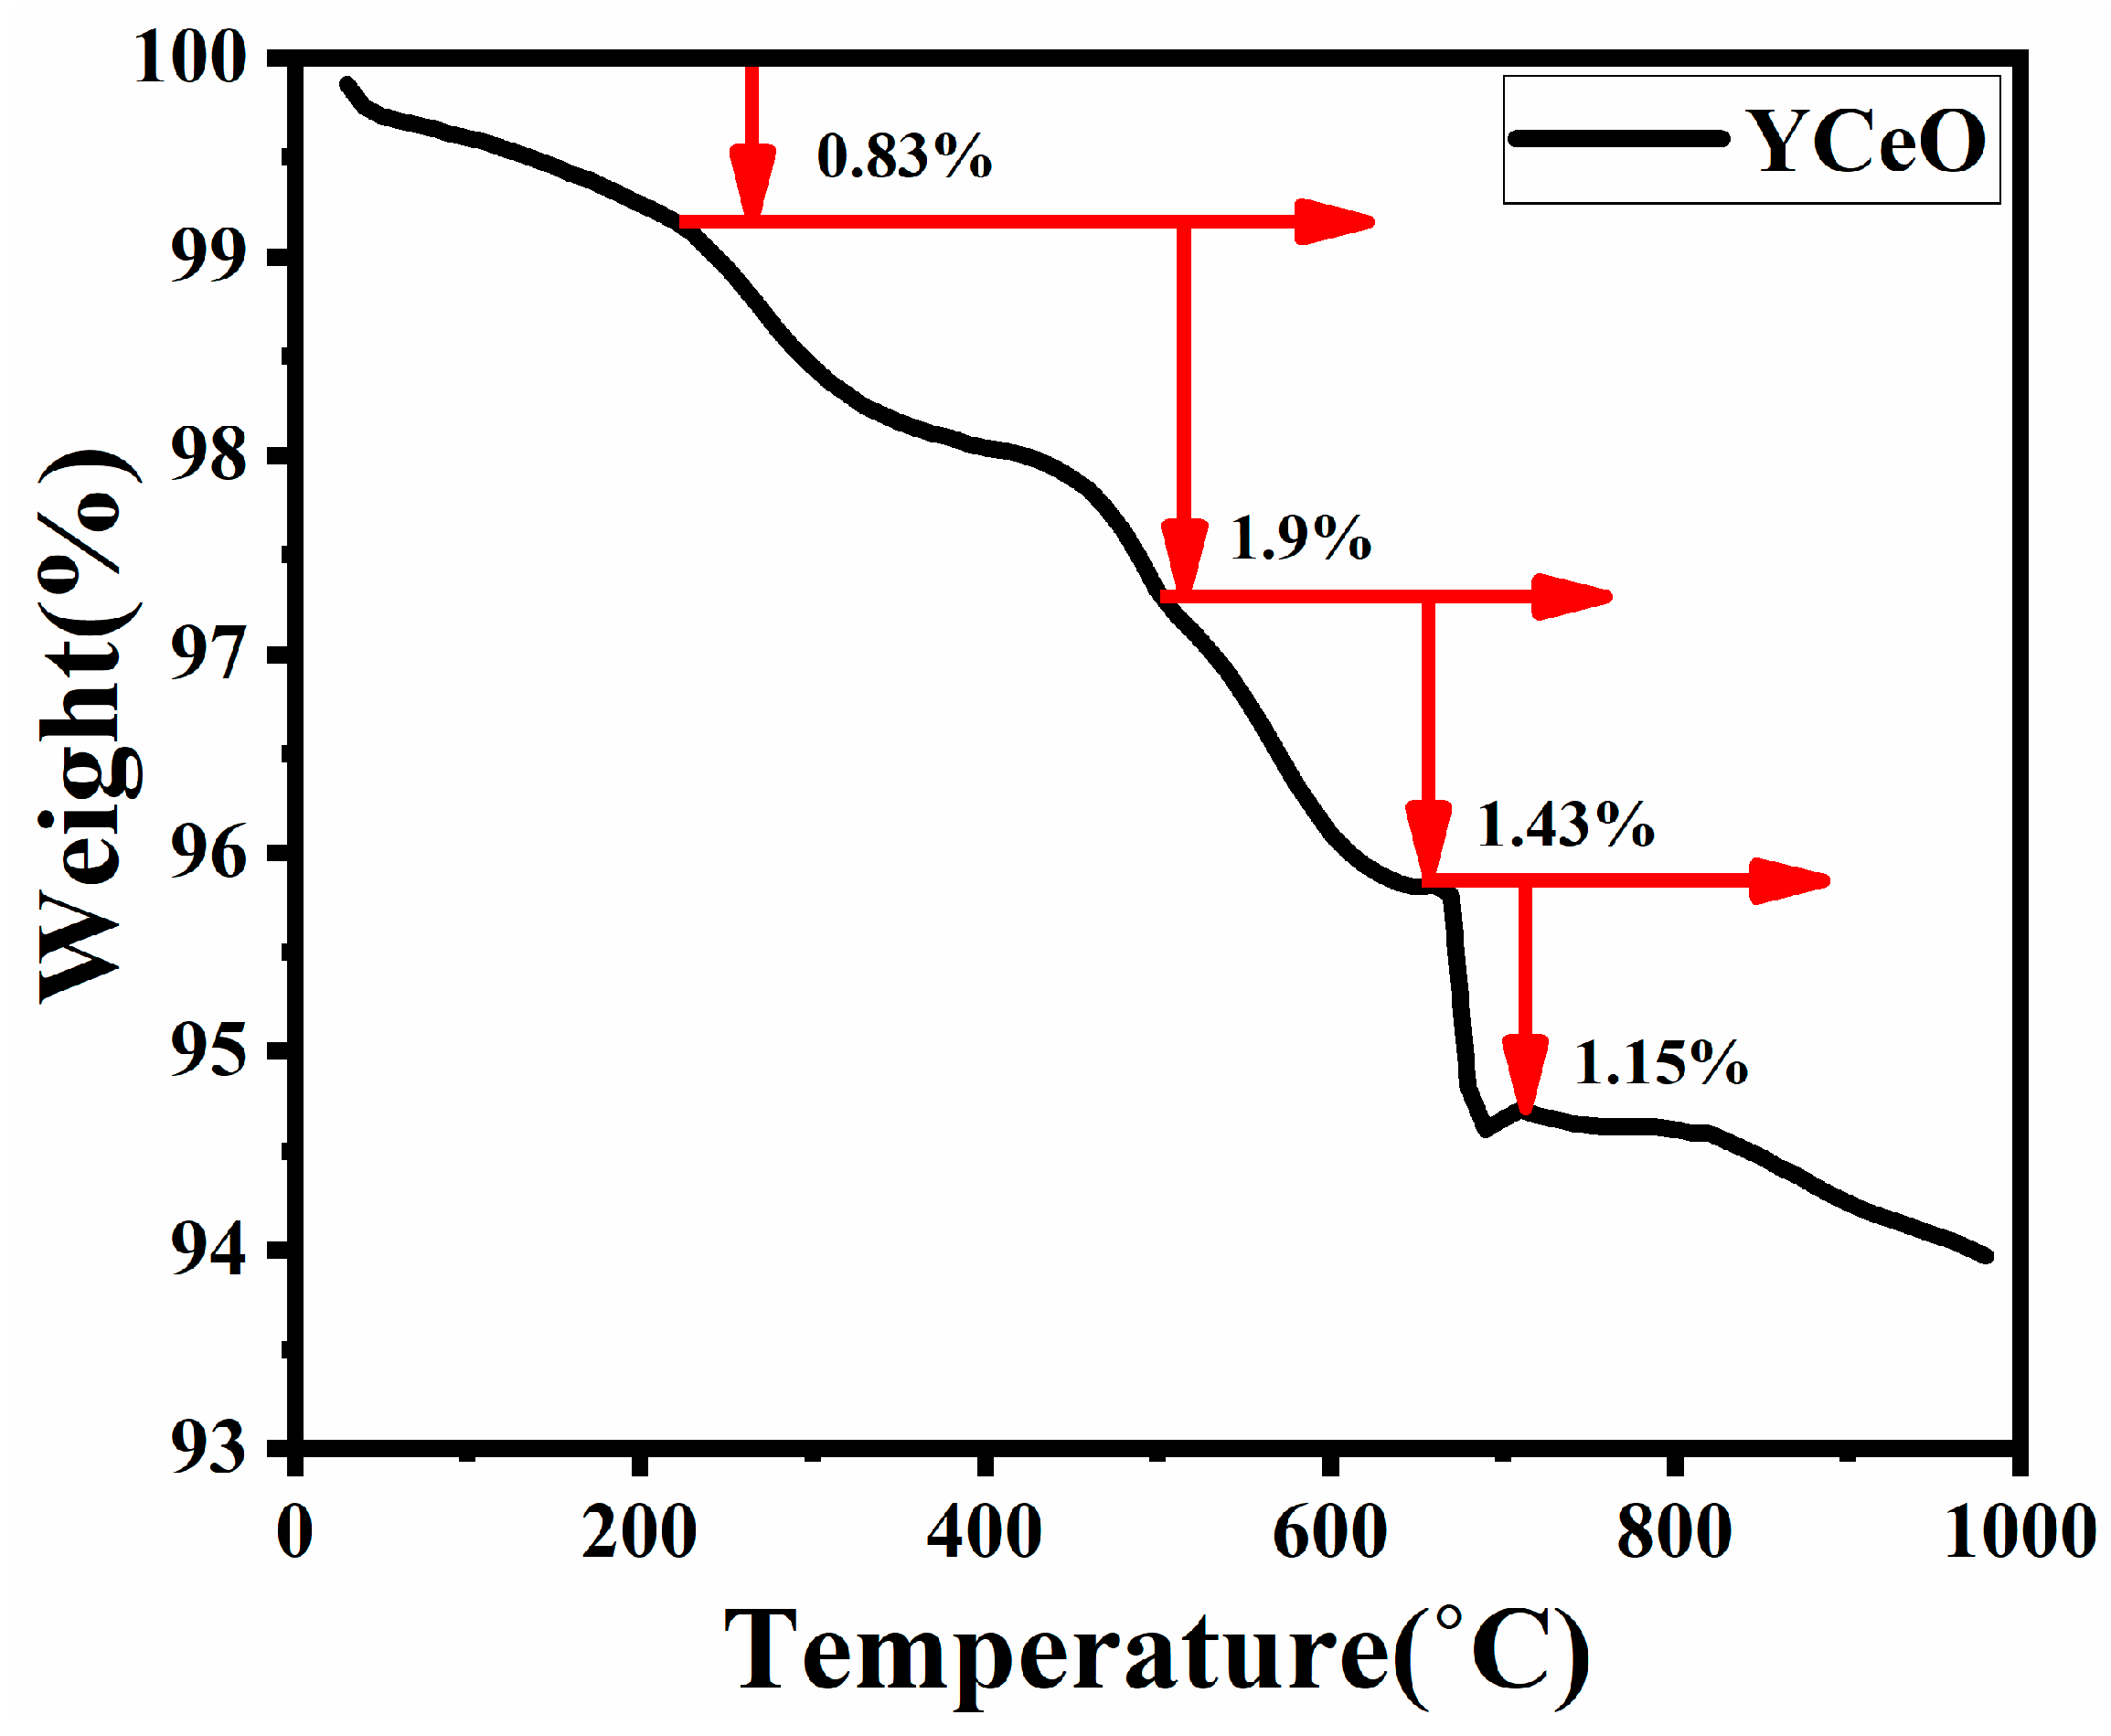
3.7. TGA Analysis
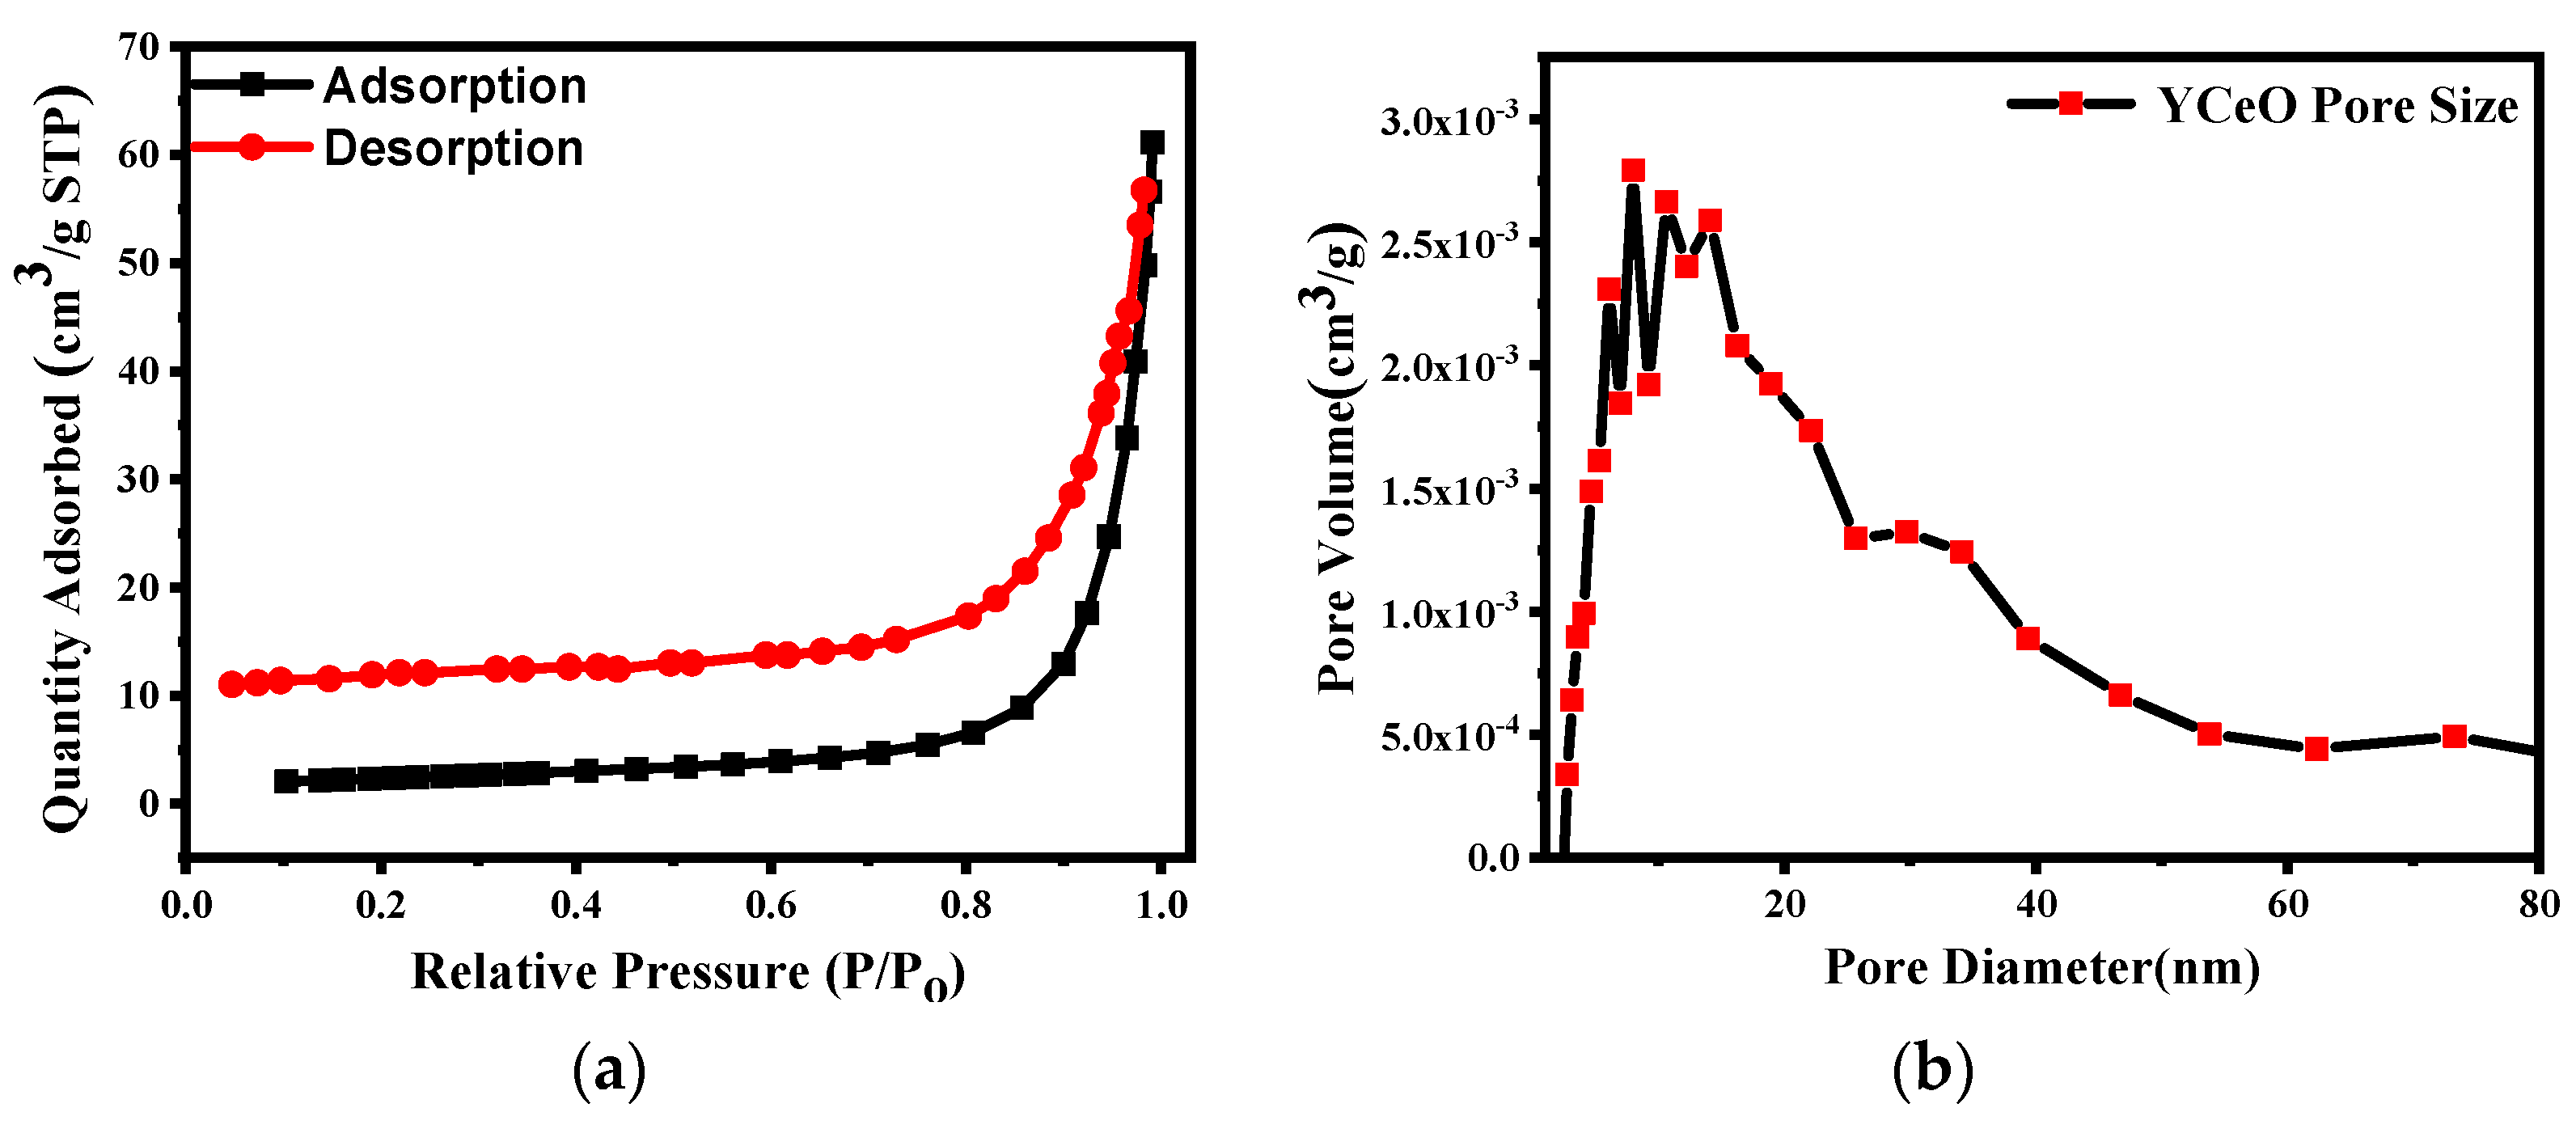
3.8. BET Analysis
4. Conclusions
Supplementary Materials
Author Contributions
Funding
Institutional Review Board Statement
Informed Consent Statement
Data Availability Statement
Acknowledgments
Conflicts of Interest
References
- Zhang, C.; Zhang, X.; Wang, Y.; Xie, S.; Liu, Y.; Lu, X.; Tong, Y. Facile electrochemical synthesis of CeO2 hierarchical nanorods and nanowire with excellent photocatalytic activities. New J. Chem. 2014, 38, 2581–2586. [Google Scholar] [CrossRef]
- Goharshadi, E.K.; Samiee, S.; Nancarrow, P. Fabrication of cerium oxide nanoparticles: Characterization and optical properties. J. Colloid Interface Sci. 2011, 356, 473–480. [Google Scholar] [CrossRef] [PubMed]
- Kaviyarasu, K.; Manikandan, E.; Nuru, Z.Y.; Maaza, M. Investigation on the structural properties of CeO2 nanofibers via CTAB surfactant. Mater. Lett. 2015, 160, 61–63. [Google Scholar] [CrossRef]
- Ameta, K.L.; Papnai, N.; Ameta, R. Photocatalytic Degradation of Malachite Green Using Nano-sized cerium-iron Oxide. Orbital Electron. J. Chem. 2014, 6, 4–19. [Google Scholar]
- Magdalene, C.M.; Kaviyarasu, K.; Vijaya, J.J.; Jayakumar, C.; Maaza, M.; Jeyaraj, B. Photocatalytic degradation effect of malachite green and catalytic hydrogenation by UV–illuminated CeO2/CdO multilayered nanoplatelet arrays: Investigation of antifungal and antimicrobial activities. J. Photochem. Photobiol. B Biol. 2017, 169, 110–123. [Google Scholar] [CrossRef]
- Gu, S.; Chen, Y.; Yuan, X.; Wang, H.; Chen, X.; Liu, Y.; Jiang, Q.; Wu, Z.; Zeng, G. Facile synthesis of CeO2 nanoparticles sensitized CdS nanorods photocatalyst with improved visible-light photocatalytic degradation of Rhodamine B. RSC Adv. 2015, 5, 79556–79564. [Google Scholar] [CrossRef]
- Askarinejad, A.; Morsali, A. Syntheses and characterization of CdCO3 and CdO nanoparticles by using a sonochemical method. Mater. Lett. 2008, 62, 478–482. [Google Scholar] [CrossRef]
- Zhao, M.; Li, H.; Shen, X.P.; Ji, Z.Y.; Xu, K.Q. Facile electrochemical synthesis of CeO2@Ag@CdS nanotube arrays with enhanced photoelectrochemically water splitting performance. Dalton Trans. 2015, 44, 19935–19941. [Google Scholar] [CrossRef]
- Couture, P.; Williams, G.V.M.; Kennedy, J.; Leveneur, J.; Murmu, P.P.; Chong, S.V.; Rubanov, S. Multiferroic nanocrystalline BiFeO3 and BiCrO3 thin films prepared by ion beam sputtering. Int. J. Nanotechnol. 2017, 14, 56–65. [Google Scholar] [CrossRef]
- Couture, P.; Williams, G.V.M.; Kennedy, J.; Leveneur, J.; Murmu, P.P.; Chong, S.V.; Rubanov, S. Nanocrystalline multiferroic BiFeO3 thin films made by room temperature sputtering and thermal annealing, and formation of an iron oxide-induced exchange bias. J. Alloys Compd. 2017, 695, 3061–3068. [Google Scholar] [CrossRef]
- Kennedy, J.; Fang, F.; Futter, J.; Leveneur, J.; Murmu, P.P.; Panin, G.N.; Kang, T.W.; Manikandan, E. Synthesis and enhanced field emission of zinc oxide incorporated carbon nanotubes. Diam. Relat. Mater. 2017, 71, 79–84. [Google Scholar] [CrossRef]
- Porqueras, I.; Pearson, C.; Corbella, C.; Vives, M.; Pinyol, A.; Bertran, E. Characteristics of e-beam deposited electrochromic CeO2 thin films. Solid State Ion. 2003, 165, 131–137. [Google Scholar] [CrossRef]
- Zhao, S.; Li, J.; Wang, L.; Wang, X. Degradation of Rhodamine B and Safranin-T by MoO3:CeO2 Nanofibers and Air Using a Continuous Mode. Clean-Soil Air Water 2010, 38, 268–274. [Google Scholar] [CrossRef]
- Frazer, K.A.; Pachter, L.; Poliakov, A.; Rubin, E.M.; Dubchak, I. VISTA: Computational tools for comparative genomics. Nucleic Acids Res. 2004, 32, W273–W279. [Google Scholar] [CrossRef]
- Baldinozzi, G.; Berar, J.-F.; Calvarin, G. Rietveld refinement of two-phase Zr-doped Y2O3. Mater. Sci. Forum 1998, 278-281, 680–685. [Google Scholar] [CrossRef]
- Artini, C.; Costa, G.A.; Pani, M.; Lausi, A.; Plaisier, J. Structural characterization of the CeO2/Gd2O3 mixed system by synchrotron X-ray diffraction. J. Solid State Chem. 2012, 190, 24–28. [Google Scholar] [CrossRef]
- Brauer, G.; Gradinger, H. Über heterotype Mischphasen bei Seltenerdoxyden. I. J. Inorg. Gen. Chem. 1954, 276, 209–226. [Google Scholar]
- Mahapatra, C.; Singh, R.K.; Lee, J.H.; Jung, J.; Hyun, J.K.; Kim, H.W. Nano shape varied cerium oxide nanomaterials rescue human dental stem cells from oxidative insult through intracellular or extracellular actions. Acta Biomater. 2017, 50, 142–153. [Google Scholar] [CrossRef]
- Traina, C.A.; Schwartz, J. Surface modification of Y2O3 nanoparticles. Langmuir 2007, 23, 9158–9916. [Google Scholar] [CrossRef] [PubMed]
- Verma, A.; Chaudhary, P.; Tripathi, R.K.; Yadav, B.C. Transient photodetection studies on 2D ZnO nanostructures prepared by simple organic-solvent assisted route. Sens. Actuators A Phy. 2021, 321, 112600. [Google Scholar] [CrossRef]
- Hassellöv, M.; Readman, J.W.; Ranville, J.F.; Tiede, K. Nanoparticle analysis and characterization methodologies in environmental risk assessment of engineered nanoparticles. Ecotoxicology 2008, 17, 344–361. [Google Scholar] [CrossRef] [PubMed]


| S. No | Calculated Parameters | YCeO |
|---|---|---|
| 1. | Empirical Formula | Ce0.80O1.90Y0.20 |
| 2. | Chemical Formula | Y0.20Ce0.80O1.90 |
| 3. | Lattice system | Cubic |
| 4. | Crystal system | Cubic |
| 5. | Space group | Fm3m |
| 6. | Space number | 225 |
| 7. | a (Å) | 5.4040 |
| 8. | b (Å) | 5.4040 |
| 9. | c (Å) | 5.4040 |
| 10. | α (°) | 90 |
| 11. | β (°) | 90 |
| 12. | γ (°) | 90 |
| 13. | Density (gm cm−3) | 6.74 |
| 14. | Volume (106) pm3 | 157.81 |
| 15. | Z (no. of molecules) | 4 |
| 16. | RIR (Reference intensity ratio) | 13.60 |
| 17. | Crystallite (grain) size (nm) | 18.66 |
| 18. | Lattice Strain | 0.0041 |
| 19. | Dimensionality | 3D |
| 20. | Degree of Freedom | 6 |
| 21. | R-Square (COD) | 0.16363 |
| 22. | Adj. R-Square | 0.02423 |
Disclaimer/Publisher’s Note: The statements, opinions and data contained in all publications are solely those of the individual author(s) and contributor(s) and not of MDPI and/or the editor(s). MDPI and/or the editor(s) disclaim responsibility for any injury to people or property resulting from any ideas, methods, instructions or products referred to in the content. |
© 2023 by the authors. Licensee MDPI, Basel, Switzerland. This article is an open access article distributed under the terms and conditions of the Creative Commons Attribution (CC BY) license (https://creativecommons.org/licenses/by/4.0/).
Share and Cite
Srivastava, S.; Pandey, N.K. Low-Cost Hydrothermally Synthesized Multifunctional Rare Earth Metal Yttrium Cerium Oxide. Mater. Proc. 2023, 14, 26. https://doi.org/10.3390/IOCN2023-14542
Srivastava S, Pandey NK. Low-Cost Hydrothermally Synthesized Multifunctional Rare Earth Metal Yttrium Cerium Oxide. Materials Proceedings. 2023; 14(1):26. https://doi.org/10.3390/IOCN2023-14542
Chicago/Turabian StyleSrivastava, Shivangi, and Narendra Kumar Pandey. 2023. "Low-Cost Hydrothermally Synthesized Multifunctional Rare Earth Metal Yttrium Cerium Oxide" Materials Proceedings 14, no. 1: 26. https://doi.org/10.3390/IOCN2023-14542