1. Introduction
The crystal structure of zinc aluminate is known as the spinel structure, which is a type of face-centred cubic (FCC) crystal lattice. The structure of zinc aluminate consists of tetrahedral spaces occupied by divalent ions and octahedral spaces occupied by trivalent ions, respectively, in a face-cantered cubic arrangement. The ratio of tetrahedral to octahedral sites is 1:2 in spinel structures, resulting in a chemical formula of ZnAl2O4. The tetrahedral sites in zinc aluminate are neighboured by four O2 ions, while the octahedral sites are neared by six O2 ions. The cations in the structure are arranged in such a manner that creates a 3D network of shared edges and corners, resulting in a high degree of structural stability. The spinel structure of zinc aluminate is characterized by a high degree of symmetry, with a cubic unit cell and lattice constant of approximately 8.1 Å. The crystal structure of zinc aluminate is similar to other spinel compounds, such as magnesium aluminate (MgAl2O4) and iron aluminate (FeAl2O4), which have the same crystal structure but different cation compositions.
The spinel structure of zinc aluminate is important for its properties and applications, such as its excellent thermal stability, high melting point, and electrical properties. The structure also plays a key role in determining the material’s behaviour in different environments, making it an important consideration in various fields of science and engineering [
1]. Copper Cu
2+- and Magnesium Mg
2+-doped zinc aluminate have a spinel crystal structure, with copper ions (Cu
2+) and magnesium ions (Mg
2+) substituted for some of the zinc ions (Zn
2+) in the lattice. The material’s dielectric behavior, such as its dielectric constant and tangent loss, can be affected by exact doping levels of copper and magnesium, which are important for electronic applications [
2]. The material’s high thermal stability and resistance to moisture and humidity also make it suitable for use in harsh environments [
3]. There are several methods to synthesize Zinc Aluminate nanoparticles, including the mixed oxide method, citrate-nitrate method, hydrothermal synthesis, and combustion methods. Among all, combustion technique is one of the most efficient routes and human-friendly methods to develop spinel oxide materials in a short span of time while utilizing less energy.
Here, we report the synthesis of Cu2+- and Mg2+-doped ZA through the sol–gel method. The ongoing study aims to scrutinize the effect of Cu2+ and Mg2+ ions on the structural and dielectric behavior of ZnAl2O4 with general formula Zn1−xCuxAl2O4 (ZAC) and (ZAM) Zn1−xMgxAl2O4 (x = 0.0, 0.1). The ionic radius of Cu2+ and Mg2+ are 0.73 Å and 0.72 Å, respectively. Therefore, they can displace Zn2+ (0.74 Å) without the deformation of the spinel cubic structure and, hence, maintain a monophase. Thus, the current study gives an insight on various properties like the optical and dielectric properties of the synthesized samples.
2. Materials and Methods
For synthesis of zinc aluminate ZA, ZAC, and ZAM through combustion method, zinc nitrate hexahydrate Zn (NO3)2·6H2O (Loba chem), aluminium nitrate nonahydrate Al (NO3)2·9H2O, (Loba Chem), cupric nitrate trihydrate Cu (NO3)2·3H2O (Loba chem), magnesium nitrate hexahydrate Mg (NO3)2·6H2O (Loba chem), citric acid monohydrate (C6H8O7·H2O), distilled water H2O, and ammonia solution were used as precursors. The metal nitrates were weighed according to their stoichiometric ratios and dissolved in distilled water, which was used as a solvent to form a precursor solution, followed by addition of fuel or chelating agent such as citric acid to the precursor solution, and it was mixed thoroughly. The ratio of fuel to metal nitrate was taken in 2:1. Ammonia solution was added to the above mixture to sustain pH ≈ 8. The redox mixtures were heated with the help of a magnetic stirrer provided with a hot plate at 100 °C to initiate the combustion reaction, which results in a highly exothermic flame that rapidly heats and evaporates the solvent, burns the fuel, and converts the metal salts into the desired metal oxide product. After the completion of combustion process, the resulting products were collected and dried to remove any remaining solvent or fuel. The powders were then calcined at high temperature, typically 800 °C, to remove any residual carbon and to promote crystallization. The physical and electrical characterizations were carried out for the sintered powders.
The synthesized aluminates were characterized to determine the phase purity and crystalline structure with the help of X-ray Diffraction technique (XRD: D8 Advance Bruker AXS, Germany). The study on vibrational modes and identification of functional groups in the prepared aluminates in the range of 400–4000 cm−1 was done using Fourier-transform infrared (FTIR-SHIMADZU) spectra. The energy band gap was estimated using UV–Vis spectrophotometer (SHIMADZU, UV 3600 PLUS, JAPAN). The stoichiometry analysis was conducted using Scanning Electron Microscope (SEM with EDX) (Model: TESCAN VEGA3 XMU). The dielectric performance was explored using an Impedance analyzer (Hioki IM3570). For Dielectric studies, the powder samples were mixed with PVA binder (5%) before being pressed into pellets at the desired pressure using the 13-mm pelletizer. The pellets were well-polished to obtain a smooth surface and further sintered at 1000 °C for 5 h.
3. Results and Discussion
3.1. P-XRD Analysis
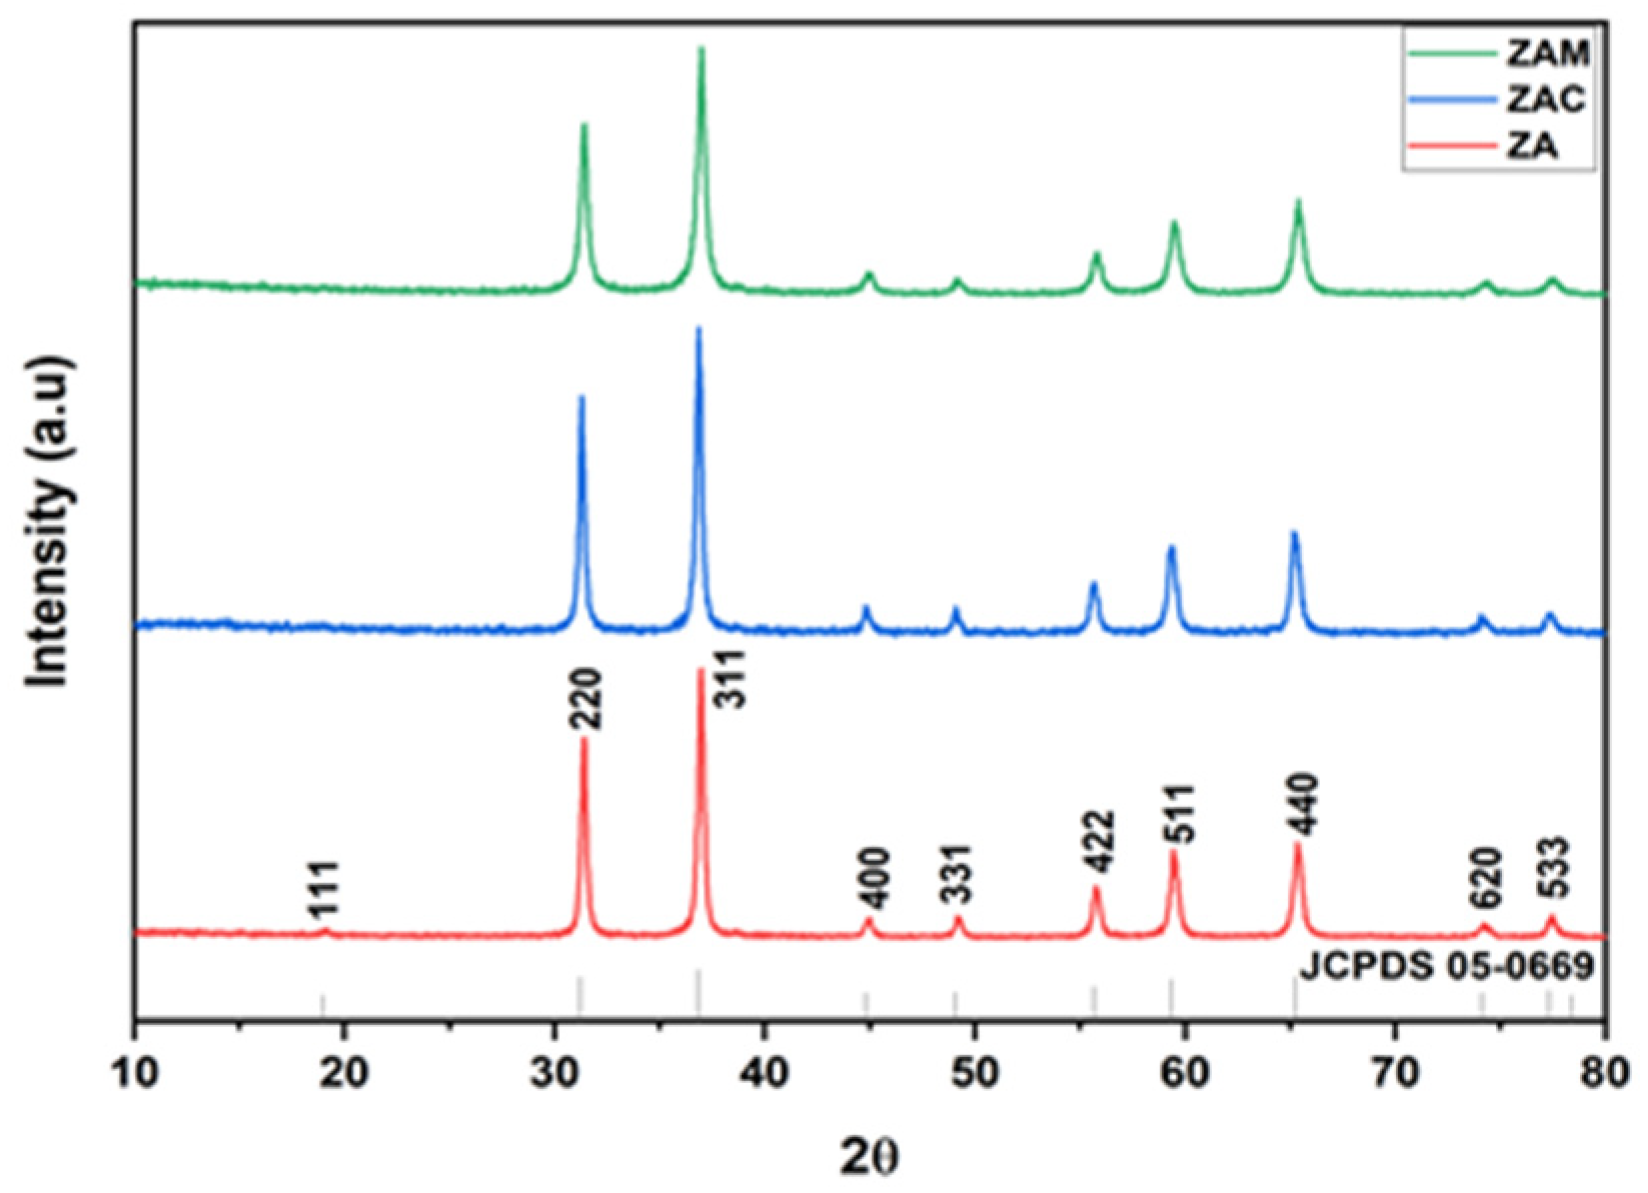
The identification of crystalline phases, structural defects or impurities, and phase purity present in the prepared aluminates was monitored by the powder X-ray diffraction (PXRD) method.
Figure 1 depicts the XRD spectrum of ZnAl
2O
4 (ZA), Zn
0.9Cu
0.1Al
2O
4 (ZAC), and Zn
0.9Mg
0.1Al
2O
4 (ZAM) synthesized by employing a sol–gel-based combustion route. The observed pattern with planes (111), (2 2 0), (3 1 1), (4 0 0), (331), (4 2 2), (5 1 1), (4 4 0), (620), and (533), which is in accordance with JCPDS Card No. 05-0669 [
4]. It is evident that the spinel structure of undoped zinc aluminates, as well as Cu- and Mg-doped zinc aluminates, were not distorted by the inclusion of the small number of dopants. The crystallite size is calculated using Scherer’s equation.
From the above equation, “D” denotes the crystallite size, “k” is the shape factor with a value of 0.9 (constant), “λ” is the wave-length source of Cu–Kα, which takes the value 1.5405 Å, and the Full-Width Half Maxima (FWHM) of the diffracted peaks is denoted by β.
Table 1 represents the calculated parameters from the XRD spectrum. The crystalline size was measured by using the Debye Scherrer’s formula, and the evaluated size was determined to be in the range of 21–24 nm. We can observe that the zinc aluminate particles indicated an increase in average crystallite size for Cu
2+ and Mg
2+ samples when compared to the mother sample [
5].
3.2. Functional Group Analysis
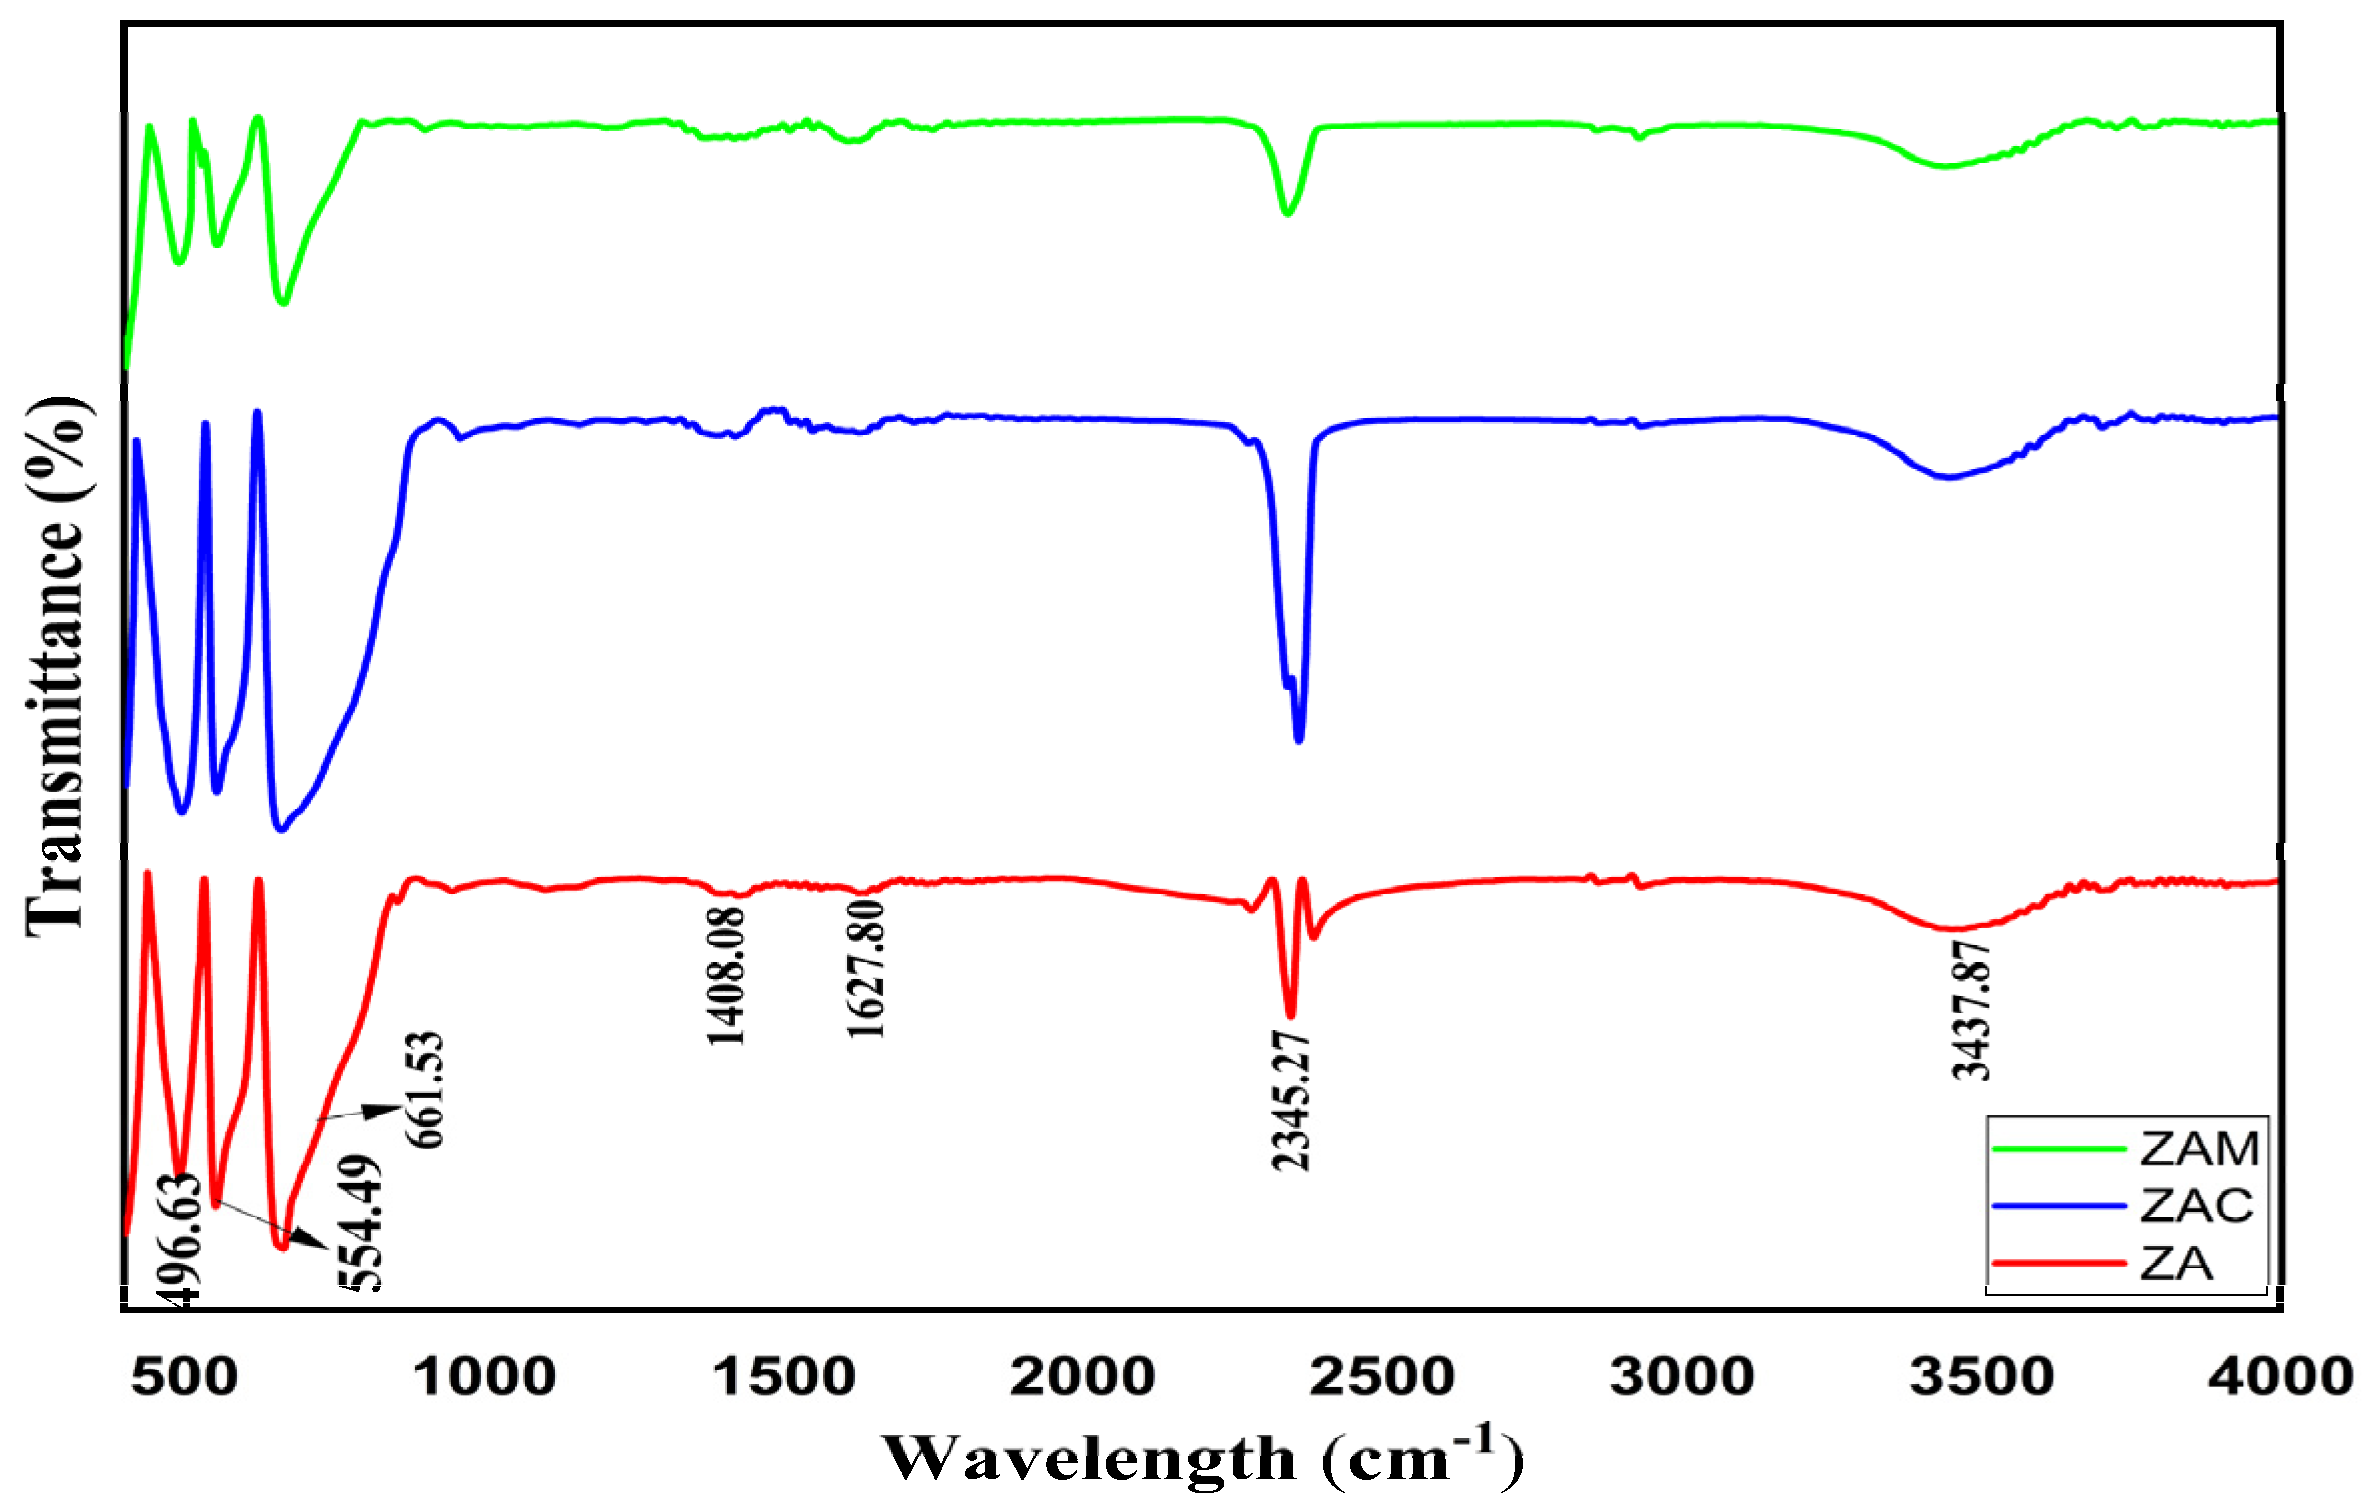
Figure 2 depicts the FTIR spectra of synthesized powders of ZnAl
2O
4 (ZA), Zn
0.9Cu
0.1Al
2O
4 (ZAC), and Zn
0.9Mg
0.1Al
2O
4 (ZAM). The peak around 600–700 cm
−1 can be assigned to vibrational stretching of aluminium–oxygen (Al–O) at the octahedral site. Meanwhile, the peak around 400–500 cm
−1 can be assigned to vibrational stretching of zinc–oxygen (Zn–O) at the tetrahedral site. The sharp nature of the bands defines the porosity of the synthesized samples. The presence of bands at 2354.27 cm
−1 is due to CO
2 absorbed from air. The absorption of the H
2O molecule on the surface is characterized by the presence of the -OH stretching band at 3437.87 cm
−1. The bands at 1627 cm
−1 represent symmetric stretching. At 1408 cm
−1, this can be attributed to asymmetric stretching of C–H [
5,
6].
3.3. EDAX Analysis
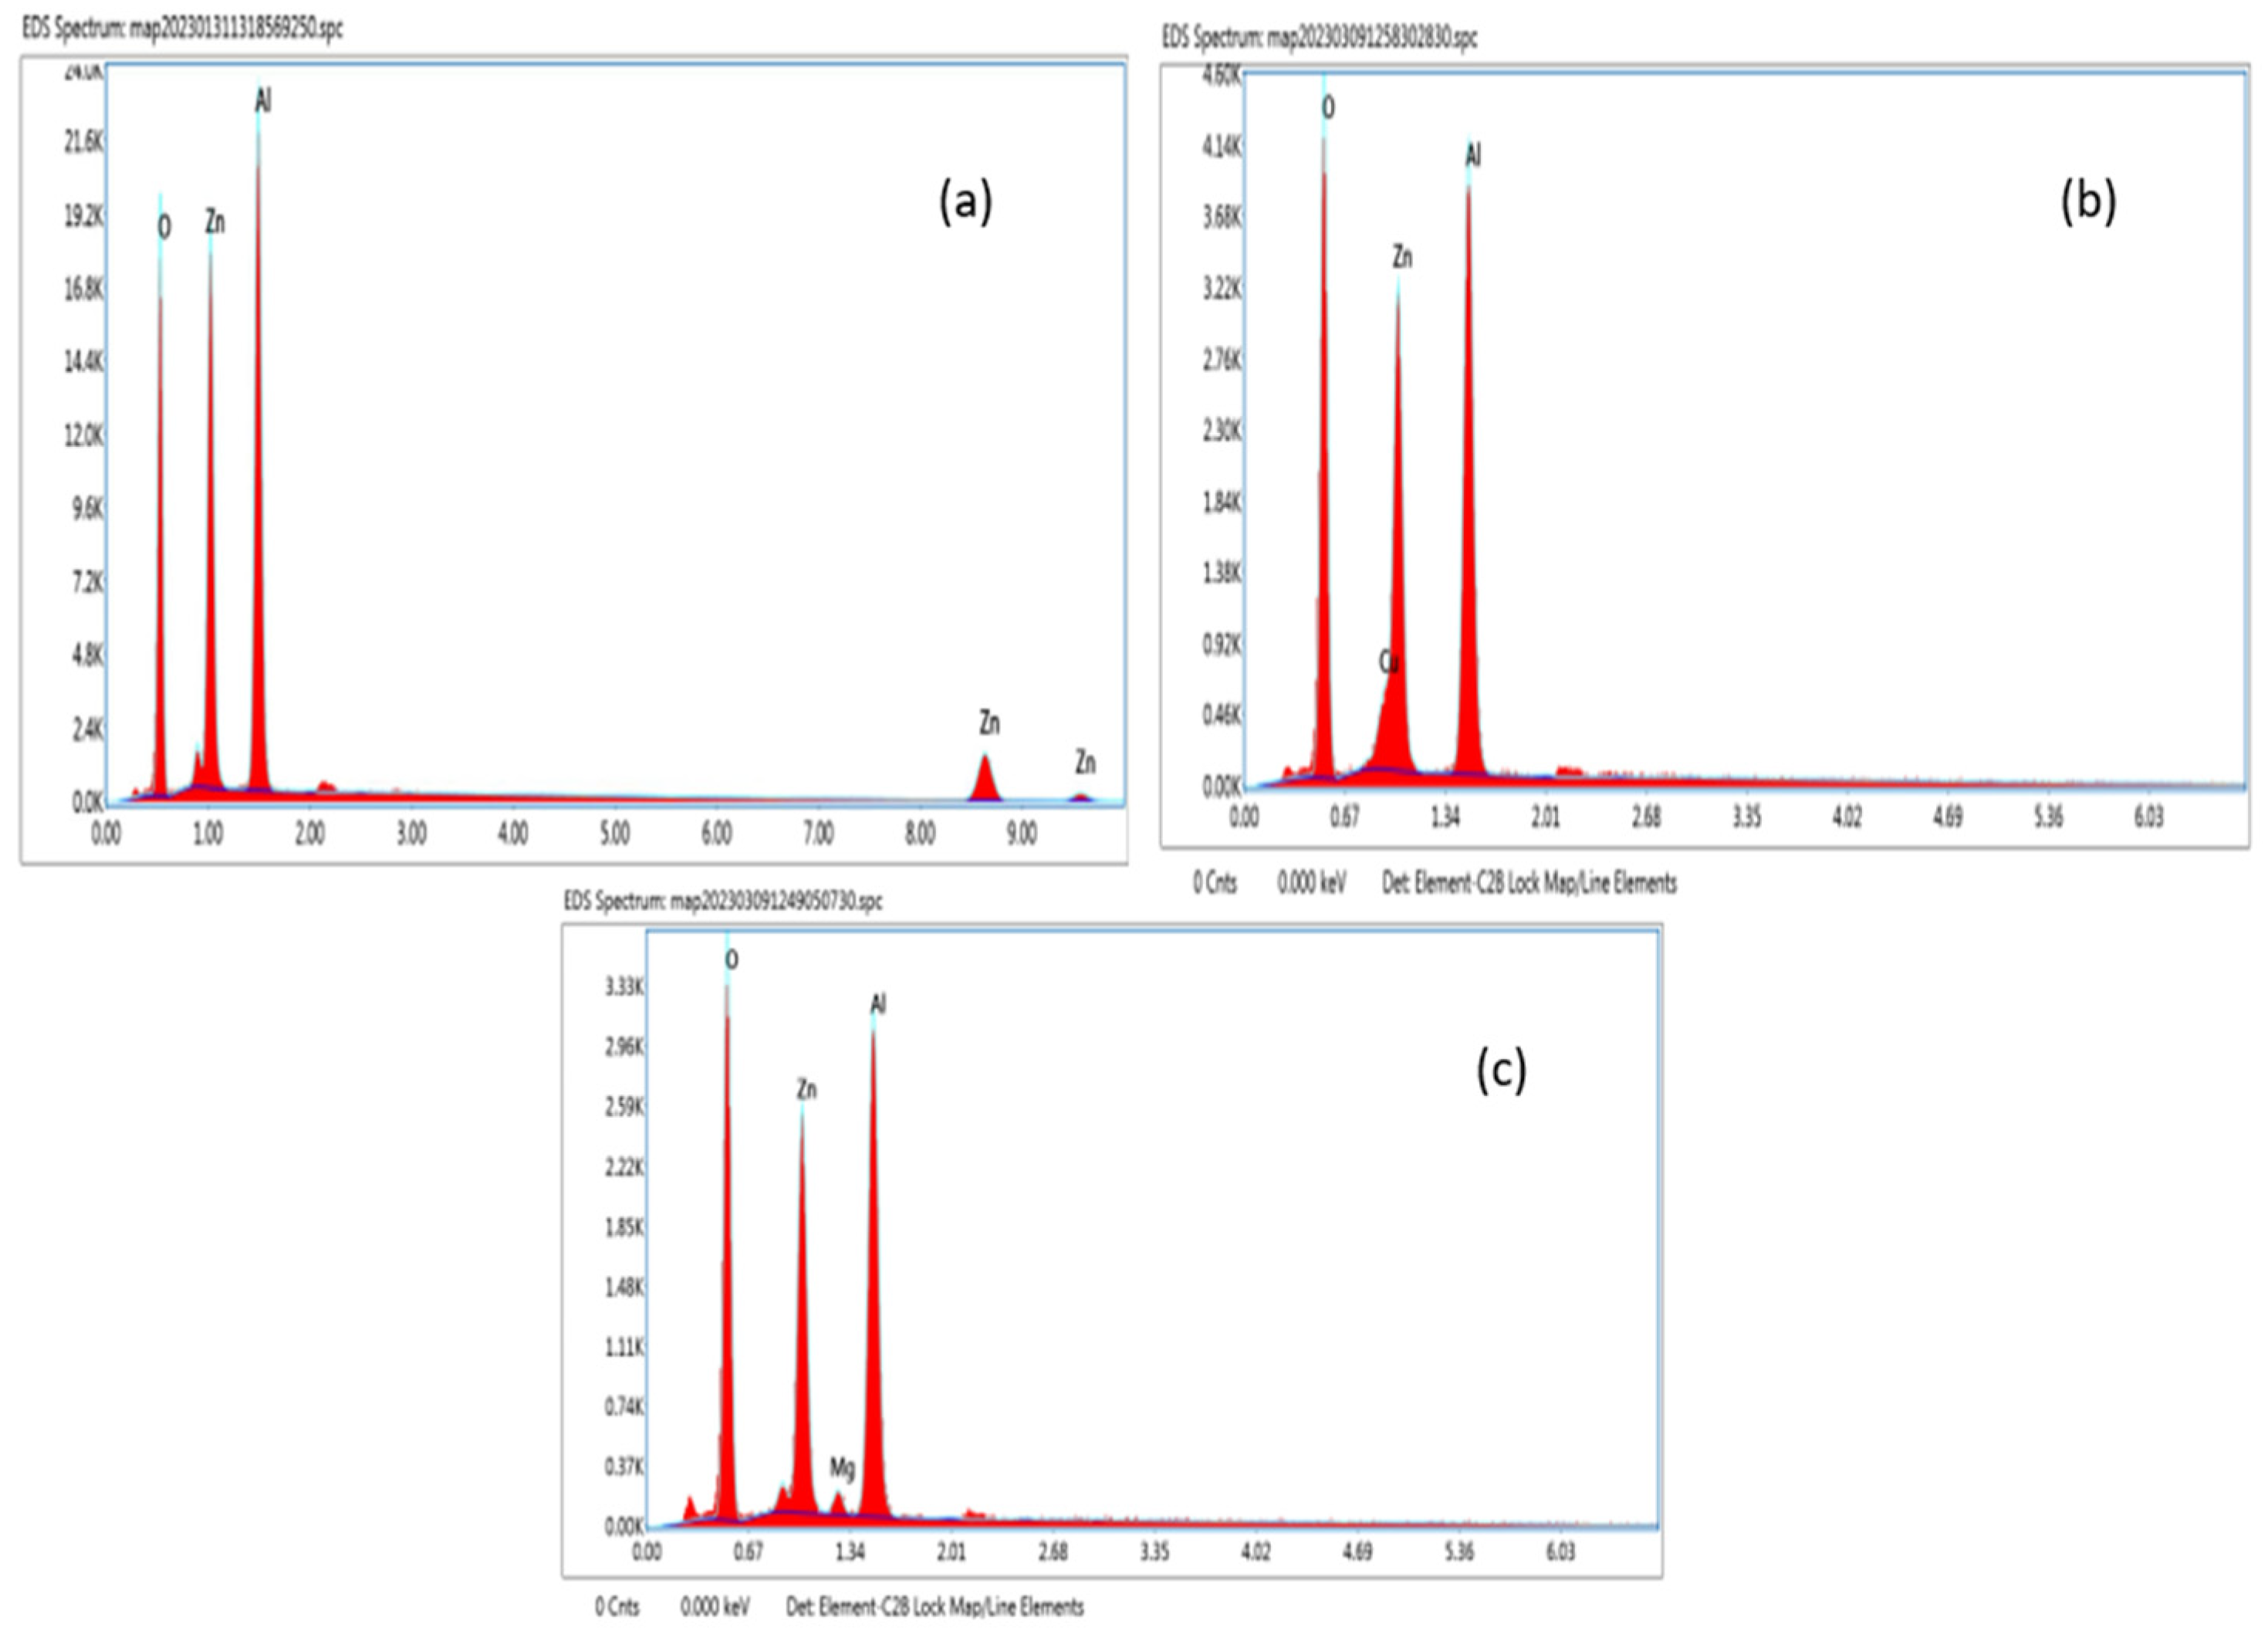
Energy Dispersive X-ray Analysis (EDAX) is a powerful technique that is commonly employed for the determination of the stoichiometric composition of a material. From
Figure 3a–c, the EDAX analysis shows peaks that correspond to Zinc (Zn), Aluminium (Al), Copper (Cu), Magnesium (Mg), and Oxygen(O) and shows the existence of all the ions present in the ZA, ZAC, and ZAM compounds. Thus, it was confirmed that there were no other impurities.
The percentages of each element of ZA, ZAC, and ZAM are obtained from the energy dispersive X-ray spectrum.
3.4. UV–DRS Analysis
The optical property of ZA, ZAC, and ZAM particles in DRS mode and the spectrum was recorded by measuring the absorption of light in the 200–800 nm wave-length range. The energy gap of semiconducting materials is usually estimated using the equation
where
α is the absorption coefficient,
h is the planks constant,
ν is the frequency of the incident light,
Eg the energy band gap, and
A is the constant that depends on the optical properties of the synthesized compound. The above relation can be modified as
.
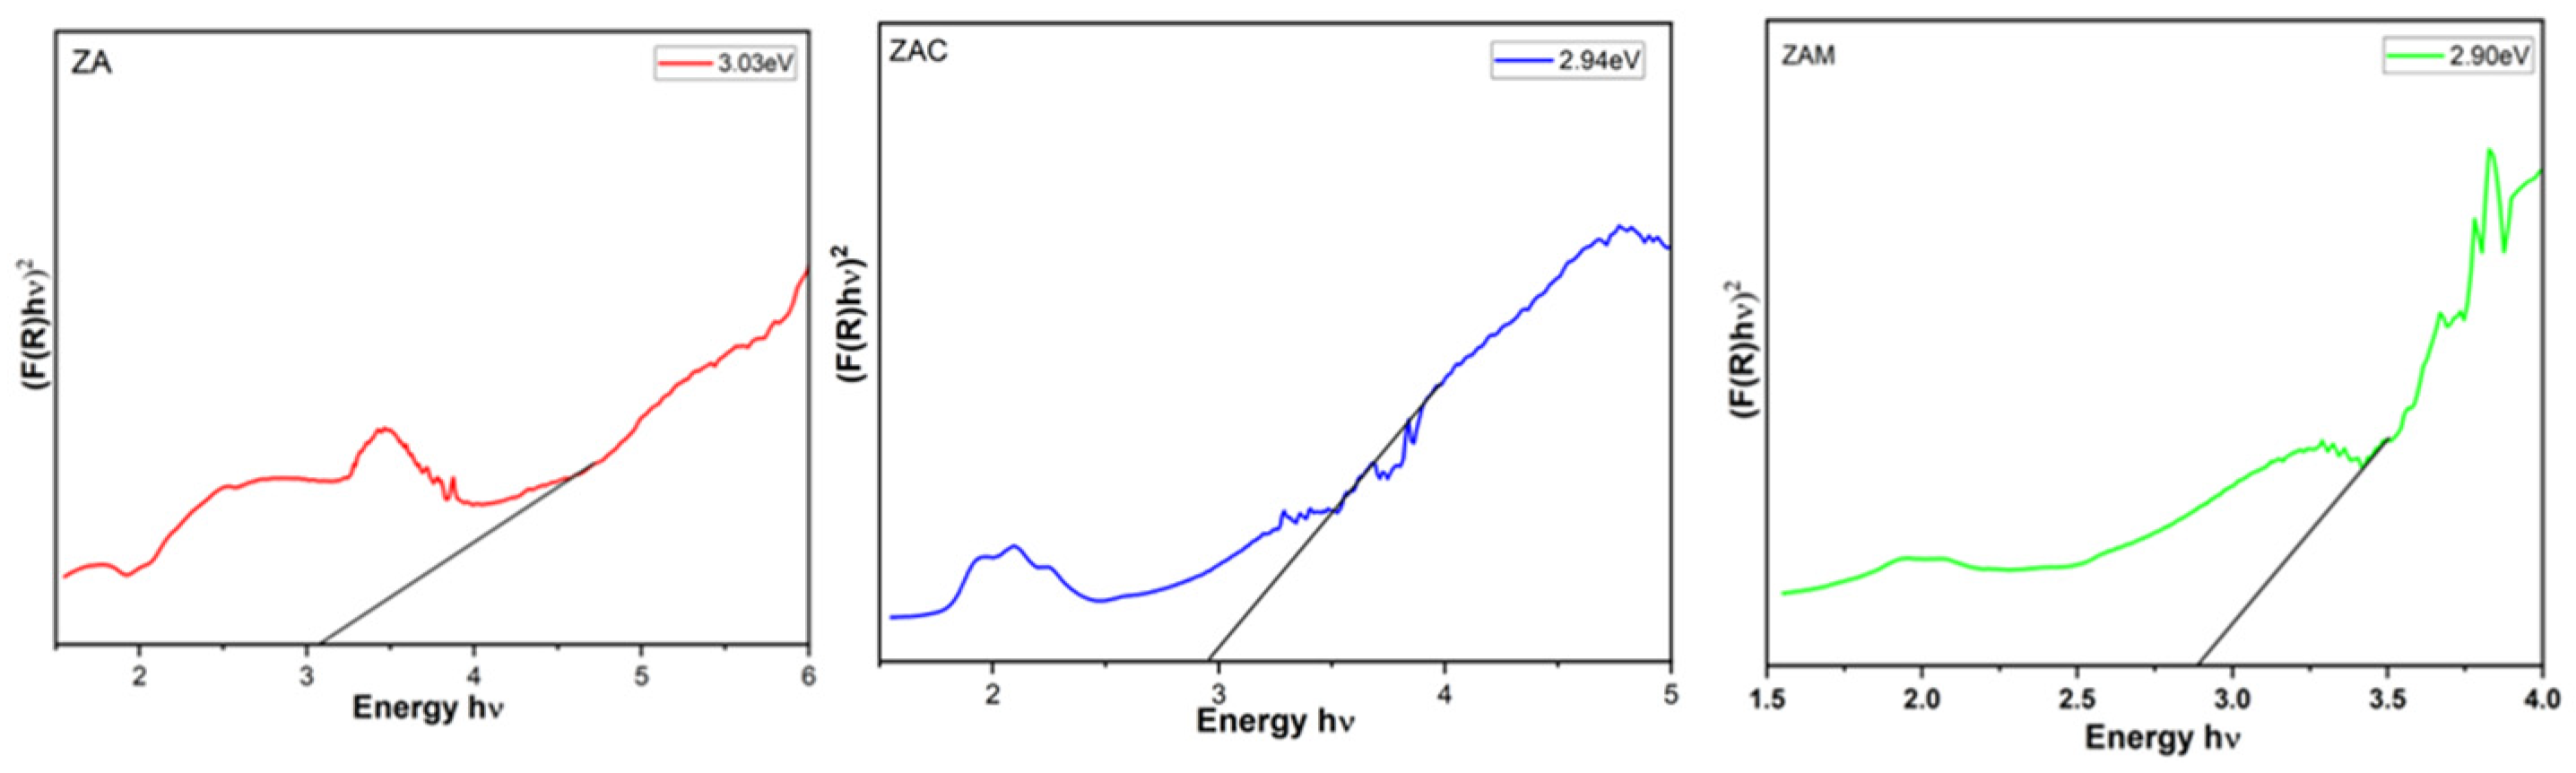
From
Figure 4, by plotting (F(R)hν)
2 against hν and bringing the straight-line region of the curve to the x-axis (αhν)
2 = 0, the energy gap of the material can be calculated as shown in the figure. The optical band gap value is evaluated to be 3.03 eV, 2.94 eV, and 2.90 eV for ZA, ZAC, and ZAM samples obtained from the Kubelka–Munk plot. We observed a decrement in band gap decreases, which occurs due to various factors like doping with impurities, defects in the crystal structure, or changes in the stoichiometry of the material. The figure indicated a redshift, which indicates the quantum confinement effect due to a reduction in the size of zinc aluminate particles [
7]. Therefore, understanding the causes of decrement in the optical band gap is essential for exploring the electrical properties, as well as the optical behavior of the material for specific applications.
3.5. Dielectric and Electric Modulus Measurements
3.5.1. Dielectric Constant and Tangent Loss
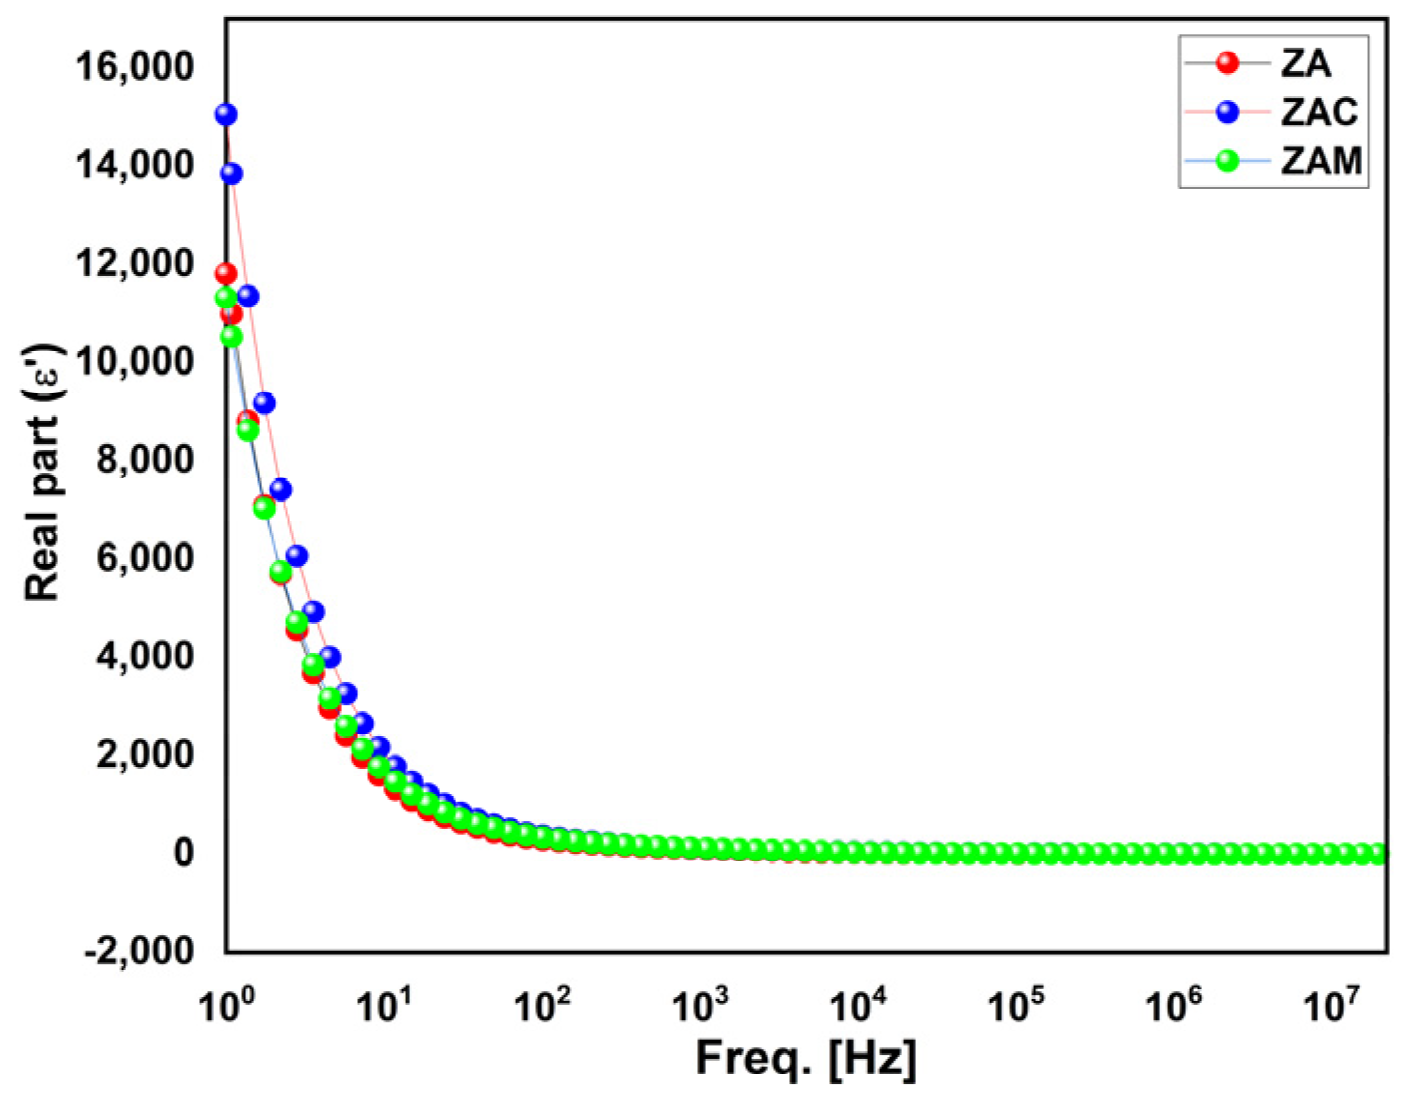
The spinel-aluminate’s dielectric properties rely mostly upon several factors like the stoichiometry composition of the compound, applied electric field, preparation methods, the temperature, etc. This study aims to explore the dielectric performance of zinc aluminate samples, which is measured at room temperature at a frequency range of 10 Hz to 20 MHz. The value of the dielectric constant (ε′) can be estimated by using the following relation.
where C denotes the capacitance of the capacitor filled with the material, d denotes the pellet thickness, A denotes the cross-sectional area of the calcined pellet. The permittivity of free space is given by
o at a given frequency. The frequency Vs dielectric constant
is shown in
Figure 5.
The dielectric constant for Cu- and Mg-doped ZA particles depend on the electric filed applied, as well as the amount and distribution of copper and magnesium ions in the material. From
Figure 5, it can be visualized that, at the low-frequency regime, the
is high, while it is low at a higher-frequency regime, which may be correlated with the Maxwell–Wagner (M–W) model; this is in accordance with Koop’s theory [
8]. In general, the Cu- and Mg-doped ZA increases with an increasing frequency due to the polarization of the material at high frequencies. In addition, from
Figure 5, it is quite clear that in the high-frequency portion, the value of the dielectric constant increased for Mg-doped ZA particles but was found to be decreased for Cu-doped ZA particles. Overall, the dielectric constant of Cu- and Mg-doped ZA particles can vary based on the concentration of the dopant, specific synthesis methods, and processing conditions used.
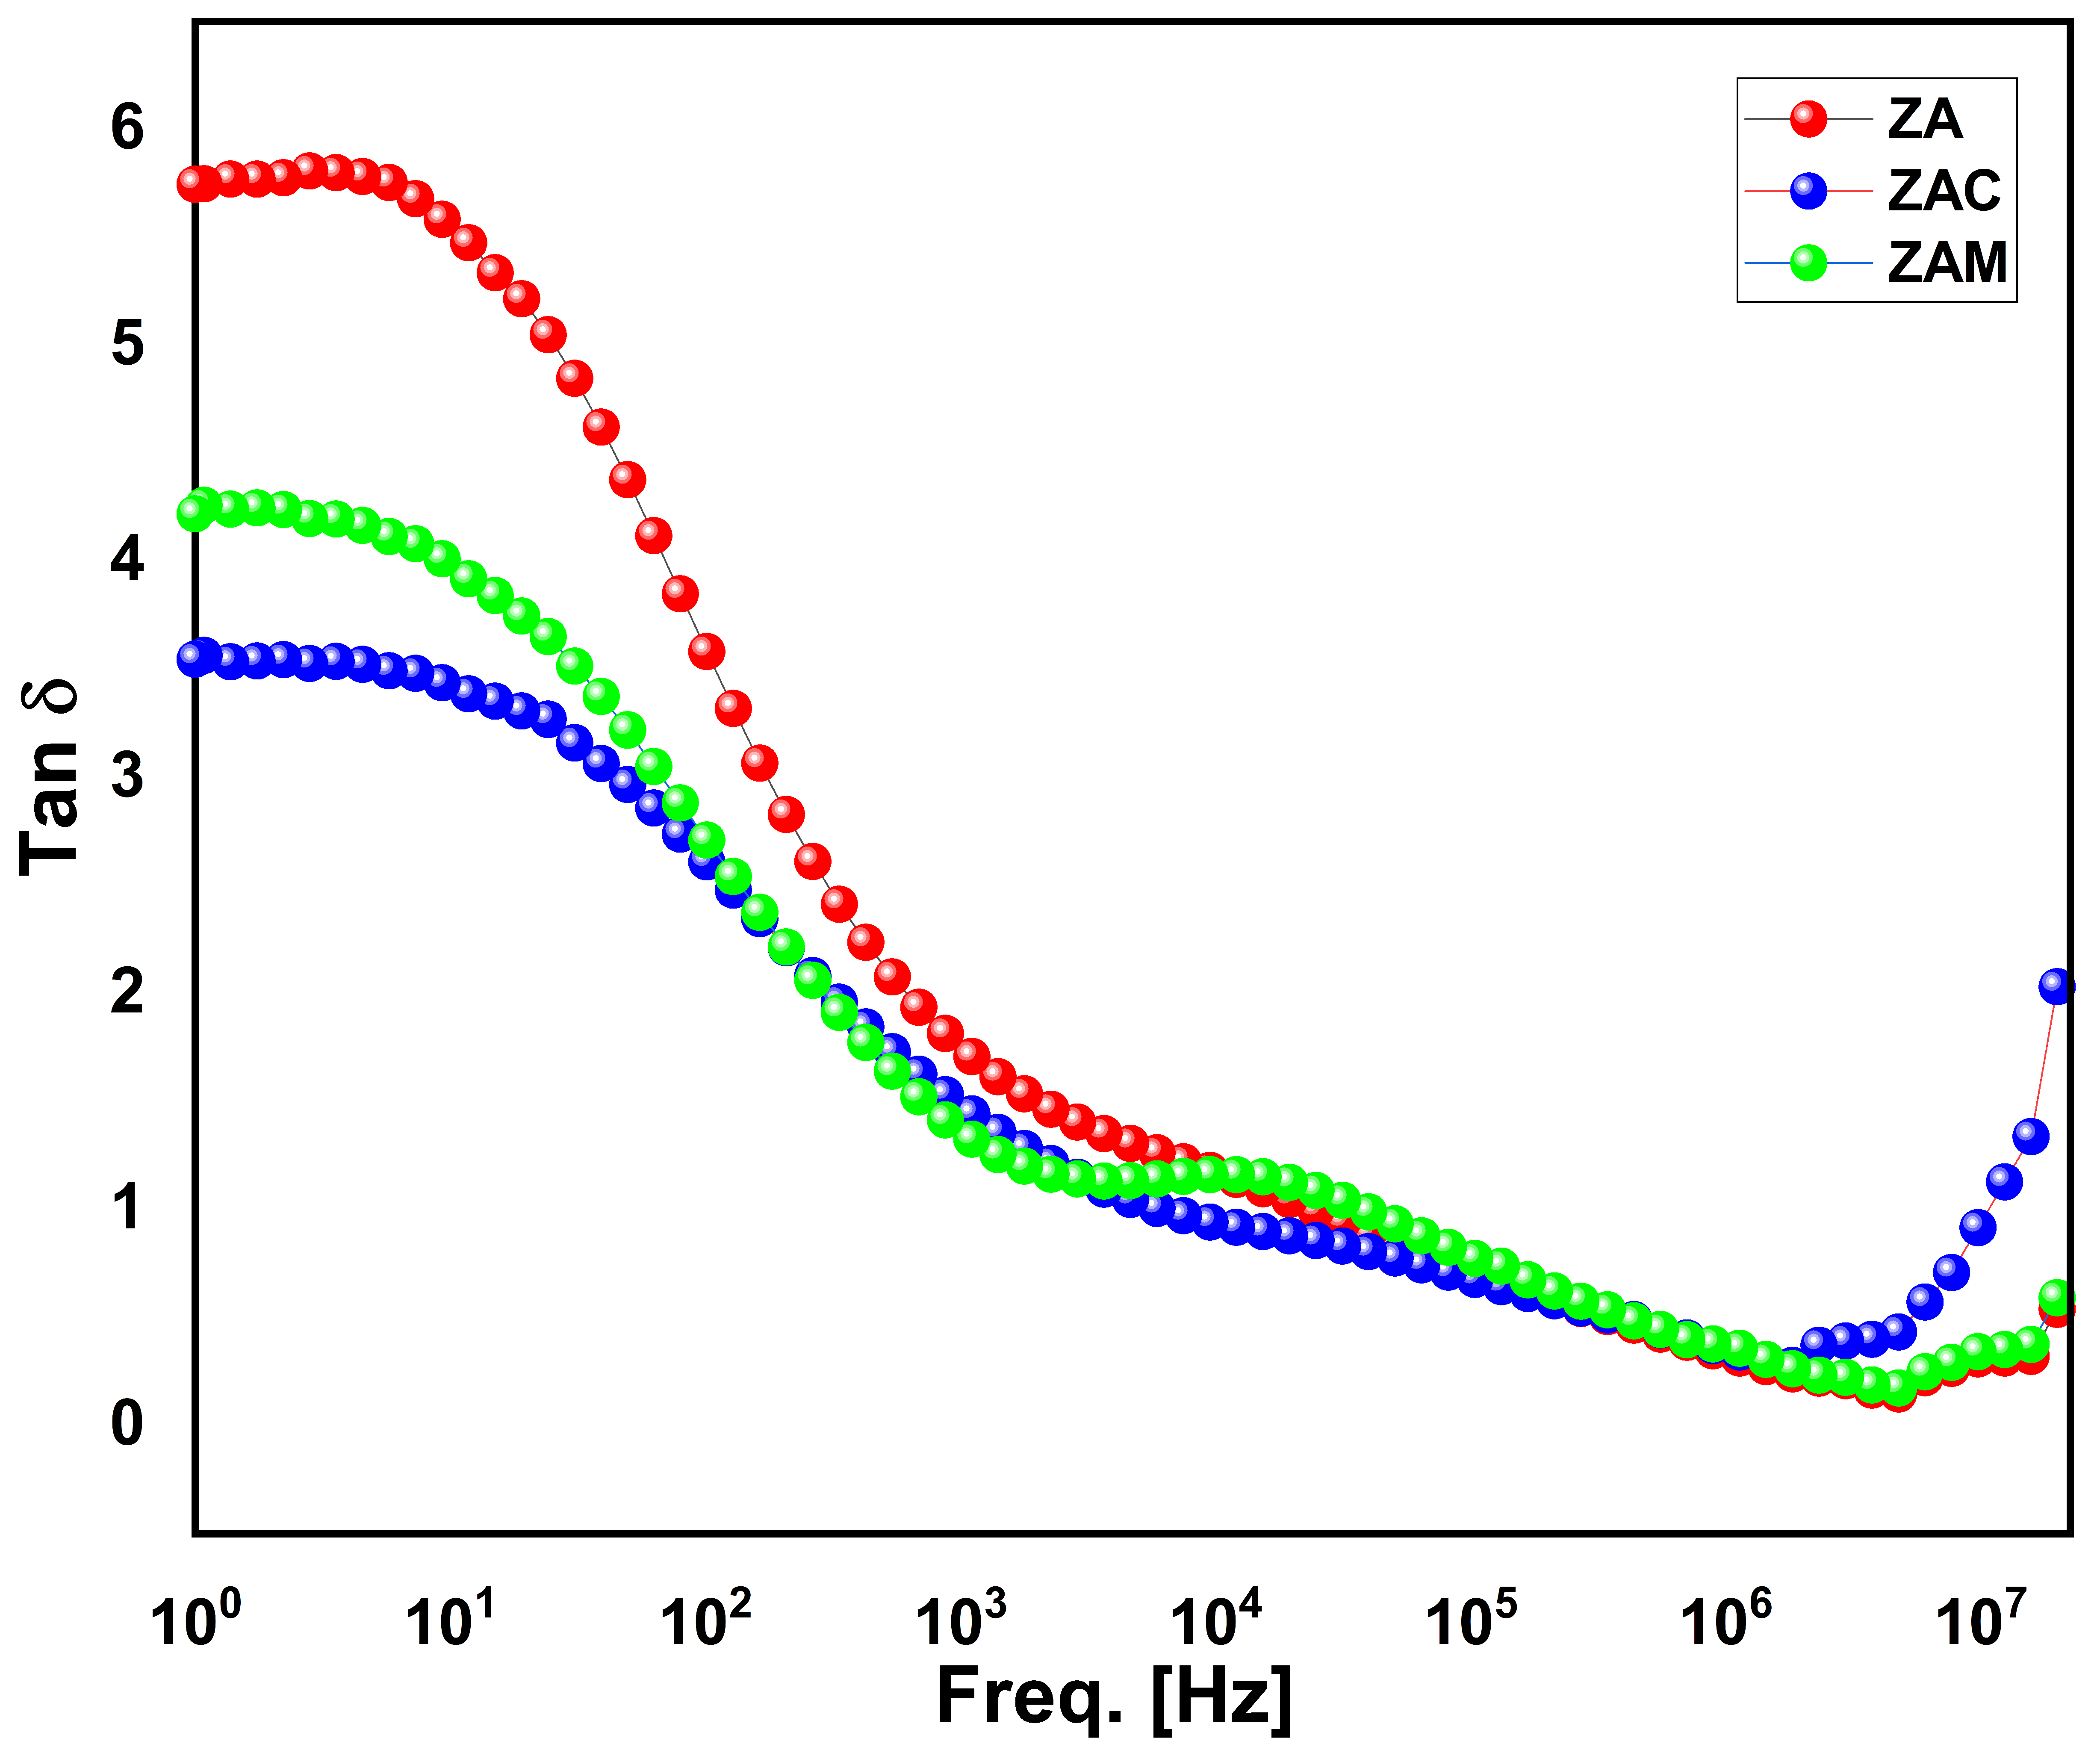
Figure 6 shows the room temperature measurement of the tangent loss (tanδ) of zinc aluminate particles. The presence of relaxation peaks in the mid-frequency regime with a decline in the loss tangent in lower- and higher-frequency regions was noticed. The decrement in tangent loss (tanδ) can be related to Koop’s theory, which suggests that at a lower-frequency region, the loss is high, and it declines as the frequency increases. A similar behavior was obtained for all the zinc aluminate samples. The relaxation peak observed for the ZAM sample at the mid-frequency region is because of the formation of additional defect states within the energy gap, which can increase the energy dissipation in the material or space charge polarization effect [
8]. From
Figure 6, it can be seen that at a higher frequency, the loss tangent δ for both Cu- and Mg-doped ZA particles increases slightly from pure ZA at a higher-frequency region. Therefore, from the obtained dielectric parameters, the combination of the high dielectric constant and minimum loss makes them suitable for their use in high-voltage ceramic capacitors and microwave devices. Hence, a careful selection of the dopant concentration makes it a potential candidate for several applications.
3.5.2. Cole–Cole Plot
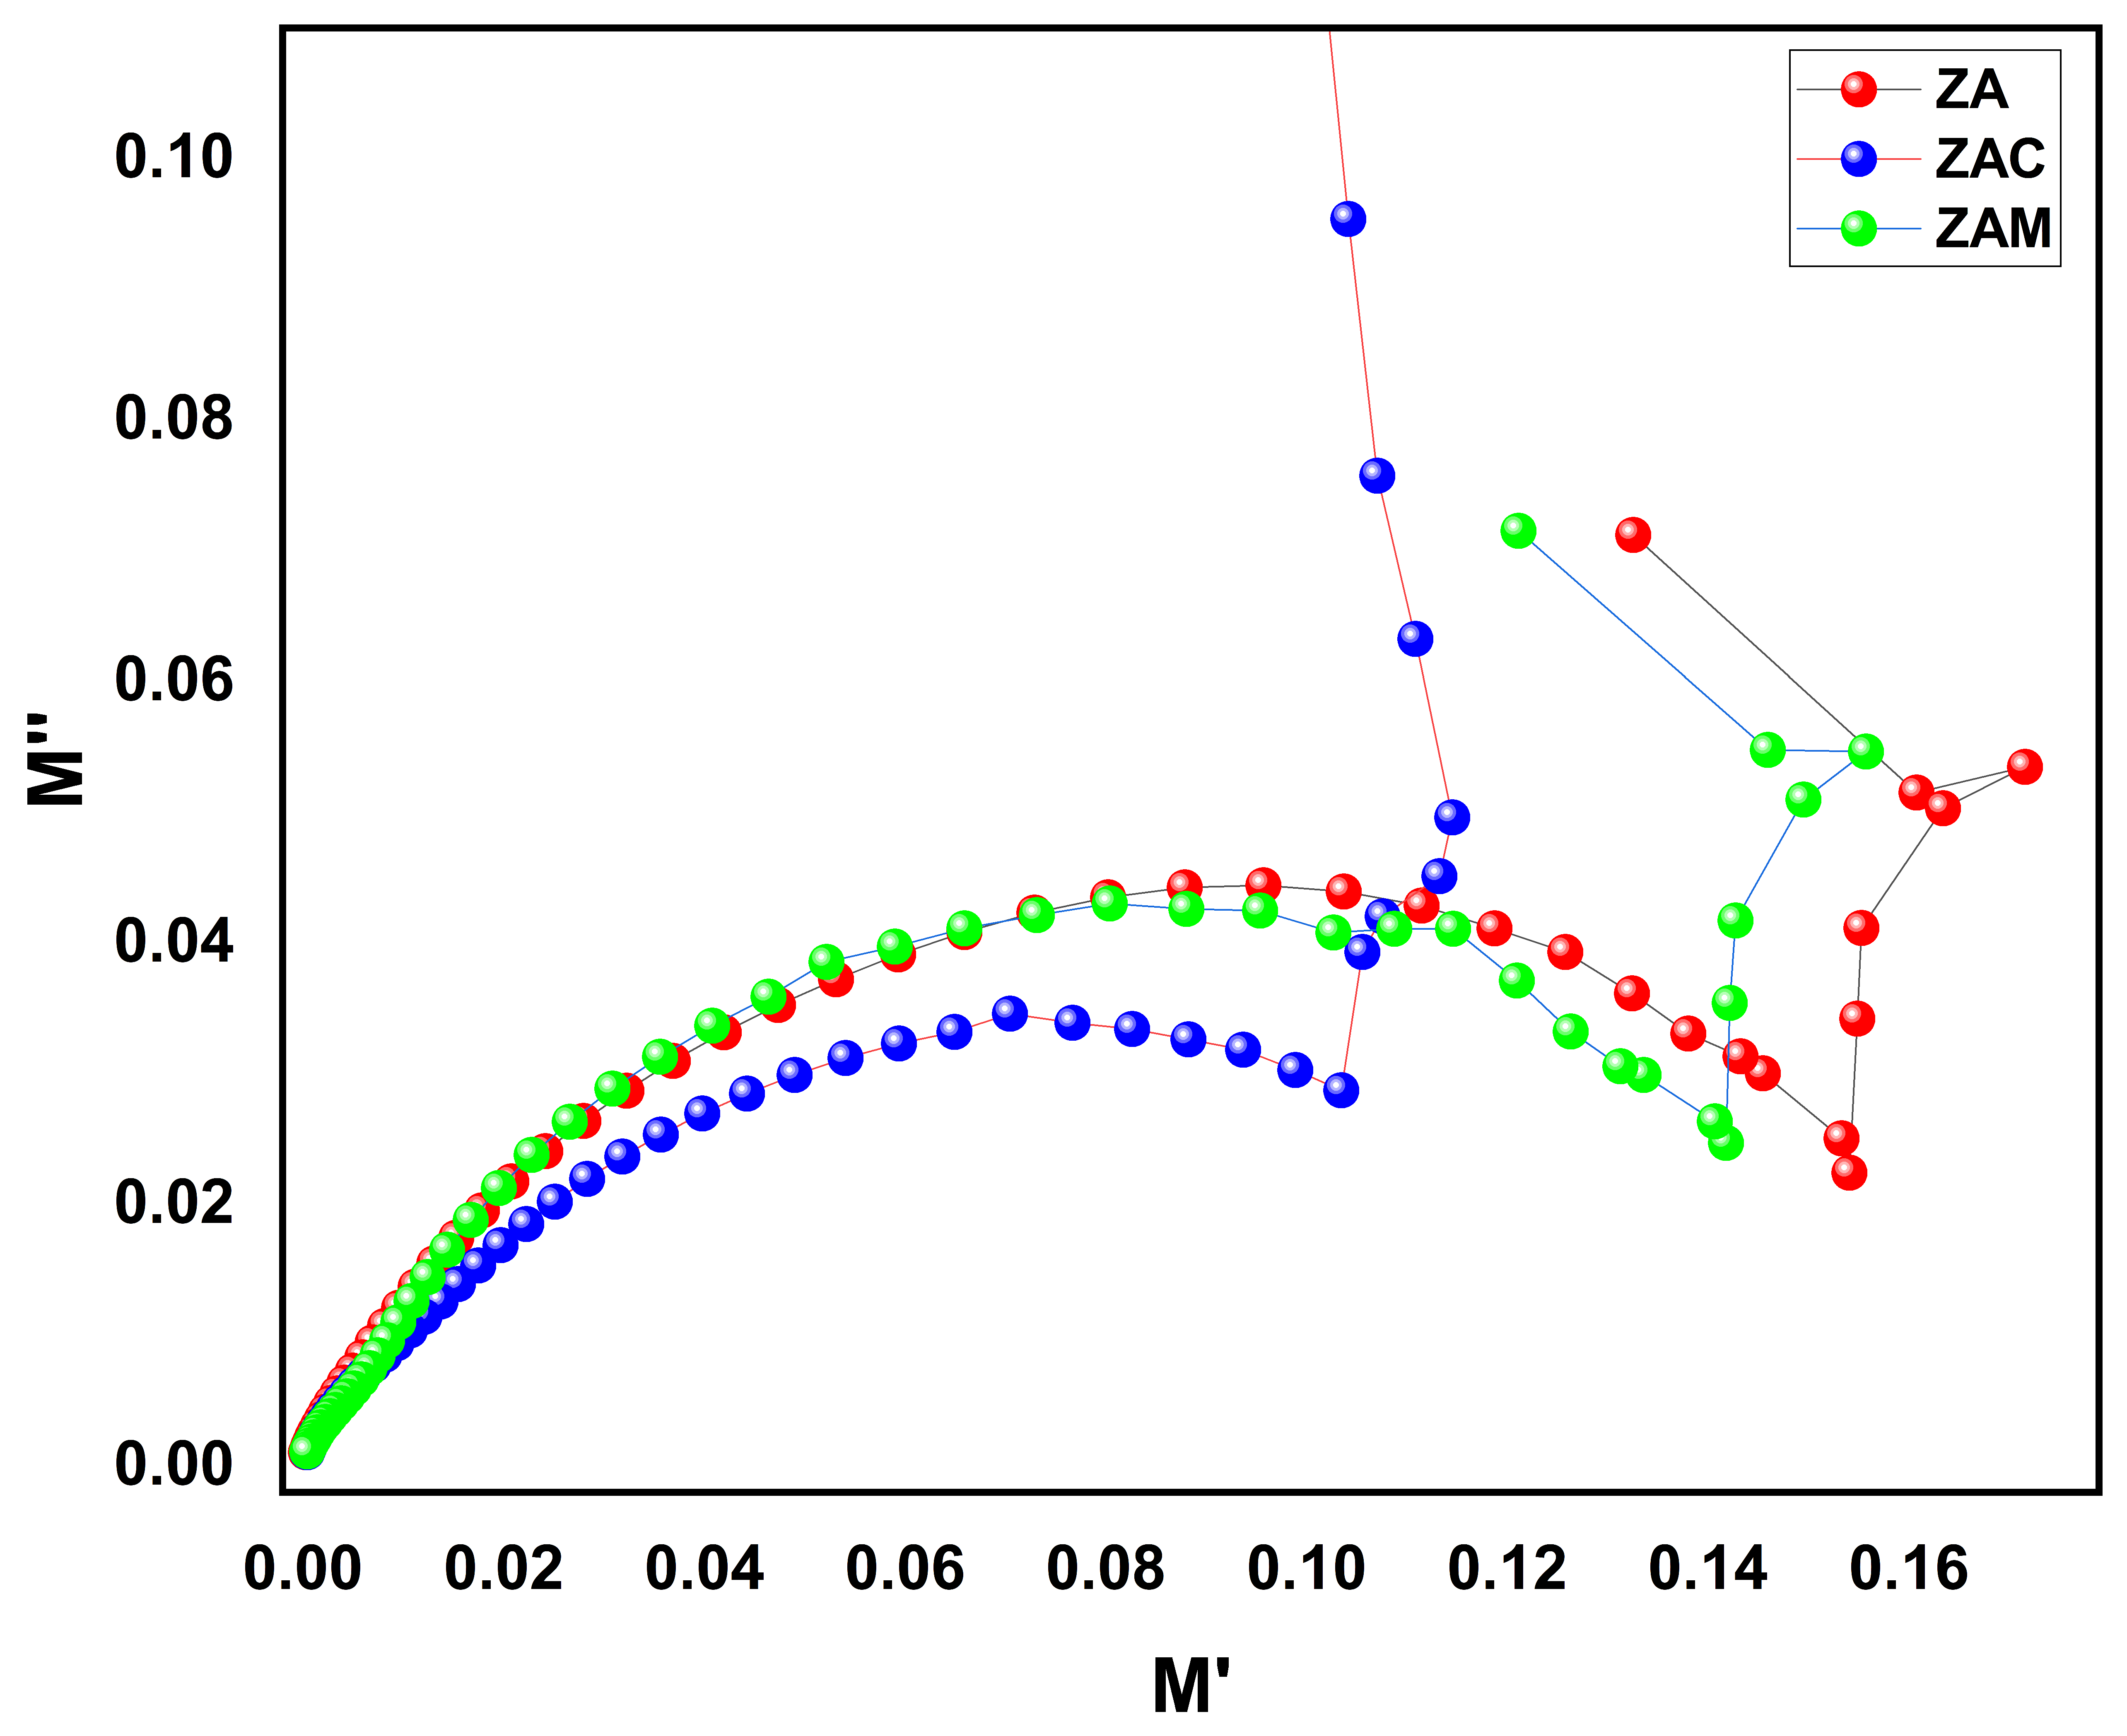
Figure 7 shows the Cole–Cole plotted between the real and imaginary part of the electric modulus at different frequencies. The Cole–Cole plot provides information about the electrical properties of the material clearly, as well as the dielectric relaxation behavior of the material, such as the presence of multiple relaxation processes. The Cole–Cole plot can provide insight into the nature of the electrical nature of the material based on the shape obtained. It can be seen that all the samples exhibit a half semicircle, a depressed semicircle, and an arc attached to the semicircle. The centers of all the samples were lying below the real axis, which denotes the presence of non-Debye type relaxation behavior in zinc aluminate samples. The presence of semicircles followed by an arc indicates the material has multiple relaxation mechanisms. The figure shows the measured Cole–Cole plots under different frequencies, which exhibit a partial semicircle and a depressed semicircle, followed by an inclined straight line [
9]. The presence of the half semi-circle and depressed circle at a lower frequency regime corresponds to the presence of the capacitive behavior and resistive behavior in the higher-frequency regime, while the arc suggests the presence of a boundary layer or interface between the material and its environment. From the plot, we can infer that the resistance of the grain boundary contribution is larger than the grains for all the samples. The decreases in the diameter of the semicircle, with respect to doping Cu and Mg in the host lattice, denotes a decrease in the samples resistance and increase in the electronic conductivity of the sample. Therefore, by analyzing the shape and position of the Cole–Cole plot, researchers can give valuable information about the material’s electrical properties and how they change with frequency. This information can be used to optimize the material’s performance for specific high-frequency applications like antennas or filters.
4. Conclusions
In conclusion, the replacement effect of Cu2+ and Mg2+ on the structural and optical, as well as the dielectric, parameters of zinc aluminate (ZnAl2O4) was studied and found to be a promising material for low-frequency applications. The XRD of aluminates displayed their single-phase spinel structure, and it was observed that the substitution of Cu and Mg content decreases the lattice parameter (8.09–8.05 nm). In addition, an increase in the crystallite size (21–23 nm) was observed when compared to the parent sample. The transmittance band in the range of 554 cm−1 for the octahedral Oh site and 661 cm−1 for the tetrahedral Td site of aluminates was confirmed by FTIR spectra. The purity and presence of elements in the ZA, ZAC, and ZAM samples were confirmed by the EDAX spectrum. From the optical band gap results, which were estimated by using the Kubelka–Munk function, it was observed that with the substitution of Cu and Mg in the mother sample, a decrement in the band gap value (3.03–2.90 eV) was observed, which in turn indicates a redshift in zinc aluminate samples. Room temperature frequency dependence of the dielectric constant , Cole–Cole plot, and tangent loss (Tanδ) was analyzed for all the samples, and the obtained results were reported. The results showed that Mg doping significantly improves the dielectric properties, making it suitable for high-frequency applications. From the Cole–Cole plot, it was found that both grains and grain boundaries, both contributed in the conduction process. The temperature-dependent dielectric and impedance behavior will be extended in ongoing studies.
Author Contributions
Conceptualization, methodology, software, validation, Y.J., G.P.J. and G.D.; writing—original draft preparation, writing—review and editing, Y.J. and G.D., visualization, G.D.; supervision, G.D. All authors have read and agreed to the published version of the manuscript.
Funding
This research received no external funding.
Institutional Review Board Statement
Not applicable.
Informed Consent Statement
Not applicable.
Data Availability Statement
Not applicable.
Acknowledgments
Author Yasmin J. gratefully acknowledges Anna University, Chennai for providing ACRF Fellowship.
Conflicts of Interest
The authors declare no conflict of interest.
References
- Akika, F.Z.; Benamira, M.; Lahmar, H.; Trari, M.; Avramova, I.; Suzer, S. Structural and optical properties of Cu-doped ZnAl2O4 and its application as photocatalyst for Cr(VI) reduction under sunlight. Surf. Interfaces 2020, 18, 100406. [Google Scholar] [CrossRef]
- Varghese, A.A.; Kuriakose, E.; Jose, J.; Aryal, S.; Khanal, R.; Anila, E.I. Investigations on the electronic properties and effect of chitosan capping on the structural and optical properties of zinc aluminate quantum dots. Appl. Surf. Sci. 2022, 579, 152162. [Google Scholar] [CrossRef]
- Nirmala, T.S.; Iyandurai, N.; Yuvaraj, S.; Sundararajan, M. Third order nonlinear optical behavior and optical limiting properties of Ni2+ ions doped zinc nano-aluminates. Opt. Mater. 2022, 124, 111950. [Google Scholar] [CrossRef]
- Srinatha, N.; Reddy, S.S.; Suriyamurthy, N.; Kumar, K.J.R.; Kumar, M.R.S.; Madhu, A.; Angadi, B. New fuel governed combustion synthesis and improved luminescence in nanocrystalline Cr3+ doped ZnAl2O4 particles. Results Opt. 2022, 8, 100242. [Google Scholar] [CrossRef]
- Navgare, D.L.; Kawade, V.B.; Shaikh, S.F.; Jadhav, S.S.; Tumberphale, U.B.; Khule, R.N.; Mane, R.S.; Gore, S.K. Structure-sensitive magnetic properties of nanocrystalline Co2+-substituted Ni–Zn ferrite aluminates. Ceram. Int. 2021, 47, 26492–26500. [Google Scholar] [CrossRef]
- Chen, P.C.; Ganguly, A.; Kanna Sharma, T.S.; Chou, K.Y.; Chang, S.M.; Hwa, K.Y. Investigation of T site variation in spinel aluminates TAl2O4 (T = Mg, Zn & Cu), and formation of electrocatalyst CuAl2O4/carbon for efficient sensing application. Chemosphere 2022, 301, 134458. [Google Scholar] [PubMed]
- Elakkiya, V.; Agarwal, Y.; Sumathi, S. Photocatalytic activity of divalent ion (copper, zinc and magnesium) doped NiAl2O4. Solid State Sci. 2018, 82, 92–98. [Google Scholar] [CrossRef]
- SathiyaPriya, A.; Geetha, D. Impact of (Zr, Cu) ion substitution on the optical, dielectric and impedance behavior of BiFeO3. Braz. J. Phys 2021, 51, 40–46. [Google Scholar] [CrossRef]
- Priya, A.S.; Geetha, D. Studies on the multiferroic properties and impedance analysis of (La, Cu) BiFeO3 prepared by sol-gel method. Ferroelectrics 2021, 573, 104–116. [Google Scholar] [CrossRef]
| Disclaimer/Publisher’s Note: The statements, opinions and data contained in all publications are solely those of the individual author(s) and contributor(s) and not of MDPI and/or the editor(s). MDPI and/or the editor(s) disclaim responsibility for any injury to people or property resulting from any ideas, methods, instructions or products referred to in the content. |
© 2023 by the authors. Licensee MDPI, Basel, Switzerland. This article is an open access article distributed under the terms and conditions of the Creative Commons Attribution (CC BY) license (https://creativecommons.org/licenses/by/4.0/).


