Proceeding Paper

Design and Implementation of Prepaid Energy Meter with Home Automation and Peak Load Management Using Android Application †

1
Department of Electrical Engineering and Technology, University of Gujrat, Hafiz Hayat Campus, Gujrat 50780, Pakistan
2
Department of Electrical Engineering, University of Management and Technology Lahore, Sialkot Campus, Sialkot 51041, Pakistan
3
Department of Electrical and Electronics Engineering, Glasgow Caledonian University, Glasgow G4 0BA, UK
4
Department of Mechanical Engineering, University of Central Punjab Lahore, Lahore 05499, Pakistan
*
Author to whom correspondence should be addressed.
Presented at the 8th International Electrical Engineering Conference, Karachi, Pakistan, 25–26 August 2023.
Eng. Proc. 2023, 46(1), 23; https://doi.org/10.3390/engproc2023046023
Published: 22 September 2023
(This article belongs to the Proceedings of The 8th International Electrical Engineering Conference)

Abstract

:
This research attempts to develop a smart kit that is compatible with any single-phase energy meter with features like home automation and peak load management. Power values are obtained by measuring current, voltage and power factor on the load side via CT and PT. These power values are sent to suppliers. A program-based algorithm is established to compute power quantities and power factors. This IOT meter measures all these values and uploads them to an online database. Android application is industrialized for user control and for buying credits. At the user end, load terminals are distinguished for peak load management and automatically disconnect the power load.

1. Introduction

For economical and industrial development, electrical energy plays a vital role. Heavy industry, production plants, factories and agriculture need a continuous and cheap supply of electricity. The only way to reduce cost of electricity is if countries use their own resources that are naturally available to them [1]. In Pakistan, there is no load management as all service lines are associated with customer meters that provide no load management [2]. In every single street in Pakistan, open wire connection is very common. Consumers and their meters have nothing to do with each other as they are unable to keep track of their power demand and to monitor how much energy they are consuming. Other than line losses, power theft is also an alarming issue nowadays that should be fixed as soon as possible [3]. In the Engineering field, home automation is one of the innovative concepts, and many engineers are working on this field [4]. The persistence of home automation is to permit the user to keep an eye on their home appliances and also to control them when needed over distance. The other problem of this old-fashioned system is that there is no off-peak and on-peak difference at user end. During peak time, whenever the system is overloaded, supply companies thoroughly shut down the whole feeder line [5]. The other problem is the lack of technology; there is no such producer that can produce smart energy meters at cheap rates [6]. For the solution of this major issue, besides changing the entire network, we should design and develop a smart kit that should work with normal working digital energy meters and should be smart enough to read all power quantities, power factors, demands of the consumer and also monitor peak time [7,8]. This smart kit is capable of reading in real time on installed locations, and when peak time starts, it will automatically turn OFF the power load. So, that lighting load will remain connected [9].

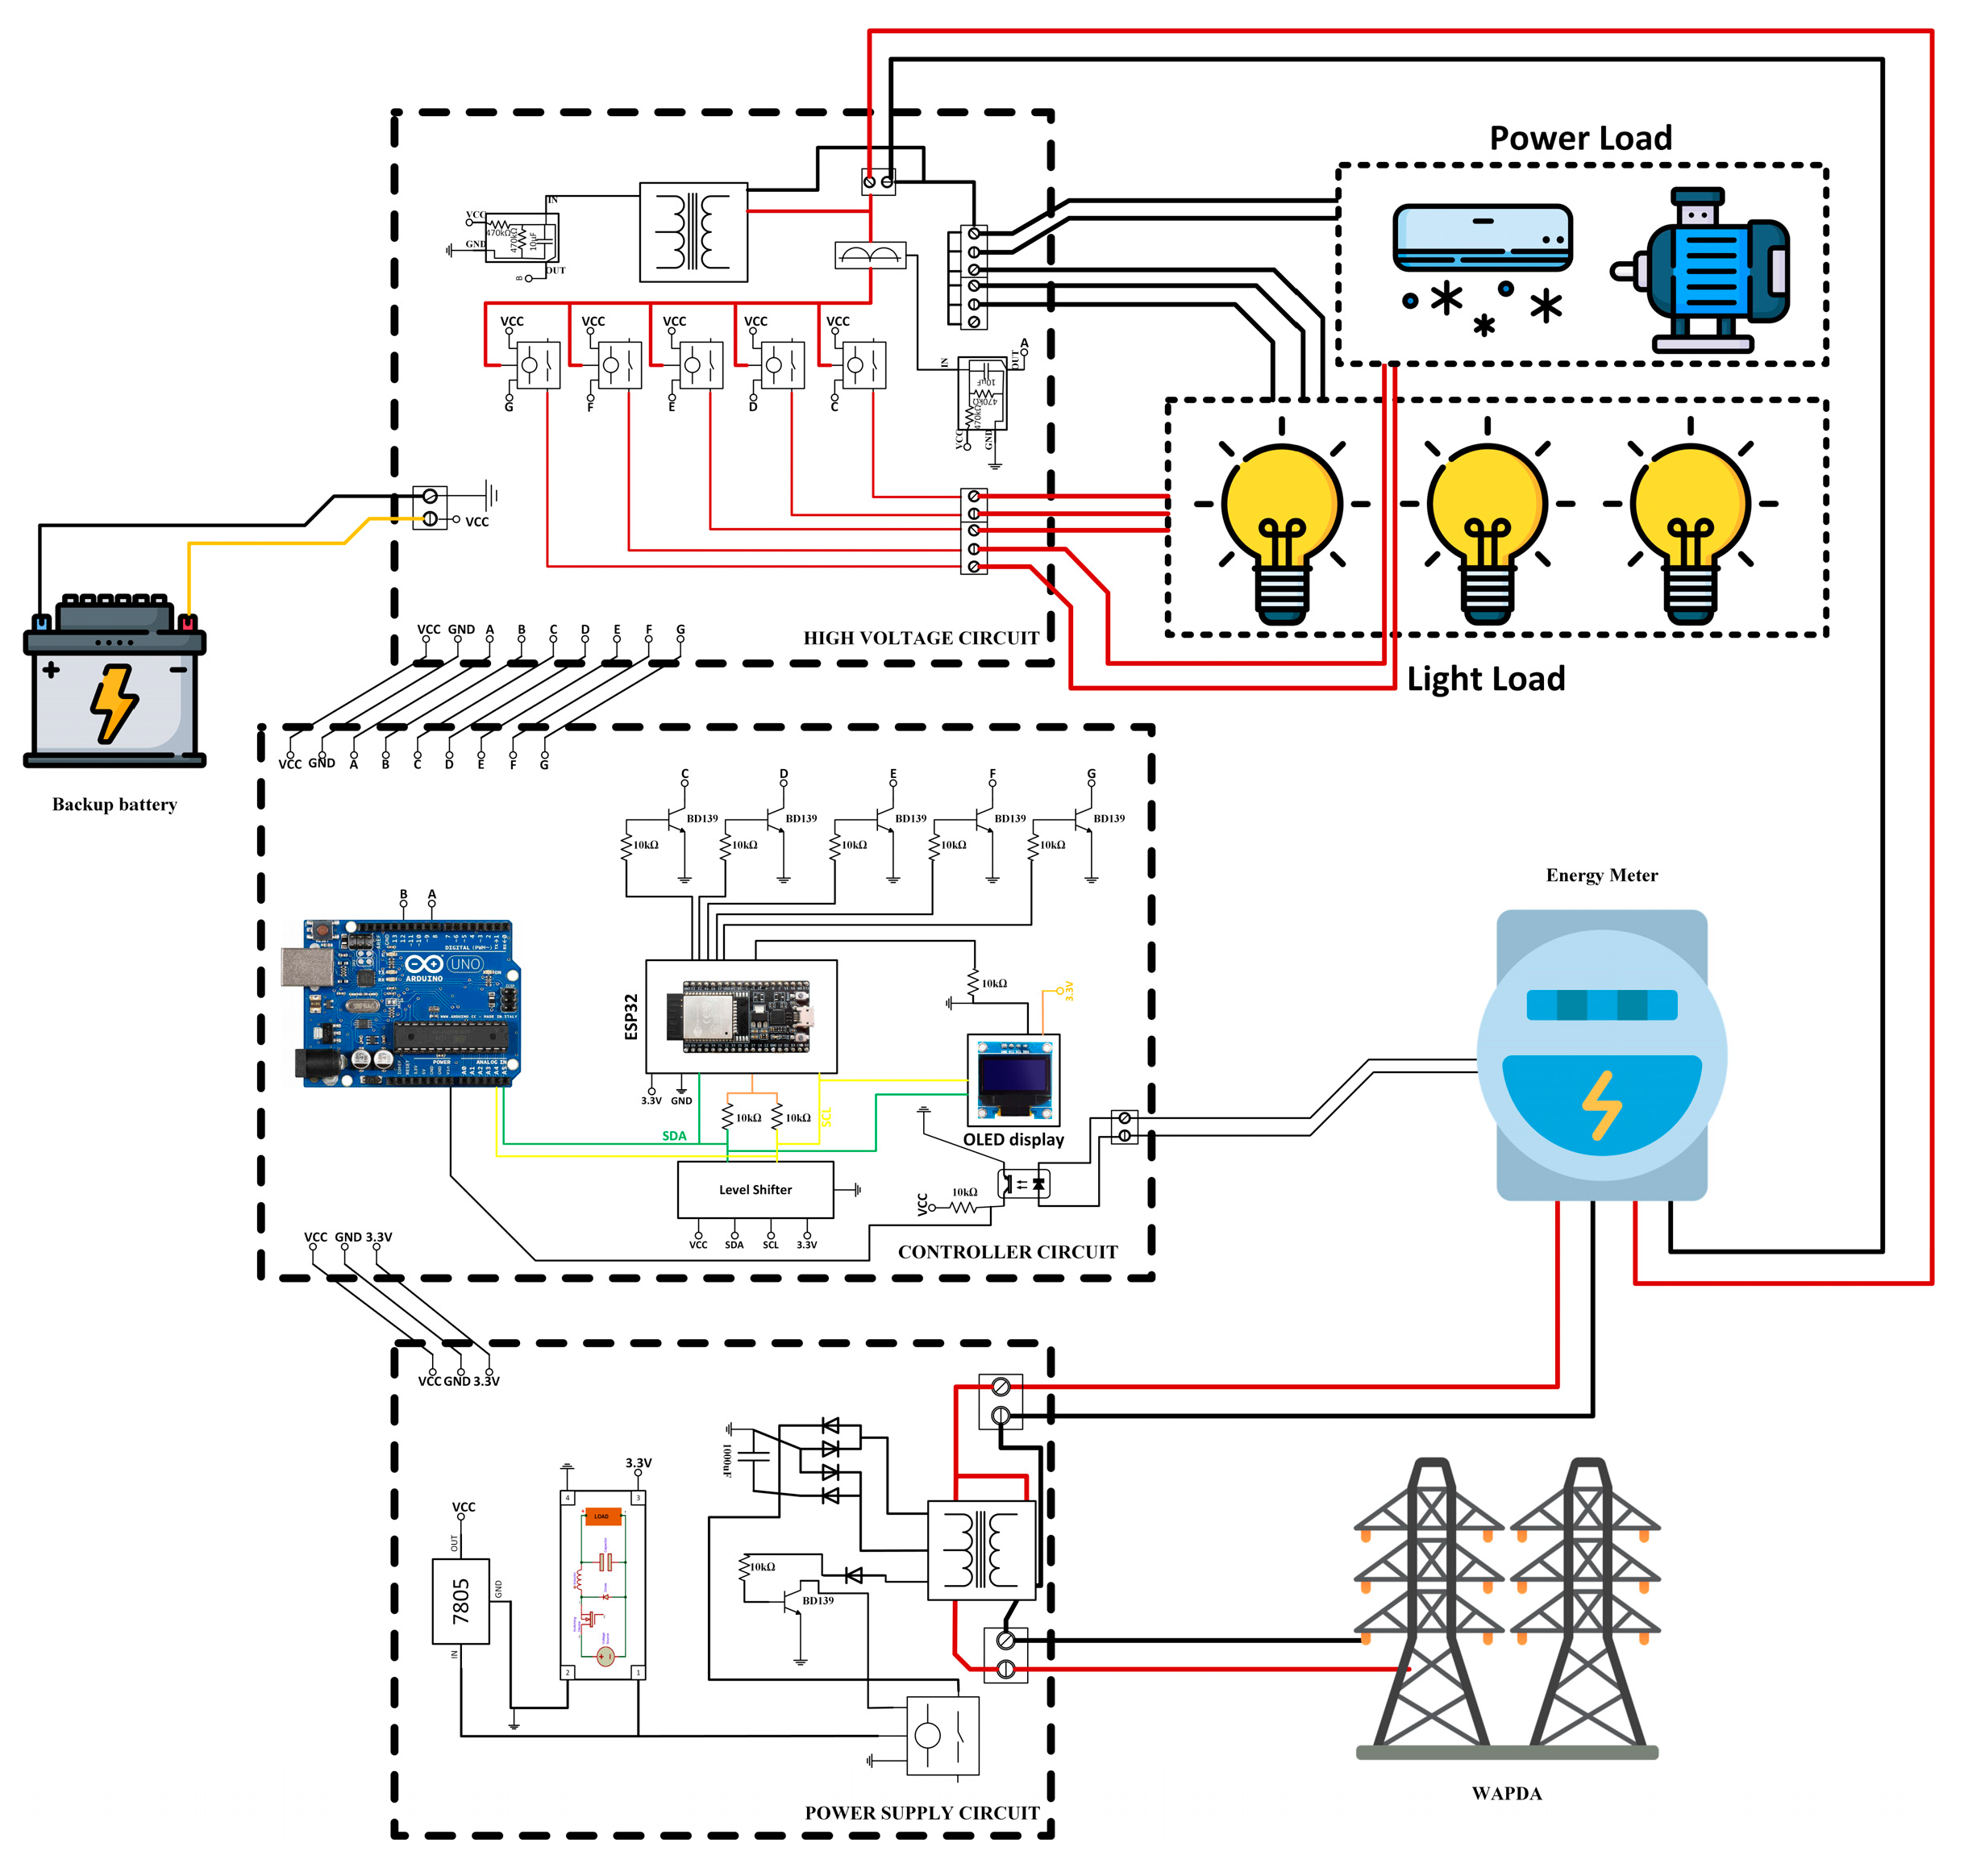
2. Design and Implementation

2.1. Voltage Measurement

To measure quantities of power, the measurement of line voltages is necessary. For this purpose, a potential transformer is used with a rating of 250/12 V. Since ESP-32 can only handle 3.3 V, it can connect a voltage divider circuit to get a 3.3 V signal. Also, microcontrollers can only work with DC signals or some kind of pulsating signals. To change to a sinusoidal signal, we used a signal conditioning RC series circuit.

2.2. Current Measurement

To measure load current, a current transformer of a 5 Amp rating is used. The current transformer’s primary is associated with the load in the series whose current is needed. Similarly, the current transformer’s secondary is associated with the RC signal conditioning circuit, the same one we connected for voltage measurement.

2.3. Power Factor Measurement

The cosine of the angle between the voltage and current is called the power factor. To measure the phase angle of the voltage and current with a microcontroller, the signal first needed to be converted into pulses. An operational amplifier is used in comparator mode to change the sinusoidal signal into a pulsating signal. The operational amplifier inverting pin is grounded, whereas the sinusoidal signal is connected to the noninverting pin of the operational amplifier with a resistor in the series.

2.4. Database and Android Communication

Being an IOT-based energy meter means it can send and receive data over the internet. Another feature of home automation is also available in this energy meter, which is only possible with the help of the internet. An Android application is developed for that purpose. Firebase cloud database is used to communicate with Android Applications for communication over long distances, and it stores values that can easily be accessed by both the ESP-32 and Android applications. All data are stored with ESP-32, which brings up-to-date data every time with a change in values.

2.5. Unit Measurement

To connect the smart meter kit with the energy meter, an optocoupler is used. It reads pulse values and then feeds these values to Arduino. It then counts LED blinks, and it increments one in consumed units when pulses reach 32. The amount for prepaid billing is entered through the Android application through the database, and credited units are obtained through Equation (1). Microcontrollers differentiate between consumed units and credit units. If credit units are greater than one, the Arduino will turn ON relays to connect the load. And it will keep counting consumed units when the LED blinks. In that case, there will be an increment in consumed units and a decrement in credit units. The values that will be incremented and decremented are calculated below:
Credited   units = ( E n t e r e d   A m o u n t ) ( P r i c e   p e r   u n i t )
Units   per   blink = ( o n e   U n i t ) ( 32   b l i n k s   p e r   u n i t ) = 0.03125   u n i t s

2.6. Circuit Diagram

The power supply circuit of the energy meter contains a Buck converter and Voltage regulator ‘7805’. This circuit contains three pins—VCC, ground and 3.3 V. 3.3 V is for ESP32 and OLED display. This power circuit contains high voltages on terminals. The following pins in the power circuit are then connected to the power supply circuit to get low voltage DC power for relays, optocoupler, and also connect CT to its conditioning circuit. The output of the power circuit is then fed to the power supply circuit. In this energy meter, we need three voltage levels, which are 12 V for relays, 5 V for CT and other transistors and 3.3 V for the ESP32 microcontroller. A full wave bridge rectifier is used to convert AC voltages into direct current voltages in the circuit of the power supply. The level of voltage directly adopted by the bridge rectifier is 12 V. These 12 V are then fed to the “7805” voltage regulator to get 5 V and to the buck converter to get 3.3 V. The signal conditioning circuit of the current transformer and potential transformer is connected to their secondary for sampling. The output of the signal conditioning circuit along with other control pins for relays and voltages are combined on the bottom-right portion of the circuit for the last control circuit. The control circuit of the smart energy meter consists of Arduino UNO, the ESP32 microcontroller, and an OLED display. The OLED display is used to display results on the screen. One Current Transformer (CT) is connected to the load-side phase wire to measure load current. There are some NPN-type transistors that are used to control relays that will turn ON or OFF lights and power loads. The output of the power supply circuit is connected to the input pins of the control circuit. There is an external power source available for relays to operate because relays need constant voltage. The overall circuit diagram meter is shown in Figure 1.

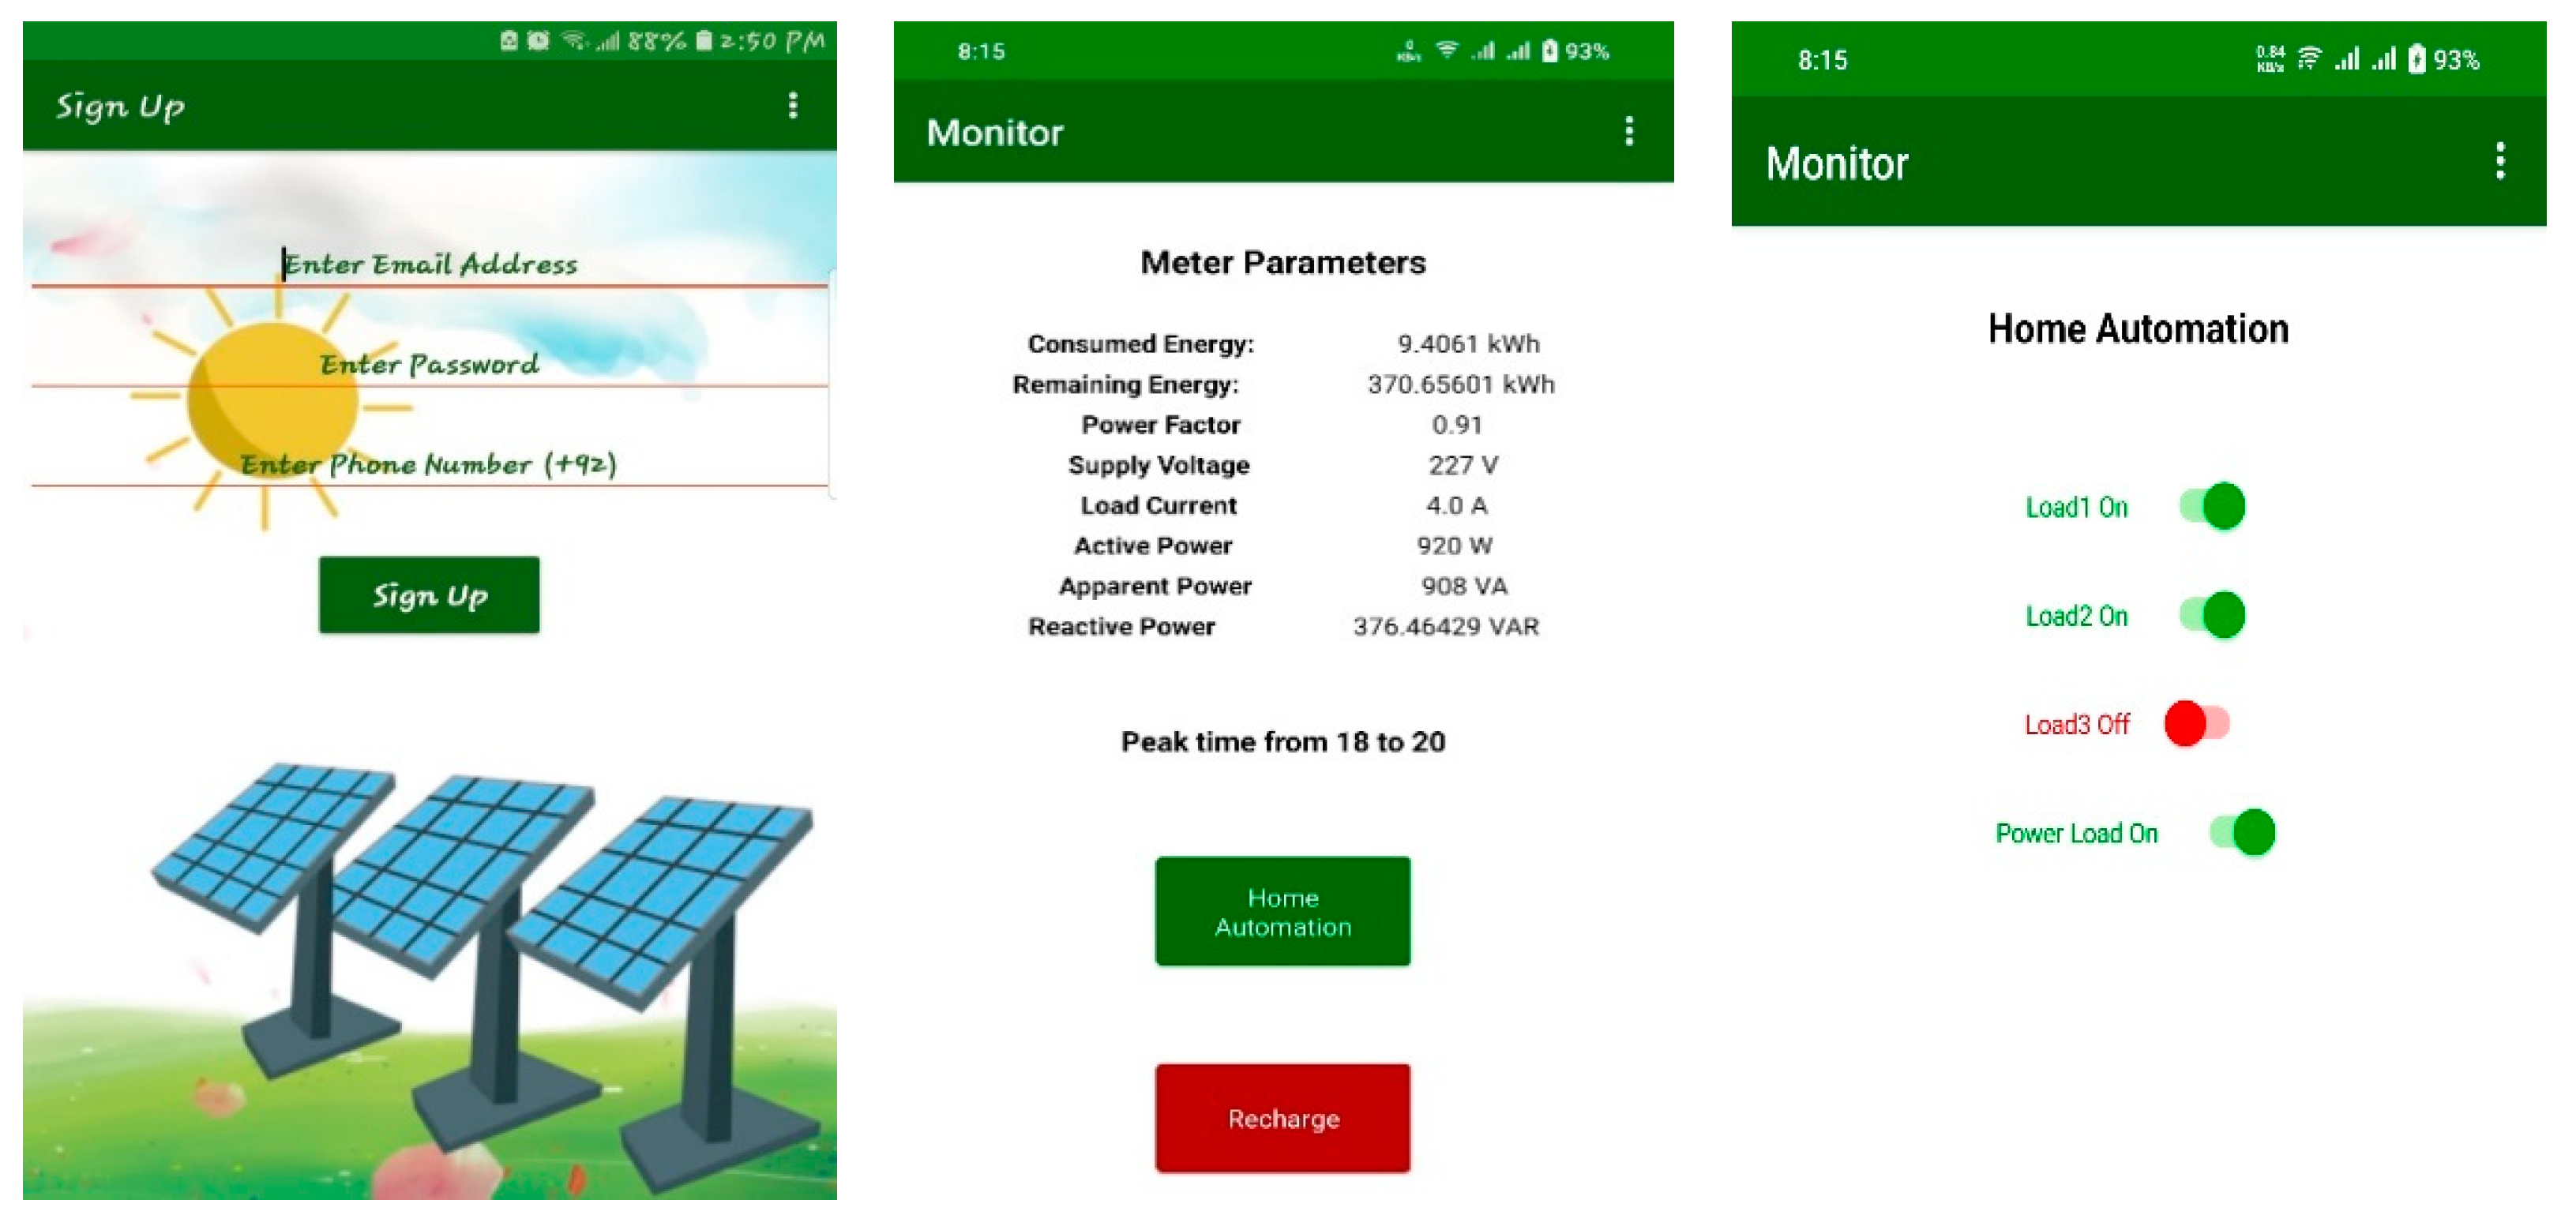
2.7. Android Application

The designed application for this project performs the following function:
1.
Safe and secure account login and account management;
2.
Real-time monitoring of meter and controller parameters;
3.
Home automation through IOT;
4.
Prepaid billing.
The application is developed with the Kodular creator tool. Using website https://c.kodular.io/ (accessed on 27 August 2022). A complete application is designed with two screens, one screen for account login and sign-up option and the second screen for data monitoring and home automation. The complete user interface of Android application is shown in Figure 2. The following are some features of the application:
1.
Biometric account login;
2.
Internet connectivity;
3.
Secure data monitoring;
4.
Secure home automation and load management.

2.8. Peak Load Management

Peak load management is conducted as follows:
1.
Turning off all power loads during peak hours rather than shutting the whole load;
2.
Theft protection against loads during peak time.
Four incandescent bulbs are used. Three of them have 100 W power ratings indicating a light load, while one has a 200 W rating, indicating a power load. Peak hours will be set by the supply company. As soon as peak times start, all power loads will turn off, and only a light load will remain on. And if the user tries to the connect power load with the light load terminal, simply by bypassing it. The system waits for 4 s, then restarts without switching off light loads. After 4 s, the system indicates this as a theft, and a message appears on the screen as ‘theft alert!’ and completely shuts down. It remains off for about 4 min, and after 4 min, the system turns on.

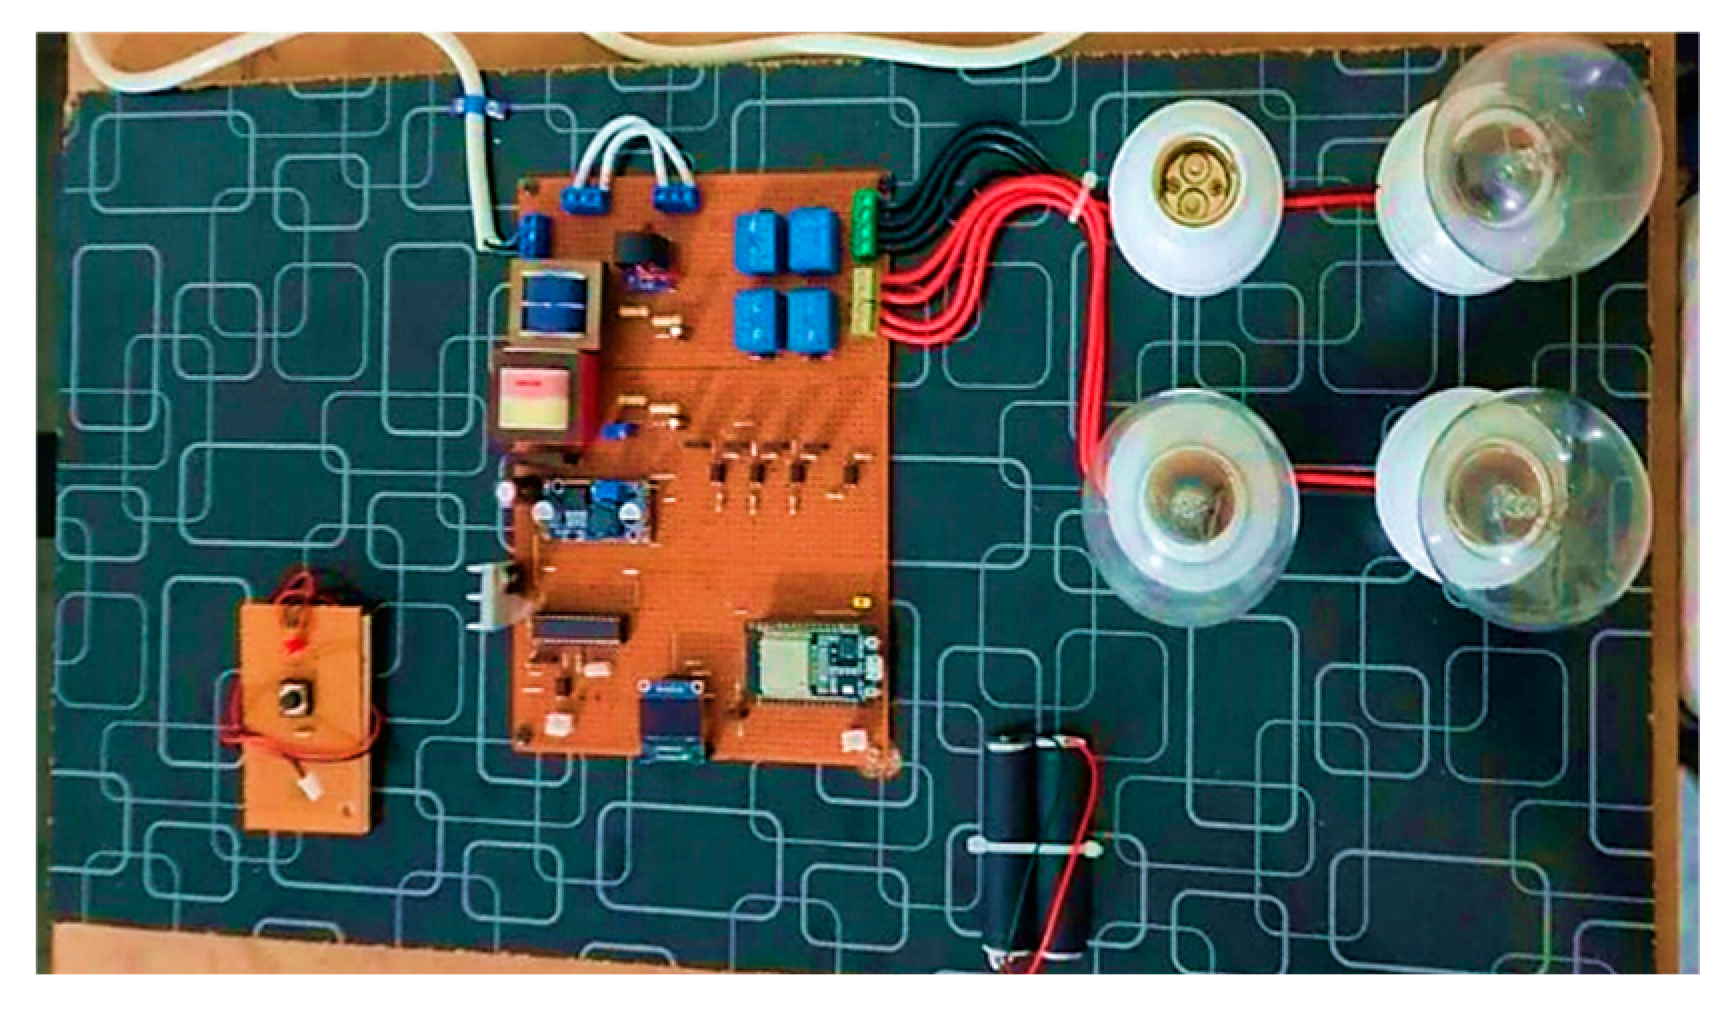
3. Results and Discussion

The proposed prepaid energy meter performs various functions. It measures all quantities of powers. This meter is based on the prepaid recharge method rather than the conventional billing method. The user recharges through the Android application and meter credit units by dividing the entered amount by the rate defined by the company. This prepaid energy meter automatically cuts off the load from the supply whenever the credited units are completely consumed by the load. The other feature is home automation. Data is posted on the online database, which is also shown on the Android application. So, it is possible to allow users to control their load through the internet. For peak load management, all load terminals are assigned with some limit of current to flow. When peak hours start, the power load is turned to OFF, and when peak hours end, the power load is turned to ON automatically. The load capacity of this project is 2 A. In which 1.2 A is for light loads and 0.8 A is for power loads. The limit is added in such a way that when light loads exceed 10%, the power load will automatically turn OFF, and a message will display on the screen indicating theft. To test the home automation and prepaid billing method, the set load switches and remaining units are first set to zero using the Android application, then the energy meter is connected to the power supply. ‘Meter power ON’ and ‘display no balance screen’ on the OLED are displayed with all the loads disconnected. To test prepaid billing, 10 rupees were added to the energy meter account. When the amount is added to the meter, the microcontroller restarts itself and automatically converts the added amount into remaining units by dividing the entered amount by the rate. The unit rate can be changed from the database but for this project, we save it to 5 rupees. When the remaining units were greater than zero it automatically turned ON all connected loads and kept running until all units were consumed. Figure 3 shows the working hardware model of the energy meter.

4. Conclusions

In this project, we created and put into practice a concept for a smart energy meter that measures power quality and is based on the Internet of Things (IoT), monitored, and managed using an Android app. The main microcontroller is an ESP32, which is utilized for PF measuring, active, reactive, and apparent power quantities monitoring; peak time tracking; and home automation. Another method has been put forth to lessen the stress on the grid during peak hours by only removing power loads as opposed to completely disconnecting feeders. When there are no blackouts in the neighbourhood, this smart energy meter can lessen the high demands on UPS batteries since light loads will continue to operate during peak hours. The enormous burden of taxes, which seems to be an unfixable problem in Pakistan’s economy, can be lessened with the aid of the new billing features. A smart energy meter with automatic power load disconnection during peak hours was successfully created and tested, and it perfectly satisfies our objectives. The suggested meter can be applied in real life to resolve the concerns.

Author Contributions

Main paper core design, Z.M.T.; methodology, T.T. and Z.M.T.; formatting, M.F.; formal analysis, T.A. and A.A.; supervision, S.R. All authors have read and agreed to the published version of the manuscript.

Funding

This research received no external funding.

Institutional Review Board Statement

Accepted in current format.

Informed Consent Statement

Permission granted in full knowledge of the possible consequences.

Data Availability Statement

As per project.

Conflicts of Interest

The authors declare no conflict of interest.

References

  1. Bint Faheem, J. Energy crisis in Pakistan. IRA-Int. J. Technol. Eng. 2016, 3, 1–16. [Google Scholar]
  2. Ren, D.; Li, H.; Ji, Y. Home energy management system for the residential load control based on the price prediction. In Proceedings of the 2011 IEEE Online Conference on Green Communications, GreenCom’11, Piscataway, NJ, USA, 26–29 September 2011; pp. 1–6. [Google Scholar]
  3. Balasubramaniam, P.M.; Prabha, S.U. Power quality issues, solutions and standards: A technology review. J. Appl. Sci. Eng. 2015, 18, 371–380. [Google Scholar] [CrossRef]
  4. Barman, B.K.; Yadav, S.N.; Kumar, S.; Gope, S. IOT Based Smart Energy Meter for Efficient Energy Utilization in Smart Grid. In Proceedings of the 2018 2nd International Conference on Power, Energy and Environment: Towards Smart Technology (ICEPE), Shillong, India, 1–2 June 2018. [Google Scholar]
  5. Talwar, P.D.; Kulkarni, S.B. IoT based energy meter reading. Int. J. Recent Trends Eng. Res. 2016, 2, 586–591. [Google Scholar]
  6. Gavhane, V.V. IoT based Energy Meter with Smart Monitoring of Home Appliances. In Proceedings of the 2021 6th International Conference for Convergence in Technology (I2CT), Maharashtra, India, 2–4 April 2021; pp. 1–5. [Google Scholar]
  7. Al-Kuwari, M. Smart-Home Automation Using IoT-Based Sensing; Electrical Engineering Department, College of Engineering, Qatar University: Doha, Qatar, 2020; pp. 1–6. [Google Scholar]
  8. Nurfadilah, M.F. Energy Saving Management with Suggestion. In Proceedings of the 2020 6th International Conference on Interactive Digital Media (ICIDM), Bandung, Indonesia, 14–15 December 2020; pp. 1–5. [Google Scholar]
  9. Patil, V.R.; Patil, M.D.; Khude, A.T. IoT Based Prepaid Energy Meter. In Proceedings of the 2020 5th International Conference on Devices, Circuits and Systems (ICDCS), Coimbatore, India, 5–6 March 2020; pp. 17–20. [Google Scholar]
Figure 1. Complete circuit diagram of Prepaid Energy Meter.
Engproc 46 00023 g001
Figure 2. User interface of Android application.
Engproc 46 00023 g002
Figure 3. Final hardware model of energy meter.
Engproc 46 00023 g003
Disclaimer/Publisher’s Note: The statements, opinions and data contained in all publications are solely those of the individual author(s) and contributor(s) and not of MDPI and/or the editor(s). MDPI and/or the editor(s) disclaim responsibility for any injury to people or property resulting from any ideas, methods, instructions or products referred to in the content.

