
Three-Phase Load Balancing in Distribution Systems Using Load Sharing Technique †


Abstract
:1. Introduction
1.1. Balanced Load
1.2. Unbalanced Load
2. Analysis of Technical Research
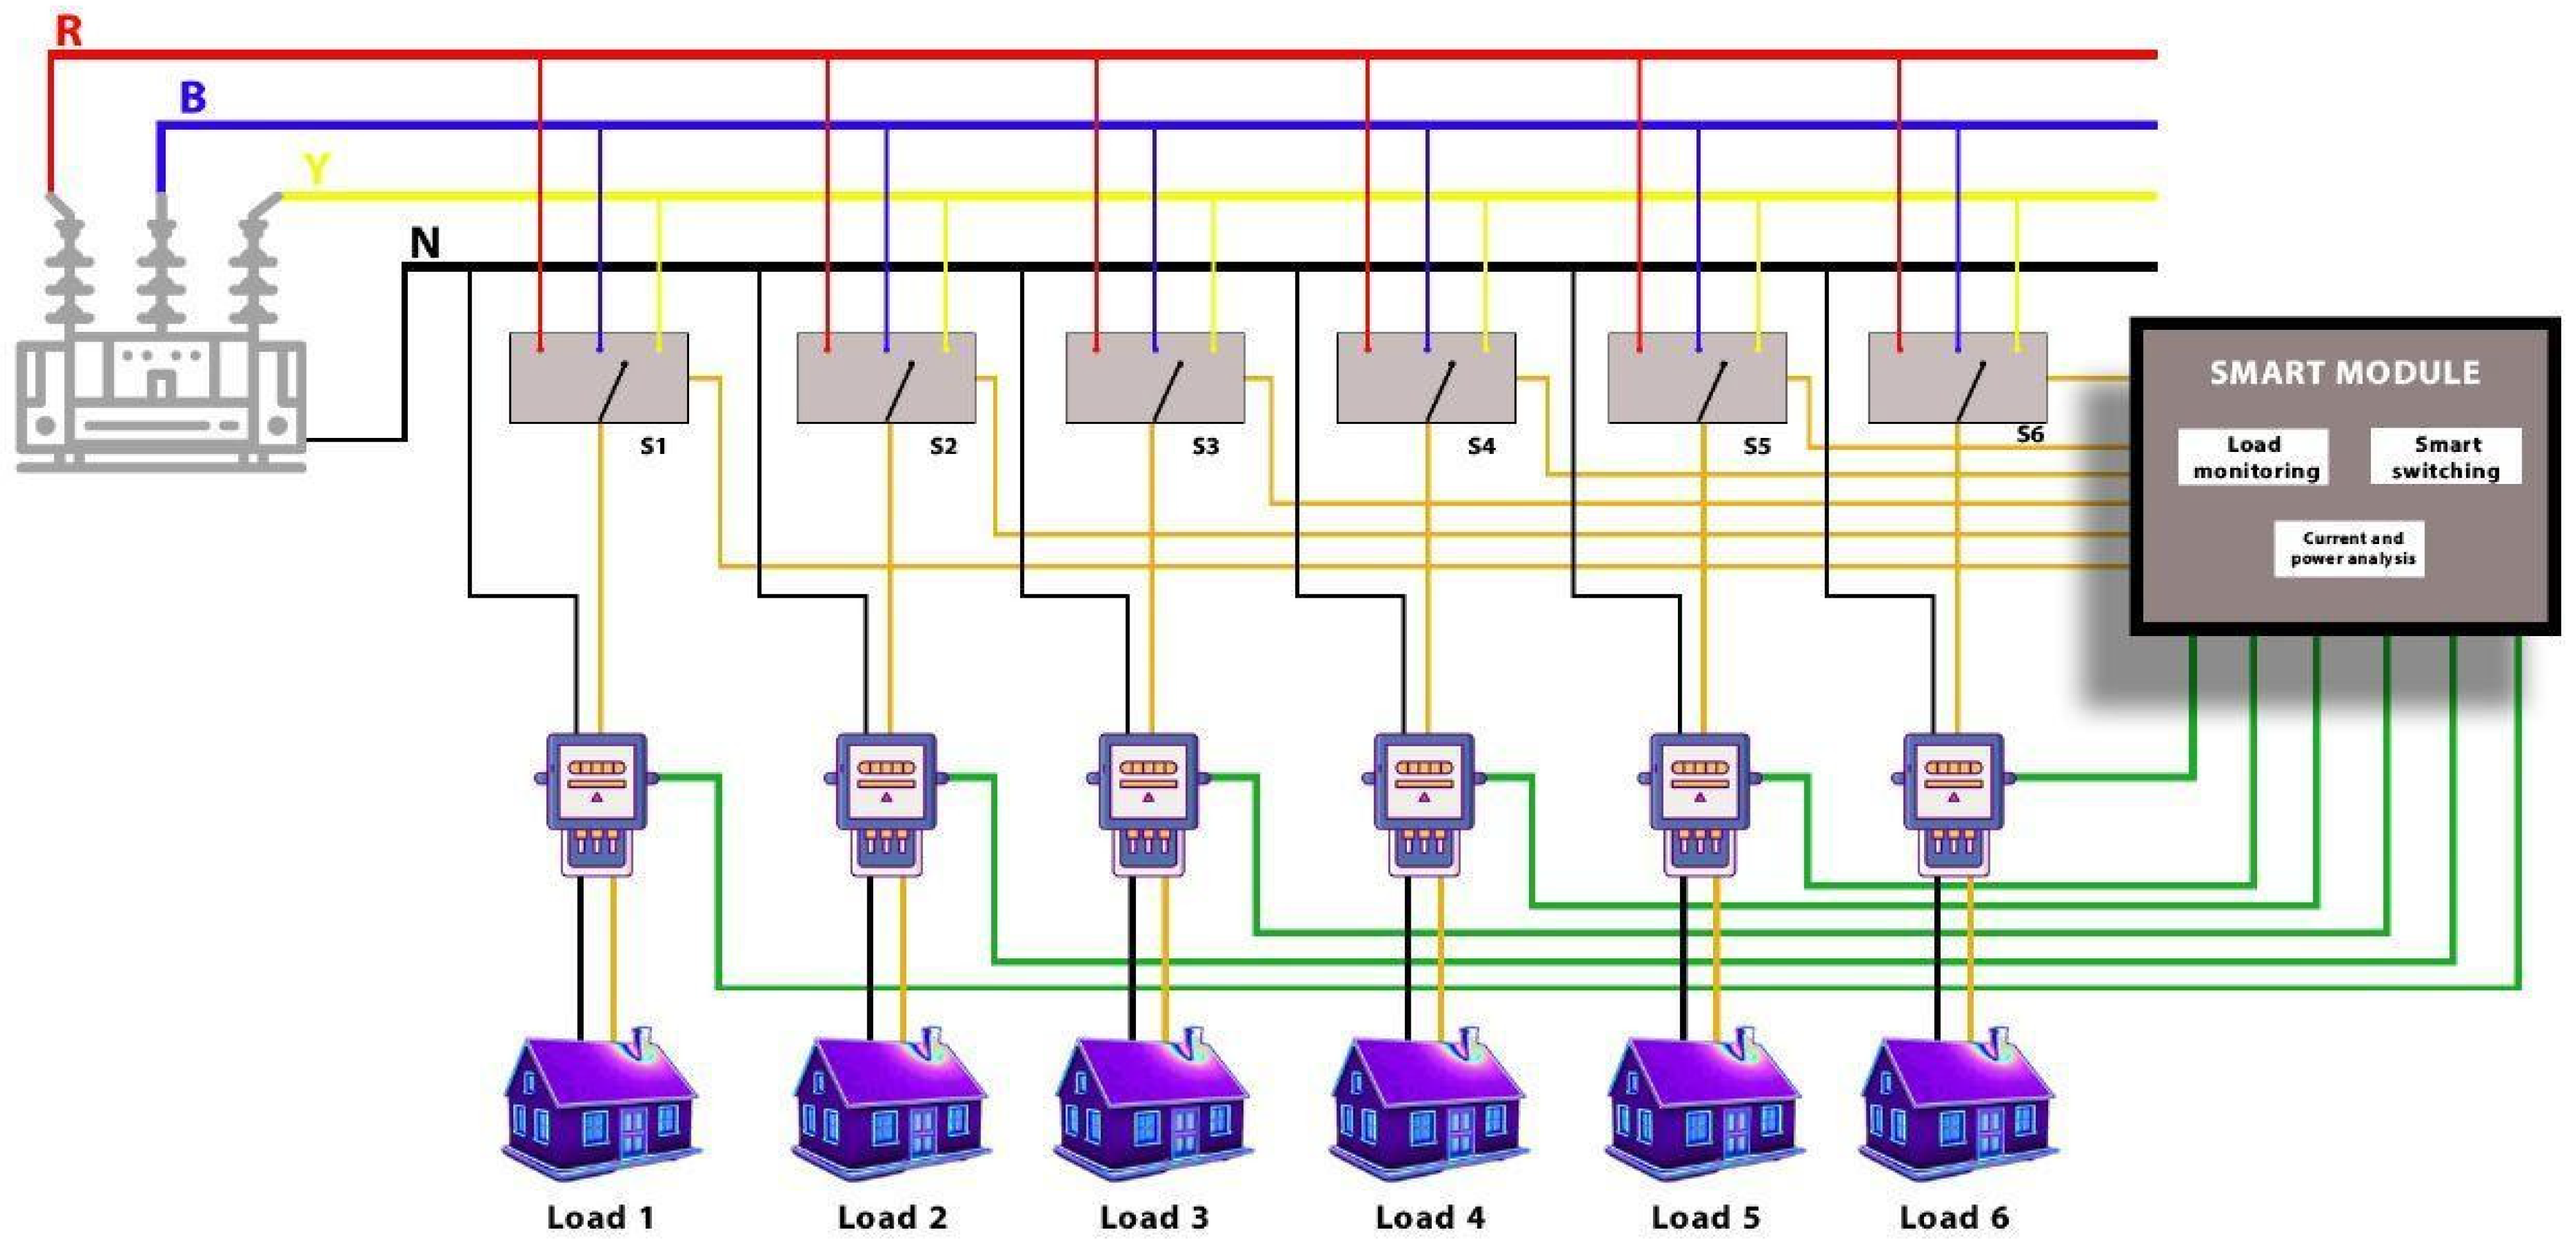
3. Methodology
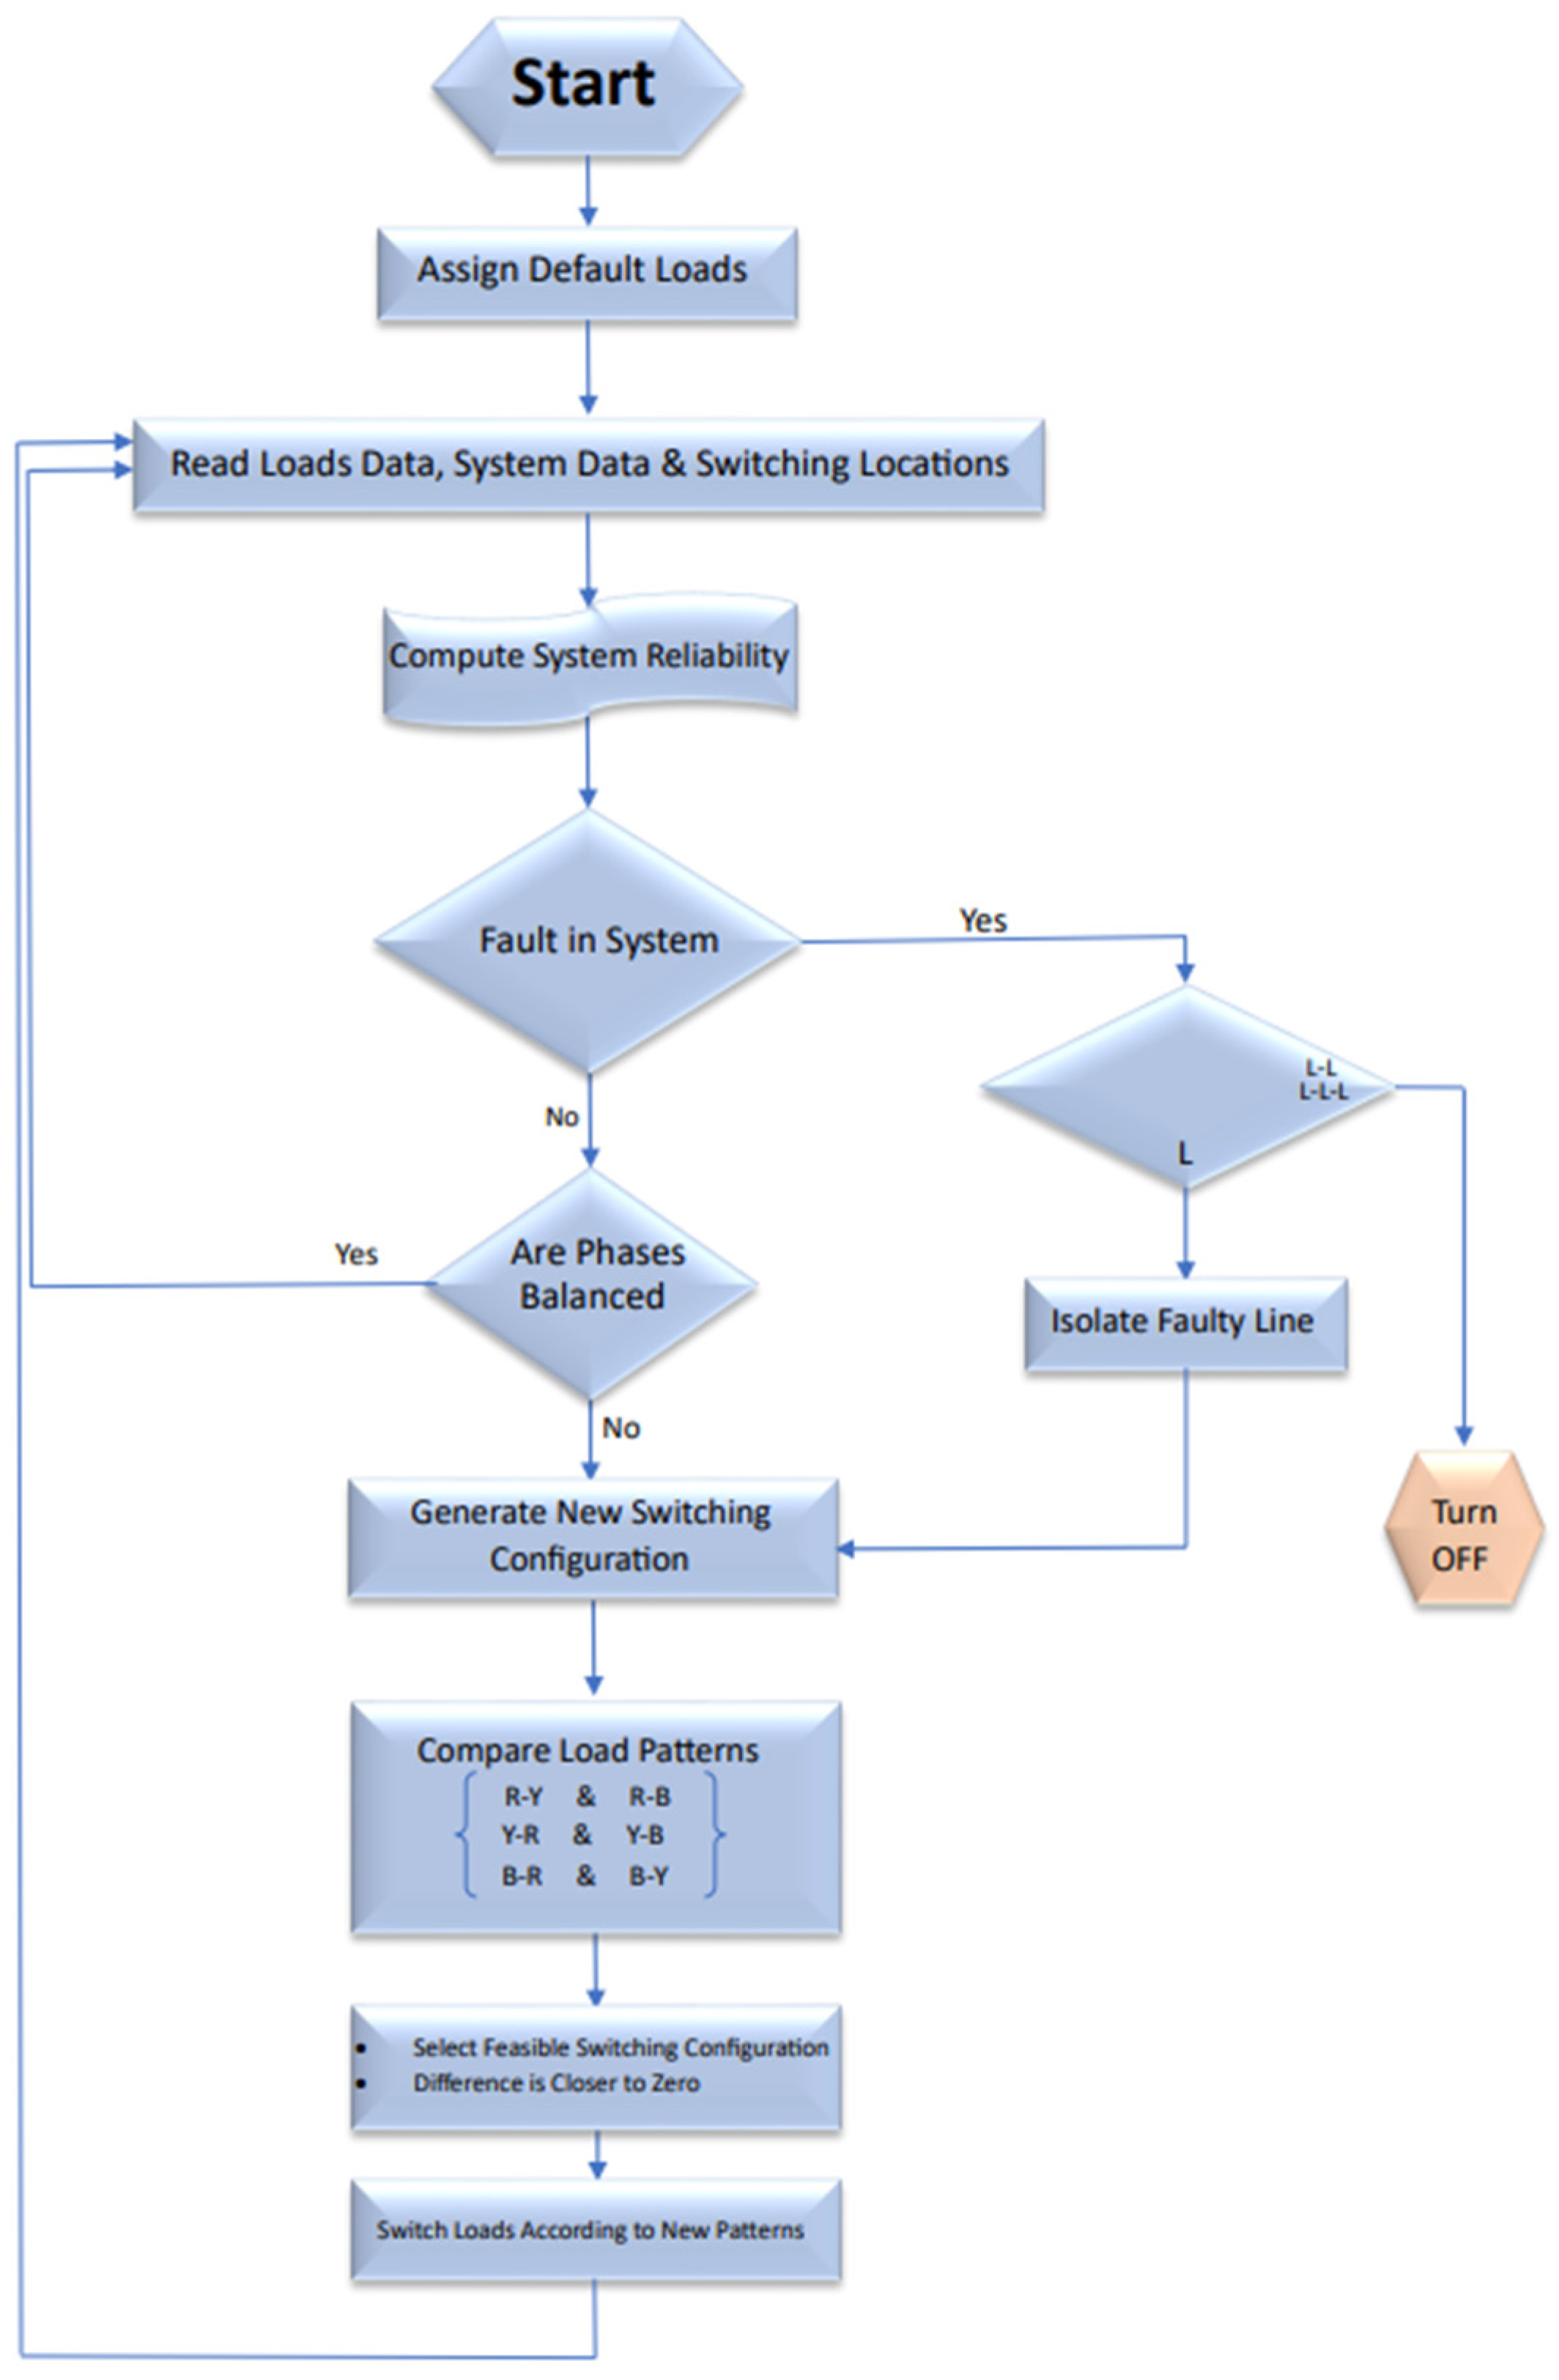
3.1. System Flowchart
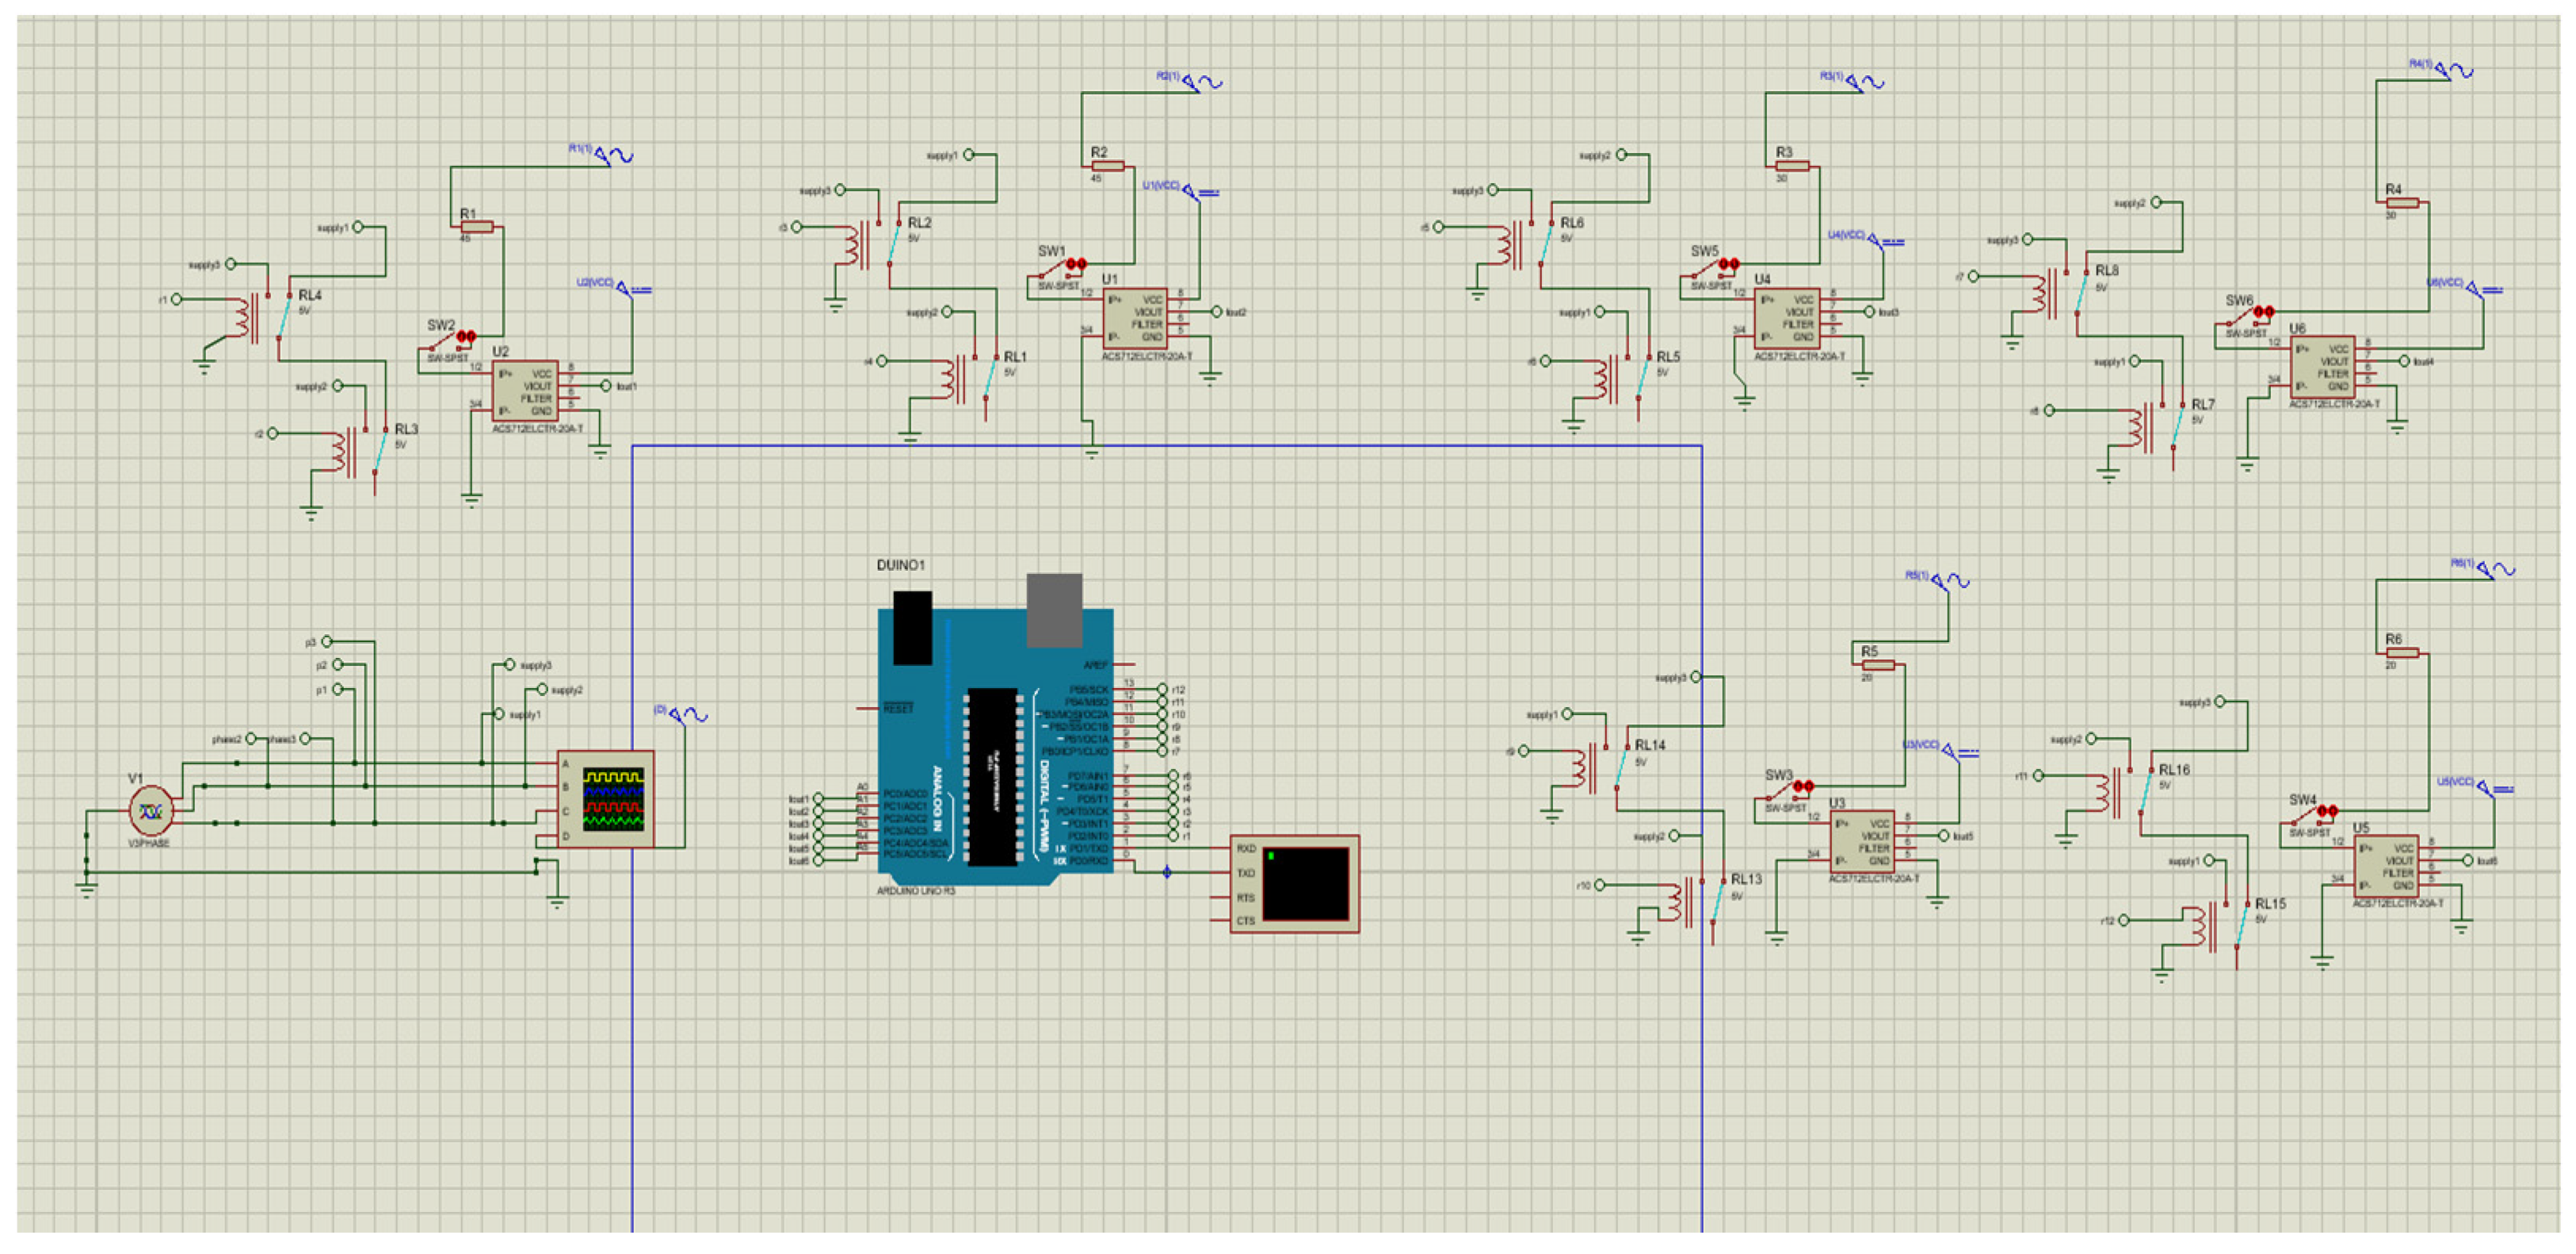
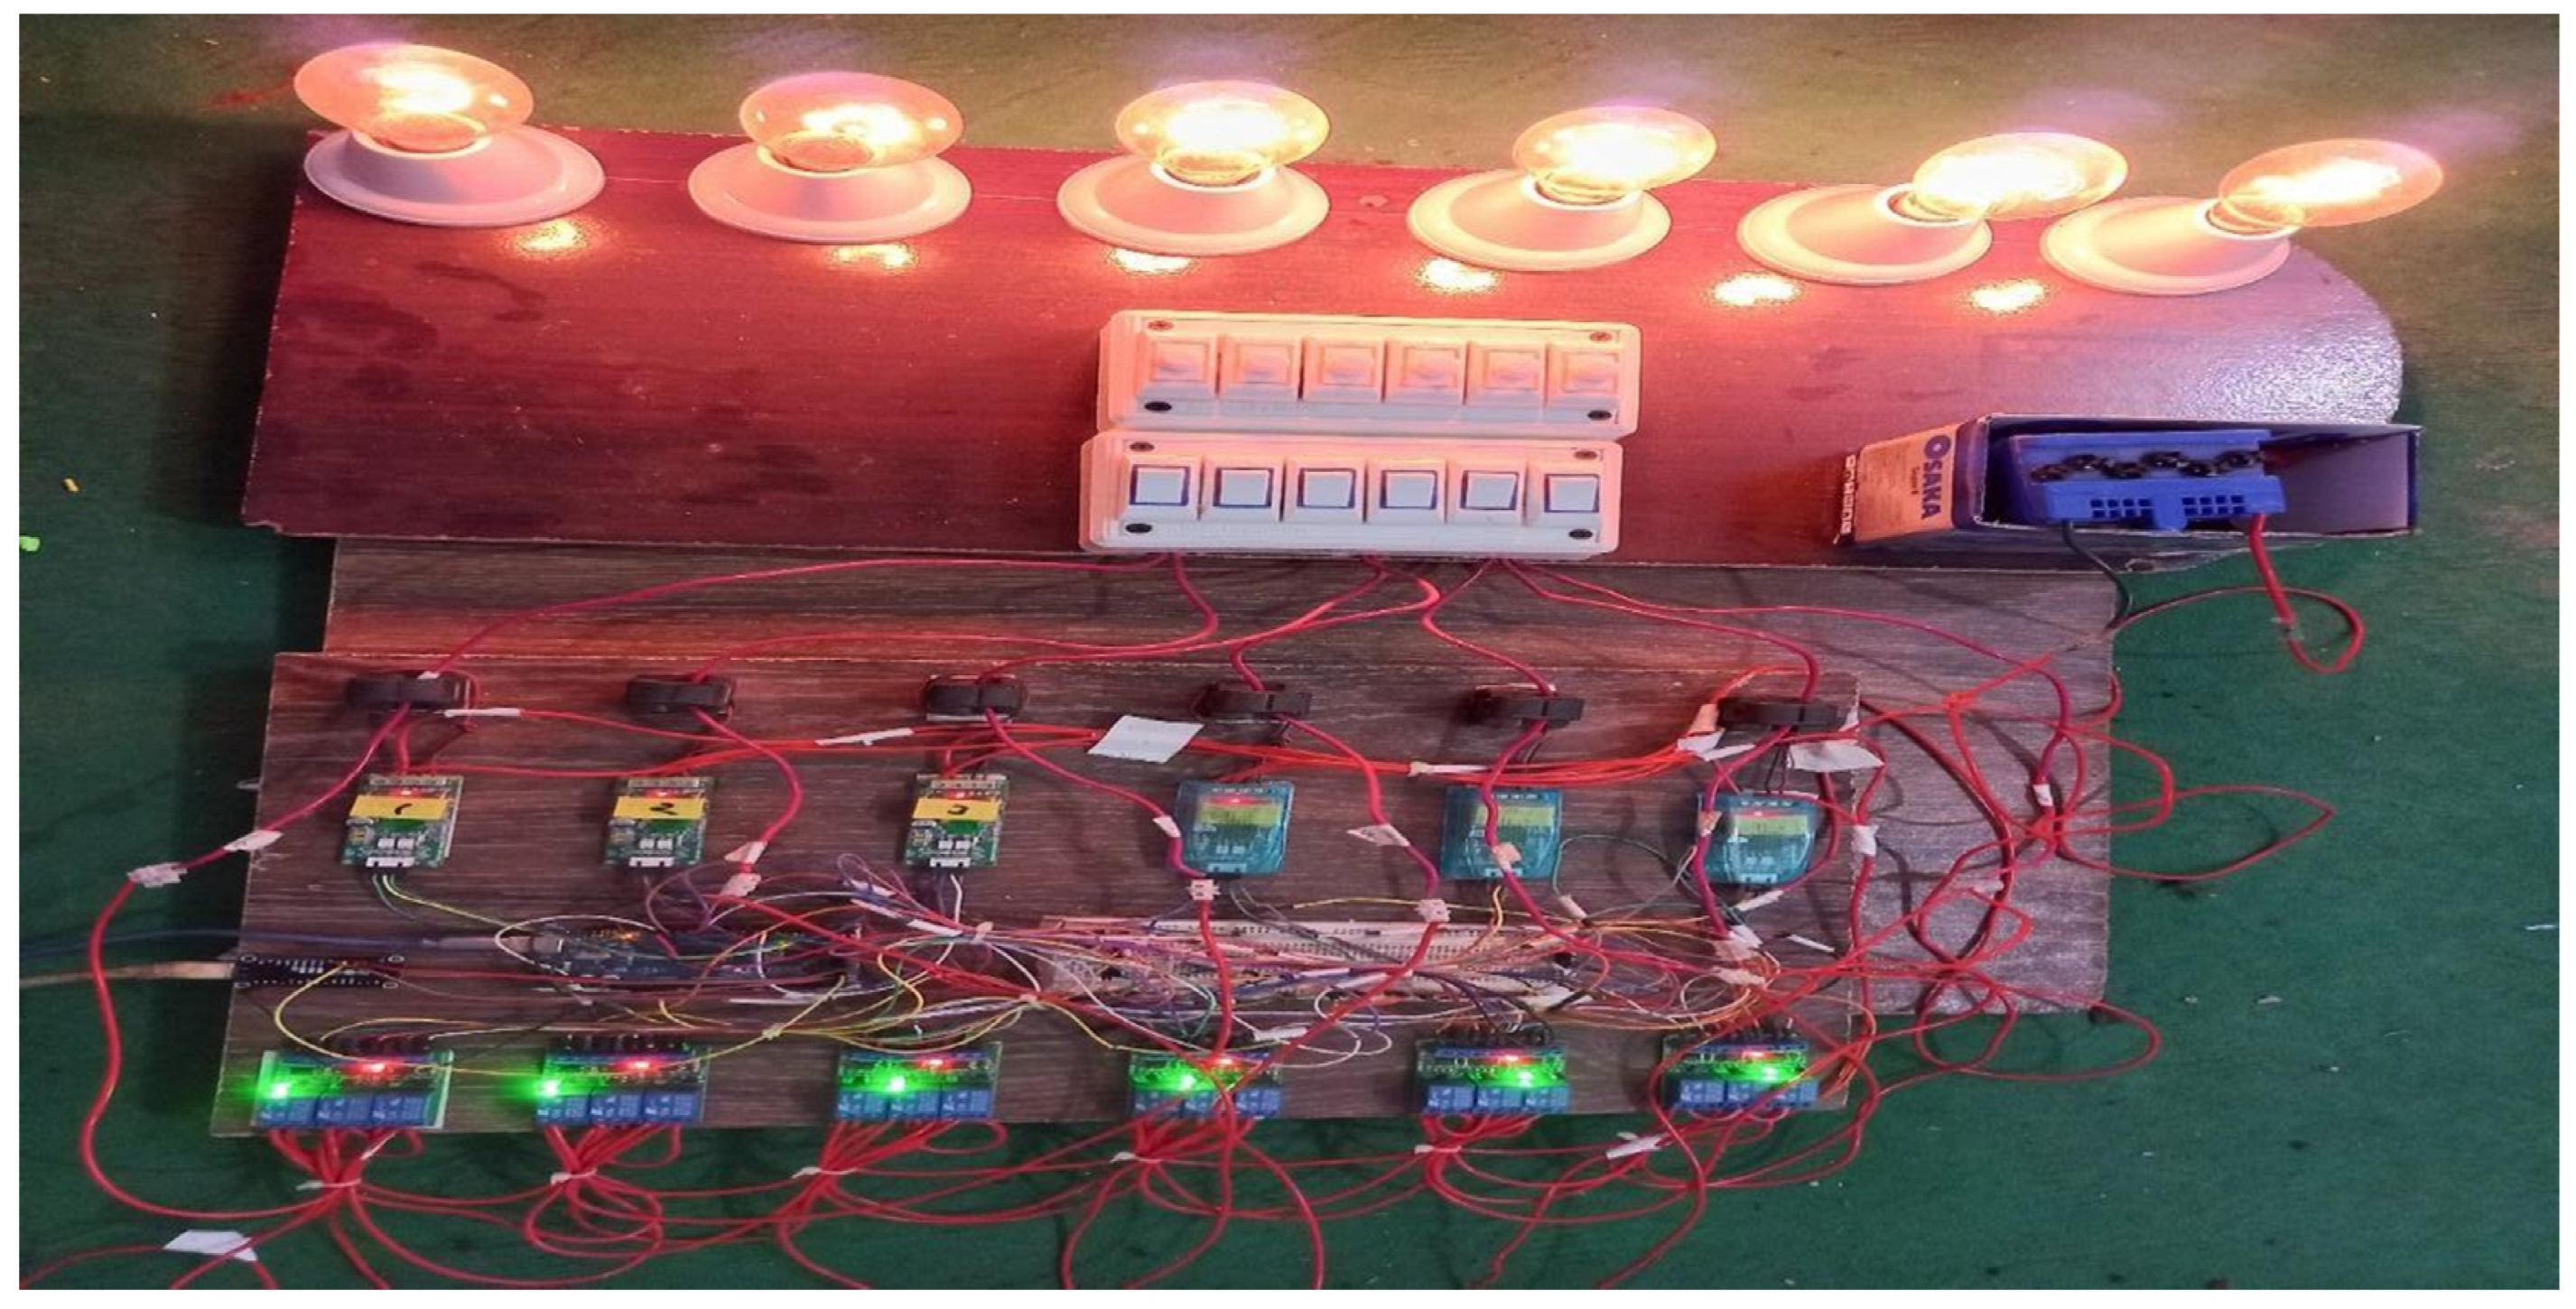
3.2. Implementation
- Software implementation

- Hardware implementation

4. Results
5. Conclusions
Author Contributions
Funding
Institutional Review Board Statement
Informed Consent Statement
Data Availability Statement
Conflicts of Interest
References
- Mahzarnia, M.; Moghaddam, M.P.; Baboli, P.T.; Siano, P. A Review of the Measures to Enhance Power Systems Resilience. IEEE Syst. J. 2020, 14, 4059–4070. [Google Scholar] [CrossRef]
- Zhao, J.; Wang, C.; Zhao, B.; Lin, F.; Zhou, Q.; Wang, Y. A review of active management for distribution networks: Current status and future development trends. Electr. Power Compon. Syst. 2014, 42, 280–293. [Google Scholar]
- Sahito, A.A.; Memon, Z.A.; Shaikh, P.H.; Rajper, A.A.; Memon, S.A. Unbalanced Loading; An Overlooked Contributor to Power Losses in HESCO. Sindh Univ. Res. J. 2016, 47, 779–782. [Google Scholar]
- Mansouri, K.; Hamed, M.B.; Sbita, L.; Dhaoui, M. Three-phase balancing in a LV distribution smart-grids using electrical load flow variation: L.F.B.M. In Proceedings of the 2015 16th International Conference on Sciences and Techniques of Automatic Control and Computer Engineering (STA), Monastir, Tunisia, 21–23 December 2015; pp. 427–431. [Google Scholar]
- Haq, S.U.; Arif, B.; Khan, A.; Ahmed, J. Automatic three phase load balancing system by using fast switching relay in three phase distribution system. In Proceedings of the 2018 1st International Conference on Power, Energy and Smart Grid (ICPESG), Mirpur Azad Kashmir, Pakistan, 9–10 April 2018; pp. 1–6. [Google Scholar]
- Fang, L.; Ma, K.; Zhang, X. A statistical approach to guide phase swapping for data-scarce low voltage networks. IEEE Trans. Power Syst. 2019, 35, 751–761. [Google Scholar] [CrossRef]
- Ukil, A.; Siti, W.; Jordaan, J. Feeder load balancing using neural network. In Proceedings of the Advances in Neural Networks-ISNN 2006: Third International Symposium on Neural Networks, Chengdu, China, 28 May–1 June 2006; Proceedings, Part II 3. Springer: Berlin/Heidelberg, Germany, 2006; pp. 1311–1316. [Google Scholar]
- Grigoras, G.; Gavrilas, M.; Neagu, B.C.; Ivanov, O.; Triștiu, I.; Bulac, C. An efficient method to optimal phase load balancing in low voltage distribution network. In Proceedings of the 2019 International Conference on ENERGY and ENVIRONMENT (CIEM), Timisoara, Romania, 17–18 October 2019; pp. 323–327. [Google Scholar]
- Mostafa, H.A.; El-Shatshat, R.; Salama, M.M.A. Phase balancing of a 3-phase distribution system with a considerable penetration of single phase solar generators. In Proceedings of the 2014 IEEE PES T&D Conference and Exposition, Chicago, IL, USA, 14–17 April 2014; pp. 1–5. [Google Scholar]
- Mansani, S.; Yaragatti, U.R. Backward sweep technique based phase balancing algorithm for secondary distribution system. In Proceedings of the 2017 IEEE PES Asia-Pacific Power and Energy Engineering Conference (APPEEC), Bangalore, India, 8–10 November 2017; pp. 1–6. [Google Scholar]
- Hooshmand, R.A.; Soltani, S. Fuzzy optimal phase balancing of radial and meshed distribution networks using BF-PSO algorithm. IEEE Trans. Power Syst. 2011, 27, 47–57. [Google Scholar] [CrossRef]
- Shahnia, F.; Wolfs, P.J.; Ghosh, A. Voltage unbalance reduction in low voltage feeders by dynamic switching of residential customers among three phases. IEEE Trans. Smart Grid 2014, 5, 1318–1327. [Google Scholar] [CrossRef]
- Daud, J.G.; Kondoj, M.; Patabo, M. Reconfiguration distribution network with ant colony. In Proceedings of the 2018 International Conference on Applied Science and Technology (iCAST), Manado, Indonesia, 26–27 October 2018; pp. 349–353. [Google Scholar]


| Ref. | Methodology | Loss Formula | Implementation | Real Time | Test System | Advantages | Disadvantages | ||
|---|---|---|---|---|---|---|---|---|---|
| Current Base | Power Base | Hardware Base | Simulation Base | ||||||
| [6] | Statistical Approach | ✔ | ✔ | 🗶 | ✔ | 🗶 | LV Distribution network (415 V) | Reduced the imbalance of Low voltage system by 35% | When there is a low number of data, this strategy can produce a balance of less than 14.3% when compared to rich data. |
| [7] | Neural Network | ✔ | 🗶 | 🗶 | ✔ | ✔ | Applied to 6 loads | Neural networks outperform heuristic approaches by 14%. | 9% of neural networks fail to converge or produce incorrect results |
| [4] | Load Flow Balancing Method | 🗶 | ✔ | 🗶 | ✔ | 🗶 | 400 V distribution System | This method efficiently balances three-phase demand during electrical installation. | It is only utilized prior to the installation of an electrical system. |
| [8] | Heuristic Method | ✔ | ✔ | 🗶 | ✔ | ✔ | Real LV rural distribution network | Reduce the imbalance factor from 1.287 to 1.003 and power losses by up to 65.23%. | Heuristic method performs worse 14% than Neural network |
| [9] | Genetic Algorithm | ✔ | ✔ | 🗶 | ✔ | 🗶 | IEEE 37 bus feeder | 17.19% of unbalancing reduced in distribution system | Due to a lack of data, it cannot balance phases in real time. |
| [10] | Analytical/Backward Sweep Phase Balancing | ✔ | ✔ | 🗶 | ✔ | 🗶 | IEEE 13 bus feeder | Power losses in feeder laterals reduced 9.21% and simple mathematical terms used | Cannot balance the heavy load |
| [11] | Fuzzy Optimization and BF-PSO | ✔ | ✔ | 🗶 | ✔ | 🗶 | Feeder no: 3062 in Iran | Reduced the neutral current from 333 A to 113 A and power losses from 308 kW to 289 kW | Rephrasing takes more time to minimize neutral current. |
| [12] | Intelligent Residential Load Transfer Scheme | ✔ | ✔ | 🗶 | ✔ | ✔ | LV feeder | Voltage unbalance reduced from 2.23% to 0.16% | A failure in the central controller will stop load transfer, if the switch fails the house connection will be disconnect |
| [13] | Fuzzy Logic | 🗶 | ✔ | 🗶 | ✔ | 🗶 | Domestics feeder in South Africa | Reduced the unbalancing from 108.67 kW to 3.33 kW | Due to random data assumption, a 6 kW error has occurred |
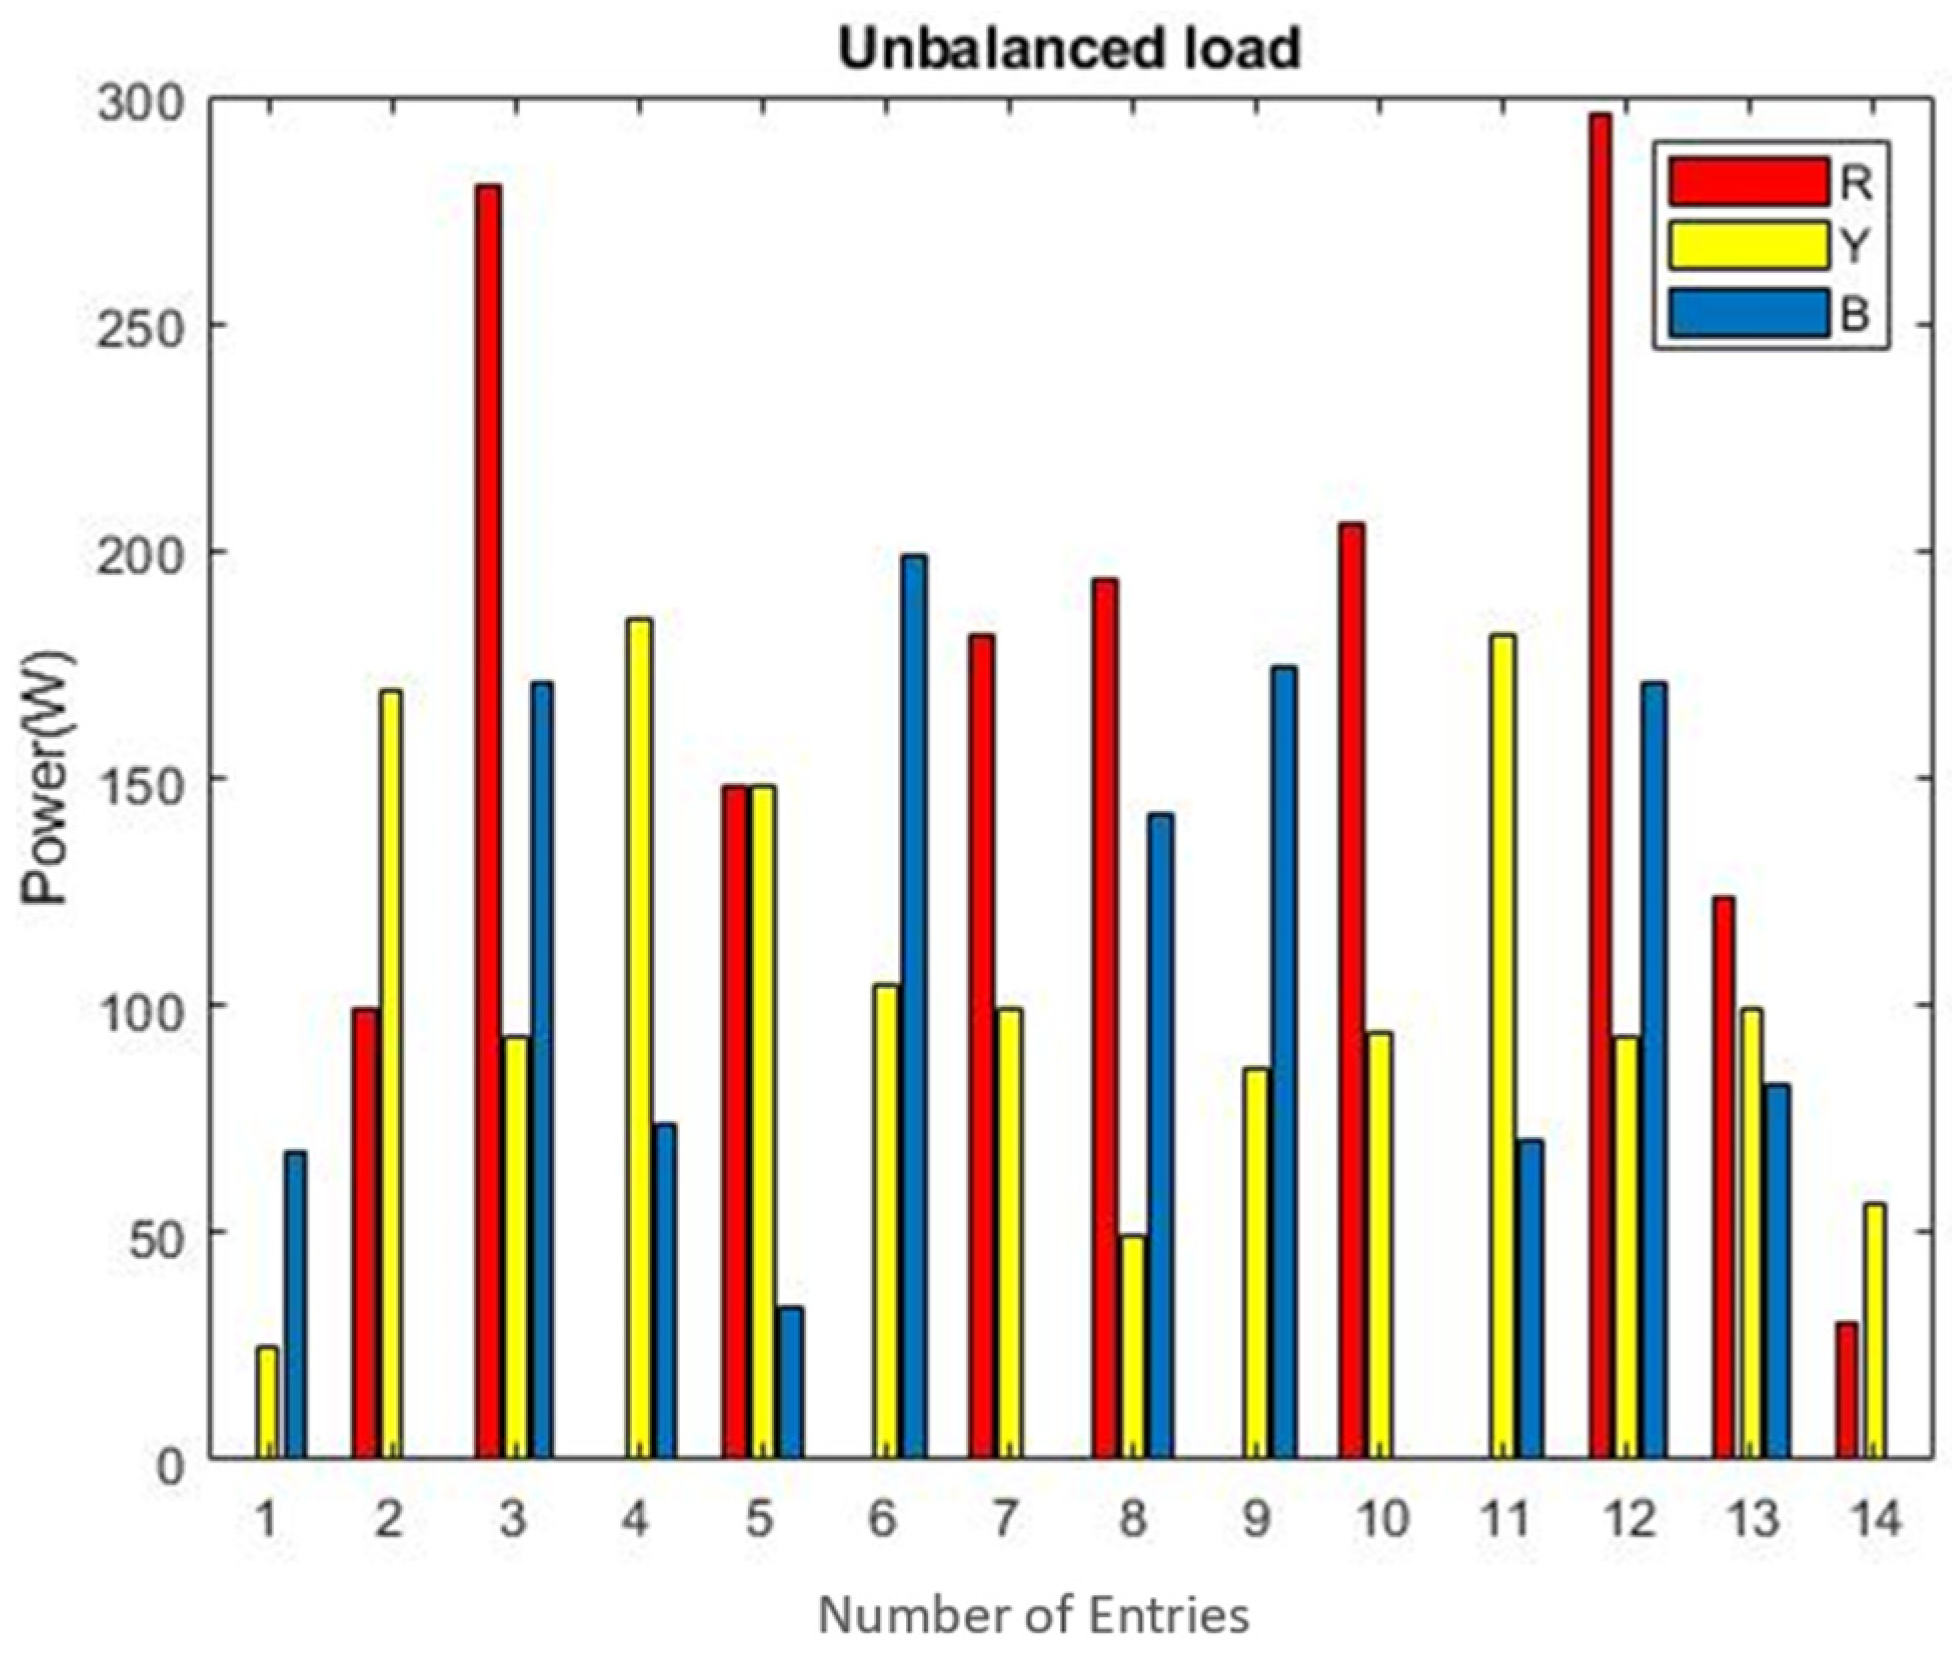
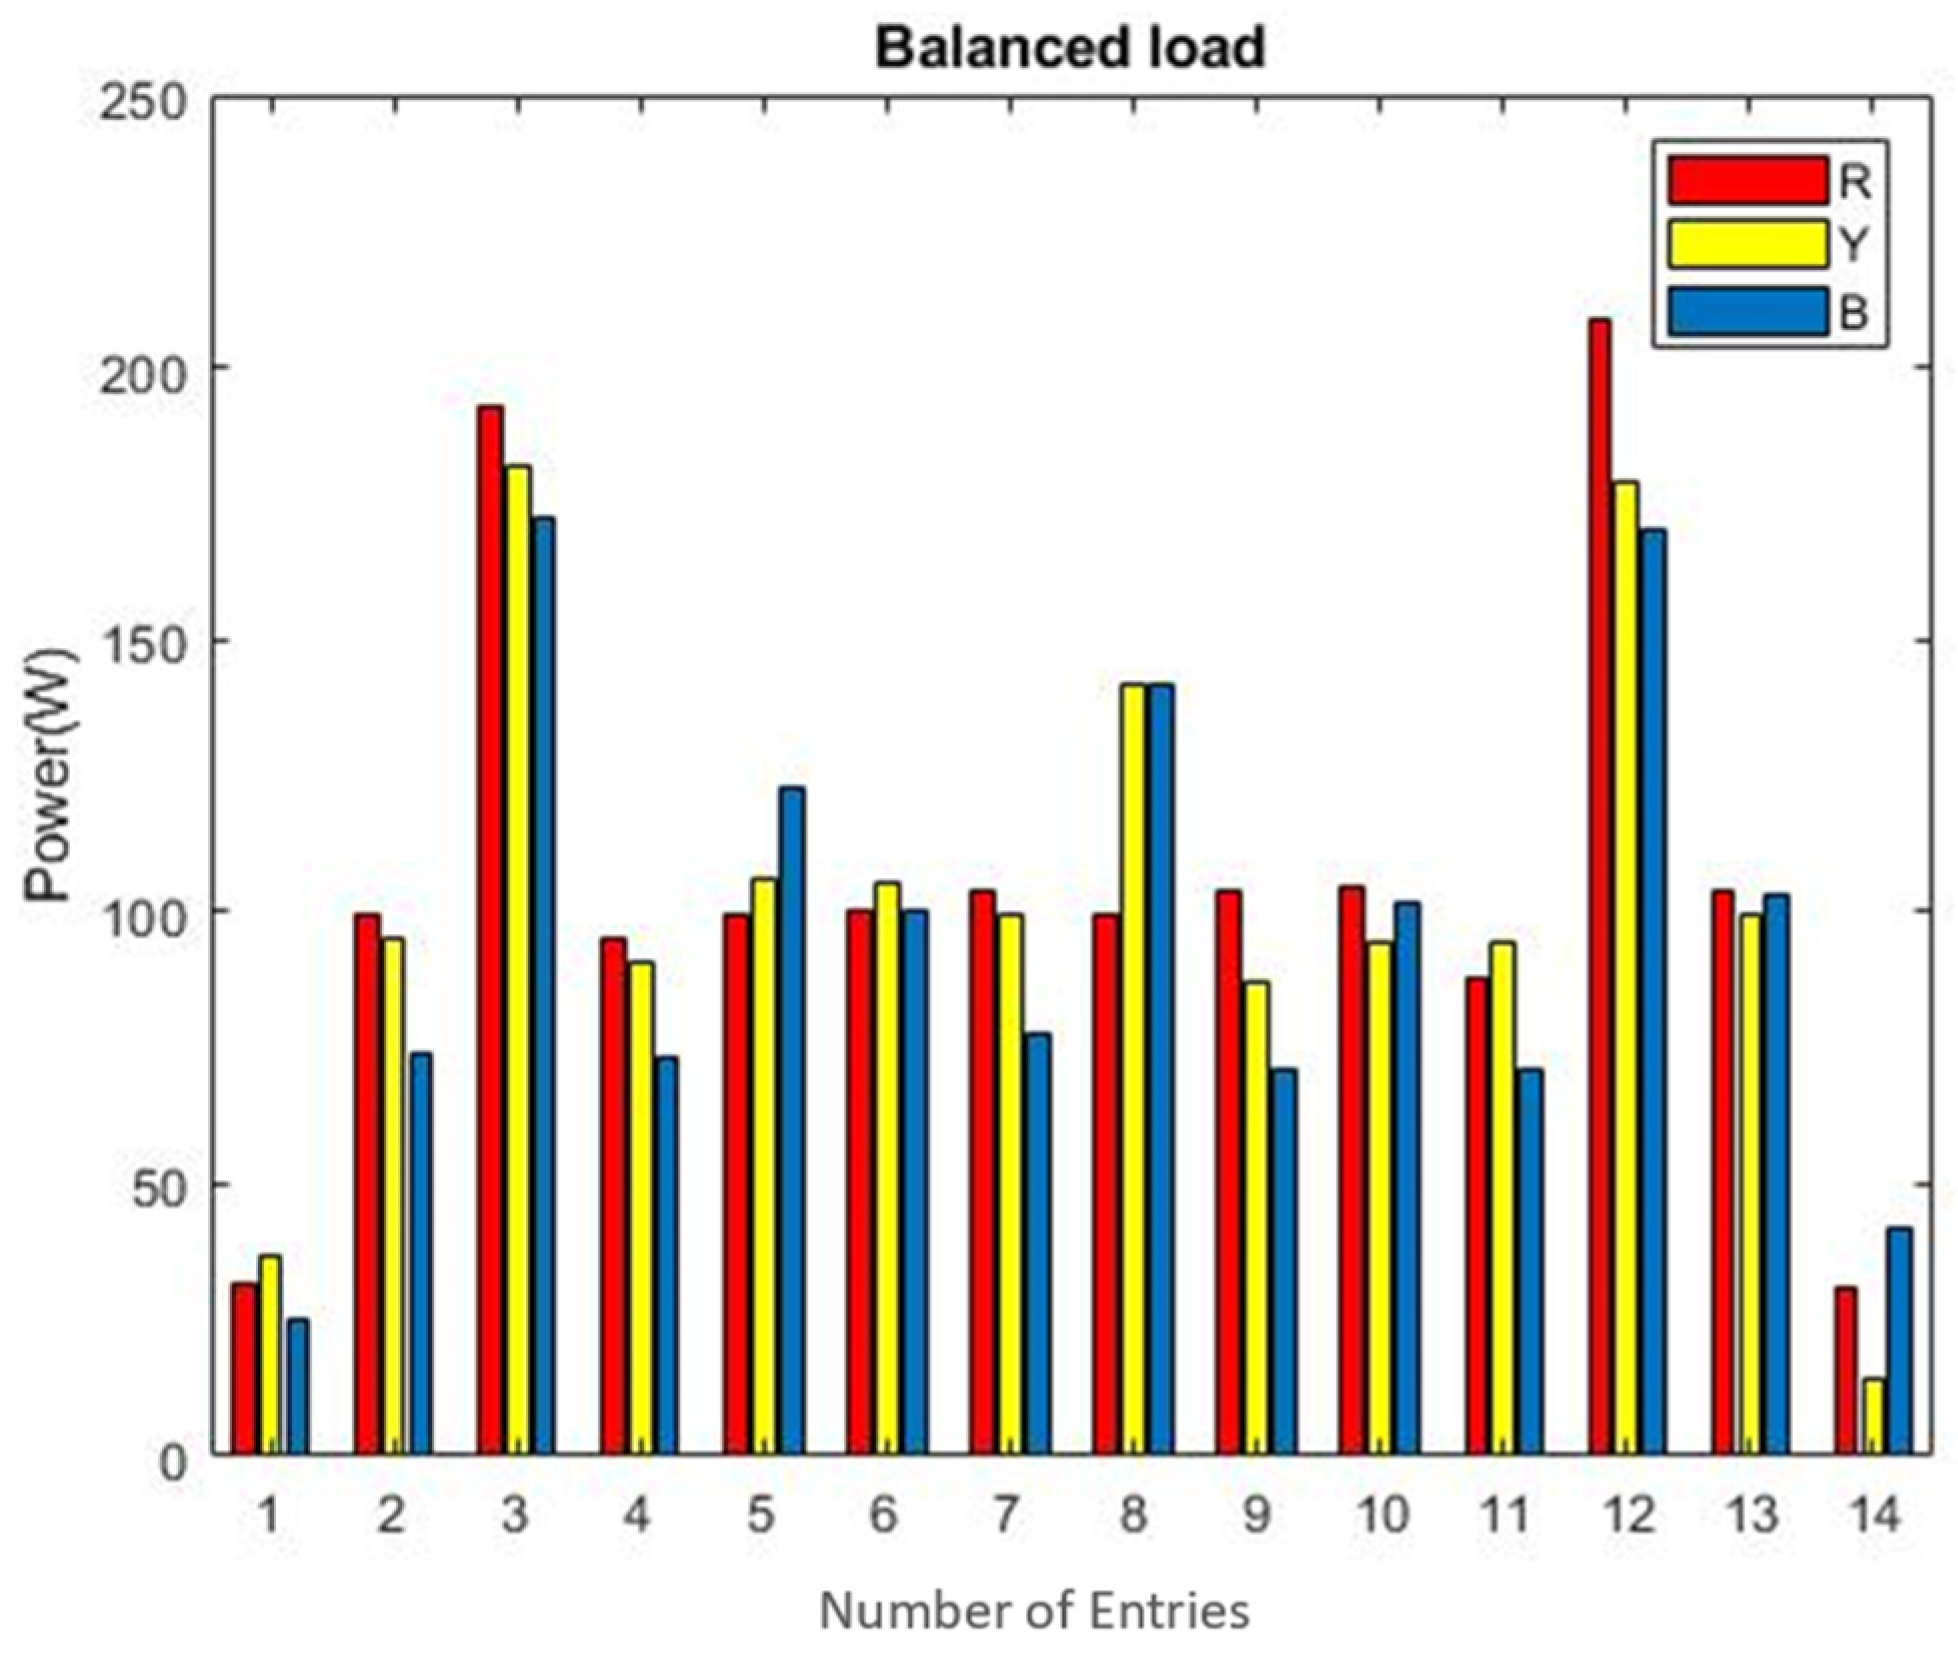
| UNBALANCED LOAD(A) | → | BALANCED LOAD(A) | ||||
|---|---|---|---|---|---|---|
| R | Y | B | R | Y | B | |
| 23.9 | 14.2 | 10.7 | 18.1 | 16.4 | 14.2 | |
| 9 | 13.6 | 25.8 | 17.3 | 16.7 | 13.6 | |
| 22 | 14.6 | 11 | 16.5 | 16.4 | 14.6 | |
| 10.4 | 24.4 | 13.7 | 17.5 | 17.4 | 13.5 | |
| 14.4 | 17.2 | 9.6 | 13.5 | 14.3 | 13.4 | |
| 18.2 | 20.4 | 9.4 | 15 | 14.7 | 14.9 | |
| 10.2 | 14.2 | 23.2 | 17 | 16.5 | 14.2 | |
| 20 | 13.3 | 9.7 | 14.8 | 14.8 | 13.5 | |
| 8.9 | 12.5 | 16.9 | 12.9 | 12.5 | 12.9 | |
| 13.5 | 21.4 | 11.4 | 17.4 | 14.2 | 13.5 | |
| 9.4 | 13.8 | 21.4 | 17.4 | 13.9 | 15.4 | |
| 19.8 | 10.2 | 13.3 | 15.5 | 14.4 | 13.3 | |
| 16.9 | 15.1 | 8.9 | 12.9 | 12.9 | 13.8 | |
| 10.2 | 13.8 | 21.4 | 17.4 | 14.2 | 13.8 | |
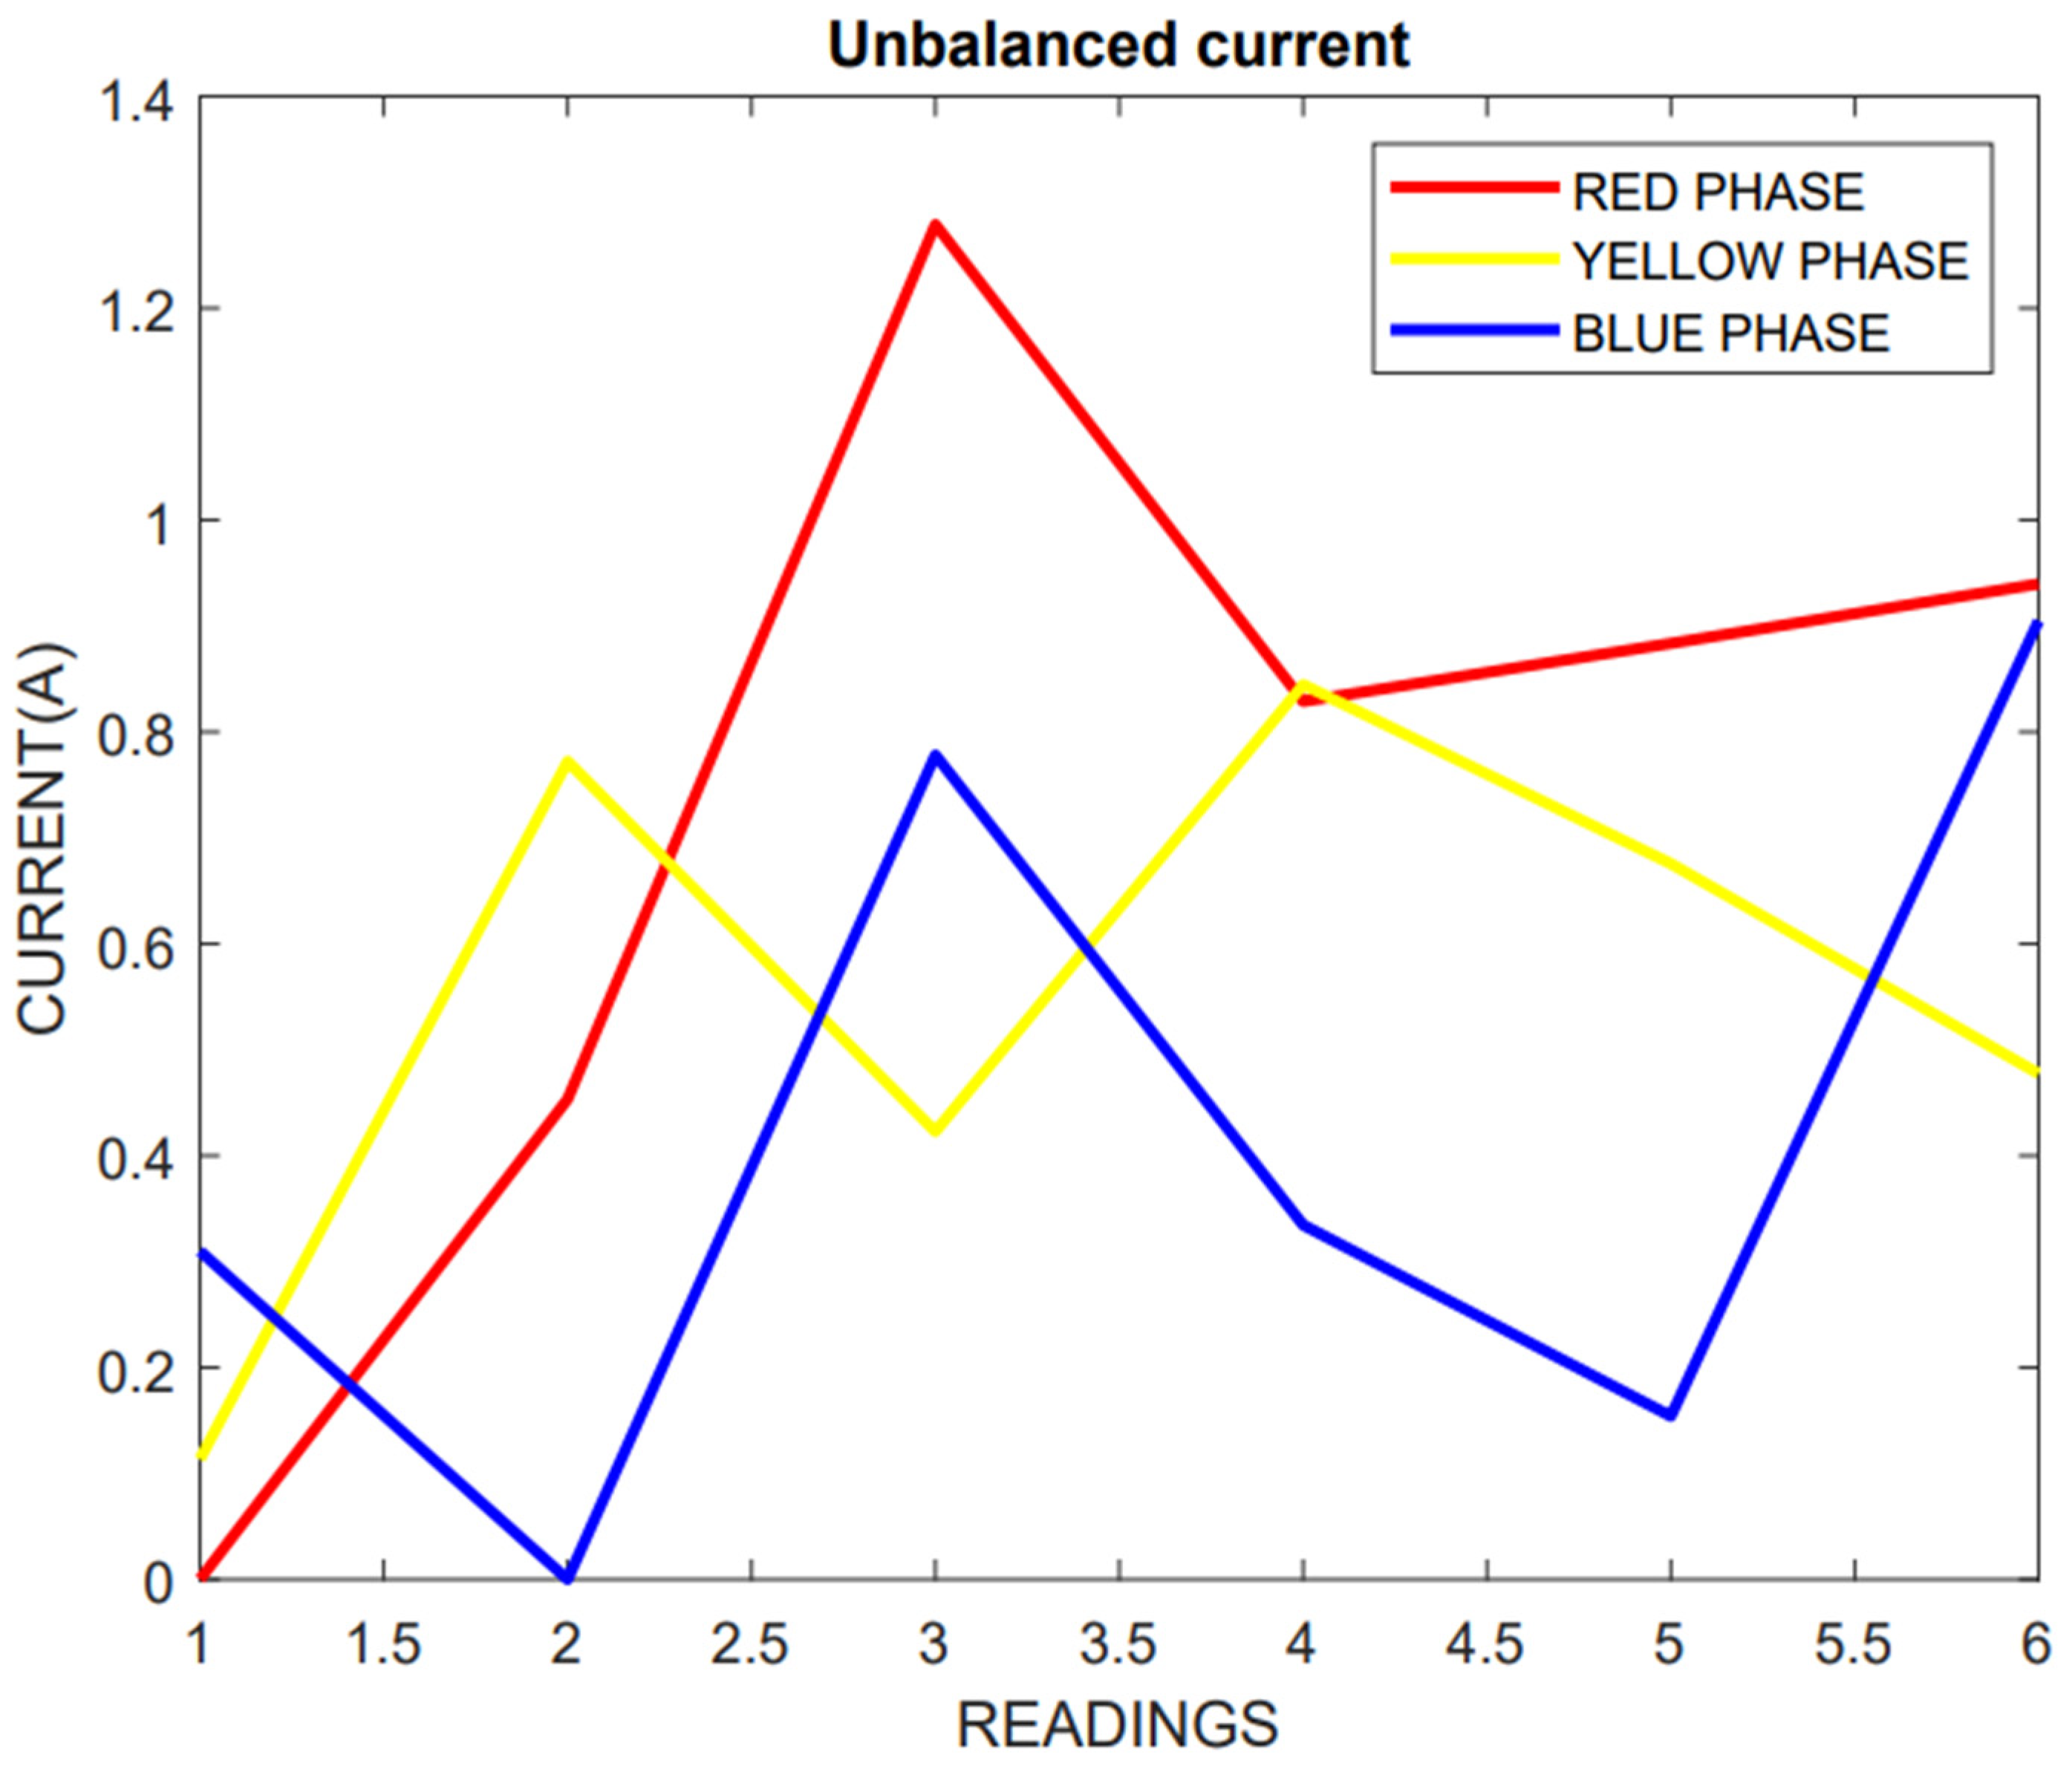
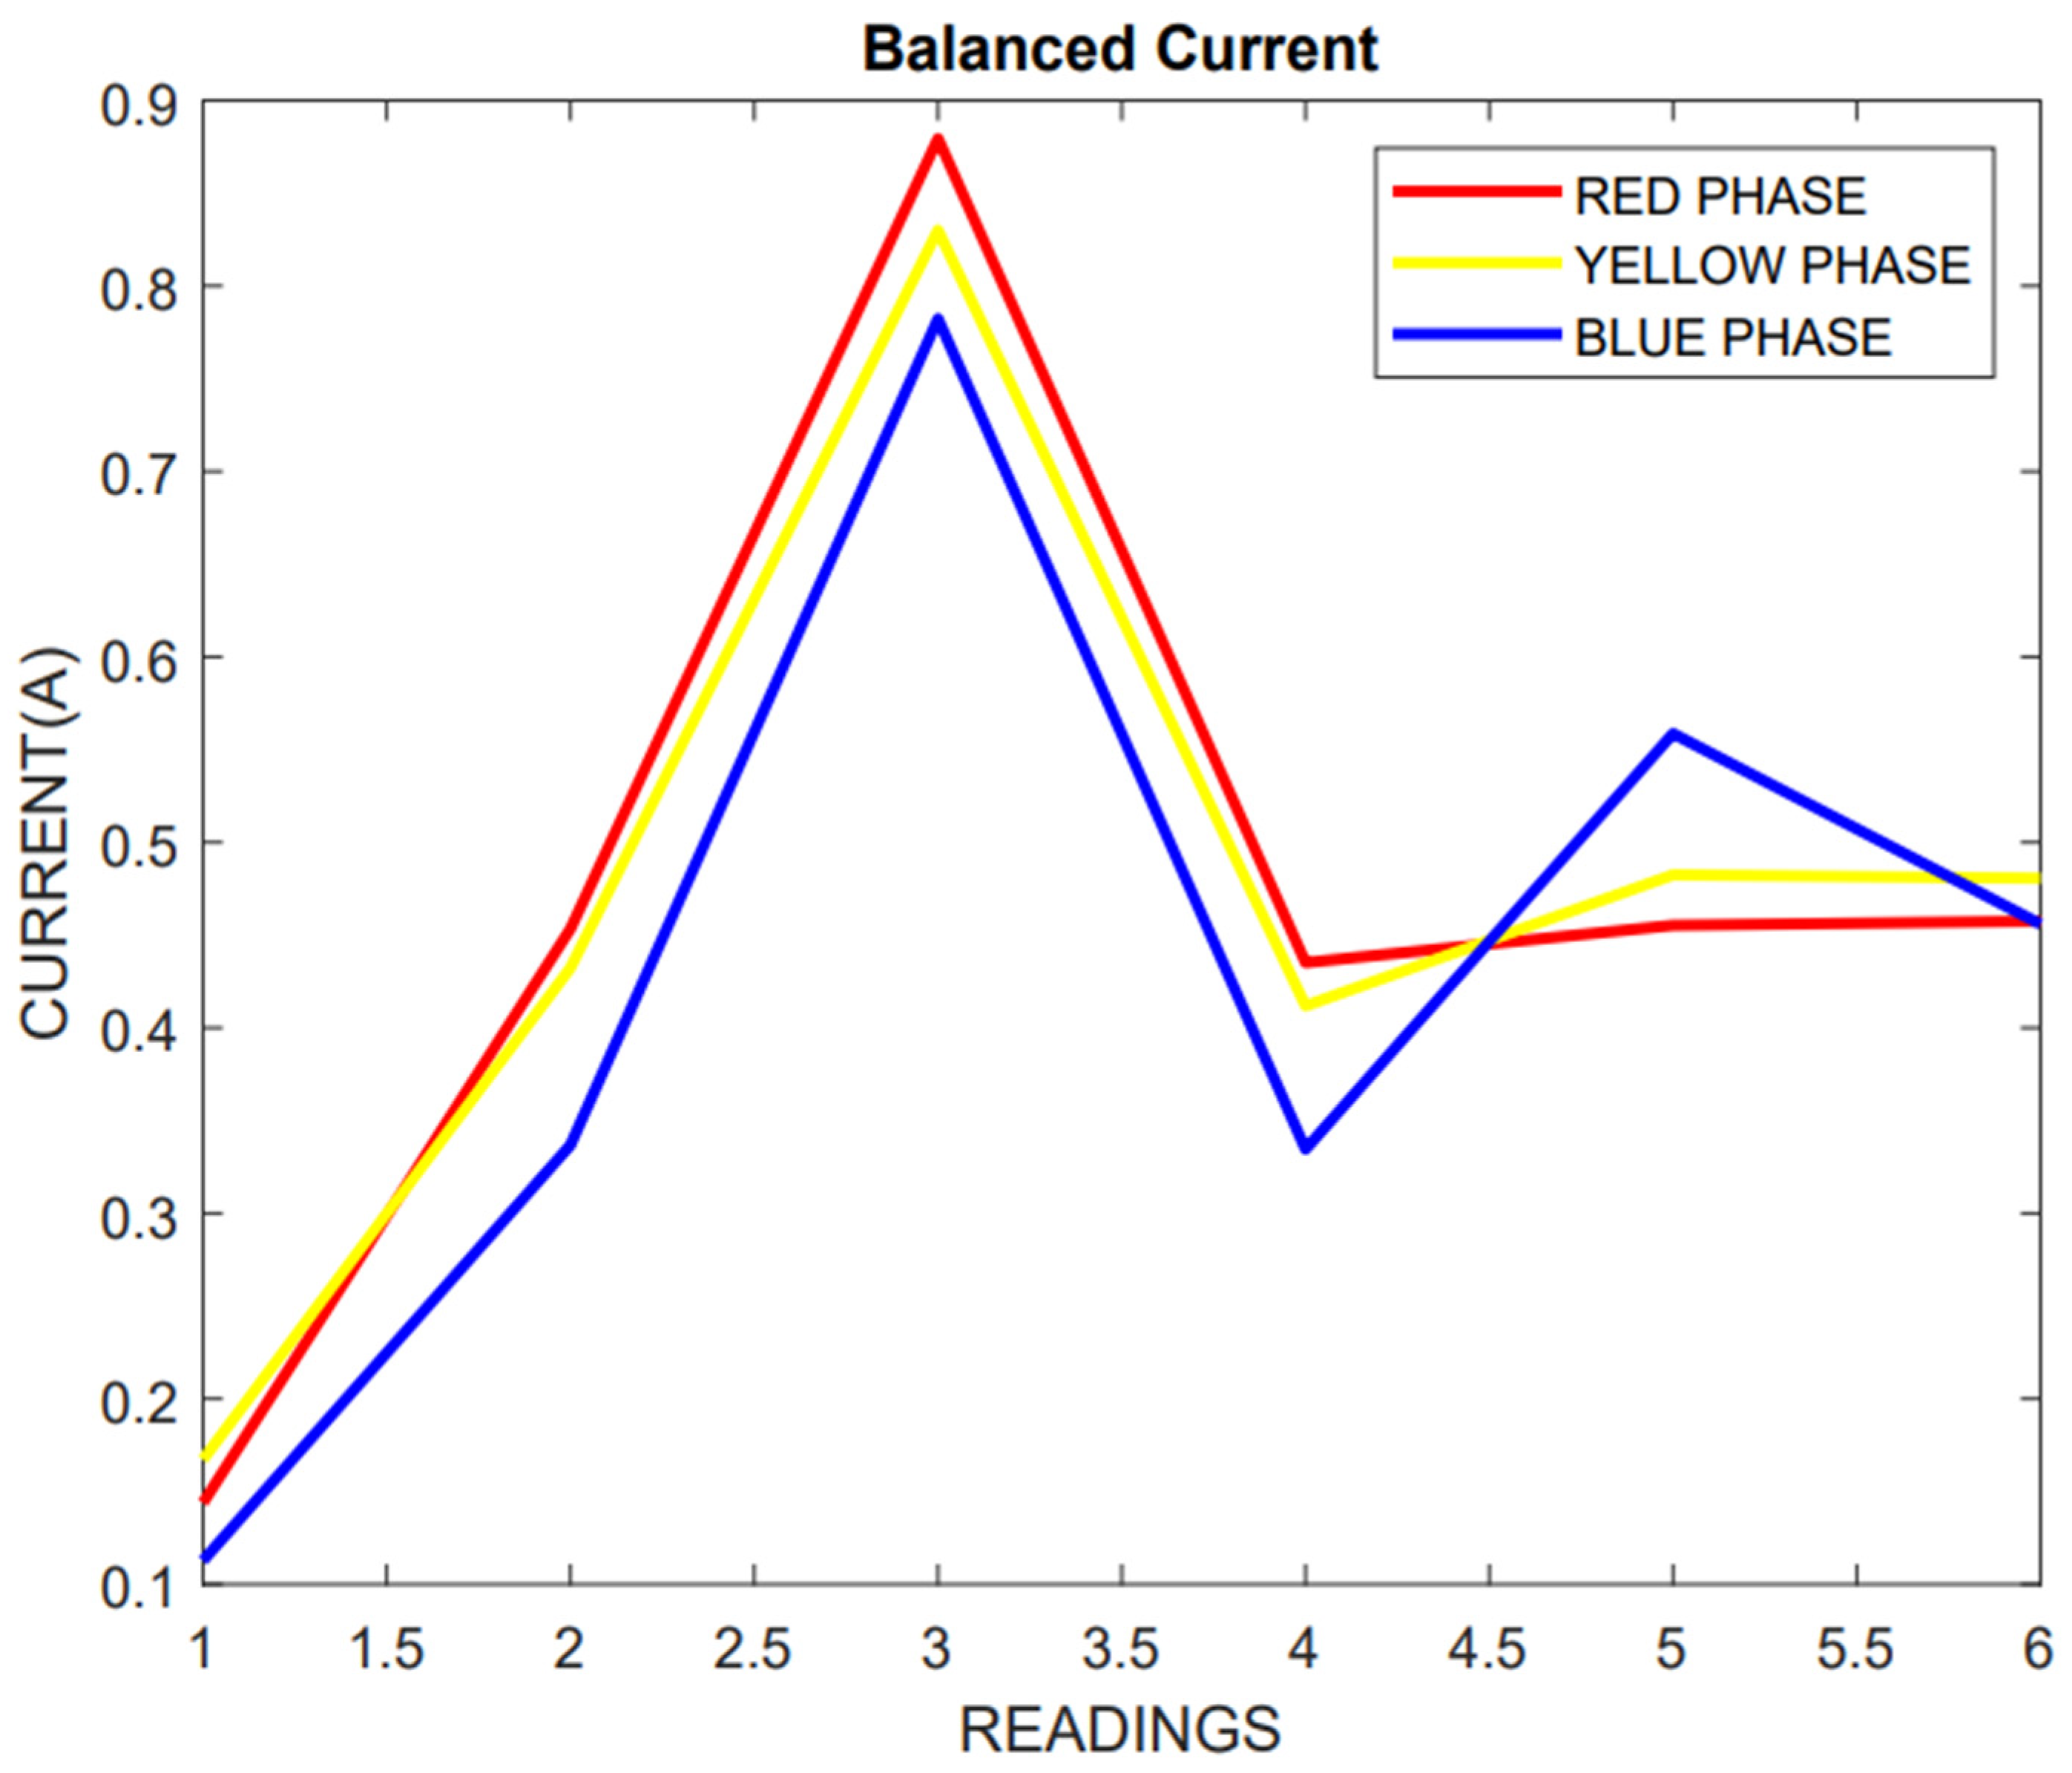
| UNBALANCED LOAD(A) | → | BALANCED LOAD(A) | ||||
|---|---|---|---|---|---|---|
| R | Y | B | R | Y | B | |
| 1.27 | 0.42 | 0.77 | 0.88 | 0.83 | 0.78 | |
| 0.11 | 0 | 0.31 | 0.14 | 0.16 | 0.11 | |
| 0.45 | 0.77 | 0 | 0.45 | 0.43 | 0.33 | |
| 0 | 0.84 | 0.33 | 0.43 | 0.41 | 0.33 | |
| 0.67 | 0.67 | 0.15 | 0.55 | 0.48 | 0.45 | |
| 0.47 | 0 | 0.90 | 0.45 | 0.47 | 0.45 | |
| 0.82 | 0.45 | 0 | 0.47 | 0.45 | 0.35 | |
| 0.87 | 0.22 | 0.64 | 0.64 | 0.45 | 0.64 | |
| 0 | 0.39 | 0.79 | 0.39 | 0.47 | 0.32 | |
| 0.93 | 0.42 | 0 | 0.47 | 0.42 | 0.46 | |
| 0 | 0.82 | 0.31 | 0.39 | 0.43 | 0.32 | |
| 1.34 | 0.42 | 0.77 | 0.94 | 0.81 | 0.77 | |
| 0.56 | 0.45 | 0.37 | 0.46 | 0.45 | 0.47 | |
| 0.13 | 0.25 | 0 | 0.14 | 0.06 | 0.19 | |
Disclaimer/Publisher’s Note: The statements, opinions and data contained in all publications are solely those of the individual author(s) and contributor(s) and not of MDPI and/or the editor(s). MDPI and/or the editor(s) disclaim responsibility for any injury to people or property resulting from any ideas, methods, instructions or products referred to in the content. |
© 2023 by the authors. Licensee MDPI, Basel, Switzerland. This article is an open access article distributed under the terms and conditions of the Creative Commons Attribution (CC BY) license (https://creativecommons.org/licenses/by/4.0/).
Share and Cite
Khan, A.; Ali, M. Three-Phase Load Balancing in Distribution Systems Using Load Sharing Technique. Eng. Proc. 2023, 46, 18. https://doi.org/10.3390/engproc2023046018
Khan A, Ali M. Three-Phase Load Balancing in Distribution Systems Using Load Sharing Technique. Engineering Proceedings. 2023; 46(1):18. https://doi.org/10.3390/engproc2023046018
Chicago/Turabian StyleKhan, Abbas, and Muhammad Ali. 2023. "Three-Phase Load Balancing in Distribution Systems Using Load Sharing Technique" Engineering Proceedings 46, no. 1: 18. https://doi.org/10.3390/engproc2023046018