Proceeding Paper

Weldability and Mechanical Properties of Fe/Al Dissimilar Joints by Resistance Spot Weld Bonding †

Department of Mechanical Engineering, Faculty of Engineering, Osaka Institute of Technology, Osaka 535-8585, Japan
*
Author to whom correspondence should be addressed.
Presented at the 15th International Aluminium Conference, Québec, QC, Canada, 11–13 October 2023.
Eng. Proc. 2023, 43(1), 47; https://doi.org/10.3390/engproc2023043047
Published: 8 October 2023
(This article belongs to the Proceedings of The 15th International Aluminium Conference)

Abstract

:
In this study, weldability and mechanical properties of resistance spot weld bonding were investigated when adhesives with different properties were used. The results show that weldability is improved in resistance spot weld bonding when the adhesive is discharged from the weld zone by using a multi-stage current application technique. In terms of mechanical properties, weld-bonded joints using high-strength adhesives showed improved strength because both the weld and the adhesive are subjected to loads. On the other hand, when a low-strength adhesive is used, the adhesive and the weld fail separately, and the CTS is not improved. In addition, in the resistance spot weld bonding of Fe-Al, the IMC formation area is expanded, and the CTS is improved by using a 3-stage current application.

1. Introduction

In recent years, reduction of CO2 emissions has been demanded as a measure of environmental problems. Therefore, the automotive industry is considering a multi-material structure for automobile bodies that combines steel and aluminum alloy in order to achieve lower fuel consumption by reducing the weight of automobiles [1]. To realize this structure, it is necessary to develop a joining technique for steel and aluminum, and this joining technique was developed mainly by resistance spot welding [2]. In resistance spot welding of dissimilar materials of steel and aluminum alloy, intermetallic compounds (IMCs) formed at the joining interface [3]. Therefore, it is important to form IMCs without defects. Furthermore, corrosion caused by dissimilar materials is a problem in resistance spot welding of steel and aluminum alloys [4]. Therefore, resistance spot weld bonding, which combines resistance spot welding with an adhesive that acts as a sealant, has been attracting attention [5]. In resistance spot weld bonding, it is important to consider weldability because the adhesive affects various phenomena at the joining interface during welding. In addition to the state of formation of IMC, the strength of the adhesive is considered to have an effect on the mechanical properties of the joint. However, the effect of adhesives on IMC formation and mechanical properties of resistance spot welded joints of steel and aluminum alloys has not been clarified.
In this study, weldability and mechanical properties of resistance spot weld bonding with adhesives of different properties are investigated.

2. Methods

2.1. Test Materials and Welding Conditions

In this study, a normal resistance spot welded joint without adhesive is referred to as a BASE joint, and a resistance spot weld bonded joint combining adhesive and resistance spot welding is referred to as a WB joint. Two types of adhesives, one-component thermosetting epoxy resin adhesives TS-501 and SD-16, are used as adhesives, and among WB joints, those using SD-16 and TS-501 as adhesives are called SD-16 joints and TS-501 joints. The composition and mechanical properties of the 980 MPa-class high-strength steel sheet and A6061 alloy are shown in Table 1 and Table 2. Moreover, the chemical composition of the adhesives used is shown in Table 3 and Table 4.
The power source of the welding machine was a DC inverter with a power frequency of 60 Hz, and the upper electrode was the positive electrode. Adhesives were applied to the center of the Al alloy at 20 mm × 20 mm, 0.5 mm thick, and a steel sheet was overlaid on top of the adhesive and welded to the center of the specimen. The adhesives were held in an electric furnace set at 180 °C for TS-501 and 170 °C for SD-16 for 30 min to cure. In the first experiment, the weldability of BASE and WB was set at 5 kN of applied pressure, 12 kA of current, and 12 cycles of current time for the purpose of comparison. Other welding conditions are shown in Table 5. The conditions in Table 5a were set to investigate the effect of heat input control by current waveform on the joint condition to promote adhesive discharge in WB joints. The conditions in Table 5b were set to compare the effect of adhesive on the BASE and WB CTS. The conditions in Table 5c were set to form IMC over the entire joint area using a 3-stage current flow. In addition, a pressure holding time of 6 cycles is provided between the 2nd and 3rd current time.

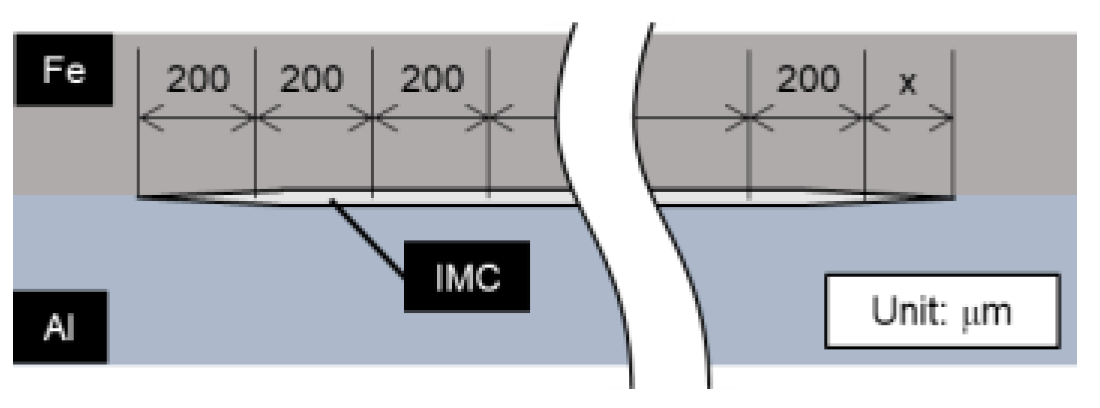
2.2. Method of Observing Specimen and Measuring IMC Thickness

The following is a description of how to observe the specimens. To observe the welds, the welded specimens were cut at the center of the welds, filled with resin, and polished with water-resistant abrasive paper #400, #800, #1500, #2000, and #4000, in that order, and buffed to a mirror finish. The thickness of the IMC was measured at every 200 µm interval from the left edge of the IMC, as shown in Figure 1, at 1000× magnification. The IMC thickness distribution was calculated by repeating this process for all the images taken. The IMC thickness at the right end is plotted on the graph with position x µm.

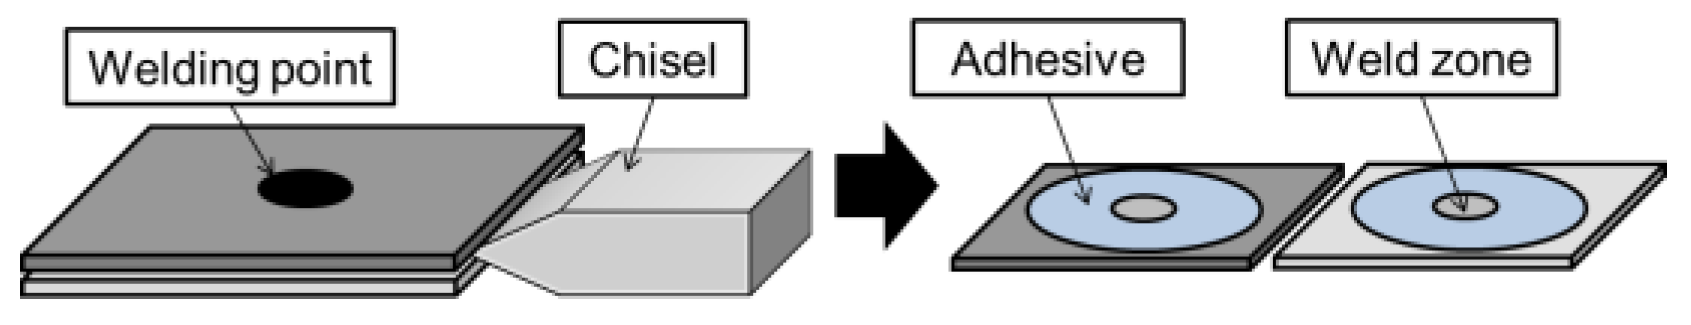
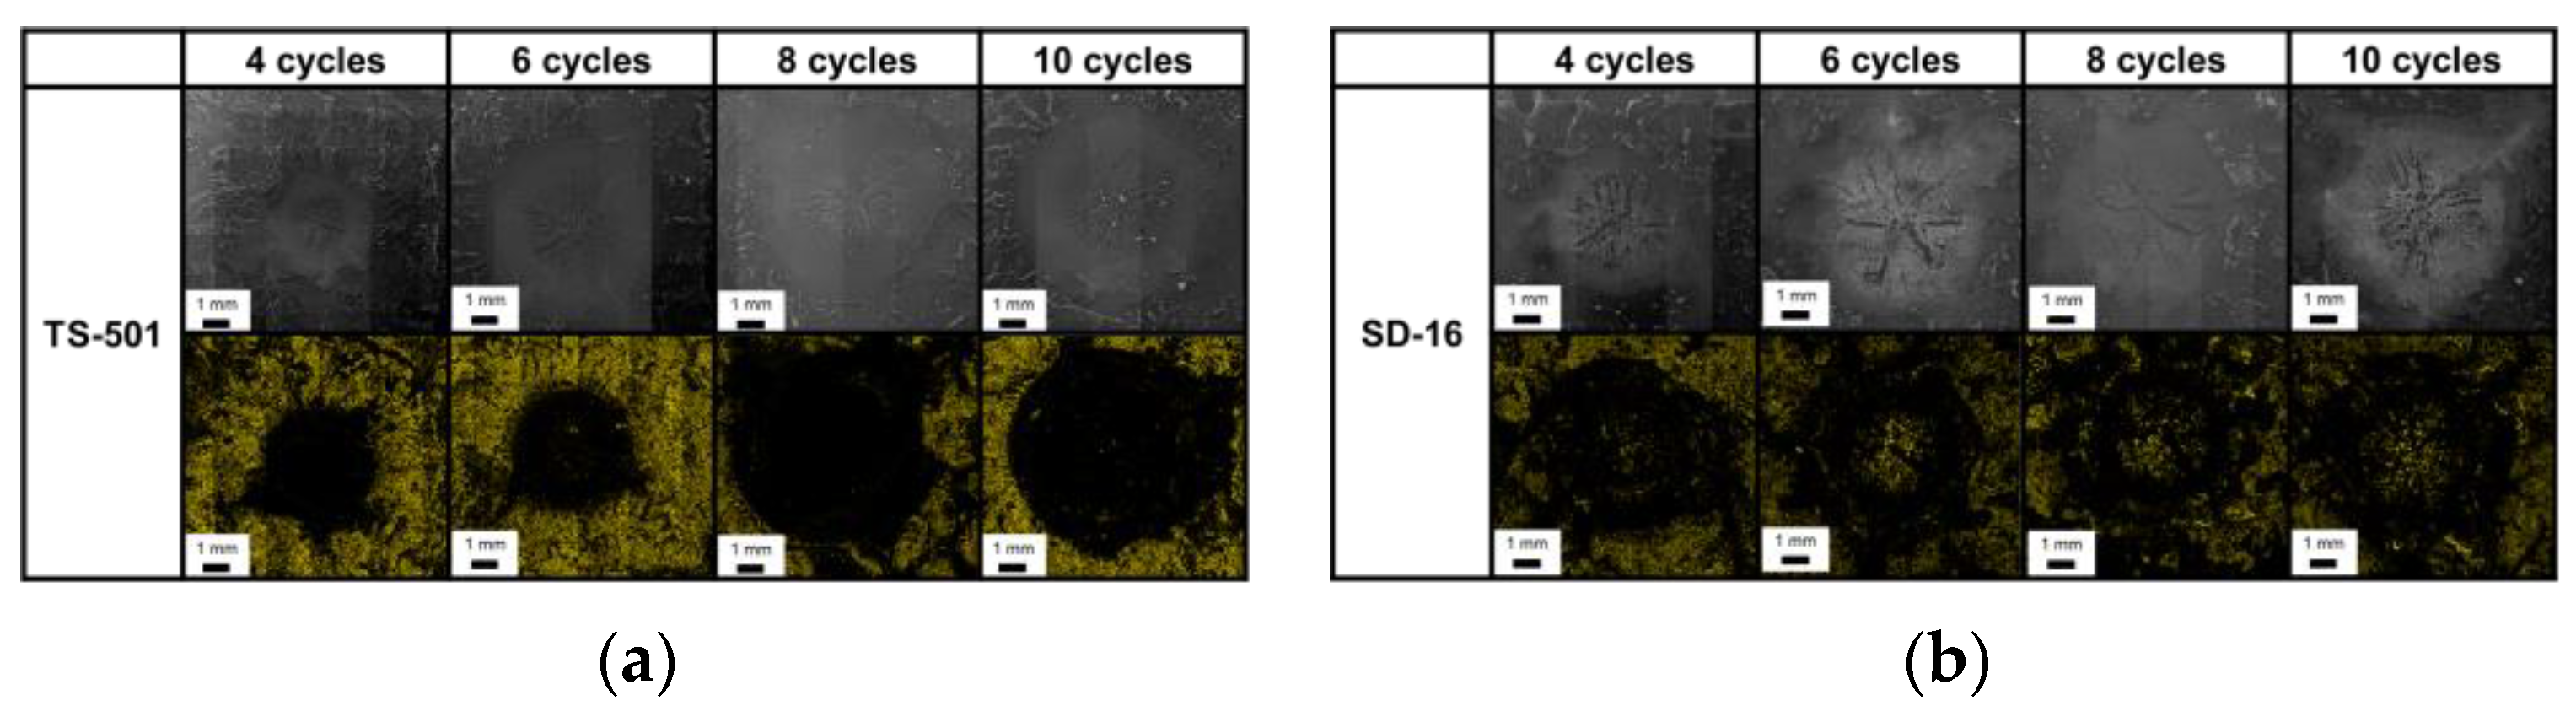
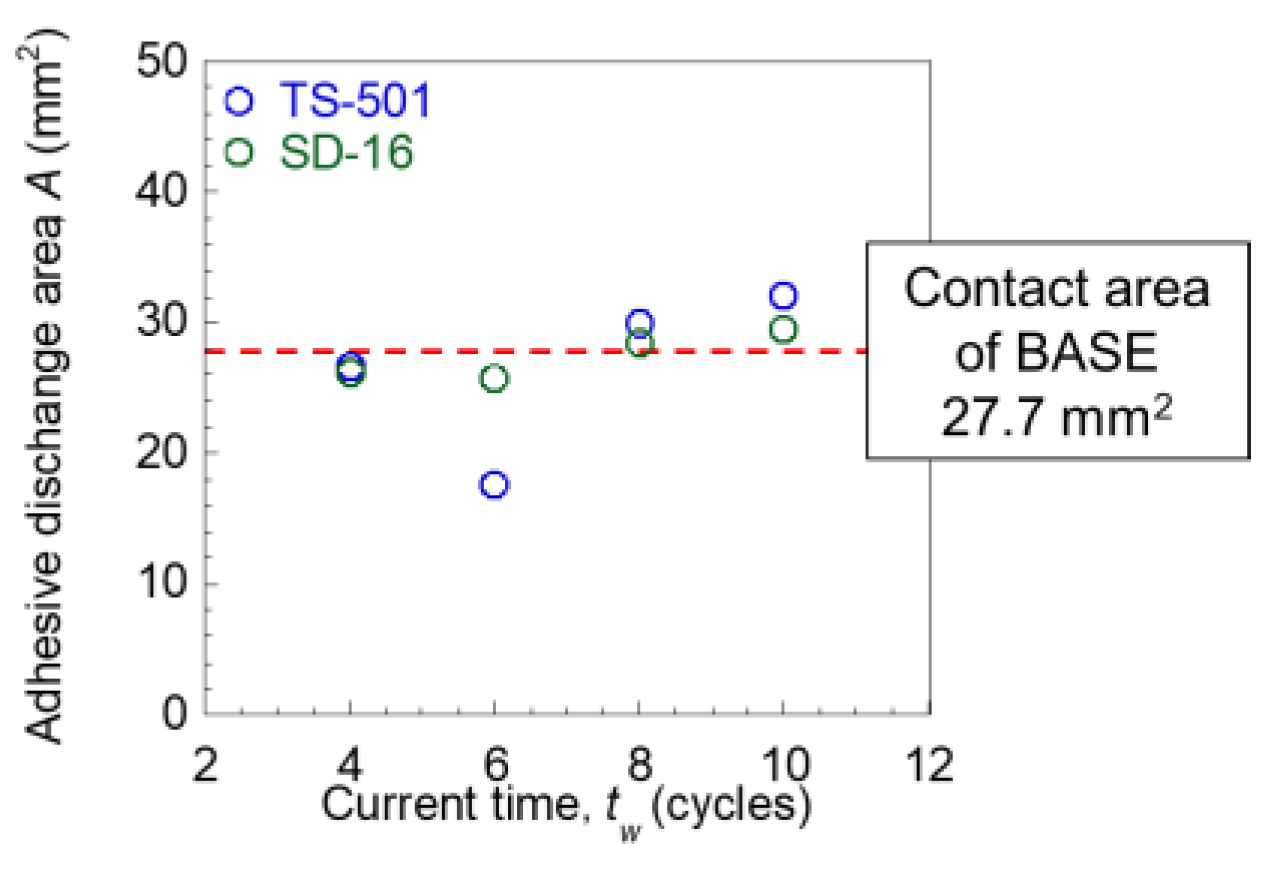
2.3. Method of Obtaining the Area of Adhesive Discharge

As shown in Figure 2, the specimen was peeled off with a chisel after welding, and the area where Ca was exposed at the weld was photographed by scanning electron microscopy and energy-dispersive X-ray analysis. The adhesive contained Ca due to calcium carbonate. The area where Ca remained was assumed to be the area where adhesive was present, and the area where no Ca remained was measured as the area of adhesive discharge.

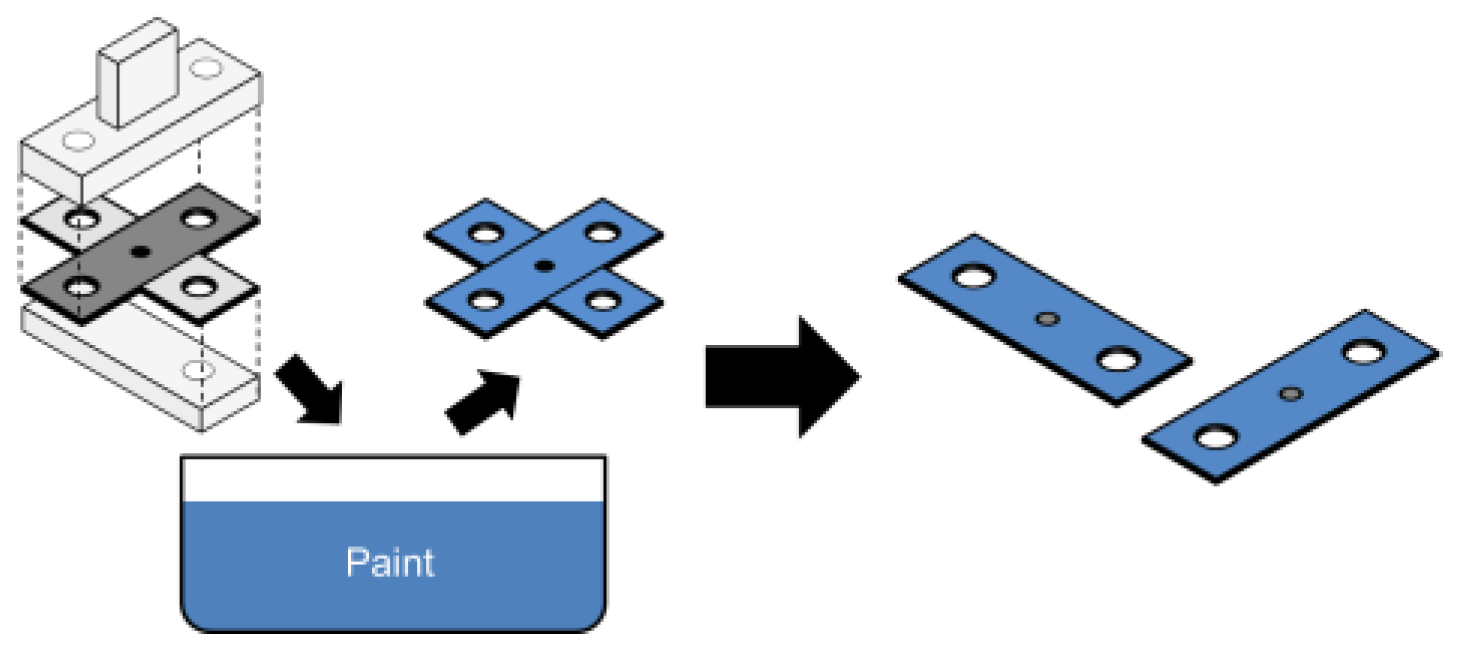
2.4. Method for Measuring Cross-Tension Strength and Observing Cracks

To investigate mechanical properties, cross-tension test specimens were prepared in accordance with JIS Z 3137. The test was conducted at a tensile speed of 5.0 mm/min. The maximum value of the load–displacement curve obtained in the test was used as the cross-tension strength (CTS). As shown in Figure 3, after stopping the test at an arbitrary load, the joint was dipped in paint, the paint was allowed to dry, and a cross-tension test completely fractured the joint to observe crack propagation behavior.

3. Results

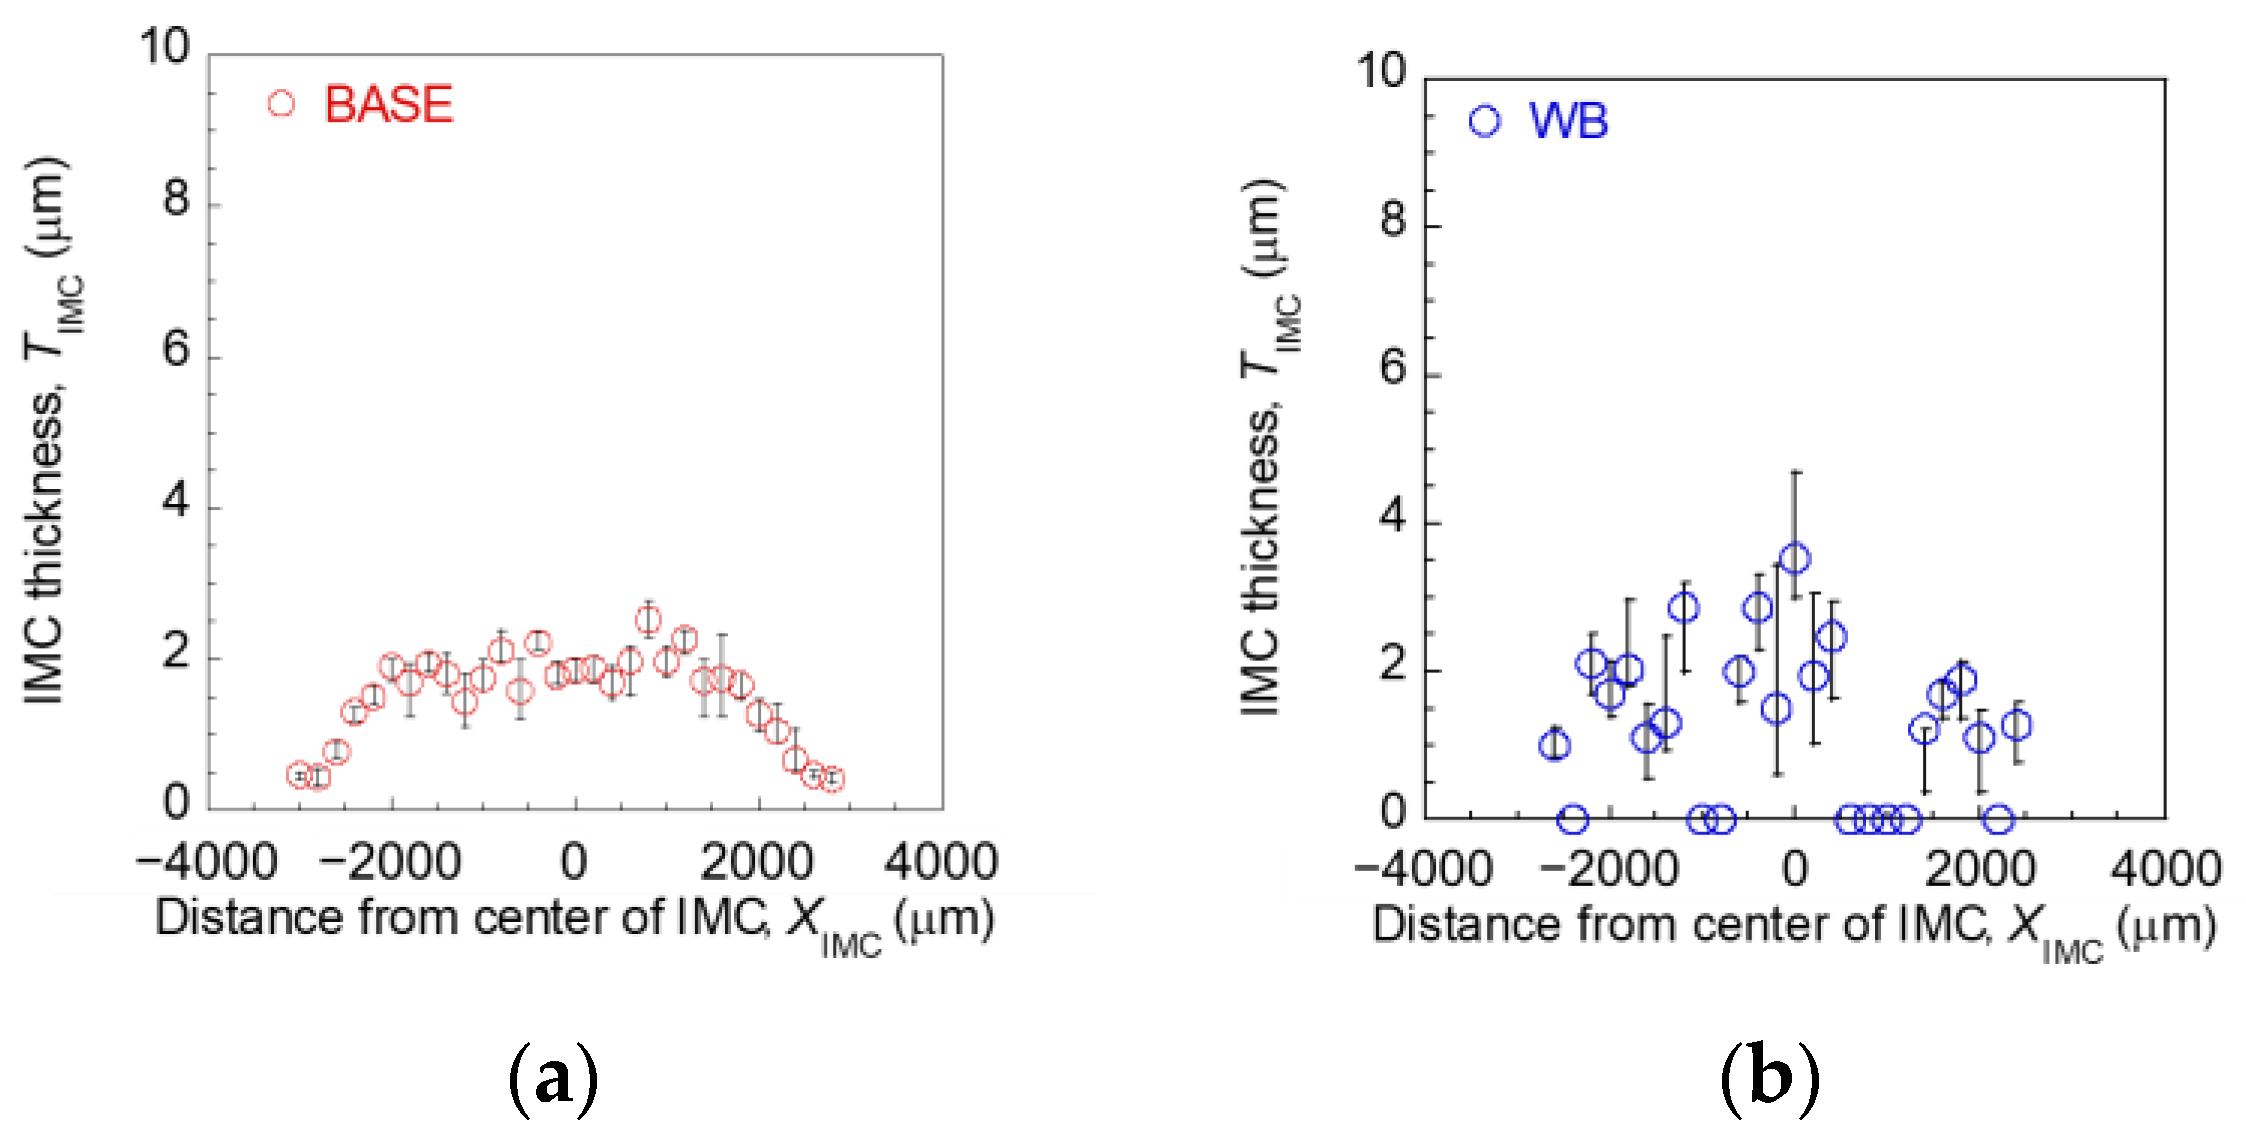
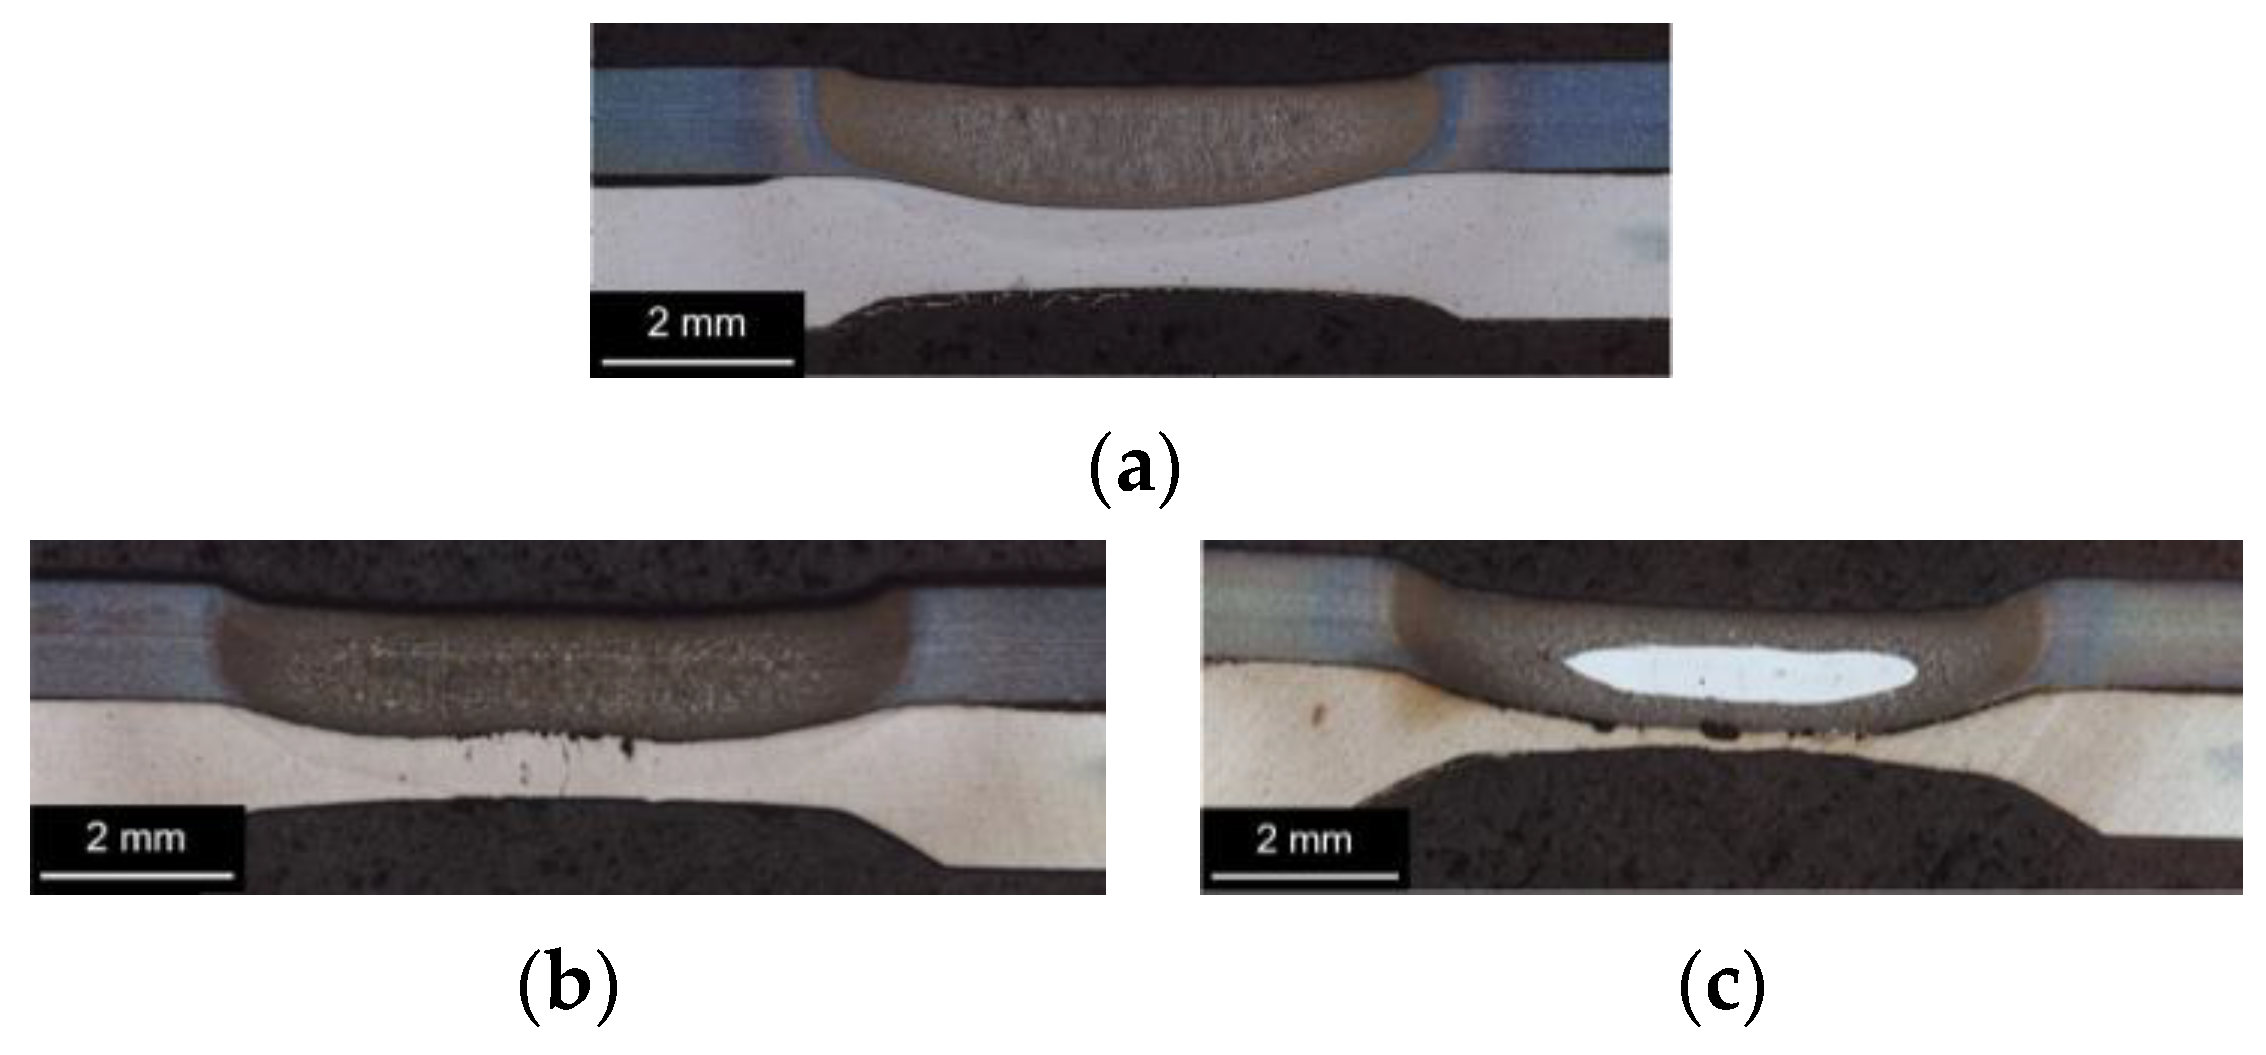
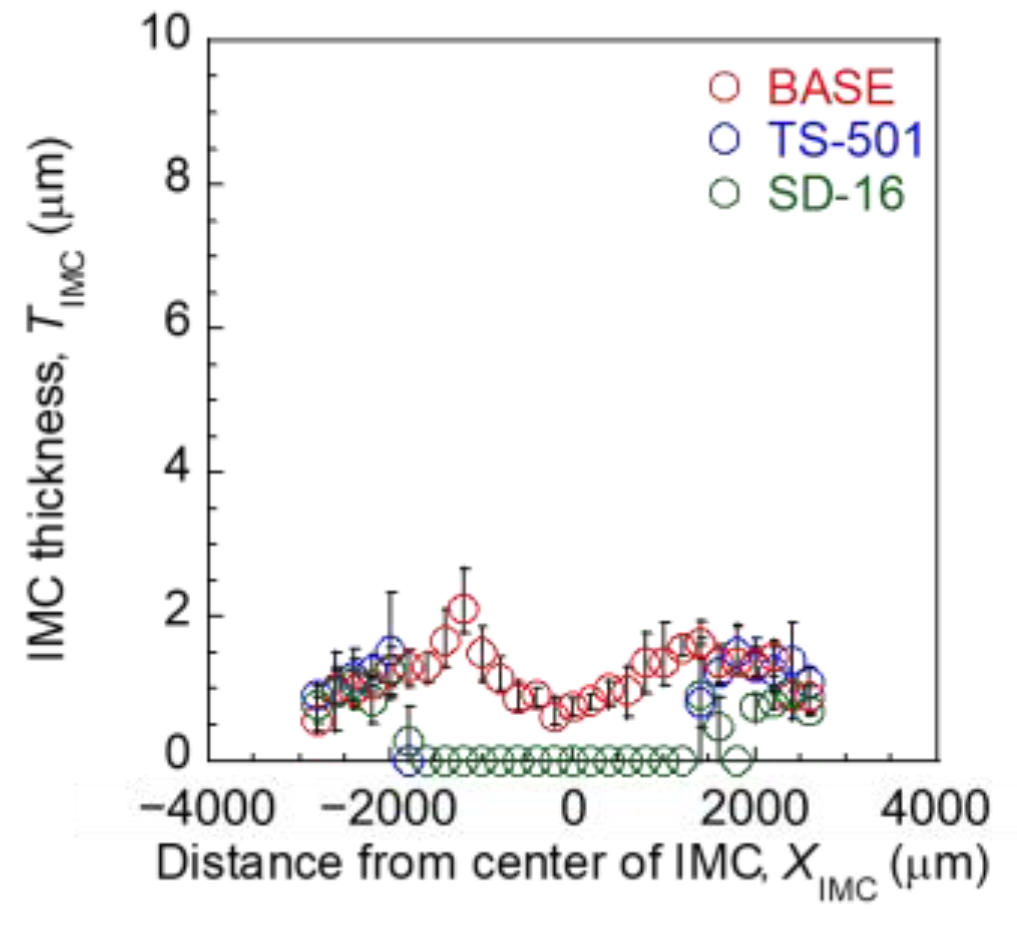
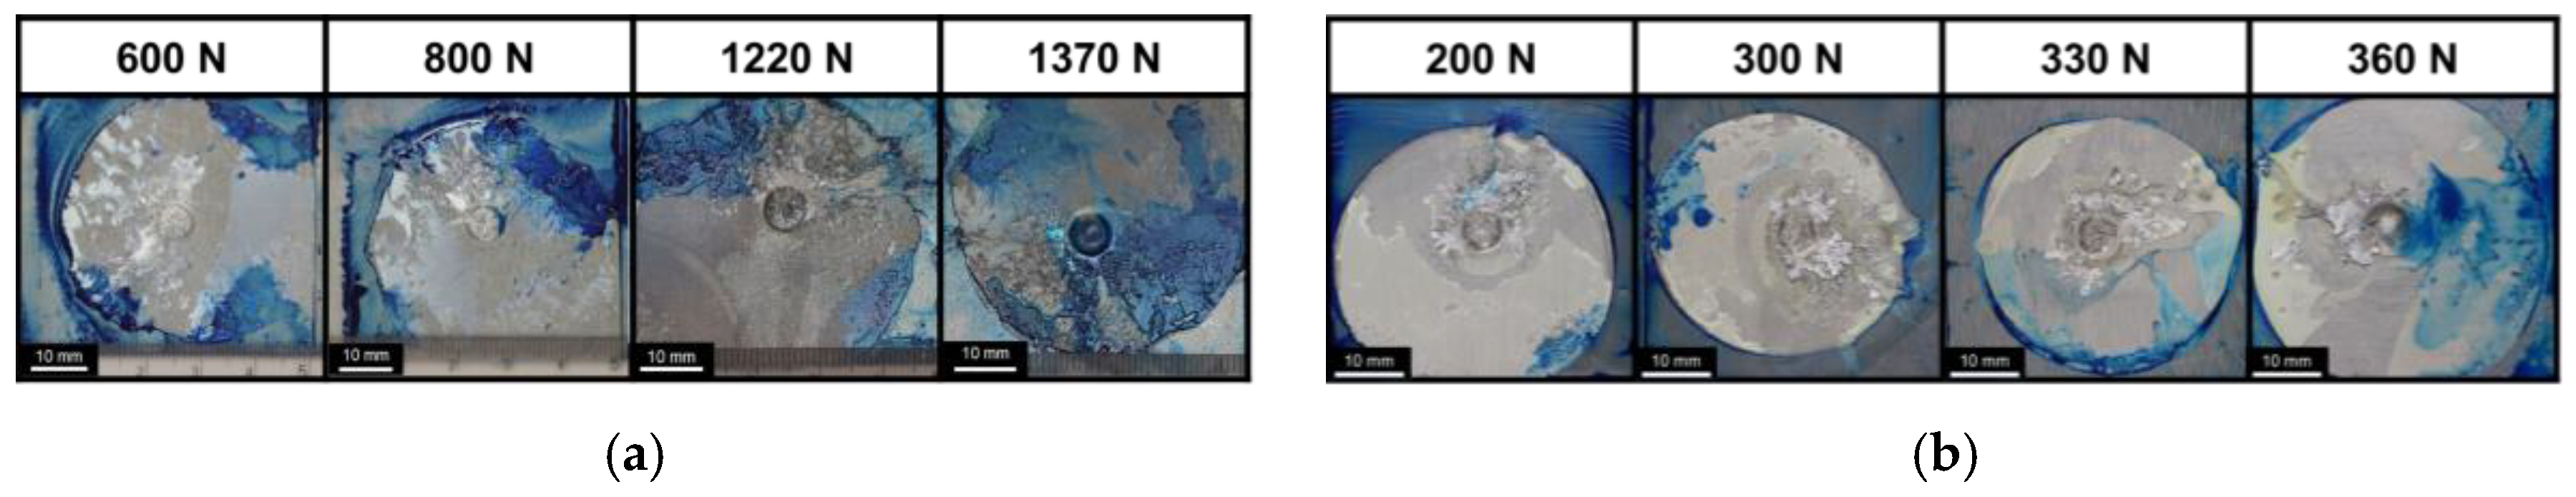
3.1. Effects of Adhesives on IMC Formation State in Fe-Al Resistance Spot Weld Bonding

Figure 4 shows the IMC thickness distribution of BASE and WB joints welded under the welding conditions indicated in the text of Section 2.1. Figure 4a shows that the IMCs are thicker in the center and thinner toward the edge of the BASE. On the other hand, Figure 4b shows that the WB joint has a mixture of areas where IMCs are not formed and areas where IMCs are formed. In addition, the maximum IMC thickness of the BASE joint is 2.0 µm, while the maximum IMC thickness of the WB joint is more than 4.0 µm, indicating that thicker IMCs are formed in the joint compared to the BASE joint. These results indicate that the IMC formation conditions of the BASE and WB joints are significantly different. This is thought to be due to the fact that the adhesive that is not ejected from the weld affects the welding phenomenon. In addition, a thicker IMC is formed in the WB joint than in the BASE joint. This is considered to be due to the adhesive reducing the contact area at the bonding interface and increasing the heat generation. Figure 5 shows cross-sectional photographs of the BASE, TS-501, and SD-16 joints. Figure 5 shows that no porosities are formed in the molten Al alloy at the BASE joint, while porosities are formed at the SD-16 and TS-501 joints. This is thought to be due to the thermal decomposition of the adhesive during welding and gas entrapment, resulting in the formation of porosity. Furthermore, the presence of porosities near the joining interface prevented contact between the steel and Al alloy and interdiffusion between Fe and Al atoms, which is believed to have resulted in the absence of IMC formation, as shown in Figure 4b. In addition, Comparing the cross sections of the welds of the TS-501 and SD-16 joints from Figure 5b,c, it can be seen that Al flows into Fe to form a nugget melt in the SD-16 joint that is a mixed melt of Fe and Al is generated. This result is thought to be due to the fact that the adhesive at the joining interface is difficult to discharge in SD-16, and the heat generation increases as the contact area decreases and the molten part of Fe mixes with the molten part of Al. Therefore, it is difficult to form a continuously distributed IMC with an adhesive that tends to remain at the joining interface.
The discharge of adhesive in resistance spot weld bonding of steel and Al alloy is considered to be one of the most important factors for the IMC of the joint. Thus, a multi-stage current process in which the primary welding current is applied before the main welding current is considered to be effective in discharging adhesive by increasing heat generation. Accordingly, welding conditions to obtain IMC thickness distribution similar to that of BASE joints using the multi-stage current process were investigated. As a preliminary study to conduct multi-stage current-to-discharge adhesive, the relationship between primary current and the area of adhesive discharge was examined. Figure 6 shows a photograph of Ca distribution in the weld observed by the method described in Section 2.3 for the joints welded under the conditions in Table 5a, and Figure 7 shows the relationship between the current time and the adhesive discharge area calculated from the Ca distribution in Figure 6. Figure 6 shows that Ca can be discharged from the weld in the TS-501 joint, whereas Ca remains in the center of the weld in the SD-16 joint. Therefore, the formation of a mixed melt of Fe and Al at the SD-16 joint in Figure 5 is thought to be due to the increased heat generation and melting of Fe and Al due to the difficulty in expelling the adhesive. Furthermore, the contact area of both TS-501 and SD-16 at 10 kA-8 cycles is larger than that of the BASE joint, indicating that the adhesive is sufficiently discharged. Therefore, the primary current condition is set at 10 kA-8 cycles.
Figure 8 and Figure 9 show cross-sectional photographs of joints constructed under the welding conditions in Table 5b and the thickness distribution of IMC. Figure 8 shows that porosities are reduced in both TS-501 and SD-16 conditions. In addition, the IMC thickness distribution in Figure 9 shows that the IMC thickness at the edge of the formation range is equivalent to that of the BASE joint, although no IMC is formed in the center of the joint. These results indicate that the discharge of adhesive at the weld interface by an appropriate current pattern is effective for the formation of IMC in resistance spot welded joints of steel and Al alloy.

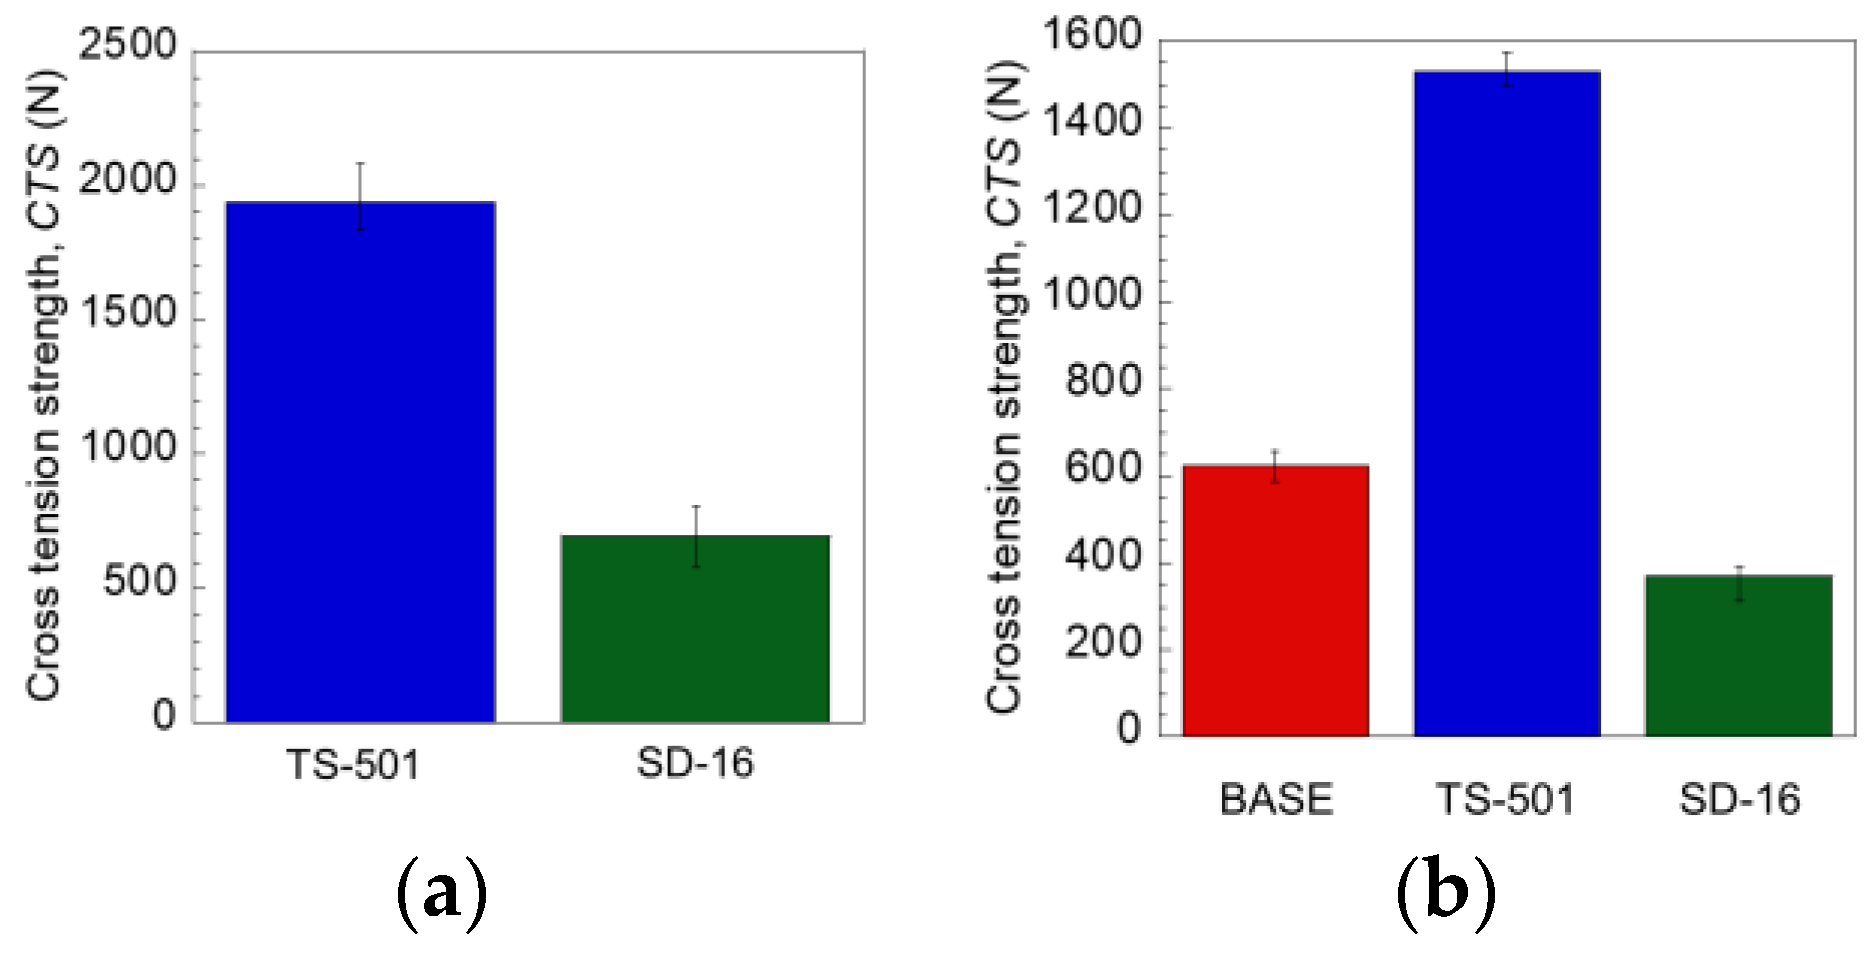
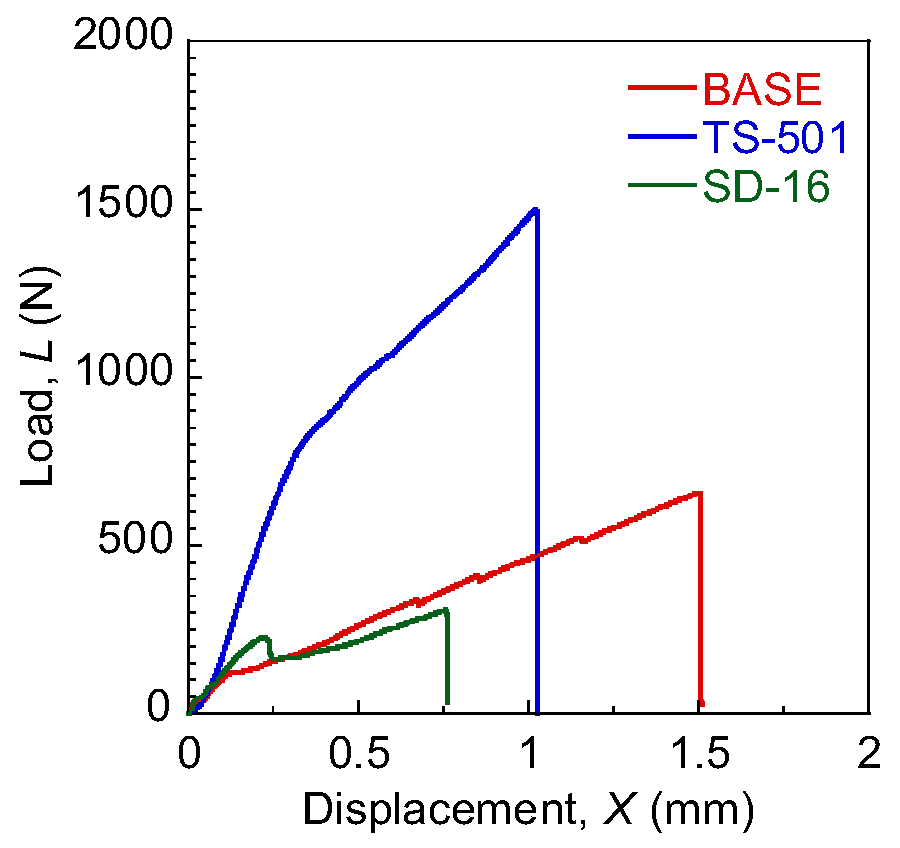
3.2. Effects of Adhesive Properties on the CTS of WB Joints

In this section, the effect of adhesive properties on the CTS of WB joints is examined. First, to clarify the mechanical properties of the TS-501 and SD-16 adhesives, the adhesive areas are matched, and the CTS is determined by adhesive joints. Figure 10a shows the CTS of TS-501 and SD-16 joints. Figure 10a shows that the CTS of TS-501 adhesives is higher than that of SD-16 adhesives. Figure 10b shows the CTS of BASE joints and WB joints, which are TS-501 and SD-16 joints. The highest CTS for TS-501 joints is clearly seen in Figure 10b. This is considered to be due to the high strength of the adhesive, which bore the load on the weld. The CTS of the SD-16 joint is lower than that of the BASE joint. This is considered to be because the adhesive has low strength, which does not affect the improvement of CTS, and IMCs are formed only at the edge, resulting in a narrower range of IMC formation than that of BASE and lower CTS.

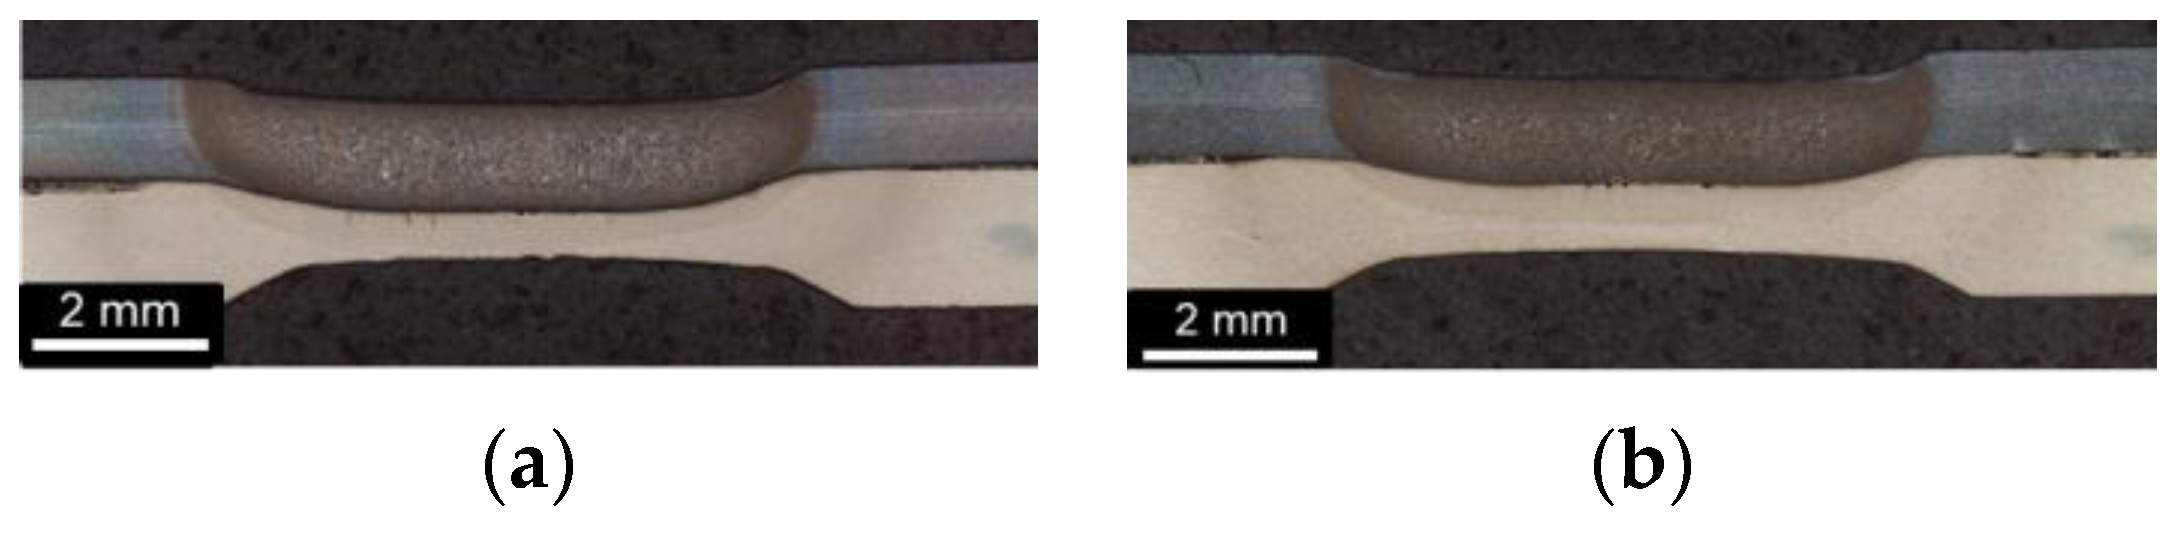
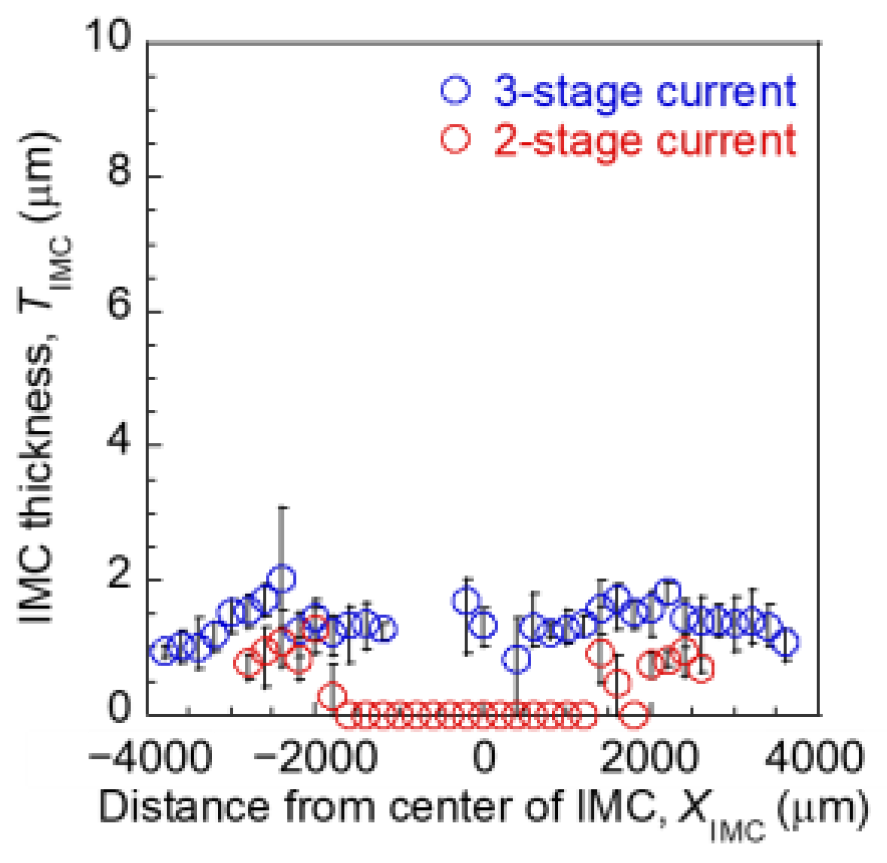
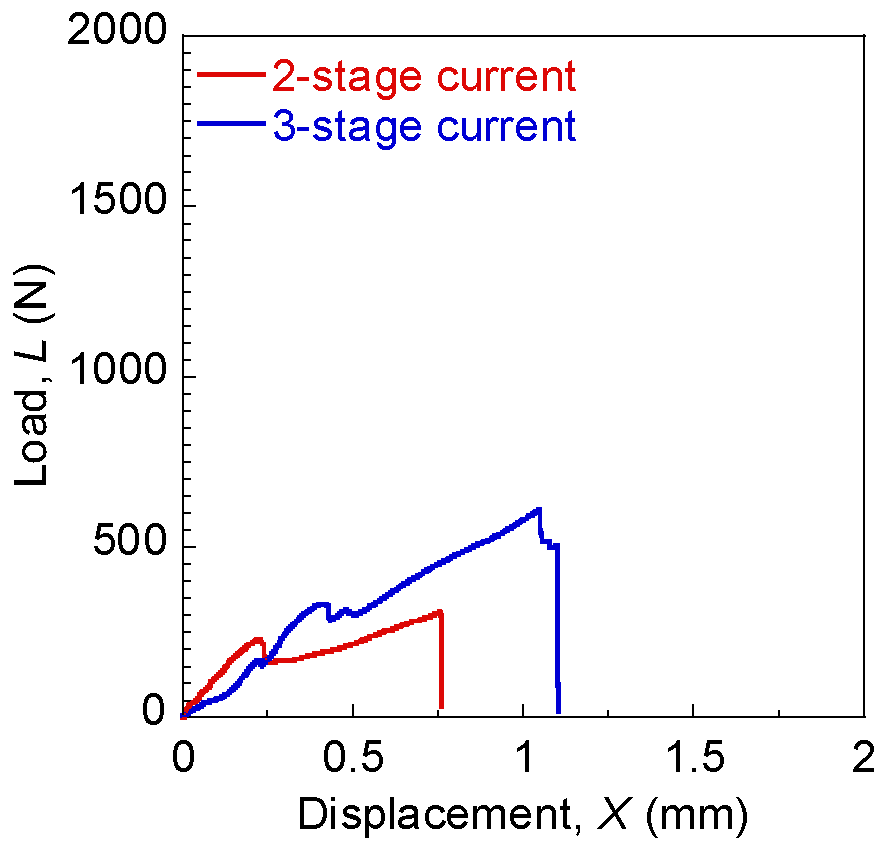
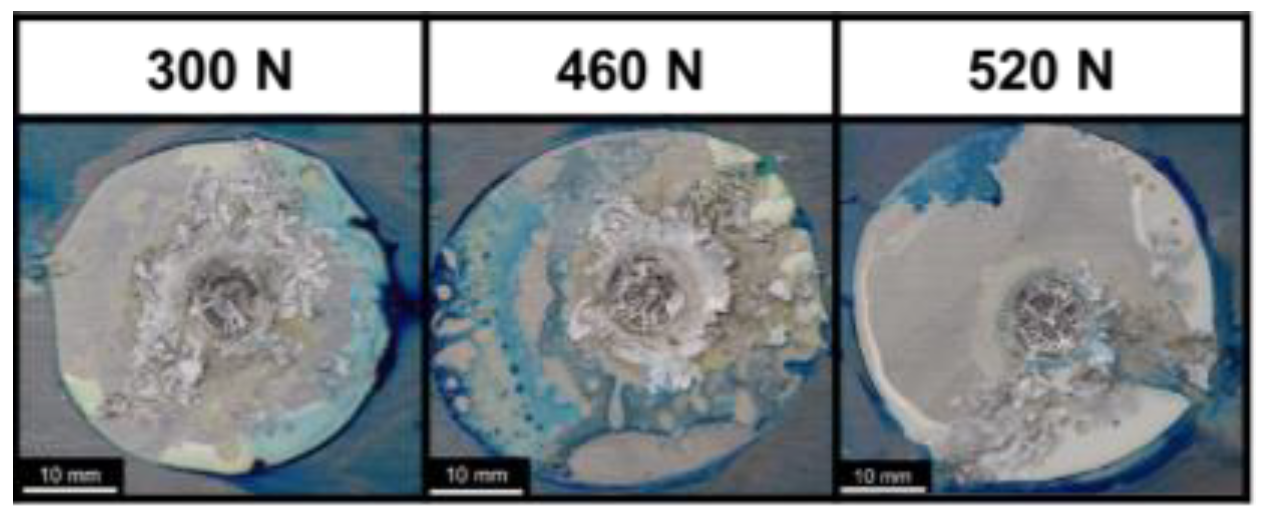
3.3. Effects of 3-Stage Current on IMC Formation State in Fe-Al Resistance Spot Weld Bonding and Effect of IMC Formation State on CTS

From the previous section, it is considered that the CTS is lower in the 2-stage current than in the BASE joint due to the lack of IMC formation in the center. The reason for the lack of IMC formation is that Ca in the adhesive remains at the joining interface. Ca is reported to have the effect of decreasing the diffusion coefficient of Al, and thus, the diffusion of Fe and Al diffusion is suppressed [6]. Therefore, the IMC formation in the center of the IMC formation range is studied with a 3-stage current, which can increase the diffusion time. Figure 11 shows the IMC thickness distribution under the welding conditions shown in Table 5c. Figure 11 shows that IMCs are formed in the center of the IMC formation range by using a 3-stage current and that the area of IMC formation is expanded. These results indicate that IMCs are formed throughout the weld. Figure 12 shows the CTS of the 2-stage and 3-stage current joints. Figure 12 shows that CTS is improved in the joints with a 3-stage current. These results indicate that the promotion of interdiffusion is effective in forming IMCs throughout the formation region. It is also shown that the formation of IMC throughout the weldarea improves the CTS of WB joints.

4. Discussion

4.1. Effects of Adhesive Strength on Fracture of Fe-Al Resistance Spot Weld Bonded Joints

To investigate the factors contributing to the difference in the strength of the BASE, TS-501, and SD-16 joints shown in Figure 10b load–displacement curves are compared. The results are shown in Figure 13, which shows that load increased rapidly at the TS-501 joint early in the test, and CTS is also highest. This is thought to be because TS-501’s high strength prevents the adhesive from peeling off even under high loads, and both the adhesive and the weld support the load, thus improving the CTS. On the other hand, the CTS of the SD-16 joint is lower than that of the BASE joint. Furthermore, the SD-16 joint has two peak values. This is considered to be because the SD-16 has low strength, and only the adhesive breaks first. And the adhesive cannot support the load applied to the weld, and IMC is formed only at the edge of the IMC formation region. Next, crack propagation behavior is observed. Figure 14 shows photographs of the fractured surfaces of the joint between TS-501 and SD-16. The depression in the center of the figure represents the weld, and the circular area around the depression represents the adhesive. Figure 14 shows that the paint adheres only to the adhesive portion up to 1220 N for the TS-501 joint and 330 N for the SD-16 joint. These results confirm that the adhesive secures the load up to high loads for the TS-501 joint and peels off at relatively low loads for the SD-16 joint. Also, in the TS-501 joint, the adhesion area of the paint at the adhesive increased from 1220 N to 1370 N, confirming that the paint adhered to the entire weld. Therefore, in the TS-501 joint, both the adhesive and the weld are load-bearing, indicating that the weld is rapidly fractured under high loads. On the other hand, in the SD-16 joint, paint adhered to a portion of the weld from 330 N to 360 N. This indicates that the adhesive peeled off before the weld is loaded due to the low strength of the adhesive, and then the load is secured at the weld. These results indicate that the WB joint with high adhesive strength has a much higher CTS than the BASE joint because both the adhesive and the weld are subjected to load. On the other hand, when adhesive with low strength is used, the welds exhibited fracture behavior after the adhesive was delaminated.

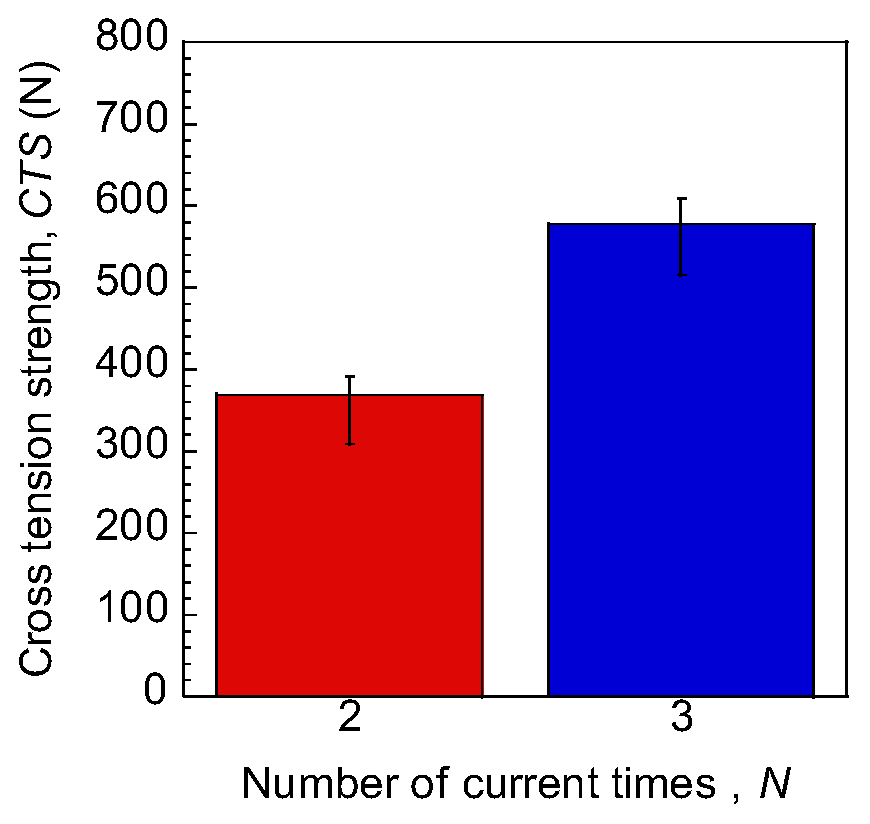
4.2. Effects of 3-Stage Current on CTS in Resistance Spot Weld Bonding

This section discusses the factors that contribute to the improved CTS shown in Figure 12. Figure 15 shows the load–displacement curves of the joints with a 2-stage current and 3-stage current. Figure 15 shows that there are two peak values that are considered to be caused by adhesive and weld fracture in both the 2-stage and 3-stage current and that the second peak value is improved in the 3-stage current. This is considered to be due to the formation of IMC in the center of the IMC formation range and the strengthening of the weld by the expansion of the area of IMC formation. Therefore, crack propagation behavior was then observed.
Figure 16 shows a fracture surface photograph of the 3-stage current. From Figure 14b and Figure 16, it can be seen that paint adhered to the weld zone at 360 N in the case of 2-stage current but only at the edge of the weld zone at 520 N in the case of 3-stage current, indicating that crack propagation to the weld zone is suppressed. The reason for the improved CTS is thought to be that IMC is formed in the center of the IMC formation range, and crack propagation is suppressed due to the expansion of the IMC formation area.

5. Conclusions

In this study, weldability and mechanical properties of resistance spot weld bonding with adhesives of different properties were investigated. As a result, it was found that the discharge of adhesive at the joint interface was important for welding and that 2-stage current was effective for this purpose. In addition, resistance spot weld bonded joints using high-strength adhesives showed that improved the CTS. In addition, it was found that the promotion of interdiffusion was effective in expanding the range of IMC formation in resistance spot weld bonding and that CTS was improved by expanding the range of IMC formation.

Author Contributions

Conceptualization, S.S. and M.I.; validation, S.S., Y.I. and K.Y.; data curation, S.S., Y.I. and K.Y.; writing–original draft preparation, S.S.; writing–review and editing, M.I.; supervision, M.I.; project administration, M.I.; funding acquisition, M.I. All authors have read and agreed to the published version of the manuscript.

Funding

This research received no external funding.

Institutional Review Board Statement

Not applicable.

Informed Consent Statement

Not applicable.

Data Availability Statement

Not applicable.

Acknowledgments

The adhesives used in this study were provided by Resonac Corporation. We would like to express our deepest gratitude to Resonac Corporation.

Conflicts of Interest

The authors declare no conflict of interest.

References

  1. Anami, T. Aluminum Applications for Automotive Body and Next Generation Automobiles. J. Surf. Finish. Soc. Jpn. 2016, 67, 639–643. [Google Scholar]
  2. Sugimoto, Y.; Tanaka, K.; Nishiguchi, K. Spot joining of aluminum and dissimilar materials. J. Jpn. Inst. Light Met. 2019, 69, 74–80. [Google Scholar] [CrossRef]
  3. Ogura, T.; Hirose, A. Microstructural control of interface and mechanical properties in dissimilar metal joining between aluminum alloy and steel. J. Jpn. Inst. Light Met. 2016, 66, 503–511. [Google Scholar] [CrossRef]
  4. Yasui, T. Friction stir welding between aluminum and dissimilar metal. J. Jpn. Inst. Light Met. 2021, 71, 222–227. [Google Scholar]
  5. Haraga, K.; Kodama, M. State of the Art and Prospects in the Future in Adhesive Bonding. J. Jpn. Weld. Soc. 1987, 56, 148–154. [Google Scholar] [CrossRef]
  6. Akdeniz, M.V.; Mekhrabov, A.O. The Effect of Substitutional Impurities on The Evolution of Fe-Al Diffusion Layer. Acta Mater. 1998, 46, 1185–1192. [Google Scholar] [CrossRef]
Figure 1. IMC thickness measurement points. IMC thickness was measured every 200 µm from the left end to the right end.
Engproc 43 00047 g001
Figure 2. Method of obtaining the area of adhesive discharge. Peel off the specimen after welding with a chisel and determine the area of the adhesive discharge from the fracture surface of the weld.
Engproc 43 00047 g002
Figure 3. Crack observation method. Cracks were observed by dipping a joint stopped at an arbitrary load into the paint and then peeling the joint.
Engproc 43 00047 g003
Figure 4. Comparison of IMC formation status: (a) IMC thickness distribution of BASE joints; (b) IMC thickness distribution of WB joints.
Engproc 43 00047 g004
Figure 5. Cross-sectional photograph of weld: (a) Welding of BASE joints; (b) Welding of TS-501 joints; (c) Welding of SD-16 joints.
Engproc 43 00047 g005
Figure 6. SEM images of welds and Ca distribution: (a) TS-501 joints by current time at the weld zone; (b) SD-16 joints by current time at the weld zone.
Engproc 43 00047 g006
Figure 7. Relationship between the current time and adhesive discharge area. The contact area between the plates of BASE was measured using tracing paper.
Engproc 43 00047 g007
Figure 8. Cross-sectional photograph of weld in 2-stage current: (a) In case of TS-501 joints; (b) In case of SD-16 joints.
Engproc 43 00047 g008
Figure 9. Comparison of IMC thickness distribution at BASE, TS-501, and SD-16 joints.
Engproc 43 00047 g009
Figure 10. Comparison of CTS in adhesive and welded joints: (a) CTS of adhesive joints using TS-501 and SD-16 adhesives; (b) Comparison of CTS in BASE joints and TS-501 and SD-16 joints.
Engproc 43 00047 g010
Figure 11. Comparison of IMC thickness distribution. The following figure shows the formation of IMC in the 2- and 3-stage current joints measured by the test method described in Section 2.2.
Engproc 43 00047 g011
Figure 12. Comparison of CTS. The following table shows the CTS of 2-stage and 3-stage current joints measured by the test method described in Section 2.4.
Engproc 43 00047 g012
Figure 13. Comparison of load–displacement curves for BASE, TS-501, and SD-16 joints shown.
Engproc 43 00047 g013
Figure 14. Comparison of crack propagation behavior of WB joints with two-stage current: (a) Crack propagation behavior of TS-501 joints; (b) Crack propagation behavior of SD-16 joints.
Engproc 43 00047 g014
Figure 15. Comparison of load–displacement curves for 2-stage and 3-stage current joints.
Engproc 43 00047 g015
Figure 16. Crack propagation behavior of a 3-stage current joint.
Engproc 43 00047 g016
Table 1. Chemical composition and mechanical properties of 980 MPa class high strength steel sheet.
Chemical Composition (mass %)Mechanical Properties
CSiMnPSYS (MPa)TS (MPa)El (%)
0.120.922.090.0200.001598103416
Table 2. Chemical composition and mechanical properties of A6061 alloy.
Chemical Composition (mass %)Mechanical Properties
SiFeCuMnMgCrZnTiYS (MPa)TS (MPa)El (%)
0.40~0.80.70.15~0.400.150.8~1.20.04~0.350.260.1529524510
Table 3. Chemical composition of TS-501.
Chemical Composition (%)
Bis-A type EpoxyAliphatic epoxyAromatic polyamine3513NDicyandiamideCoupling agentCore-shell particlesCalcium carbonate
5465645310115
Table 4. Chemical composition of SD-16.
Chemical Composition (%)
Bis A type epoxyAliphatic epoxyAmine curing agentCoupling agentCore-shell particlesCalcium carbonateSilica particles
653520330755
Table 5. Welding conditions for each welding experiment.
(a) Welding Conditions for the Purpose of Comparing Adhesive Ejection Properties.
AdhesiveElectrodes
(Fe/Al)
Force,
F (kN)
1st Current,
I 1st (kA)
1st Current Time,
tw_1st (cycles)
TS-501R100/R1005.0104~10 (Interval of 2 cycles)
SD-16R100/R1005.0104~10 (Interval of 2 cycles)
(b) Welding Conditions for Weldability of BASE and WB with 2-Stage Current.
AdhesiveElectrodes
(Fe/Al)
Force,
F (kN)
1st Current,
I 1st (kA)
1st Current Time,
tw_1st (cycles)
2nd Current,
I 2nd (kA)
2nd Current Time,
tw_2nd (cycles)
BASEDR/DR5.0108154
TS-501DR/DR5.0108154
SD-16DR/DR5.0108128
(c) Welding Conditions Aimed at Understanding the Effect of IMC Formation State on CTS in WB.
AdhesiveElectrodes
(Fe/Al)
Force,
F (kN)
1st Current,
I 1st (kA)
1st Current Time,
tw_1st (cycles)
2nd Current,
I 2nd (kA)
2nd Current Time,
tw_2nd (cycles)
3rd Current,
I 3rd (kA)
3rd Current Time,
tw_3rd (cycles)
SD-16DR/DR5.0108128
SD-16DR/R405.0108144208
Disclaimer/Publisher’s Note: The statements, opinions and data contained in all publications are solely those of the individual author(s) and contributor(s) and not of MDPI and/or the editor(s). MDPI and/or the editor(s) disclaim responsibility for any injury to people or property resulting from any ideas, methods, instructions or products referred to in the content.

