1. Introduction
Recently, a powerful research tool, the technique of X-ray microcomputed tomography (micro-CT), has been developed for characterizing materials and living organisms. With regard to material characterization, the X-ray micro-CT is considered ideal for heterogeneous materials, like cement-based composites. It can be used to assess the cementitious composites’ spatial micro-pore structure. Its many advantages are the absence of specimen preparation requirements such as drying or surface polishing, a rapid technique, non-destructive 3D imaging of the microstructure, sufficient spatial resolution independent of volume, and direct measurement without the requirement of pore geometry assumption, and very importantly, without cutting the specimen to capture surface images, as other methods like scanning electron microscope (SEM) or transmission electron microscope (TEM) can be used to obtain 3D microstructures [
1].
The physical and mechanical properties of cementitious materials are affected not only by the quantity and dimension but also by the distribution of air pores. In addition, the agglomerates which are connected with the porous effect of the reinforcement in the mortar lead to mechanical properties’ reduction. In cementitious materials, the pore evaluation covers an extensive variety of length dimensions, from nano to millimeters scale, and can be visually noticed using the micro-CT method. X-ray micro-CT runs cross-sectional slice images of the experimental material and combines the 3D volumetric images by assembling 2D images. Three-dimensional (3D) microstructure characterization with the micro-CT of cementitious materials has already been investigated [
2] with density and porosity parameters. Still, only a few use this process to evaluate the mechanical properties. Although the porosity of the cementitious composites cannot be accurately characterized due to the limitation of its resolution, only pore diameters bigger than 10 μm can be determined using micro-CT, in order to distinguish the differences in density. The agglomeration of nanotubes incorporated in the cementitious matrix creates a pore formation in microstructures of various diameters scales [
3,
4]. Pore physical properties are in turn significantly crucial for defining relationships with macroscopical properties, as well as solid-phase characteristics, which are equally important.
The mechanical capacities of cementitious composites, such as flexural strength, compressive strength, and toughness, or thermoelectrical properties such as conductivity, are powerfully affected by the additives’ dispersion and the pore structure of the material [
5,
6]. In the pore characterization process, with micro-CT and pore size distribution, the diameter of pores plays a significant role [
7] Although conventional volume-based theory considers the perfect spherical morphology according to the maximal ball algorithm, usually characterized by the pore size distribution of the material, these methods provide limitations in relating the anisotropic or heterogeneous pore properties. As such, a supplementary experimental approach is needed to quantify the pore physical appearance of heterogeneous composites using the diameter length dispersal. Enhanced knowledge of nano- and microstructures can be leveraged to develop smart cement-based composites and better diagnosis of damages in cementitious structural members [
8,
9,
10].
The purpose of this experimental survey is to (a) investigate the influence of the pores’ size and their distribution within the specimen, in real dimensions, with the specific spatial position in the matrix using full 3D microstructure image information, and (b) correlate the mechanical properties (compressive and flexural strength) of 2 × 2 × 8 (in cm) mortar prisms in correlation with the degree of porosity and pore size distribution. The microstructural characterization which derives from the microscale properties of MWCNTs’ nanoindentation in the mortars, using X-ray microtomography, is connected to the macro-scale properties’ (flexural and compressive strength) investigation. The optimum nano reinforcement incorporated in the cement matrix indicated that the macroscopic features of the modified mortar were influenced by the composites’ microscopic features, resulting in pore size reduction and producing a less porous mortar.
2. Materials and Methods
To conduct this research, cementitious mortar strengthened with the industrial product multi-walled carbon nanotubes (MWCNTs) were used, called ONEX-MWCNTs. The nanotubes were available in powder form and were supplied by Glonatech S.A. The characteristic properties of MWCNTs provided carbon purity >97 wt.%, average diameter 2–4 nm, length ≥ 0.01 mm, tensile modulus 1000 GPa, density 0.07 gr/cm3, and strain at failure 17.5%. Type I ordinary Portland cement (OPC) 42.5 R was applied for casting the cementitious specimens. For the mechanical strength determination (three-point bending and compression tests) and microstructural characterization (microtomography tests) specimens of 28-day age were used after curing at secured conditions of relative humidity of 95% and 20 °C temperature. The mix proportions used in this research were 100 gr water, 200 gr, and 600 gr sand, adding 0.2 gr, 0.4 gr, 0.6 gr, and 1.0 gr for the nano-powder concentrations of 0.1 wt.%, 0.2 wt.%, 0.3 wt.%, and 0.5 wt.% by the mass of cement of type I Ordinary Portland Cement (OPC) 42.5 to cast prisms of 2 cm × 2 cm × 8 cm. The w/c ratio in this research was held at 0.5 and a superplasticizer (SP) was added to the mixture, with an MWCNTs/SP ratio of 1/0.5 for all the mixes.
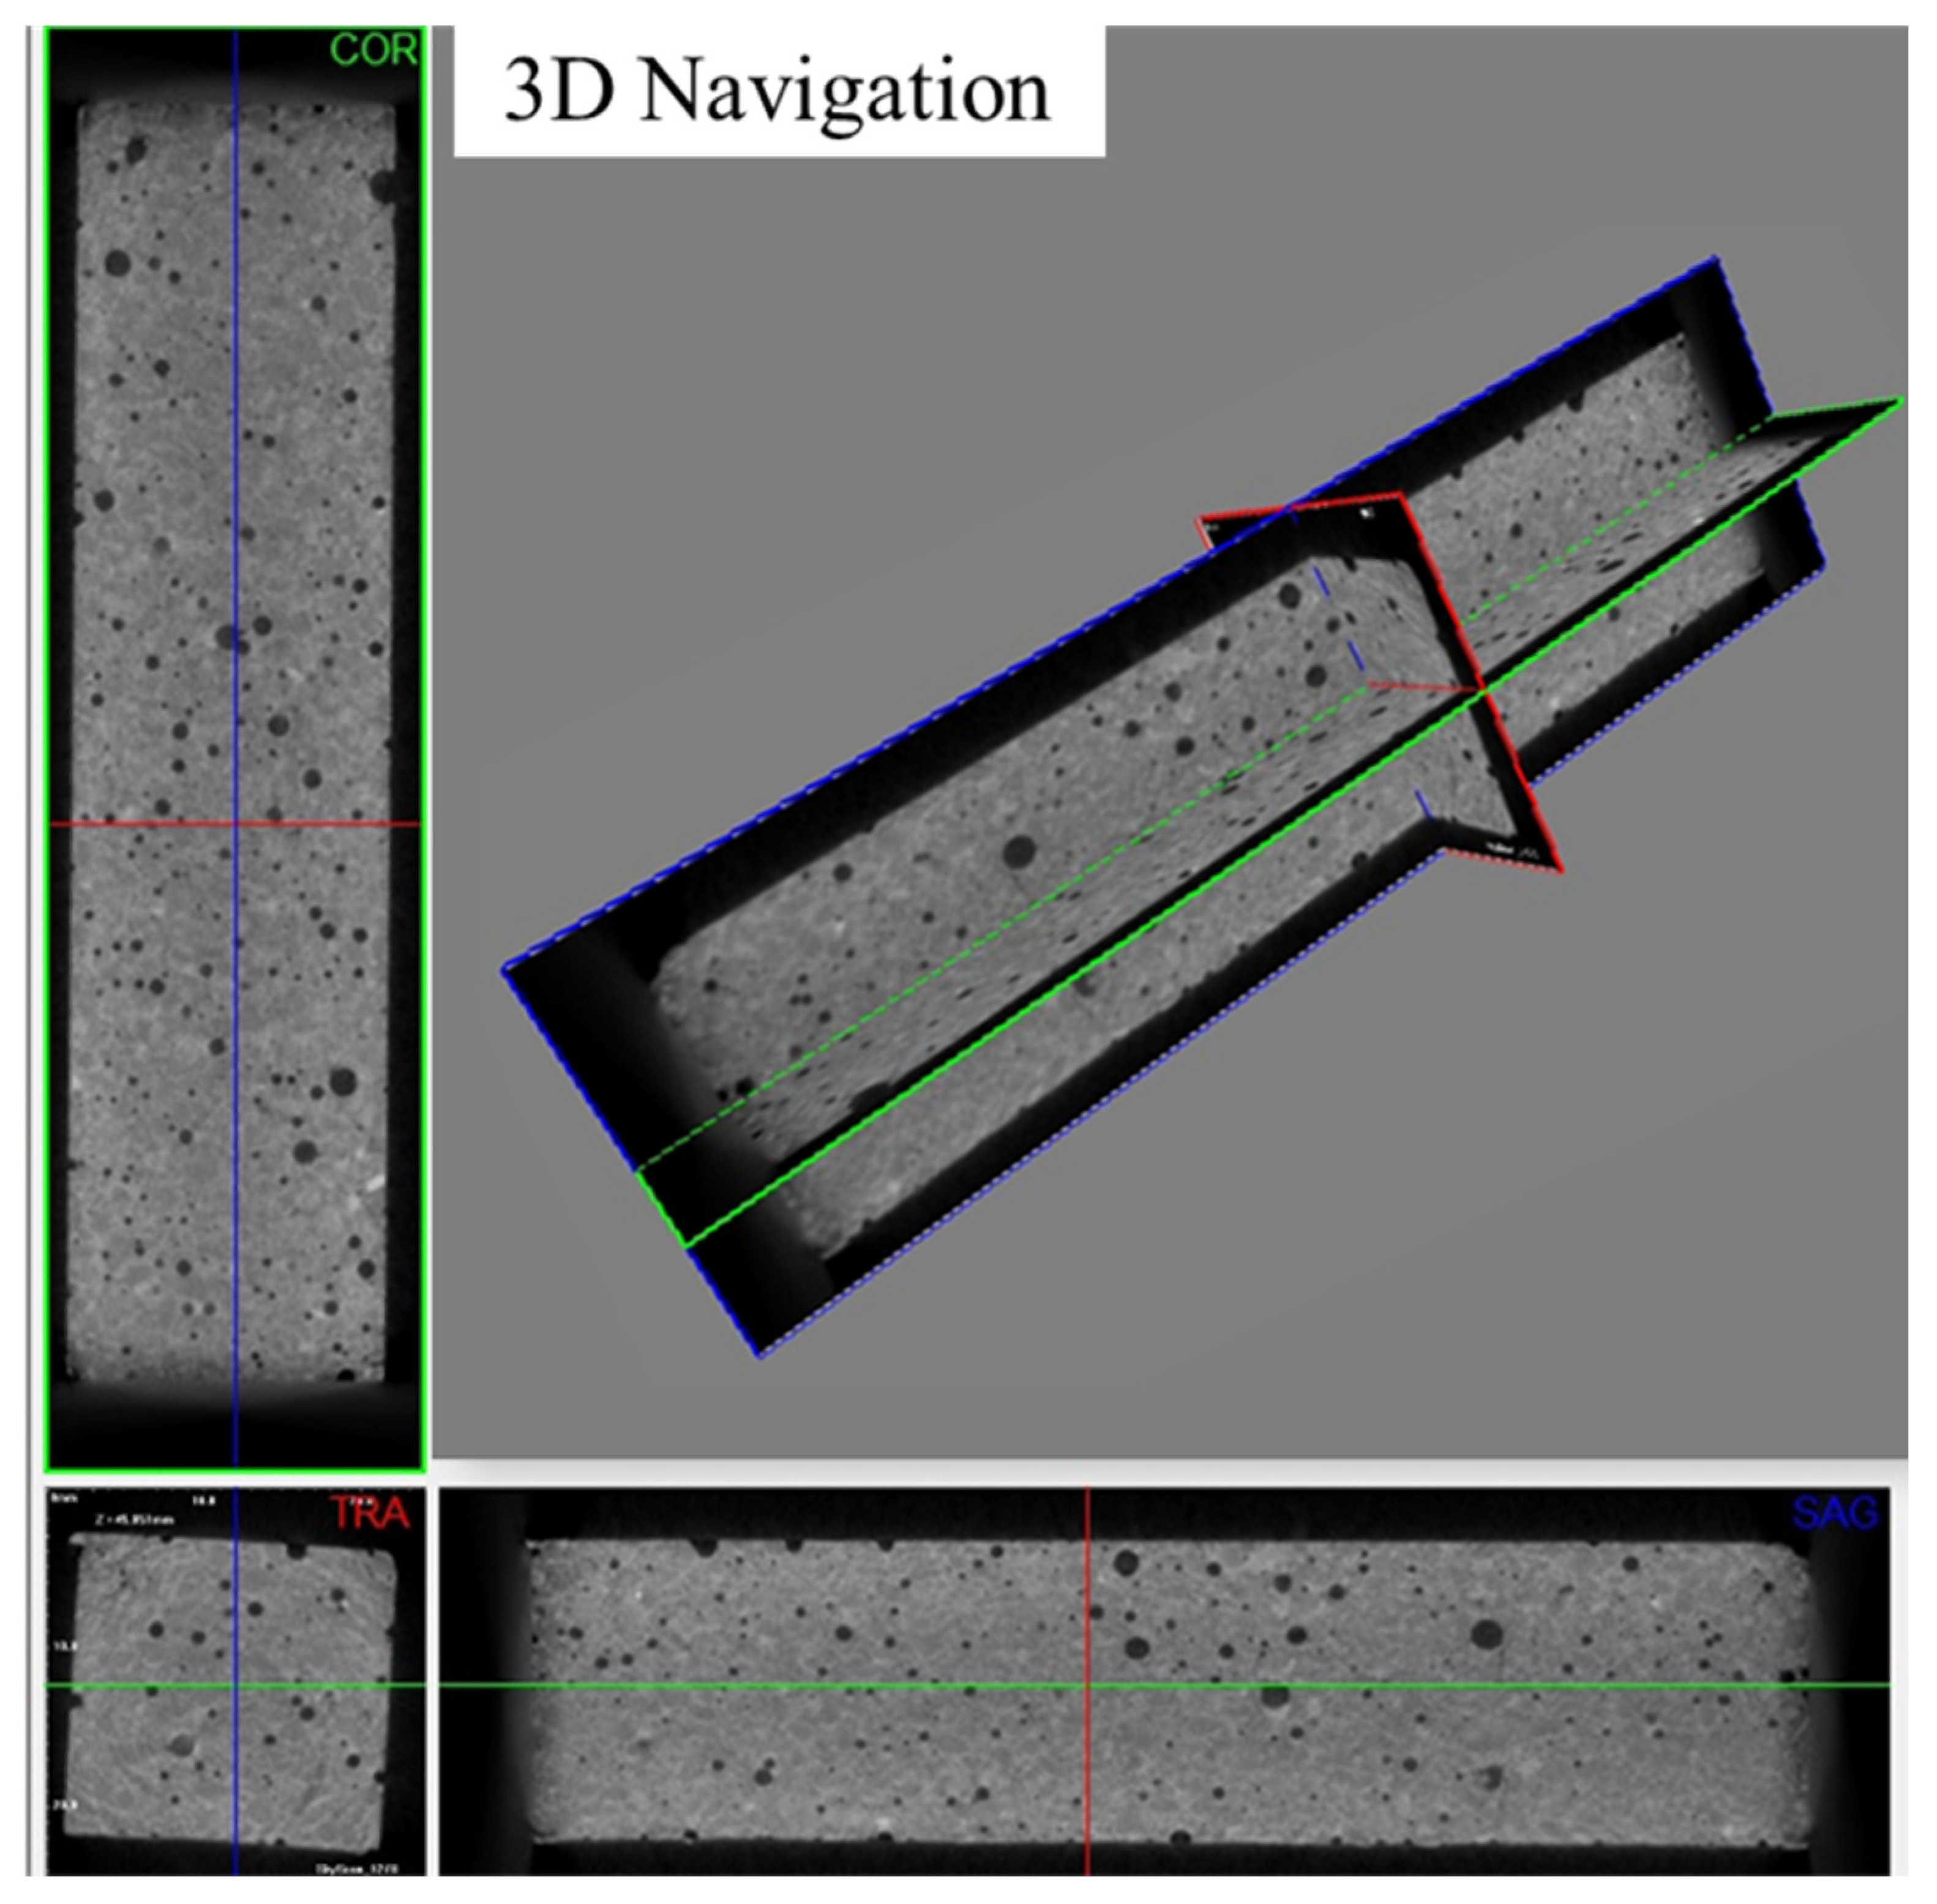
A grayscale value from CT 2D or 3D images distinct at each pixel gave the quantified information, which considered the linear attenuation coefficient, providing insight into characteristics from the holes developed into the solid phase. The different densities and pores’ size distribution were obtained via micro-CT imaging using an image 2D and 3D reconstruction process.
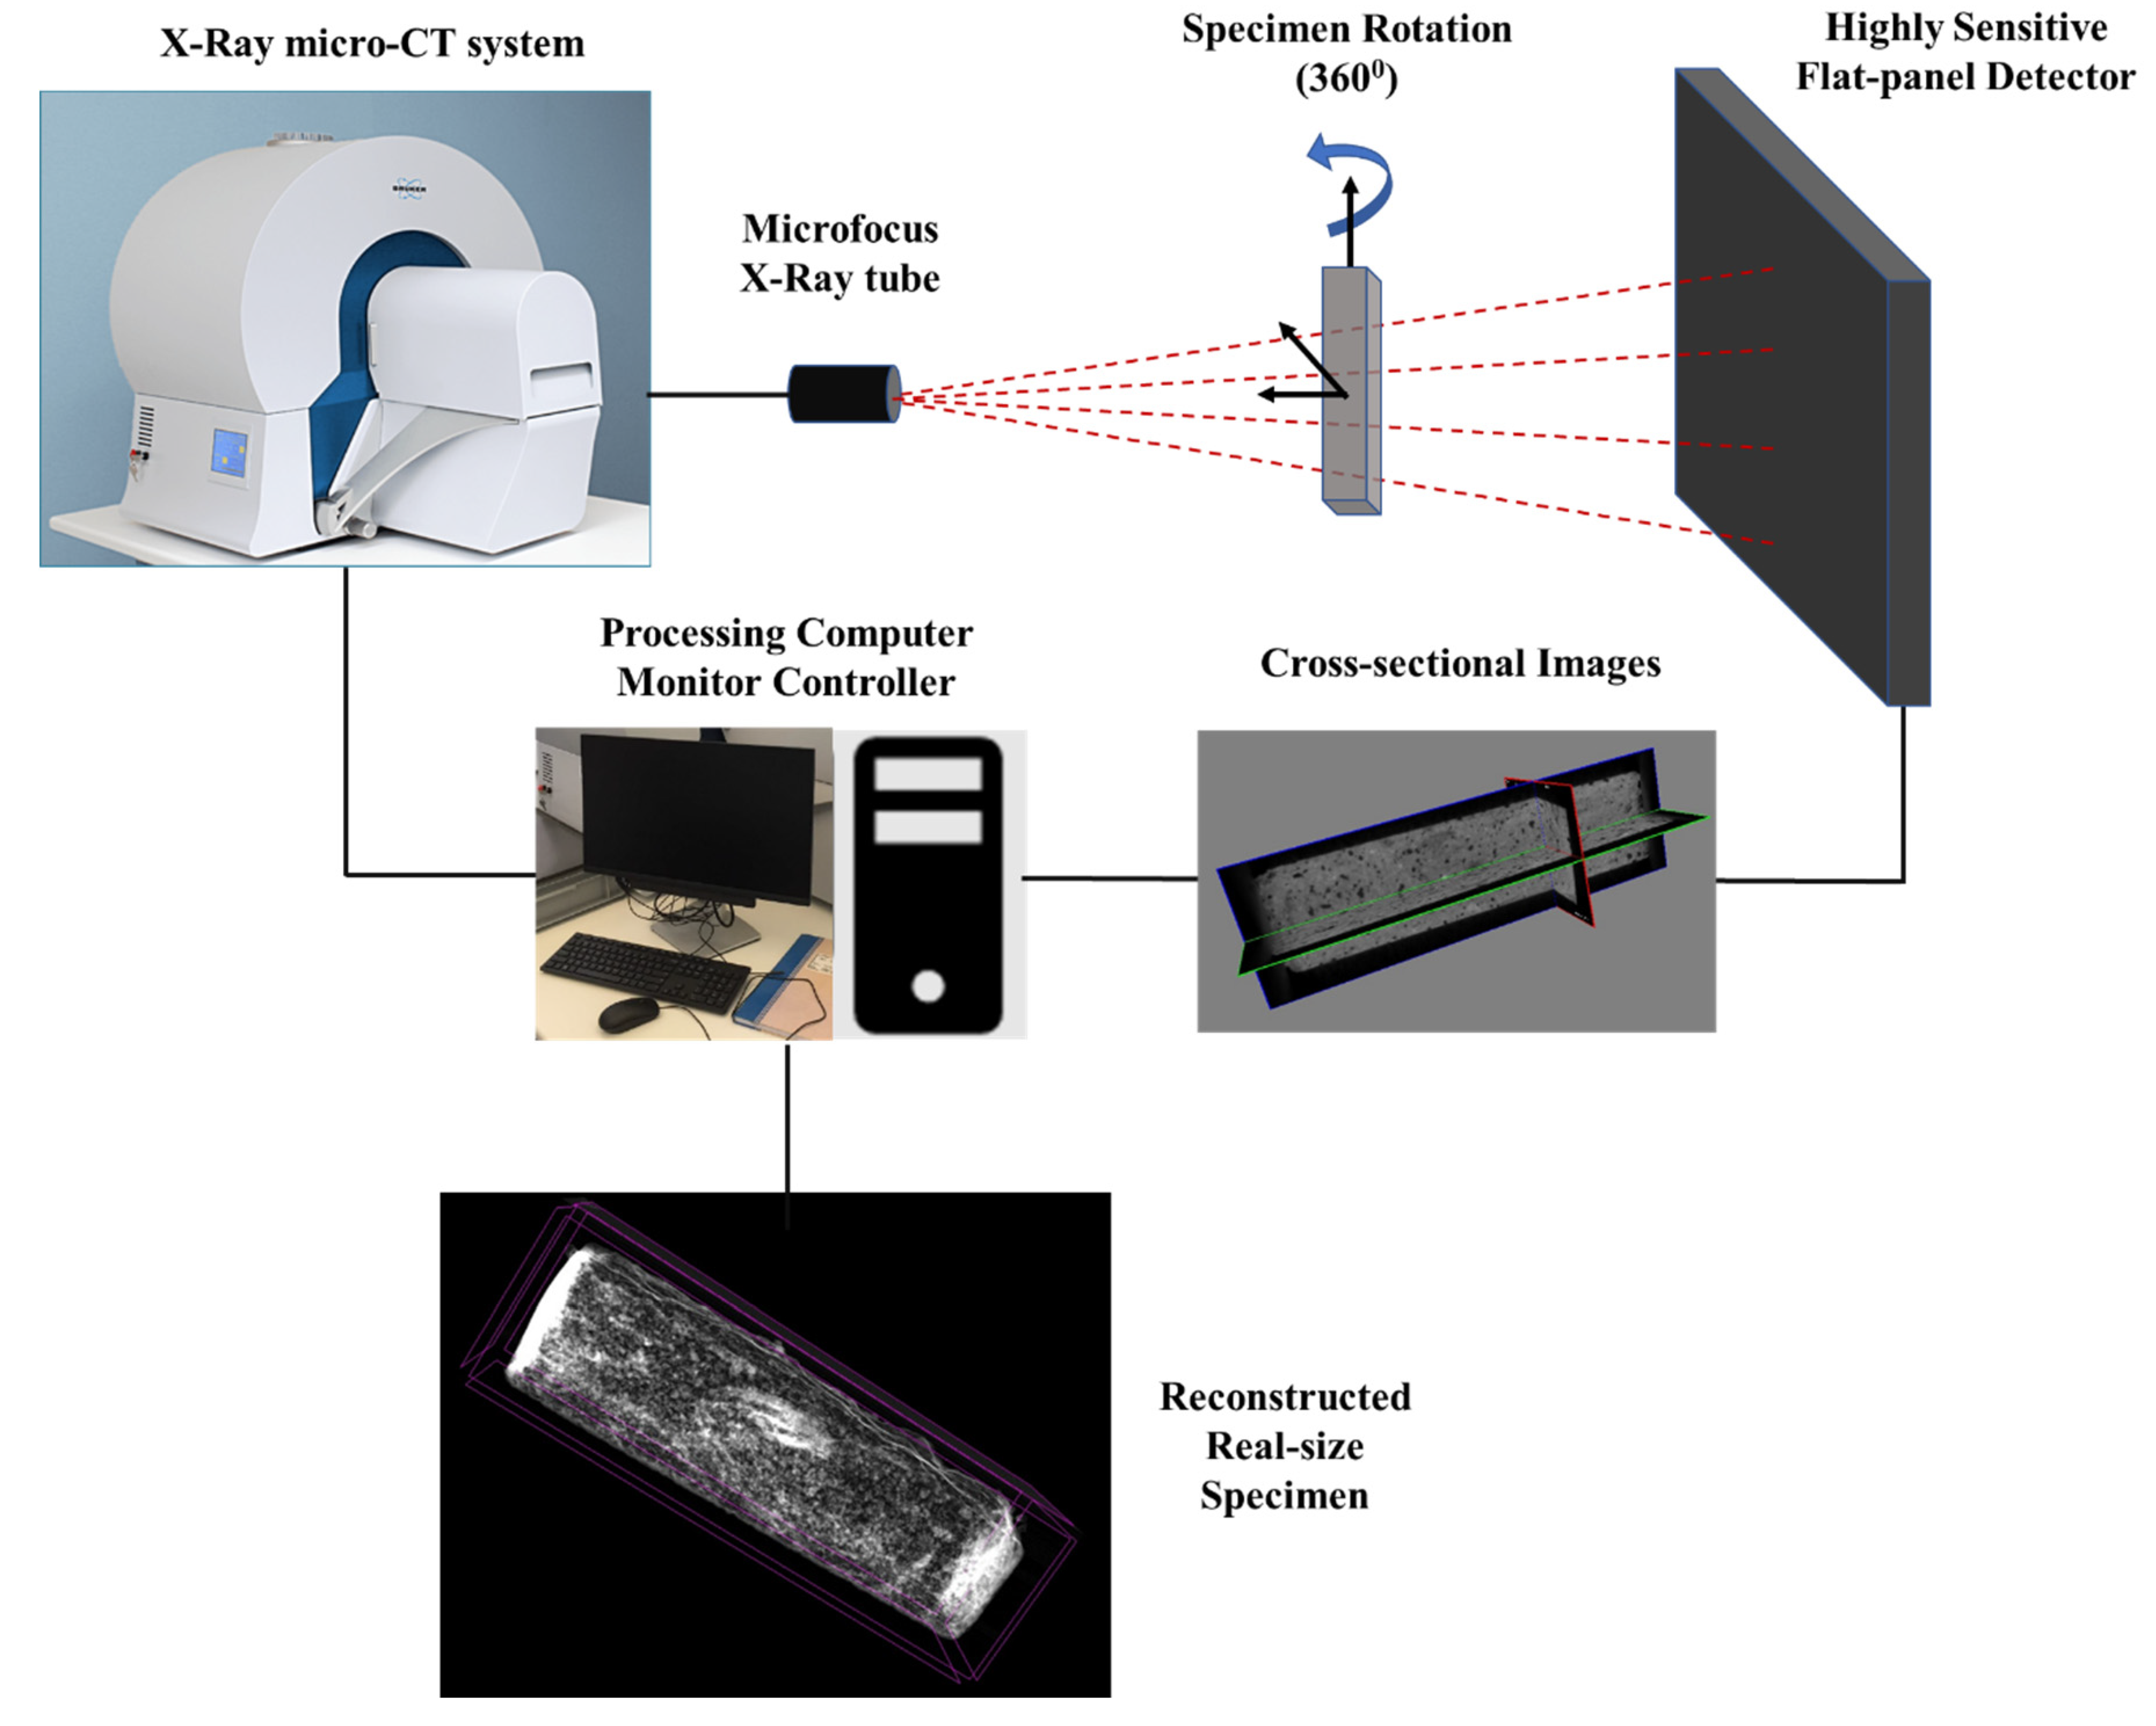
Figure 1 represents a schematic diagram of a microfocus X-ray tube that constantly radiated a 360 °C rotated specimen with continuous velocity. A highly sensitive flat-panel detector provided 2D projection data at a computer-controlled specified completion time. During the scanning, pre-processing was performed for decreasing the noise consequence on the image quality, and a median type of filter was used to make the image clearer, removing formed circular artifacts. Subsequently, the real specimen shape occurred with the combination of the 2D image slices in the three axes, X, Y, and Z, in order to create real-size 3D imaging with various densities and porosity values attained via microtomography binary imaging illustrating materials’ pores and solid phase created by image reconstruction (
Figure 2).
3. Experimental Process
Nano-modified mortars with different reinforcement amounts were experimentally investigated by using an X-ray micro-CT system (Bruker, Kontich, Belgium) located at the Hephaistos Laboratory of the International Hellenic University (Greece). The data collection was obtained through the software SKYSCAN 1278 (Bruker, Kontich, Belgium), which possesses a highly sensitive flat-panel detector that can deliver images in three axes. Through this environment, the parameters concerning the scanning of the sample were controlled. A full-specimen scanning lasts 7.2 s or less, thus minimizing overall experimental duration and cost, as well as improving the data-collection speed. Through this environment, we could control the parameters concerning the scanning of the sample. The volume rendering and manipulations using the software supplied a basic processor for the scans. In addition, NRecon software (2016, Belgium) was used in order to limit the artifacts that appeared. The processing of the scanned images (shadow images) for the reconstruction of the sample was also performed with NRecon software (2016, Belgium), which was used to combine the 2D sections in a 3D volume, while the imperfections created by the scan were corrected. Software for 2D/3D image analysis provided a realistic visualization of full-body mortar prisms scanning with a maximum field of view at 80 mm (diameter) and 200 mm (length).
In this research, a 1024 × 1024-pixel X-ray camera was used. The applied X-ray source excitation range was 20–65 kV, the applied power was 50 W, and the spot size was 50 µm, as selected according to the specimens’ characteristics, while a flat-panel sensor supplied 1944 × 1536 pixels. The volume of the reconstructed images exceeded 1536 × 1536 × 1566 pixels, corresponding to 1000 slices. The maximum tube voltage and X-ray frequency were 100–240 V AC and 50–60 Hz, respectively. The X-ray absorption of each voxel was controlled to 14-bit gray values.
In addition, reconstruction software was used, such as DATA VIEWER (2014, v 1.5.1.2, Belgium) for 3D volume section inspection, CTVOX –3D (v 3.3, Belgium) for realistic scan visualization, CTAN (v 1.19, Belgium) for 2D/3D image analysis and processing, and CTVOL (v 2.0, Belgium) for visualizations provided for the analysis and visualization of scan sections. Surfaces and export files to formats for computer-aided design (CAD) or 3D renderings were used.
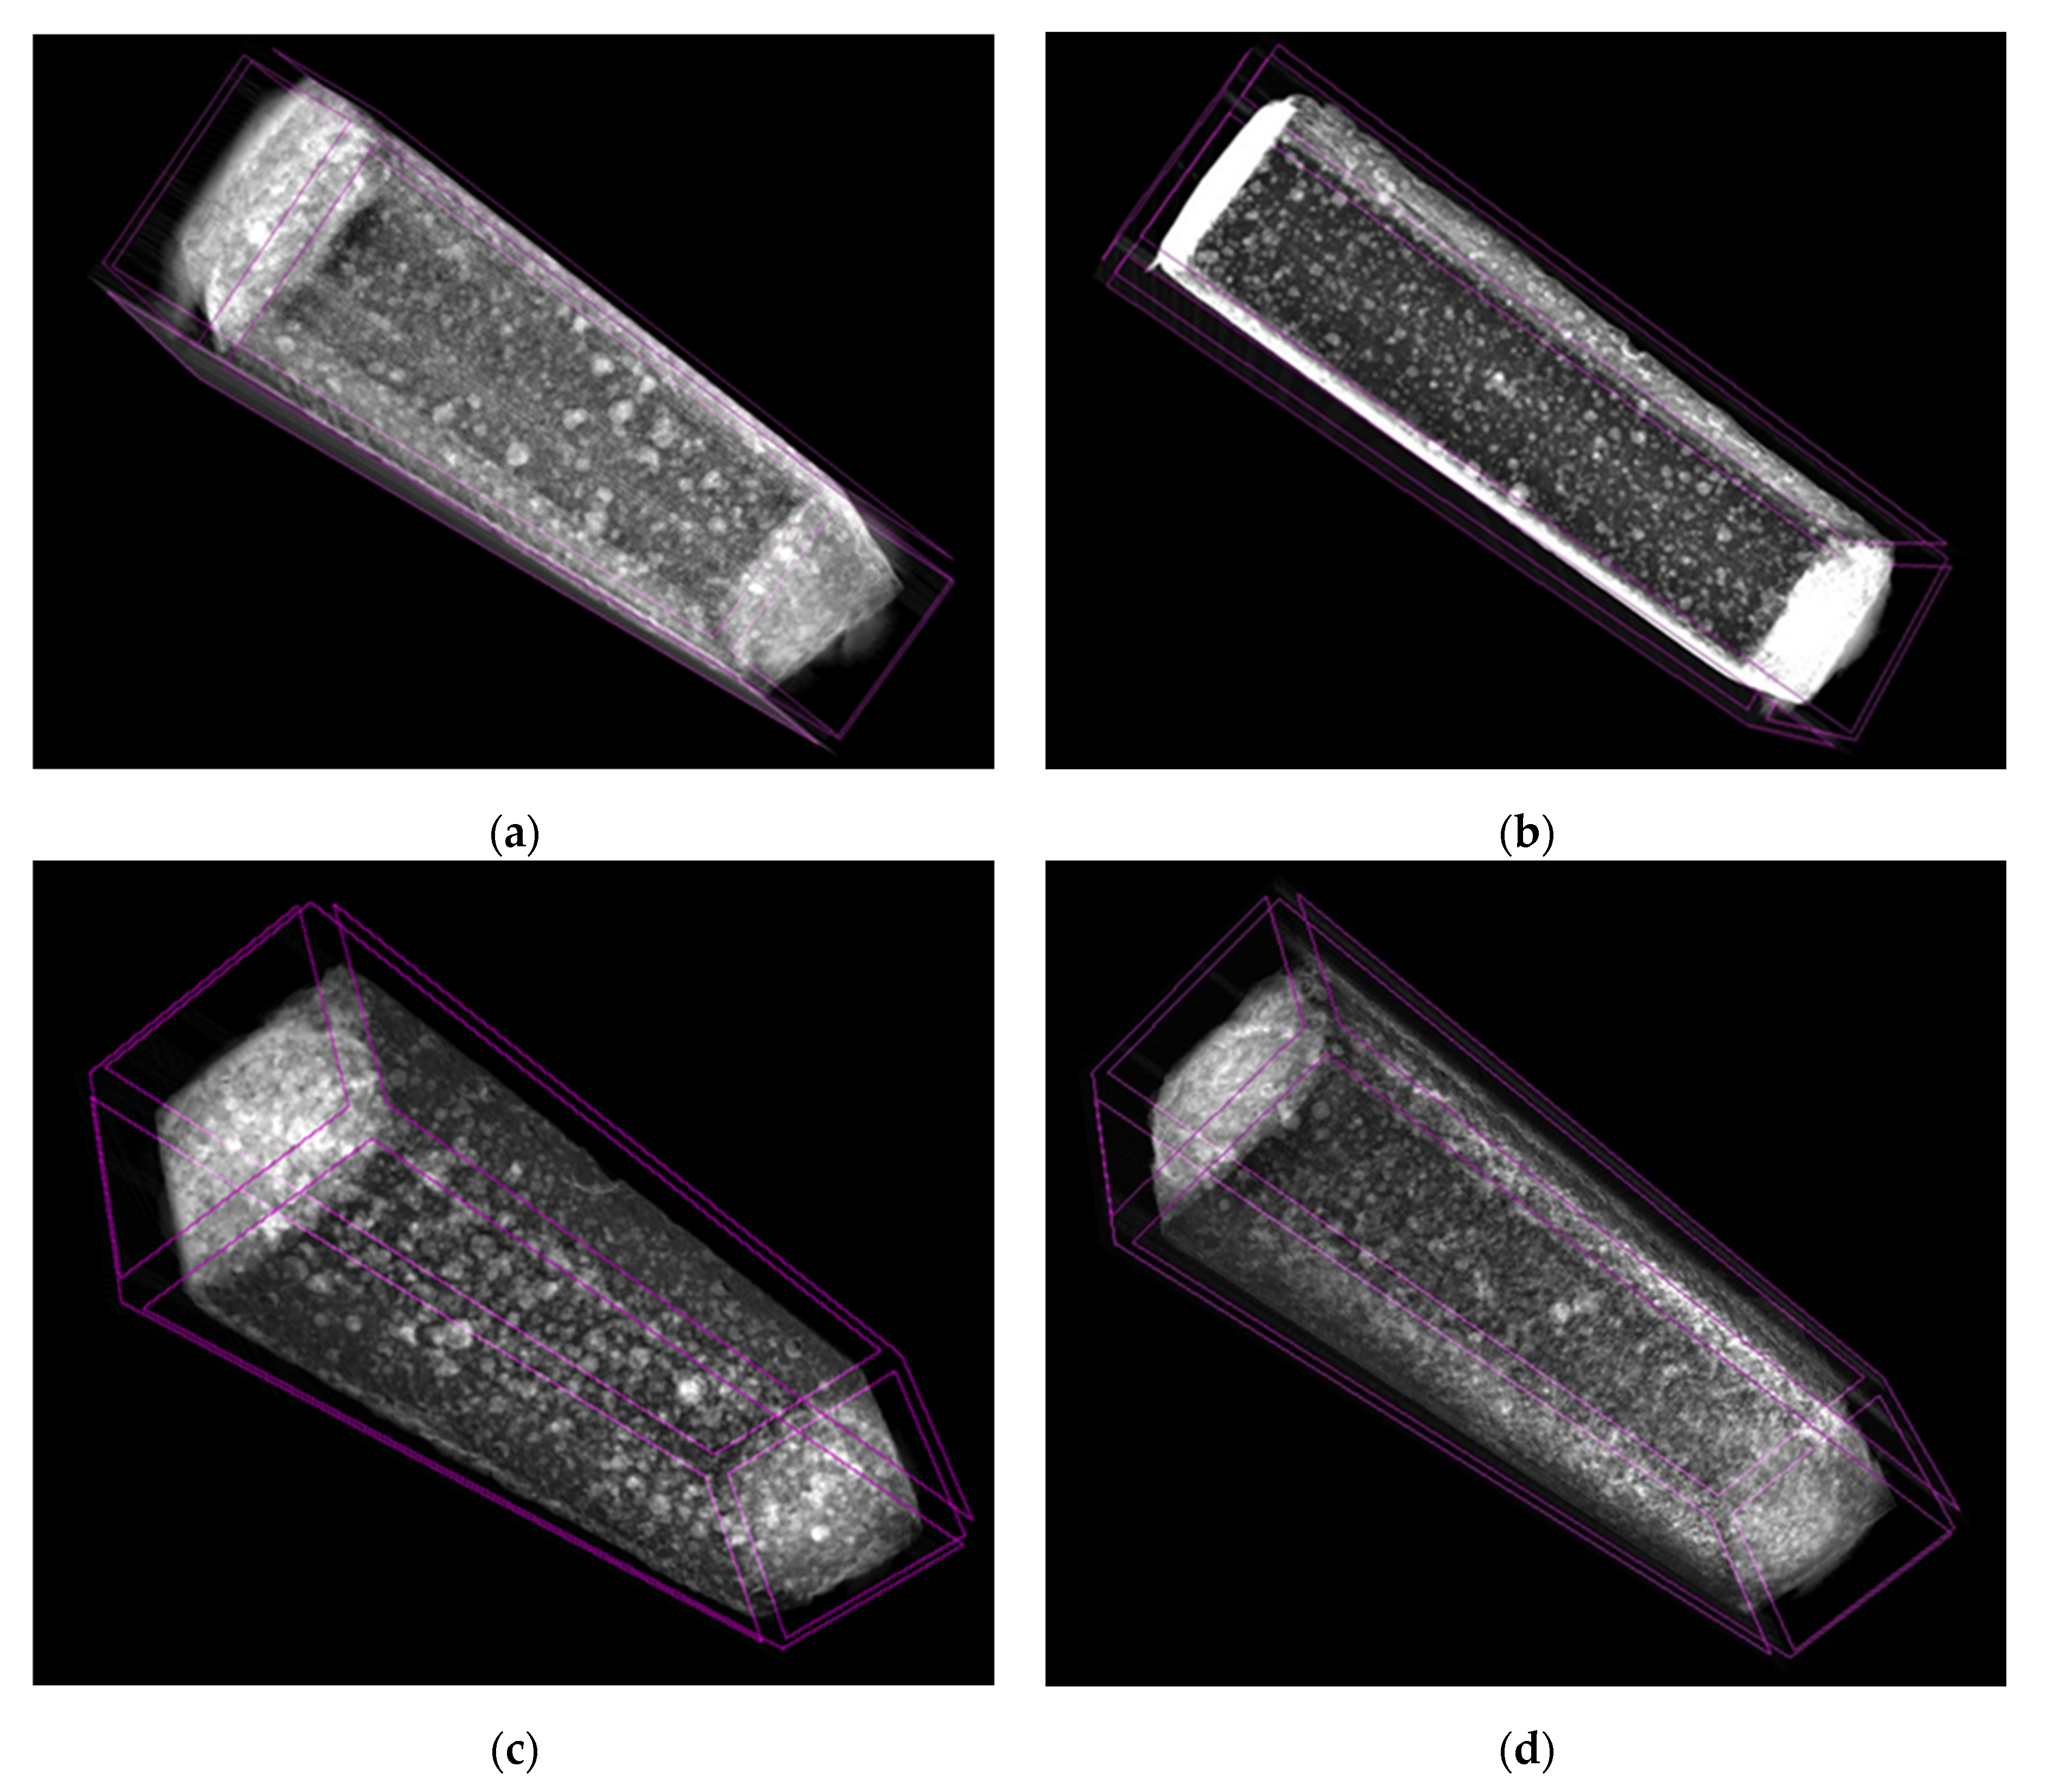
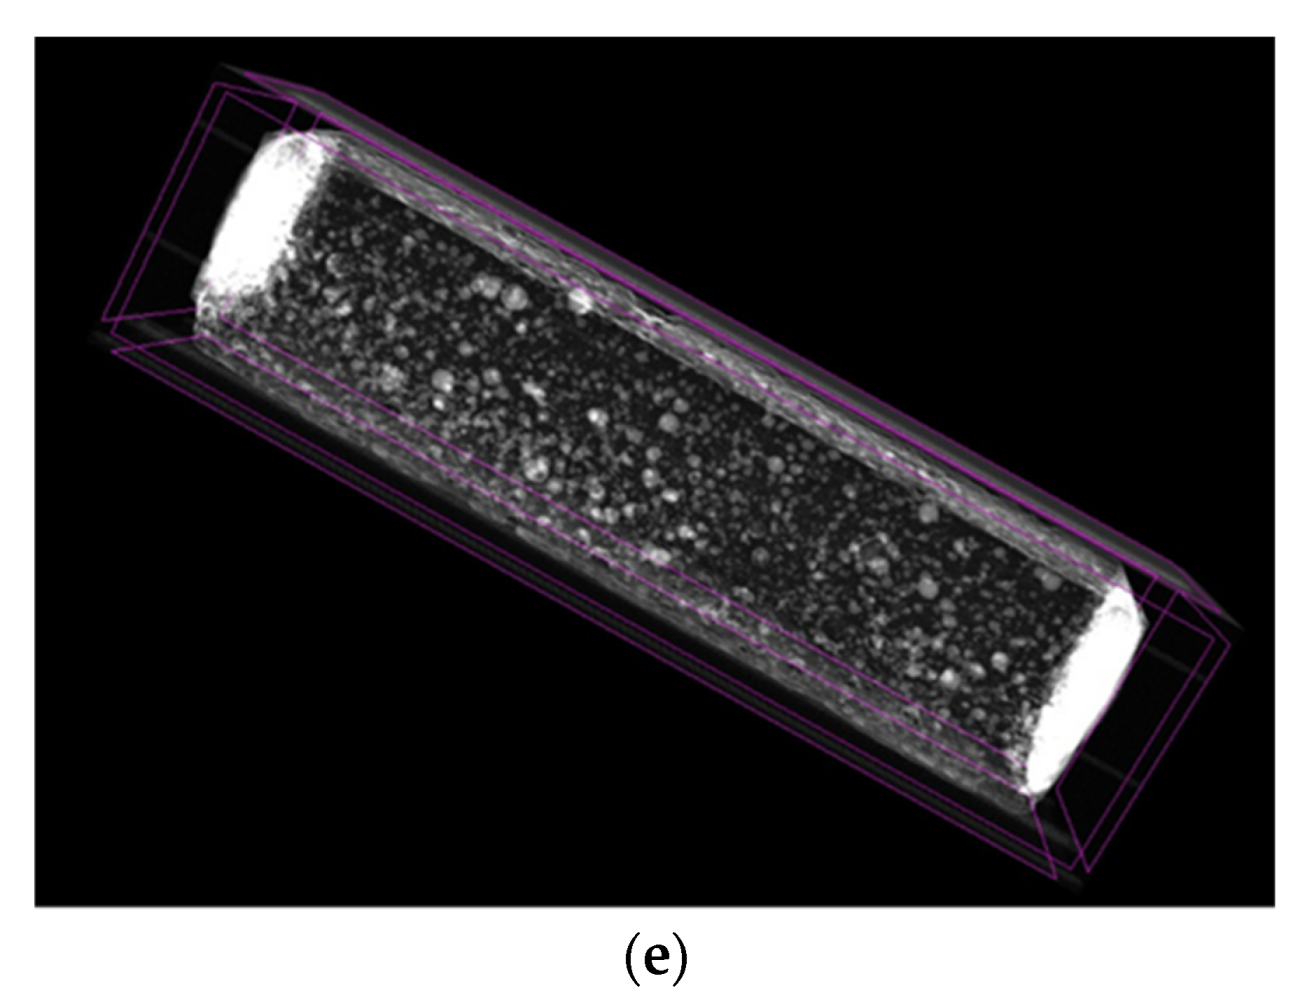
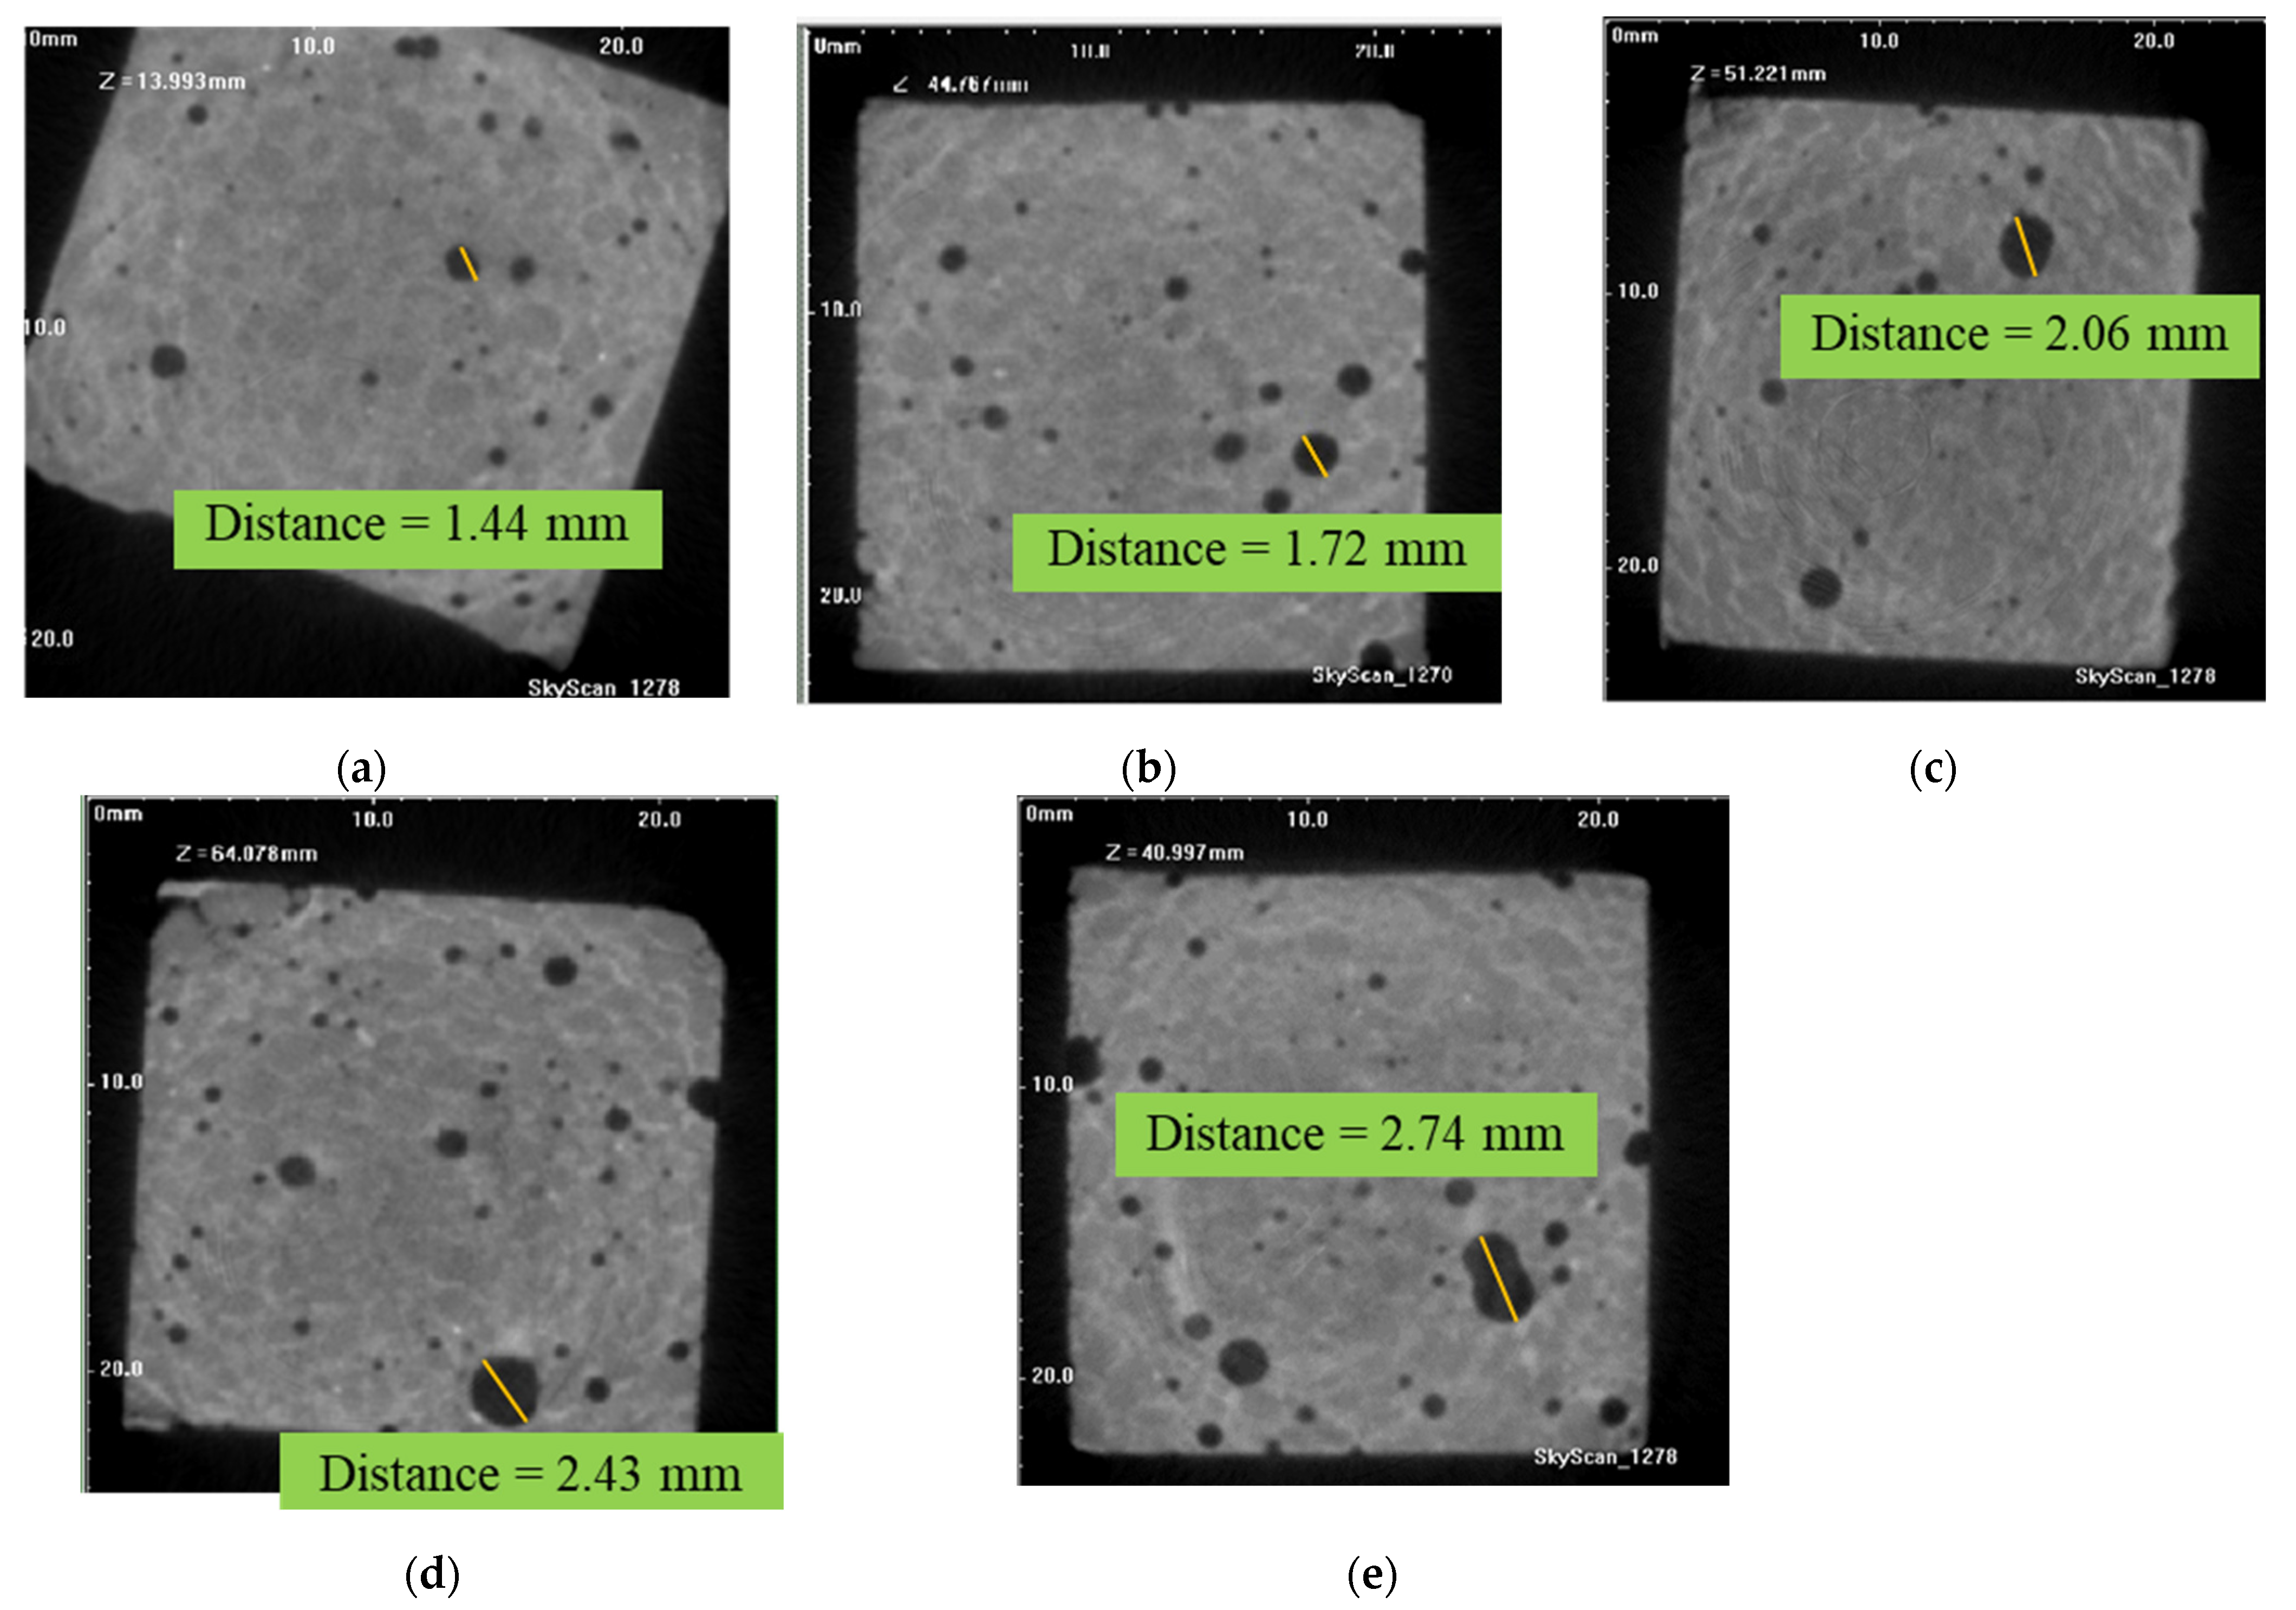
Figure 3 and
Figure 4 depict the pore size distribution in the cementitious matrix in 3D and 2D imaging microstructures using the X-ray micro-CT technique. In
Figure 3, the spatial and 3D micro-pore structure of the plain mortar, and nano-composites with 0.1, 0.2, 0.3, and 0.5 wt.%, respectively, of MWCNTs enhancement, are shown in turn from subfigures (a) to (e). It can be observed that all the reinforced mortars presented a linearly increasing pore distribution.
Figure 4 represents the pore size distribution diameters of the examined specimens. The augmentation of the largest diameter in the individual composite matrix could be observed as the concentration of the nanotubes increased. This could be attributed to the poor-quality dispersion of the nano-powder as the amount of the nanotubes increased, as well as the formation of agglomerates in the matrix, resulting in air entrapment in the developed voids. Consequently, not only the quantitative but also the qualitative inquiry of the pores’ morphology (dimensions, scheme) and concentrations into the whole specimen mass could be determined, as follows from the 3D and 2D images for
Figure 3 and
Figure 4, respectively.
4. Evaluation of Results
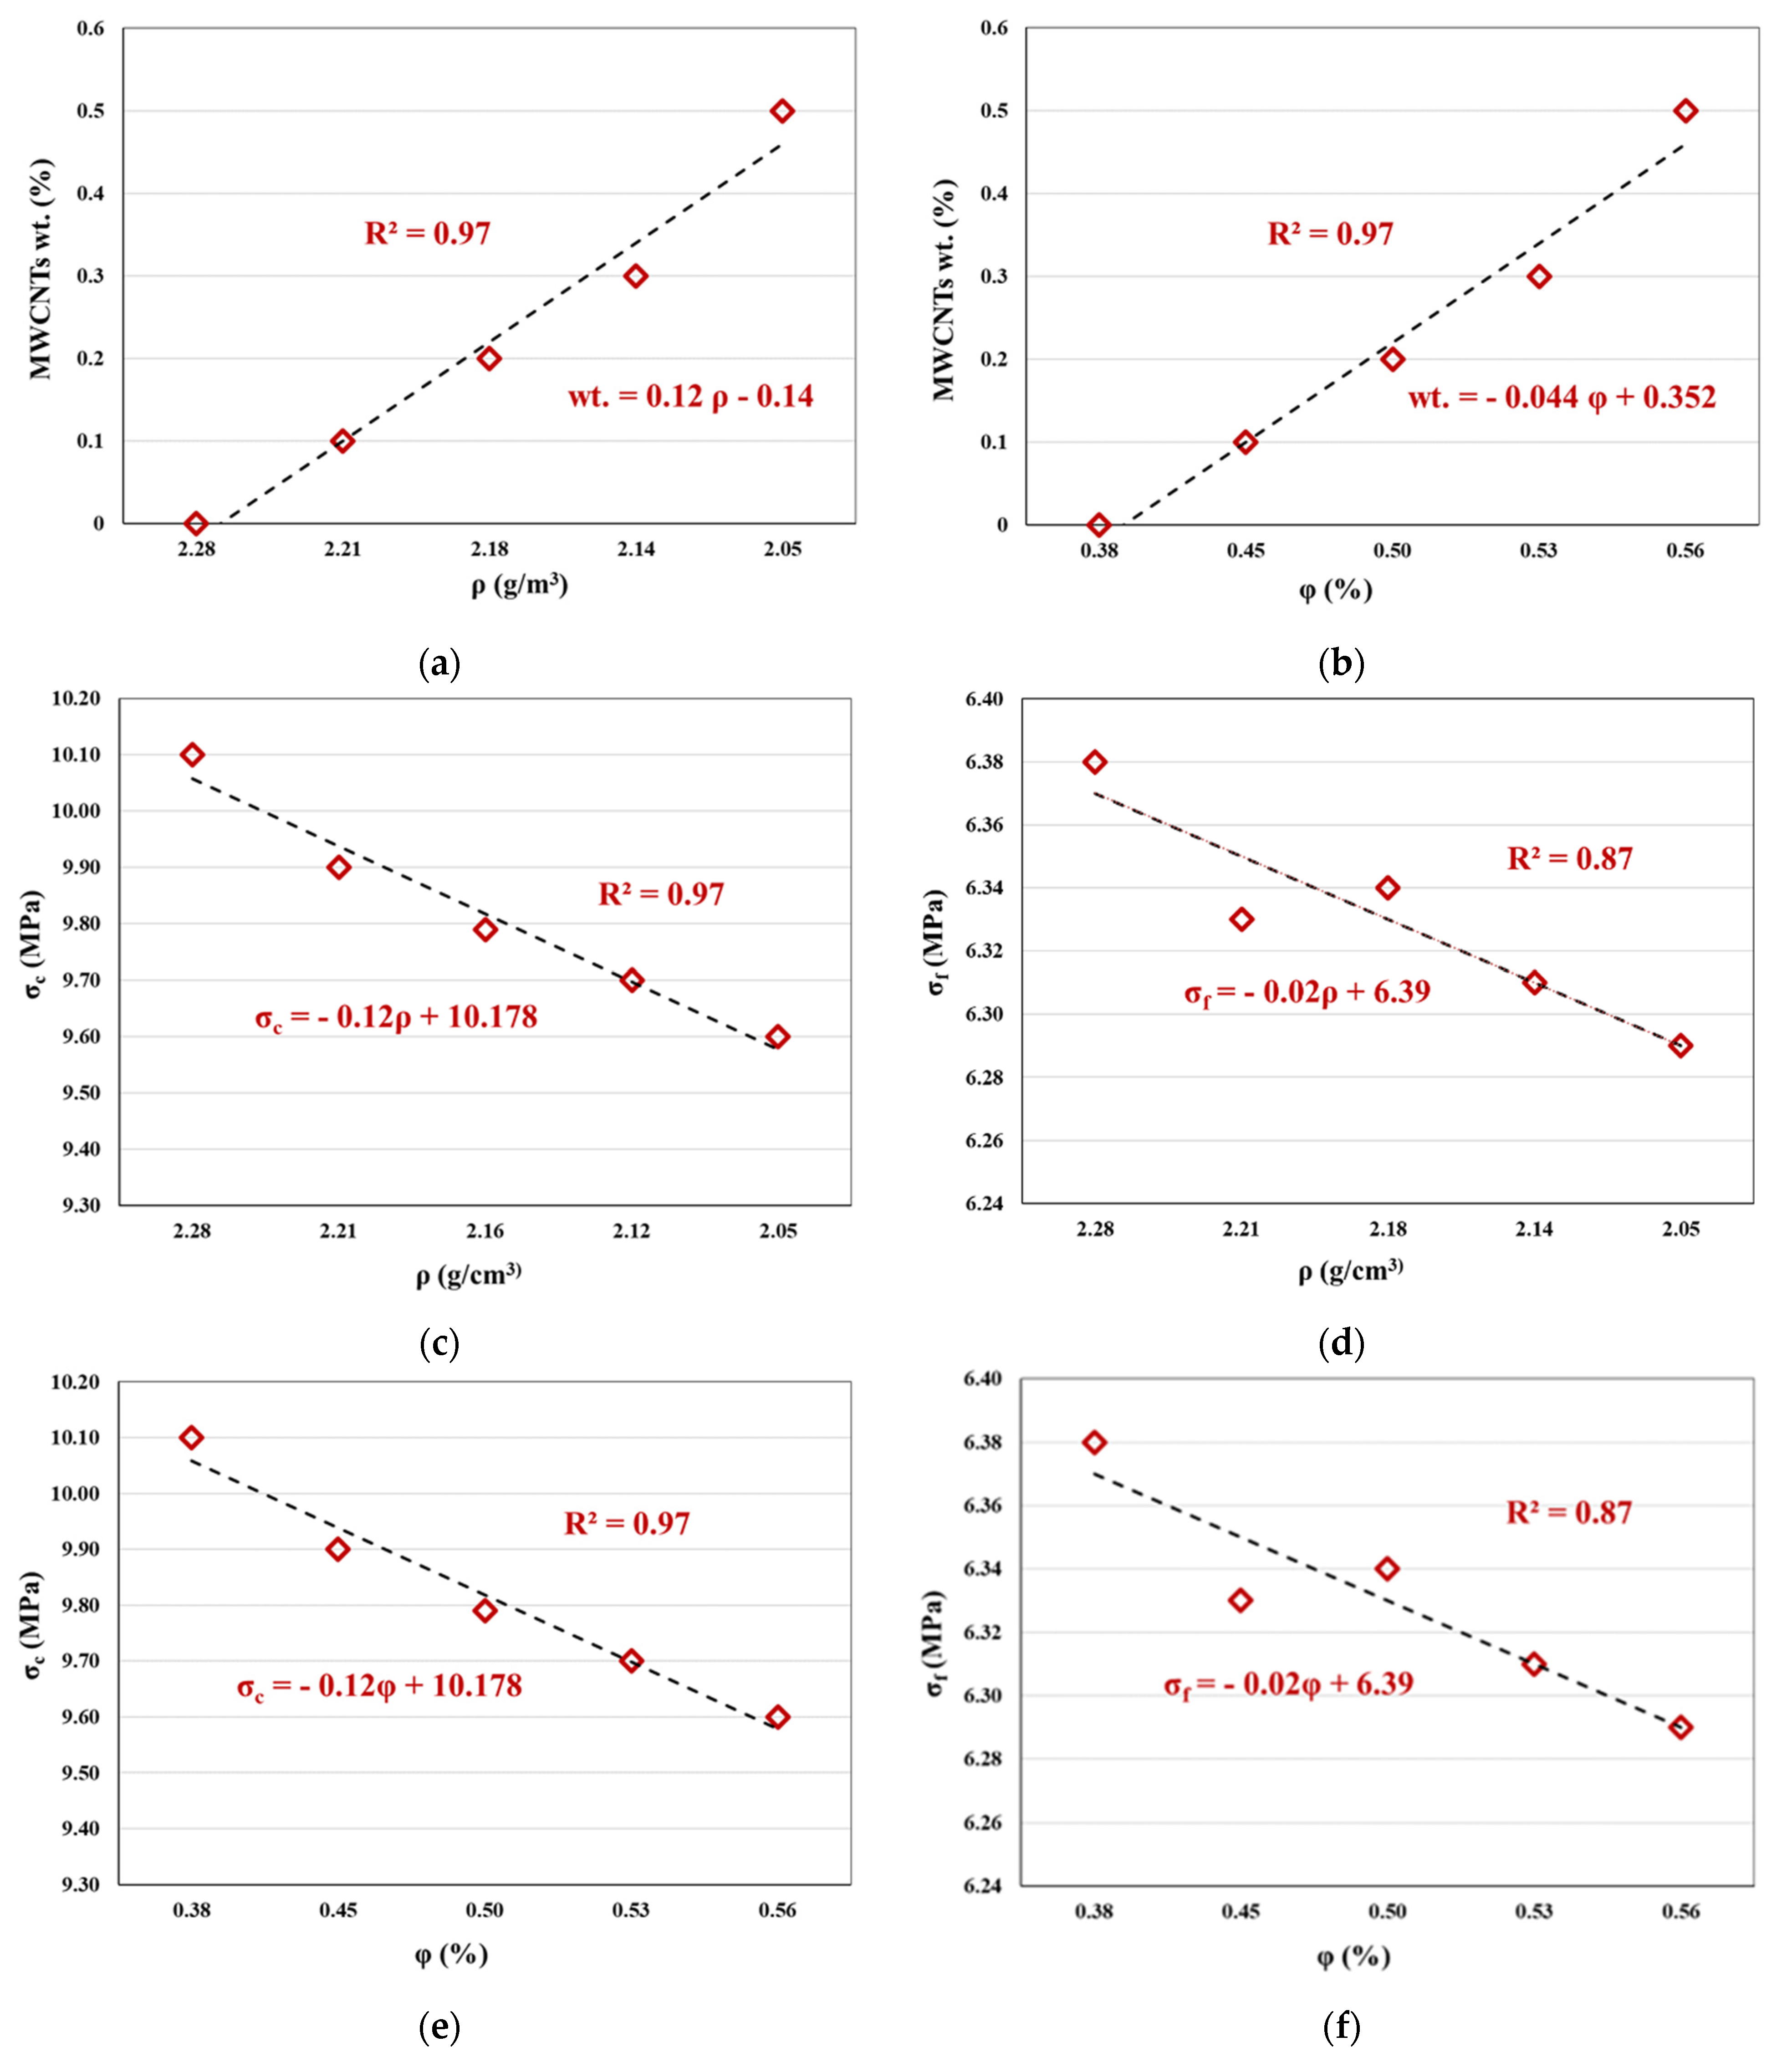
In
Figure 5, the influence of the density and pore size distribution and the correlation with the mechanical response of mortar composites is shown. The linearity of the relationship between the flexural σ
f and compressive strength σ
c or the different MWCNTs concentrations with the selected parameters of density ρ and porosity φ of all the nano-reinforced specimens was inspected. Specifically, in
Figure 5a,b the different amounts of MWCNTs integrated into the mortar matrix on the x-axis are correlated with the density and porosity on the y-axis. Regarding the augmentation of the nanotube amounts, the density decreased and the porosity increased. The linear regression revealed that there was a tight relationship between the pore distribution and the parameters φ and ρ. In
Figure 5c,d the flexural and compressive strength were compared with the density values, proving the great linearity with the mechanical strength and closer relationship of the compressive strength compared to the flexural. Similarly, in the case of flexural and compressive strength increment, the porosity decreased as depicted in
Figure 5e,f.
The variation proportion of the mechanical properties of the different concentrations in the cement matrix analogous to the pore amount φ% and the density ρ (g/m3) is expressed by the coefficient of determination, R squared (R2), indicating that the linear regression fits the data when the value of R2 is closest to the value 1.
A noteworthy observation is that all the examined mechanical strengths and nanotubes concentrations provided a strong correlation with the parameters of porosity and density, presenting R
2 equal to 87 and 97. Generally, the best correlation of the parameters was noticed with MWCNTs concentration and compression strength, and less with the flexural strength. Consequently, the results prove that using the density and porosity of the cement–mortar matrix can effectively describe the linear correlation with the mechanical properties (flexural and compressive strength), such that it can be applied for mechanical strength prediction considering its pore size distribution [
10].
5. Conclusions
This study investigated the mechanical strengths of nano-reinforced cement mortars by means of multi-walled carbon nanotubes (MWCNTs), with the microstructural characteristics of density and pore size distribution. An innovative, non-destructive technique, X-ray microcomputed tomography (Micro-CT), with a distinct advantage compared to other methods of qualitative and quantitative investigation, was applied for characterizing the cementitious composites’ spatial micro-pore structure and was correlated by the real macro-scale destructive three-point bending and compressive experimental tests. The crucial parameters of density, ρ, and porosity, φ, indicated the linear response of the compressive and flexural strength of the 2 cm × 2 cm × 8 cm nano-modified prisms, as well as the concentrations of the MWCNTs additives at 0.1, 0.2, 0.3, and 0.5 wt., respectively, by the mass of cement. This analysis revealed that the density and porosity values processed by the micro-CT 3D in vivo imaging of the microstructure were linearly correlated with the mechanical strength in order to estimate the dispersion consequence of the different nanotube concentrations. The primary aim of this investigation was achieved by proving that a deeper understanding of the complex nano- and microstructures could be utilized for simulations, also providing insight for optimizing the design of advanced cementitious composites, reducing cost, time, and effort.
Author Contributions
Conceptualization, A.K.T., J.G.F. and C.E.C.; data curation, A.K.T. and M.E.V.; formal analysis, A.K.T., M.E.V. and Z.S.M.; investigation, A.K.T., M.E.V. and Z.S.M.; methodology, A.K.T., J.G.F. and C.E.C.; project administration, J.G.F.; software, A.K.T. and M.E.V.; supervision, J.G.F. and C.E.C.; validation, A.K.T., M.E.V. and Z.S.M.; visualization, A.K.T., M.E.V. and Z.S.M.; writing—original draft, A.K.T.; writing—review and editing, A.K.T., J.G.F., M.E.V., Z.S.M. and C.E.C. All authors have read and agreed to the published version of the manuscript.
Funding
This research received no external funding.
Institutional Review Board Statement
Not applicable.
Informed Consent Statement
Not applicable.
Data Availability Statement
The data presented in this study are available upon request from the corresponding author.
Acknowledgments
The authors gratefully express their acknowledgment to Athanasios Mitropoulos, and his team, for their valuable contribution to the Hephaestus Advanced Laboratory of International Hellenic University (IHU).
Conflicts of Interest
The authors declare no conflict of interest.
References
- Fantidis, J.; Bandekas, D.V.; Kogias, P.; Vordos, N. The Evaluation on Dual, Triple and Quadruple Energy X-ray Systems for the Material Characterization of a Suspicious Bulky Object. In Proceedings of the 10th WSEAS International Conference on Energy, Tenerife, Spain, 10–12 January 2014; pp. 143–148. [Google Scholar]
- Fantidis, J.; Dalakas, A.; Potolias, C.; Karakoulidis, K.; Kogias, P. A Fast Neutron and Gamma Ray System for the Detection of Illicit Materials Based on Simple Isotopic Sources. J. Eng. Sci. Technol. Rev. 2016, 9, 52–58. [Google Scholar] [CrossRef]
- Metaxa, Z.S.; Boutsioukou, S.; Amenta, M.; Favvas, E.P.; Kourkoulis, S.K.; Alexopoulos, N.D. Dispersion of Multi-Walled Carbon Nanotubes into White Cement Mortars: The Effect of Concentration and Surfactants. Nanomaterials 2022, 12, 1031. [Google Scholar] [CrossRef] [PubMed]
- Metaxa, Z.S.; Tolkou, A.K.; Efstathiou, S.; Rahdar, A.; Favvas, E.P.; Mitropoulos, A.C.; Kyzas, G.Z. Nanomaterials in Cementitious Composites: An Update. Molecules 2021, 26, 1430. [Google Scholar] [CrossRef] [PubMed]
- Thomoglou, A.K.; Falara, M.G.; Gkountakou, F.I.; Elenas, A.; Chalioris, C.E. Influence of Different Surfactants on Carbon Fiber Dispersion and the Mechanical Performance of Smart Piezoresistive Cementitious Composites. Fibers 2022, 10, 49. [Google Scholar] [CrossRef]
- Thomoglou, A.K.; Falara, M.G.; Gkountakou, F.I.; Elenas, A.; Chalioris, C.E. Smart Cementitious Sensors with Nano-, Micro-, and Hybrid-Modified Reinforcement: Mechanical and Electrical Properties. Sensors 2023, 23, 2405. [Google Scholar] [CrossRef] [PubMed]
- Chung, S.Y.; Kim, J.S.; Stephan, D.; Han, T.S. Overview of the use of micro-computed tomography (micro-CT) to investigate the relation between the material characteristics and properties of cement-based materials. Constr. Build. Mater. 2019, 229, 116843. [Google Scholar] [CrossRef]
- Chalioris, C.E.; Papadopoulos, N.; Angeli, G.; Karayannis, C.; Liolios, A.; Providakis, C. Damage Evaluation in Shear-Critical Reinforced Concrete Beam Using Piezoelectric Transducers as Smart Aggregates. Open Eng. 2015, 5, 373–384. [Google Scholar] [CrossRef]
- Voutetaki, M.E.; Papadopoulos, N.A.; Angeli, G.M.; Providakis, C.P. Investigation of a new experimental method for damage assessment of RC beams failing in shear using piezoelectric transducers. Eng. Struct. 2016, 114, 226–240. [Google Scholar] [CrossRef]
- Karayannis, C.G.; Voutetaki, M.E.; Chalioris, C.E.; Providakis, C.P.; Angeli, G.M. Detection of flexural damage stages for RC beams using Piezoelectric sensors (PZT). Smart Struct. Syst. 2015, 15, 997–1018. [Google Scholar] [CrossRef]
| Disclaimer/Publisher’s Note: The statements, opinions and data contained in all publications are solely those of the individual author(s) and contributor(s) and not of MDPI and/or the editor(s). MDPI and/or the editor(s) disclaim responsibility for any injury to people or property resulting from any ideas, methods, instructions or products referred to in the content. |
© 2023 by the authors. Licensee MDPI, Basel, Switzerland. This article is an open access article distributed under the terms and conditions of the Creative Commons Attribution (CC BY) license (https://creativecommons.org/licenses/by/4.0/).


 ,
, 


