Proceeding Paper

BERT (Bidirectional Encoder Representations from Transformers) for Missing Data Imputation in Solar Irradiance Time Series †

by
Llinet Benavides Cesar
*,
Miguel-Ángel Manso-Callejo
and
Calimanut-Ionut Cira
Departamento de Ingeniería Topográfica y Cartográfica, E.T.S.I. en Topografía Geodesia y Cartografía, Universidad Politécnica de Madrid, C/Mercator 2, 28031 Madrid, Spain
*
Author to whom correspondence should be addressed.
Presented at the 9th International Conference on Time Series and Forecasting, Gran Canaria, Spain, 12–14 July 2023.
Eng. Proc. 2023, 39(1), 26; https://doi.org/10.3390/engproc2023039026
Published: 30 June 2023
(This article belongs to the Proceedings of The 9th International Conference on Time Series and Forecasting)

Abstract

:
The availability of solar irradiance time series without missing data is an ideal scenario for researchers in the field. However, it is not achievable for a variety of reasons, such as measurement errors, sampling gaps, or other factors. Time series imputation methods can be a solution to the lack of data and, in this paper, we study the applicability of Bidirectional Encoder Representations from Transformers (BERT) as an irradiance time series imputation solution. In this regard, a BERT model was trained from scratch for the masked language modelling (MLM) task, and the quality of the imputation was evaluated according to the number of missing values and the position within the series. The experiments were conducted over a dataset of 165 stations, captured by meteorological stations distributed over the Spanish regions of Galicia, Castile, and León. In the evaluation process, an average coefficient of determination (R2 score) of 0.89% was obtained, the maximum result being 0.95%.

1. Introduction

Time series are sequences of data that are recorded at regular intervals of time, and are ordered according to the time in which they are recorded [1]. In many fields where it is important to have complete and accurate data for analysis and decision making, such as meteorology, healthcare, and solar energy, missing data imputation is a common challenge.
The imputation method is an important time series analysis, in which missing values in the series are filled in using available observed values [2]. In [2], Fang et al. defined nine types of the missing value imputation methods, based on the methodology used for filling the values. The methods included were: (1) deletion methods, (2) neighbour-based methods, (3) constraint-based methods, (4) regression-based methods, (5) statistical-based methods, (6) matrix factorization/based methods, (7) expectation-maximization-based methods, (8) multi-layer perceptron-based methods, and (9) methods based on deep learning (DL). For each of the established types, examples were given, although the study focused on imputation methods based on DL.
In this regard, imputation of solar energy time series [3] is a topic that has been explored with traditional statistical methods [4,5] and with more modern machine learning (ML) methods [6,7]. Demirhan et al. [5] evaluated 36 imputation methods for solar irradiance series with a dataset collected in Australia—the considered methods of imputation were variants of the methods listed hereafter, namely: (1) interpolation (such as linear, spline, or Stineman), (2) Kalman filters, (3) persistence, (4) weighted moving average, and (5) random sample. The authors defined sixteen experimental scenarios, and concluded that the most accurate methods for minutely and hourly series were the linear and the Stineman interpolations (based on a function that runs through a set of points in the x y -plane and returns the estimates of the calculated slopes); for daily or weekly series, the weighted moving average delivered the best result.
De-Paz-Centeno et al. [7] proposed a neural network to impute values for series with missing values in ranges of 30% to 70% of the total number of values, and recommended its use for scenarios with 50% of lost vales. The proposed neural network was a convolutional neural network following the encoder–decoder structure, and the experiments were carried out on a private and a public dataset, each containing two years of samples. The application of the proposed architecture resulted in coefficients of determination (R2 score) ranging range between 0.81 and 0.98, considerably higher when compared to the other models evaluated.
Due to the sequential nature of the time series, it is possible to use models developed for natural language processing (NLP), such as transformers, in their processing. Transformers are based on attention mechanisms (they relate different positions of the same sequence to compute a representation of the sequence; also known as self-attention) and proved successful at solving sequential tasks, while easily handling long-range dependencies [8]. Transformer-based models have been applied and achieved good results in the imputation of time series [9,10].
Bidirectional Encoder Representations from Transformers (BERT) [11] is a DL model based on transformers that uses bidirectional self-attention by jointly conditioning the left and right context, being is one of the most popular DL-based linguistic models [12]. BERT can be pre-trained using two unsupervised tasks, the masked language model (MLM) and next sentence prediction (NSP). The MLM randomly masks a part of the tokens in the input sequence, and the goal is to predict the masked words based solely on its context. For the NSP task, BERT model is pre-trained on representations of pairs of texts to predict a sequence from the previous sequence. BERT has also been pre-trained for other areas of knowledge, such as vision [13,14] bioinformatics and computational biology [15,16,17], or geospatial representation learning based on a point of interest [18].
In this study, the BERT’s performance in irradiance time series imputation will be assessed by training the model from scratch for the MLM task. To the authors’ knowledge, this is the first time the model has been trained on irradiance data. We hypothesized that training directly on a specialized corpus and using a specialized vocabulary could lead to more adapted embeddings and, thus, help performance.
The main contributions of this paper are as follows.
(1)
To the best of the authors’ knowledge, the first BERT model trained from scratch with solar irradiance data is introduced;
(2)
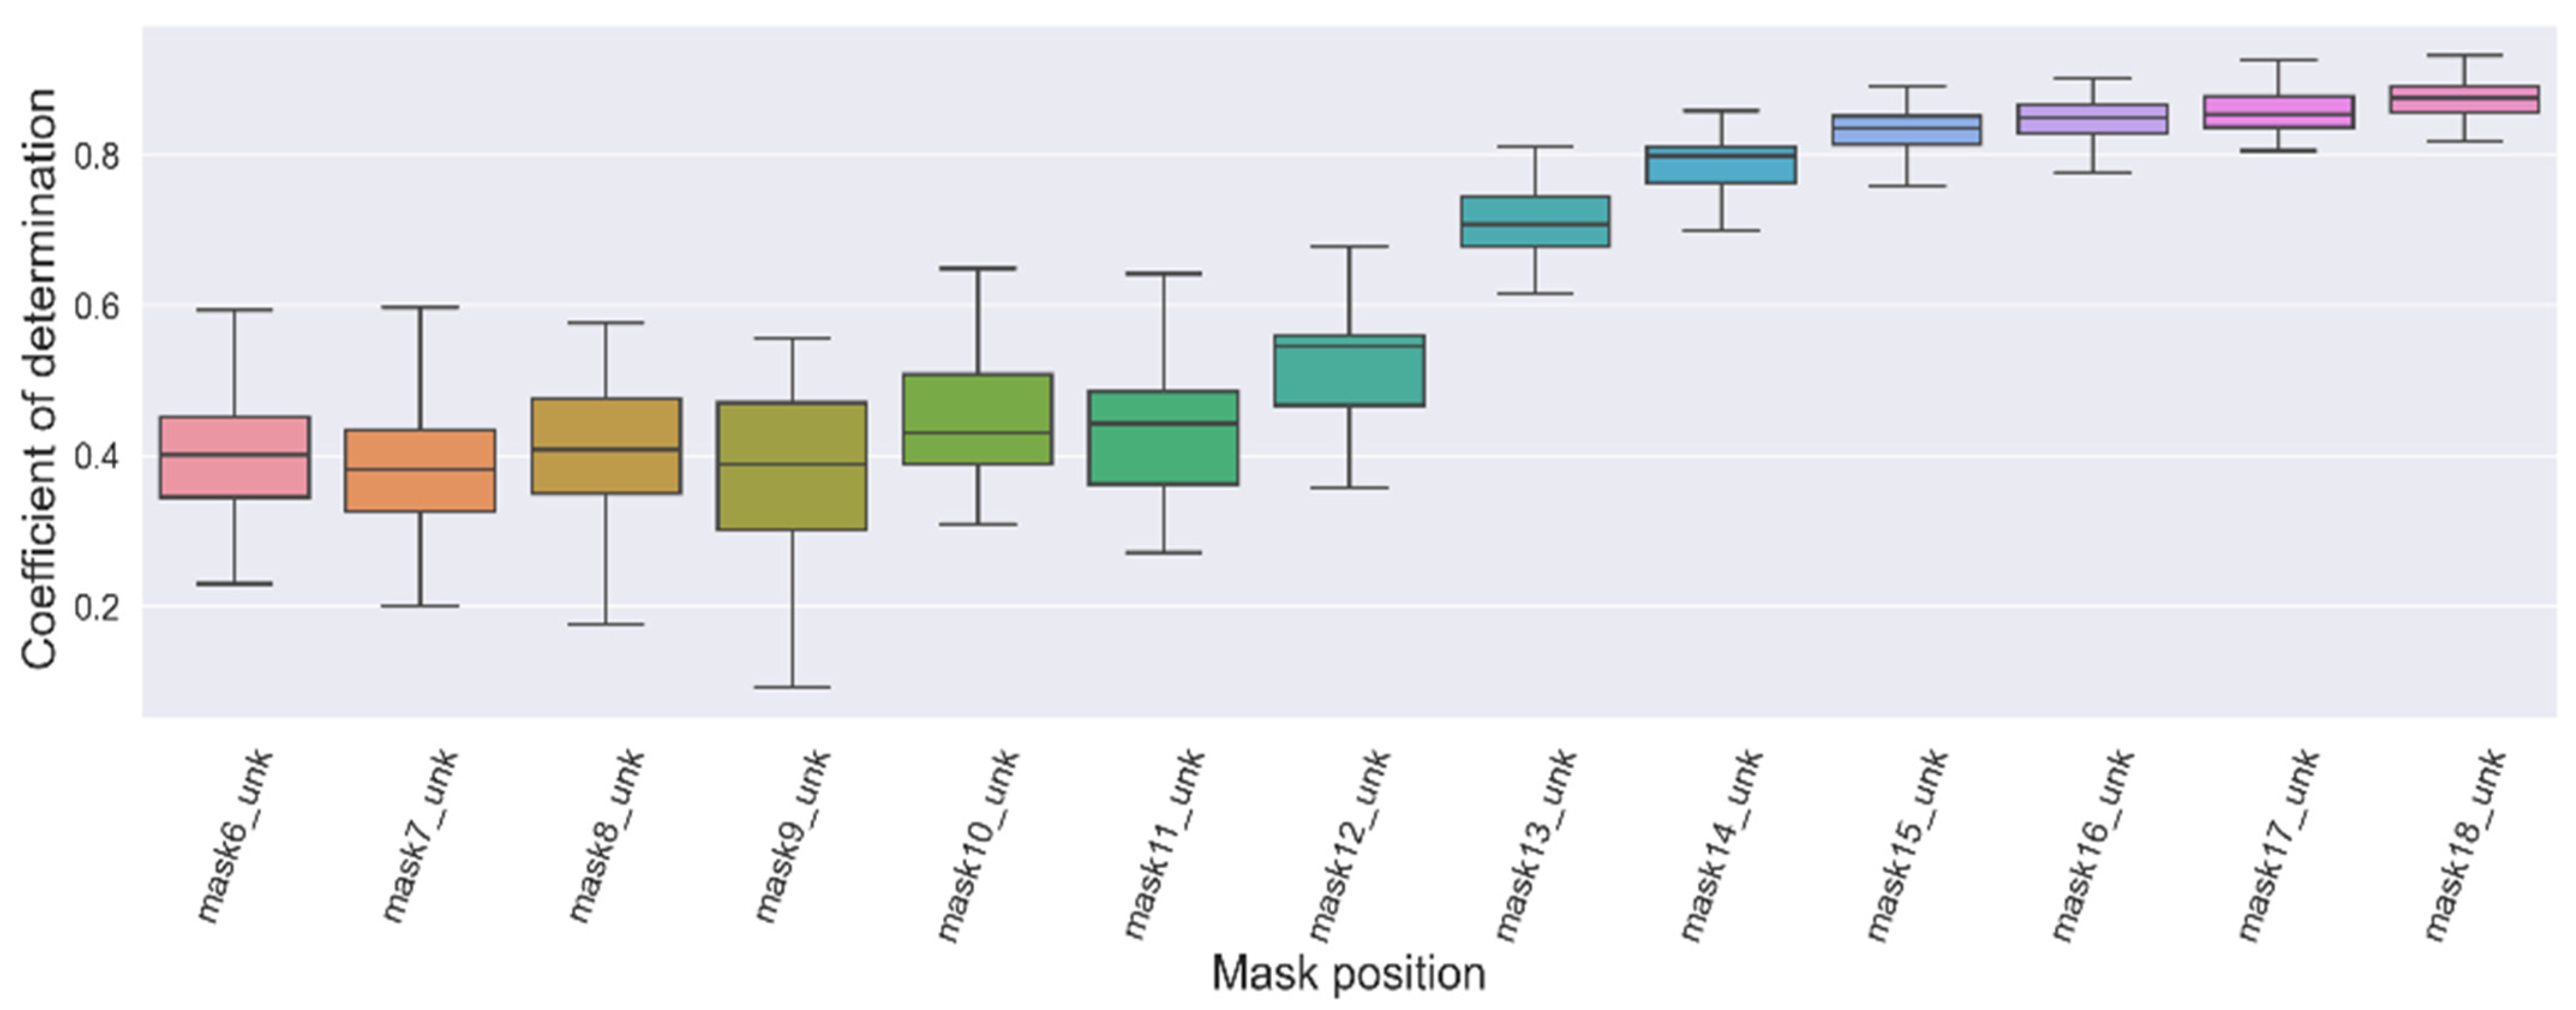
The implementation is evaluated for time series imputation in two scenarios, namely (1) the imputation of a single missing value at a specific position and (2) imputed a missing value where all values were missing after this position in the sequence.
The remaining part of the document is organised as follows. Section 2 describes the model, the data and the methodology used. Section 3 the experiments, and presents the analysis performed. The works ends with Section 4.

2. Methodology

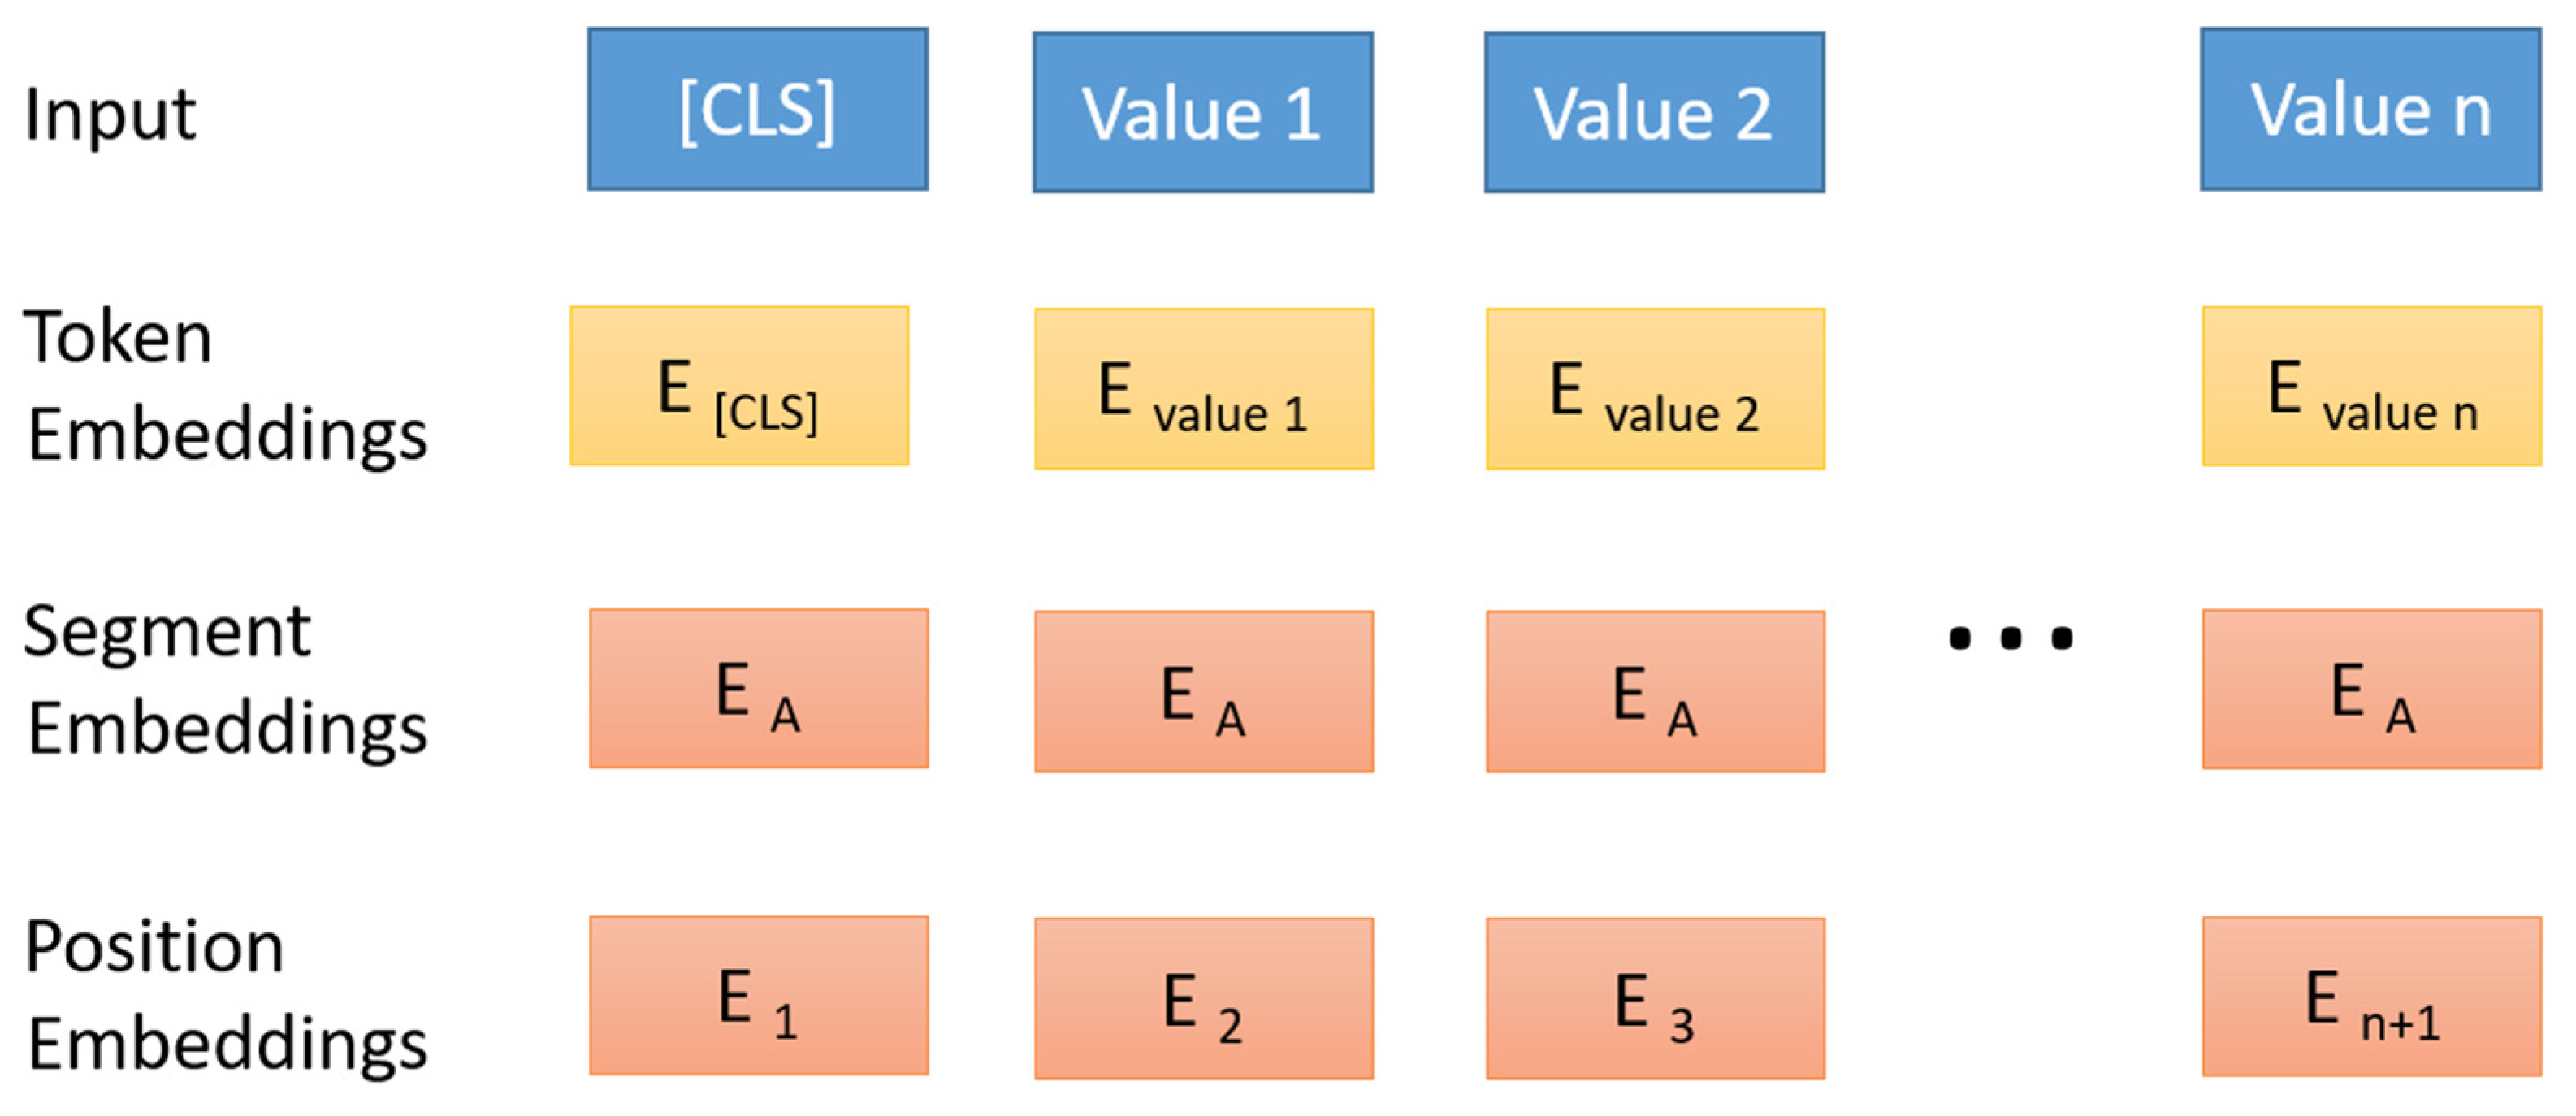
2.1. Studied Model (BERT)

In NLP tasks, the first step in the processing pipeline is the tokenization (the process of dividing the text into small units, called tokens; tokens can be the words of a sentence or a sequence of characters).
BERT is a complex and advanced linguistic model, where the sentence is parsed as a token chain—each token in the chain is compared against all other tokens to gather information and learn the dynamics of the context. This information is stored in the form of embeddings (a numerical representation of the information). Figure 1 shows the representation of the BERT input for a sequence of irradiance values.
In the field of NLP, the MLM task (mentioned in Section 1) enforces bi-directional learning from text by masking (or covering) a word in a sentence. In the process of tokenization, BERT uses special tokens, such as “[MASK]”, to cover the word to be predicted. This way, BERT is forced to use neighboring words of the masked word to predict it. In the process, the model will generate the most likely substitution for any input containing one or more “[MASK]” tokens. For example, if BERT’s input would be the following sequence of irradiance values, ( 5 , 56 , 76 , 89 , 112 , M A S K , 145 , 172 , 189 ) , a probable output would be ( 45 , 56 , 76 , 89 , 112 , 123 , 145 , 172 , 189 ) . The model assigned the masked token a value based on the learning. It is important to note that BERT uses other special tokens, such as “[CLS]”, to identify the beginning of the sequence; “[UNK]”, to signal an unknown word; “[PAD]”, when sentences are not of the same length to fill in missing spaces; or “[SEP]”, a sentence separator token used for input/output in the NSP task described in Section 1.

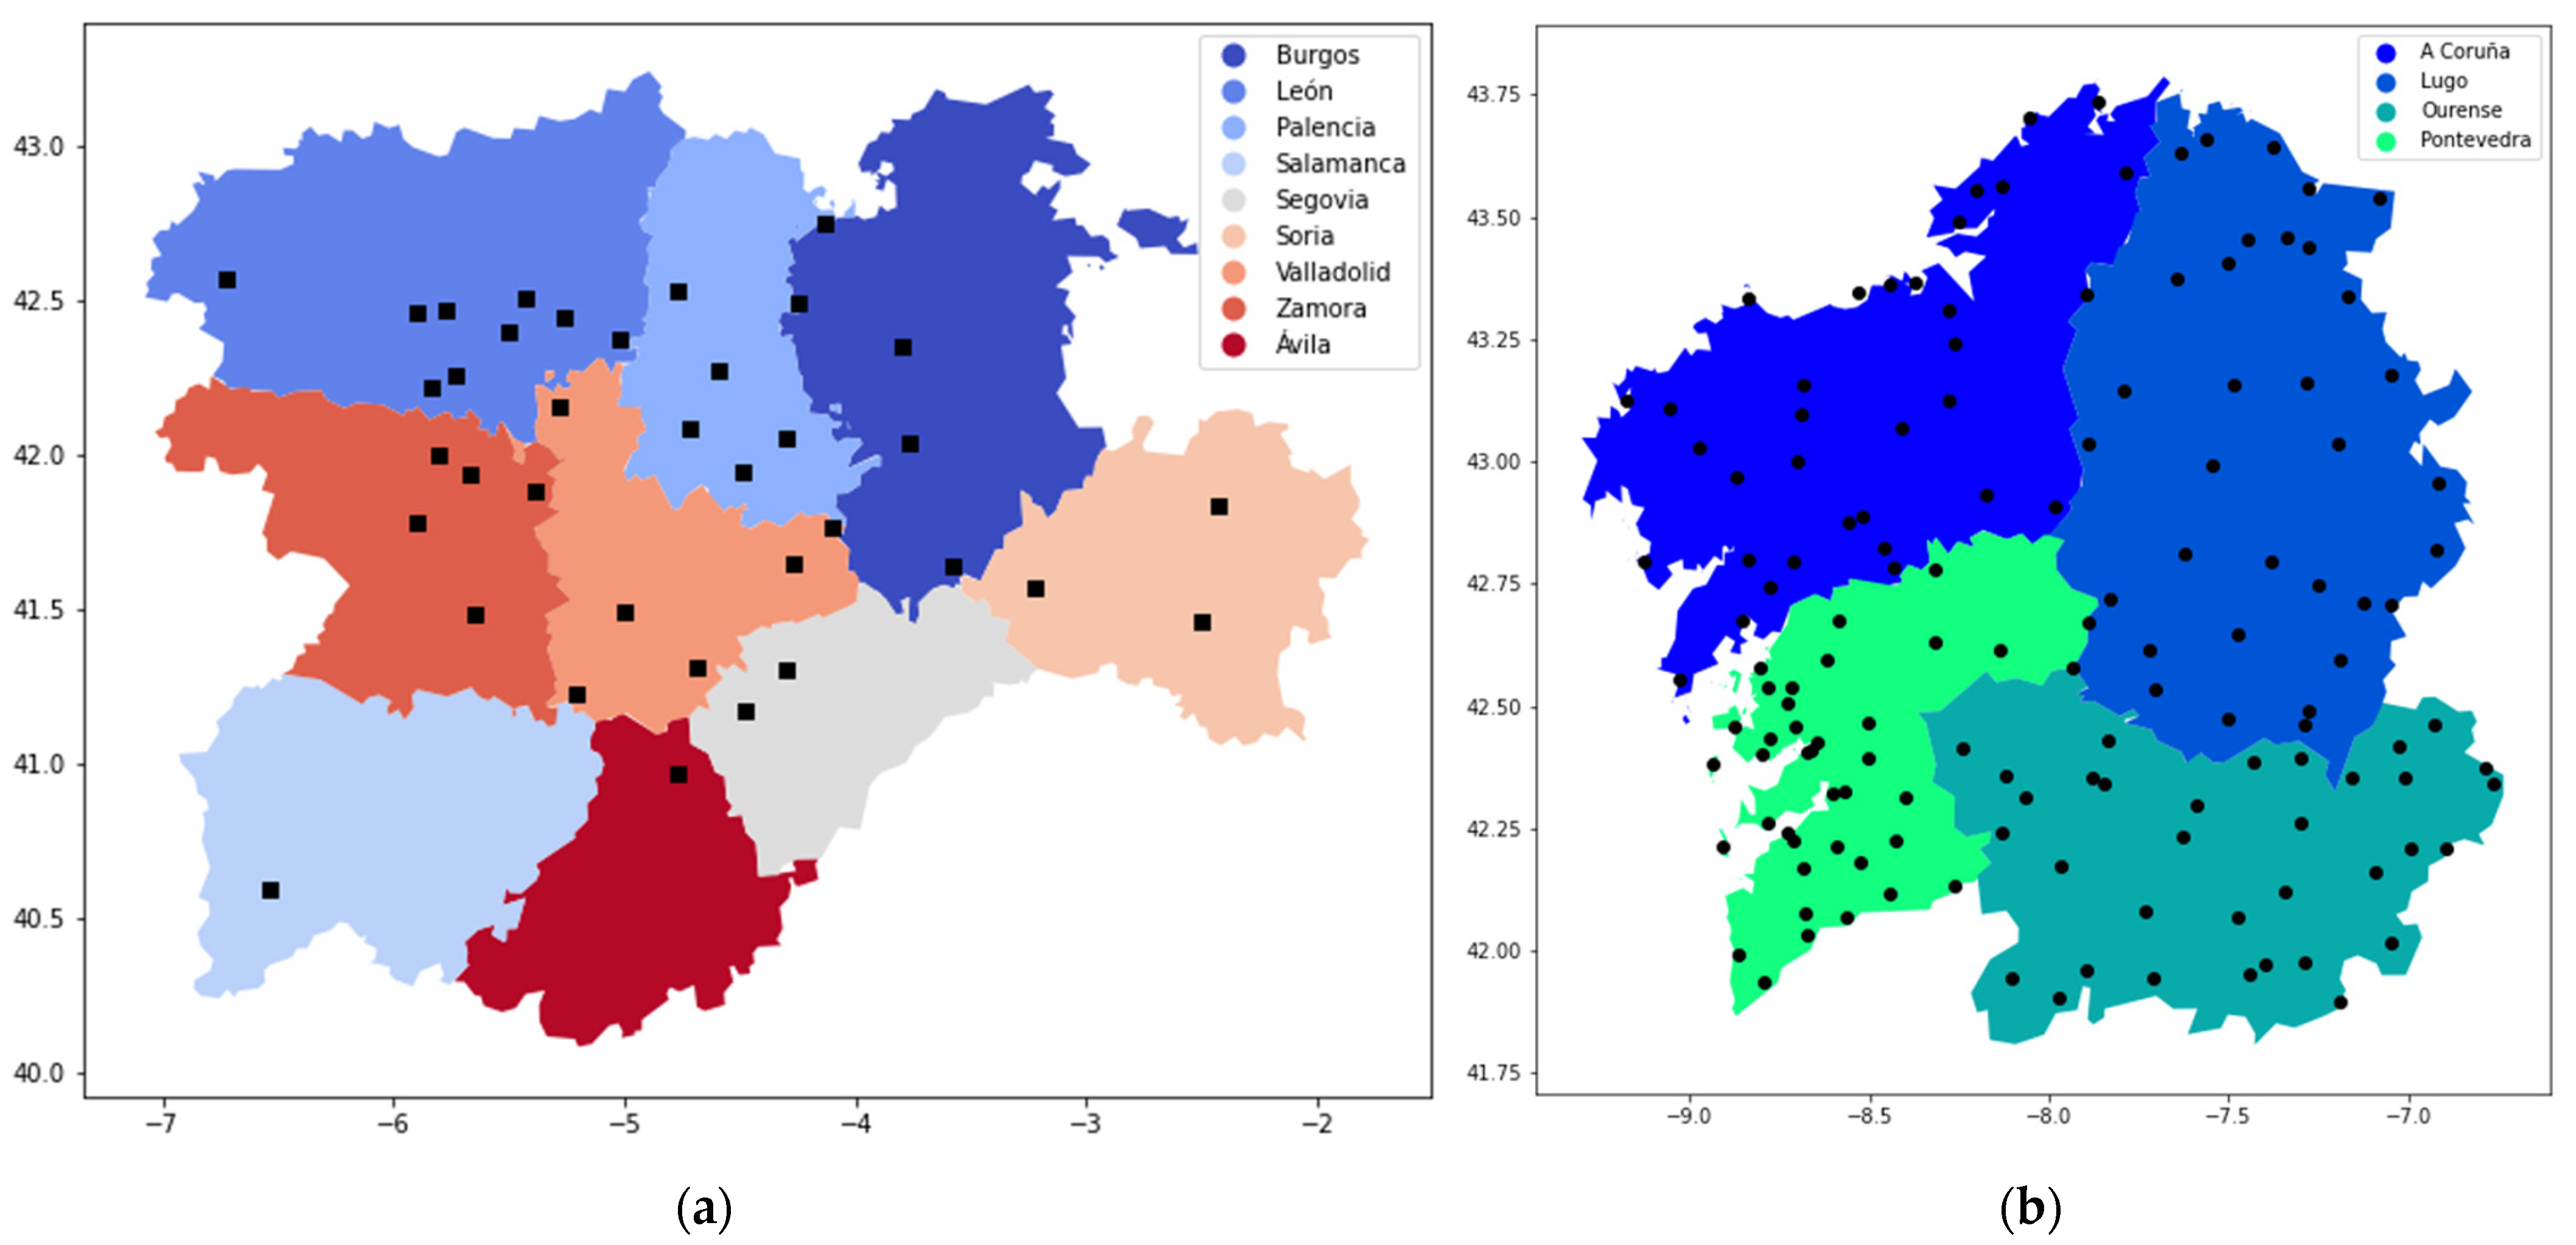
2.2. Data Description

In this study, the experiments were carried out on two solar irradiance datasets. The first one is composed of records from 112 meteorological stations in Galicia, stored in a tabular .csv file format, containing two years of information (from February 2017 to February 2019), with a time resolution of 10 min. The variables observed at the stations were temperature, atmospheric pressure, precipitation, wind speed, wind direction, and solar irradiance. The second dataset, CyL-GHI [19], contains information from the 53 stations located in Castile and León, and continuously covers 21 years (the period from January 2001 to December 2021), with a temporal resolution of 30 min. The spatial distribution of the stations is presented in Figure 2.
The variables observed at the stations were temperature, relative humidity, precipitation, wind speed, wind direction and solar irradiance. In addition, there is an identifier for each of the stations, as well as their geographical coordinates and height. However, only the solar irradiance time series of both datasets were used for the study. The data is grouped by stations and, using one time series for each station, implies that 165 GHI time series were used in this study.

2.3. Methodology

The BERT model was trained from scratch for the MLM task. Experiments were conducted to evaluate two scenarios: (1) Scenario 1, where a single missing value was imputed at a specific position in the sequence; and (2) Scenario 2, imputing a missing value where all values were missing after a position in the sequence.
In our study, the sentence (or sequence) will be the GHI time series corresponding to a day, each of the time step values shall represent one token for the model. The masked value to be completed can be found in any position into the time series of the day. In this regard, the data pre-processing step should ensure that all sequences to be used in training the model are complete, and ensure that test data are not part of the input.
The first operation applied was data preparation. In this regard, the datasets featured different temporal resolutions for the irradiance values—data from Galicia had a temporal resolution of 10 min, while data from Castile and León featured a temporal resolution of 30 min. To unify the temporal resolutions for all the data, the frequency of data from Galicia was shifted to 30 min.
Next, the last year of each dataset was separated for the test set. Night hours were eliminated because during night-time, solar irradiance is zero. Sequences of values were created with daytime data only, ensuring also that only days with no missing values were used.
To prepare the input data for the BERT model, it was necessary to reformat the data to plain text and save the time series of each station in a separate file, where each row contains the irradiance values of one day. WordPiece embeddings [20] were used in this study—WordPiece splits each irradiance value for a time step into a token. In our case, a vocabulary of 1600 tokens was selected, to include all values present in the training data (the irradiance can take values from 0 to 1600). The MLM task involves training the model by randomly placing the special token “[MASK]” at different positions in the chain, so that the model learns how to predict it. The special classification token “[CLS]” is always the first token in each sequence, and the “[UNK]” was also used to indicate that there are unknown values in the sequence (their capabilities are indicated in Section 2.1).
The following search space was considered: (1) the number of training epochs (“num_train_epochs”), (2) the training batch size (“per_device_train_batch_size”), (3) the number of gradients to accumulate (“gradient_accumulation_steps”) before updating the weights (between the values ( 2 , 6 , 8 , 10 , 12 , and (4) the batch size (with 32, 64, and 128 samples). The hyperparameter configuration that achieved the best results featured ten training epochs, a batch training size of ten, a validation batch size of training of sixty-four, eight accumulable gradients, twelve attention heads, and twelve hidden layers. The model saved checkpoints every 500 steps.
The selected performance metric for evaluation is the coefficient of determination, or R2 score, a statistical measure that indicates how well a model fits the observed data. The R2 score is calculated using the actual value ( y i ) and the predicted value ( y ^ i ) with Equation (1), where y i = 1 n i = 1 n y i .
R 2   s c o r e = 1 i = 1 n y i y ^ i 2 i = 1 n y i y i 2

3. Results and Discussion

The analysis of the results will be carried out according to the two established scenarios outlined in Section 2.3. The BERT model was trained once and evaluated for the two considered scenarios.

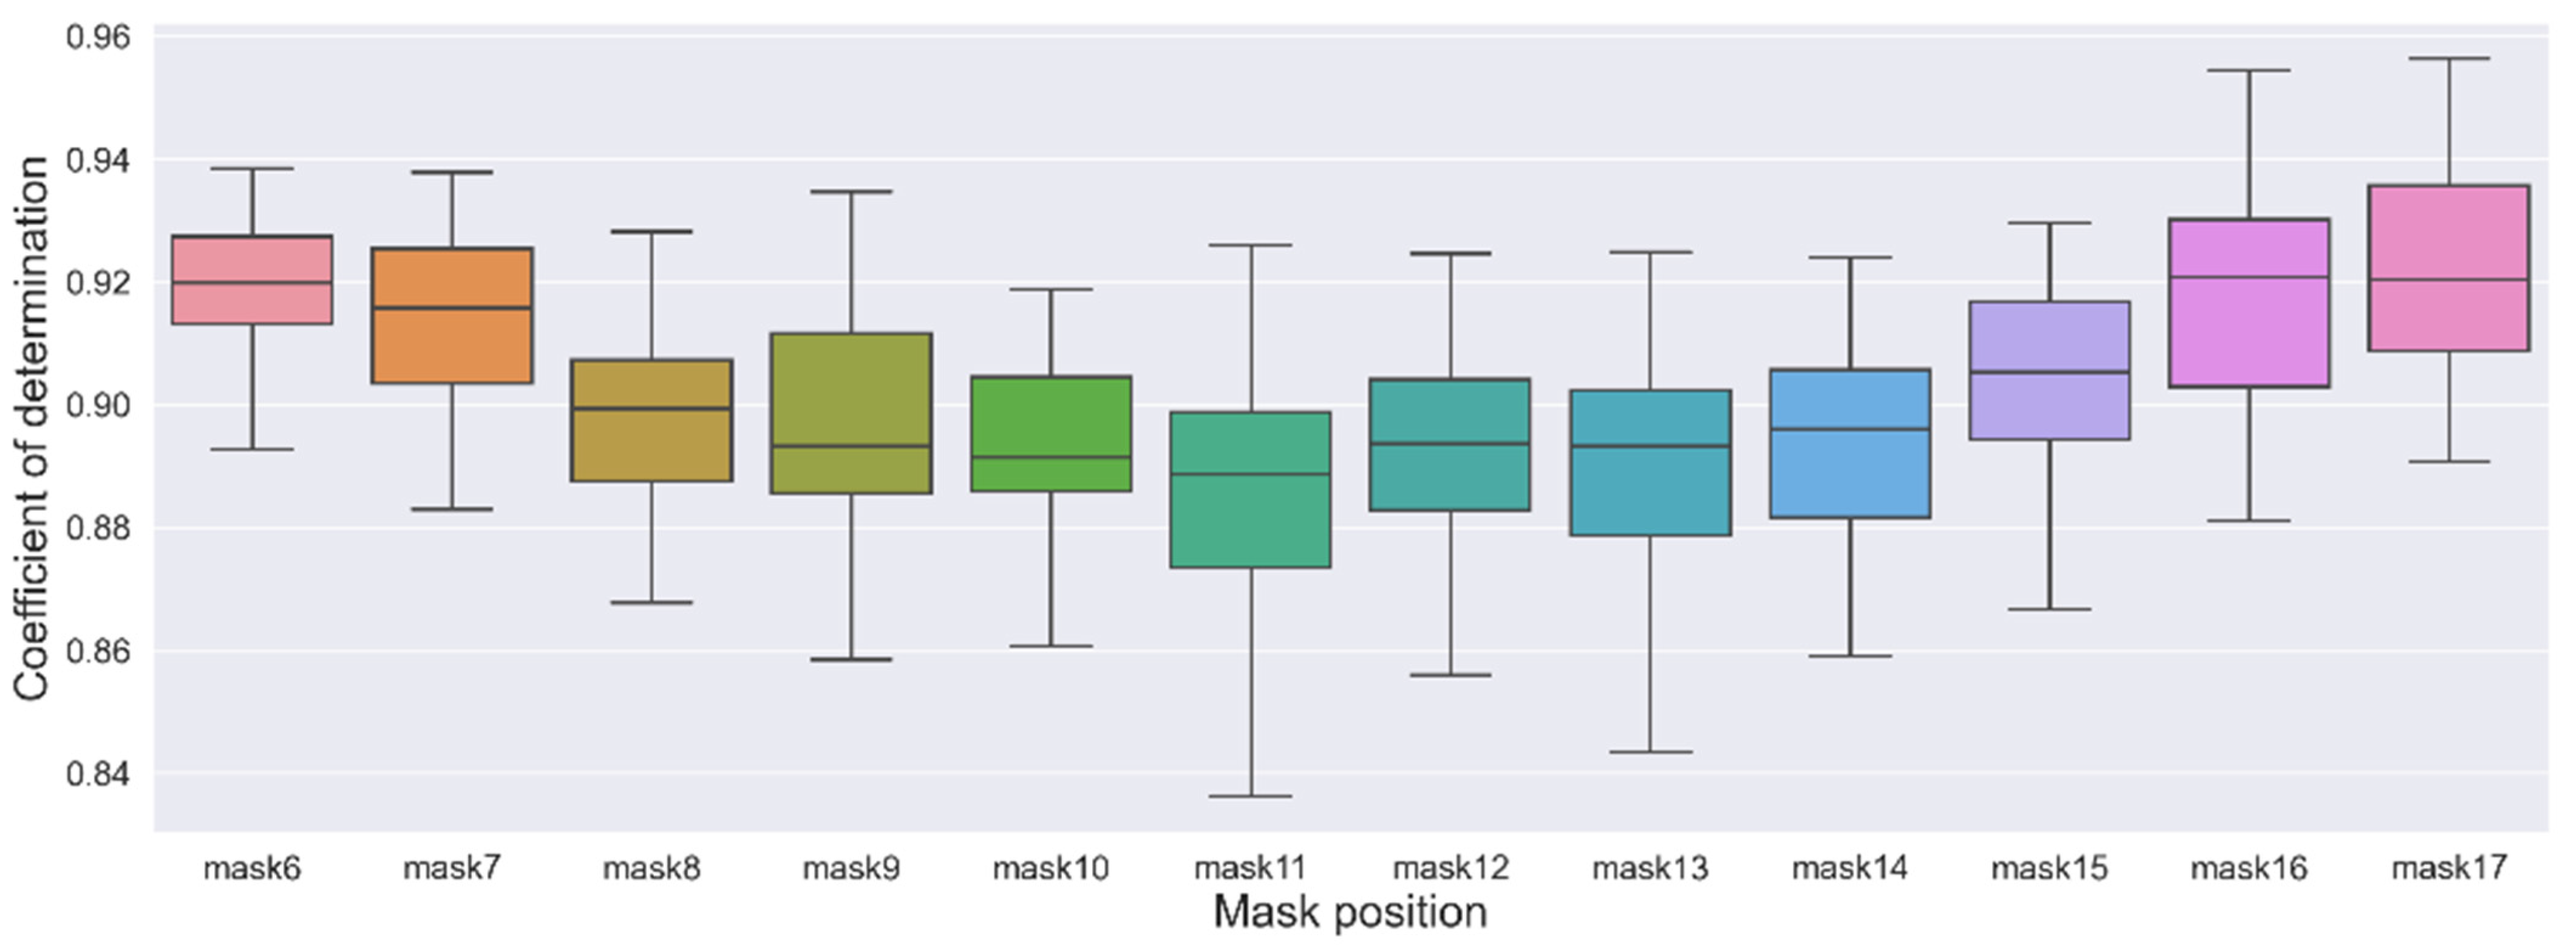
3.1. Scenario 1: Imputation of a Single Missing Value at a Specific Position

In Scenario 1, the impact of the imputation of a missing value was assessed according to its position in the sequence. The values for sunrise and sunset were left out, due to the discontinuous nature of solar radiation, where forecasts in the immediate vicinity of sunrise and sunset are problematic.
The experiments were carried out by moving the mask from the position corresponding to 10 a.m. to the position corresponding to 5 p.m., with all positions within that interval evaluated. Masking was performed in a separate experiment for each field position. The R2 score in the set varied within the range of 0.83 to 0.95, as shown in Figure 3, with a mean of 0.89 and a variance of 0.13.
In Figure 3 it can be found that seen that the best predictions are corresponding to the mask at the start and end values of the sequence. If the analysis is transposed to the solar data, it is observed that the morning and afternoon values feature smaller differences when compared to the values of the central hours of the day. It is expected that these variations are more difficult to model, considering that the differences are also highlighted depending on the month of the year.

3.2. Scenario 2: Imputation of a Missing Value after Several Unknown Values at a Random Position

In Scenario 2, all values were missing from a specific position in the sequence. We assessed the quality of the model to impute one value without the rest of the sequence. As in Scenario 1, the experiments were made by moving the mask position corresponding to 10 a.m. to 5 p.m. In the sequence, the mask number is the position where the “[MASK]” token was set; from that position onwards, the values are replaced by the “[UNK]” token. As expected, the R2 score within the sequence increases as the number of unknown values decreases (as shown in Figure 4). The R2 score varied within the range of 0.08 to 0.93, with a mean of 0.59 and a variance of 0.25.

4. Conclusions and Future Work

In this study, the application of BERT as an imputation technique for missing values in solar radiation time series data was analyzed. The BERT model was trained from scratch with historical data of two Spanish regions, and was evaluated for two scenarios, a first scenario where a single missing value was imputed at a specific position in the sequence, and a second scenario where all values were missing from a specific position in the sequence. The metric evaluated was the R2 score, and the average performance was 0.89%, the best result being 0.95% for imputation on the final values of the sequence.
The results achieved show how DL models can be used to impute missing data in time series. The work can be considered as a first step in the introduction of this model in the field of renewable energies, and raises new questions on how the addition of spatial (such as latitude and longitude) and temporal data (such as day of the year and year) affects the quality of the imputation.
In future studies, the BERT model could be evaluated from a spatio-temporal perspective, to analyze whether the model can model the spatial location of the weather station and is able to improve the imputation operation with the introduction of these new features. The model could also retrained on the next sentence prediction (NSP) task, to predict the subsequent day of irradiance values from the previous day. In addition, the exploration of the automation of the variables pre-processing to the format expected by BERT, or the conversion of the output back to the time series format, is recommended.

Author Contributions

Conceptualization, L.B.C. and M.-Á.M.-C.; methodology, L.B.C. and M.-Á.M.-C.; software, L.B.C.; validation, L.B.C., M.-Á.M.-C. and C.-I.C.; investigation, L.B.C.; resources, M.-Á.M.-C. and C.-I.C.; data curation, L.B.C.; writing—original draft preparation, L.B.C.; writing—review and editing, L.B.C., M.-Á.M.-C. and C.-I.C.; visualization, L.B.C.; supervision, M.-Á.M.-C. and C.-I.C. All authors have read and agreed to the published version of the manuscript.

Funding

This research received no external funding.

Institutional Review Board Statement

Not applicable.

Informed Consent Statement

Not applicable.

Data Availability Statement

The CyL-GHI dataset in this study are openly available in Zenodo repository (https://doi.org/10.5281/zenodo.7404167) and the Galicia dataset was compiled from an online service (https://www.meteogalicia.gal/web/RSS/rssIndex.action?request_locale=es, accessed on 1 March 2019).

Conflicts of Interest

The authors declare no conflict of interest.

References

  1. Chatfield, C. The Analysis of Time Series, 6th ed.; Chapman and Hall/CRC: New York, NY, USA, 2003; ISBN 9780203491683. [Google Scholar]
  2. Fang, C.; Wang, C. Time Series Data Imputation: A Survey on Deep Learning Approaches. arXiv 2020, arXiv:2011.11347. [Google Scholar]
  3. Glasbey, C.A. Imputation of Missing Values in Spatio-Temporal Solar Radiation Data. Environmetrics 1995, 6, 363–371. [Google Scholar] [CrossRef]
  4. Layanun, V.; Suksamosorn, S.; Songsiri, J. Missing-Data Imputation for Solar Irradiance Forecasting in Thailand. In Proceedings of the 2017 56th Annual Conference of the Society of Instrument and Control Engineers of Japan (SICE), Kanazawa, Japan, 19–22 September 2017; pp. 1234–1239. [Google Scholar]
  5. Demirhan, H.; Renwick, Z. Missing Value Imputation for Short to Mid-Term Horizontal Solar Irradiance Data. Appl. Energy 2018, 225, 998–1012. [Google Scholar] [CrossRef]
  6. Zhang, W.; Luo, Y.; Zhang, Y.; Srinivasan, D. SolarGAN: Multivariate Solar Data Imputation Using Generative Adversarial Network. IEEE Trans. Sustain. Energy 2021, 12, 743–746. [Google Scholar] [CrossRef]
  7. de-Paz-Centeno, I.; García-Ordás, M.T.; García-Olalla, Ó.; Alaiz-Moretón, H. Imputation of Missing Measurements in PV Production Data within Constrained Environments. Expert Syst. Appl. 2023, 217, 119510. [Google Scholar] [CrossRef]
  8. Vaswani, A.; Shazeer, N.; Parmar, N.; Uszkoreit, J.; Jones, L.; Gomez, A.N.; Kaiser, Ł.; Polosukhin, I. Attention Is All You Need. Adv. Neural Inf. Process. Syst. 2017, 30, 5999–6009. [Google Scholar]
  9. Yldz, A.Y.; Koc, E.; Koc, A. Multivariate Time Series Imputation With Transformers. IEEE Signal Process. Lett. 2022, 29, 2517–2521. [Google Scholar] [CrossRef]
  10. Bansal, P.; Deshpande, P.; Sarawagi, S. Missing Value Imputation on Multidimensional Time Series. Proc. VLDB Endow. 2021, 14, 2533–2545. [Google Scholar] [CrossRef]
  11. Devlin, J.; Chang, M.-W.; Lee, K.; Toutanova, K. BERT: Pre-Training of Deep Bidirectional Transformers for Language Understanding. arXiv 2018, arXiv:1810.04805. [Google Scholar]
  12. Koroteev, M.V. BERT: A Review of Applications in Natural Language Processing and Understanding. arXiv 2021, arXiv:2103.11943. [Google Scholar]
  13. Dong, X.; Bao, J.; Zhang, T.; Chen, D.; Zhang, W.; Yuan, L.; Chen, D.; Wen, F.; Yu, N. Bootstrapped Masked Autoencoders for Vision BERT Pretraining. In Proceedings of the 17th European Conference on Computer Vision (ECCV), Tel Aviv, Israel, 23–27 October 2022; pp. 247–264. [Google Scholar]
  14. Wang, R.; Chen, D.; Wu, Z.; Chen, Y.; Dai, X.; Liu, M.; Jiang, Y.-G.; Zhou, L.; Yuan, L. BEVT: BERT Pretraining of Video Transformers. In Proceedings of the 2022 IEEE/CVF Conference on Computer Vision and Pattern Recognition (CVPR), New Orleans, LA, USA, 18–24 June 2022; pp. 14713–14723. [Google Scholar]
  15. Lee, H.; Lee, S.; Lee, I.; Nam, H. AMP-BERT: Prediction of Antimicrobial Peptide Function Based on a BERT Model. Protein Sci. 2023, 32, e4529. [Google Scholar] [CrossRef] [PubMed]
  16. Ghazikhani, H.; Butler, G. TooT-BERT-M: Discriminating Membrane Proteins from Non-Membrane Proteins Using a BERT Representation of Protein Primary Sequences. In Proceedings of the 2022 IEEE Conference on Computational Intelligence in Bioinformatics and Computational Biology (CIBCB), Ottawa, ON, Canada, 15 August 2022; pp. 1–8. [Google Scholar]
  17. Wen, N.; Liu, G.; Zhang, J.; Zhang, R.; Fu, Y.; Han, X. A Fingerprints Based Molecular Property Prediction Method Using the BERT Model. J. Cheminform. 2022, 14, 71. [Google Scholar] [CrossRef] [PubMed]
  18. Gao, Y.; Xiong, Y.; Wang, S.; Wang, H. GeoBERT: Pre-Training Geospatial Representation Learning on Point-of-Interest. Appl. Sci. 2022, 12, 12942. [Google Scholar] [CrossRef]
  19. Benavides Cesar, L.; Manso Callejo, M.Á.; Cira, C.-I.; Alcarria, R. CyL-GHI: Global Horizontal Irradiance Dataset Containing 18 Years of Refined Data at 30-Min Granularity from 37 Stations Located in Castile and León (Spain). Data 2023, 8, 65. [Google Scholar] [CrossRef]
  20. Wu, Y.; Schuster, M.; Chen, Z.; Le, Q.V.; Norouzi, M.; Macherey, W.; Krikun, M.; Cao, Y.; Gao, Q.; Macherey, K.; et al. Google’s Neural Machine Translation System: Bridging the Gap between Human and Machine Translation. arXiv 2016, arXiv:1609.08144. [Google Scholar]
Figure 1. Representation of the BERT input for sequences of irradiances value—BERT’s input embedding are the sum of token embedding, segmentation embedding and position embedding (sum of the column). Notes: (1) Token embedding is represented in yellow and represent the value in another dimension space. (2) Segmentation embedding indicate which sentence it belongs to A or B , while (3) the position embedding represents the position in the sequence. Abbreviations: C L S is used to identify the beginning of the sequence, E A is used to code the segment embedding, and E 1 , E 2 E n + 1 represent positions of the embedding.
Engproc 39 00026 g001
Figure 2. Spatial distribution of stations capturing the data used in the experiments located in the Spanish regions of (a) Castile and León (the CyL-GHI dataset), and (b) Galicia.
Engproc 39 00026 g002
Figure 3. Analysis of the coefficient of determination for the position of the MASK token within the sequence.
Engproc 39 00026 g003
Figure 4. Analysis of the coefficient of determination for the position of the MASK token within the sequence with unknown values.
Engproc 39 00026 g004
Disclaimer/Publisher’s Note: The statements, opinions and data contained in all publications are solely those of the individual author(s) and contributor(s) and not of MDPI and/or the editor(s). MDPI and/or the editor(s) disclaim responsibility for any injury to people or property resulting from any ideas, methods, instructions or products referred to in the content.

