1. Introduction
In recent years, the persistent rise in energy demand and the limited availability of fossil fuels have prompted a collaborative endeavor towards researching and developing technologies that harness renewable energy sources (RES). Some of these renewable energy sources, such as wind or solar photovoltaic (PV) power, have achieved significant technological advancements and seamless integration into the socioeconomic framework. As a result, their energy production constitutes a substantial portion of the electricity market in several countries.
Among the vast array of exploitable renewable energy sources available today, photovoltaic (PV) power stands out for its remarkable adaptability and scalability across diverse environments and contexts. The utilization of PV panels for electricity generation spans from residential-scale generation to the massive production of PV plants. Irrespective of the scale of implementation, PV-based power generation systems are intricate and involve a multitude of variables, ranging from meteorological parameters, such as ambient temperature and wind speed, to energy parameters, such as the voltage of the PV panels or the current produced. Therefore, it is imperative to possess a monitoring system that facilitates the centralized visualization of the evolution of the key parameters of the installation. Such a monitoring platform enables the efficient execution of supervision, analysis, and optimization tasks pertaining to the operation of the installation in a user-friendly, intuitive, and graphical manner.
This research showcases the development and implementation of a monitoring system based on Internet of Things (IoT) applications and contextualized for the operation of a middle-scale grid located in the university campus of Badajoz, Extremadura. This middle-grid is powered by a PV solar tracker whose energy contribution complements the energy supply obtained from a transformation center that fulfills the energy demand of the activities conducted at the School of Industrial Engineering. The monitoring system developed performs the acquisition, management, storage, and monitoring of data from the installation.
The subsequent sections of this document are structured as follows.
Section 2 presents the set of components, hardware, and software involved in the installation and development of the monitoring system.
Section 3 describes the principle of operation of the developed monitoring system and its operation under real conditions. Finally, the main conclusions of the work are detailed.
2. Methods and Materials
This section provides an overview of the medium-scale grid and elucidates all of the hardware and software components involved in its operation, along with the functioning of the monitoring system.
2.1. Middle-Scale Grid
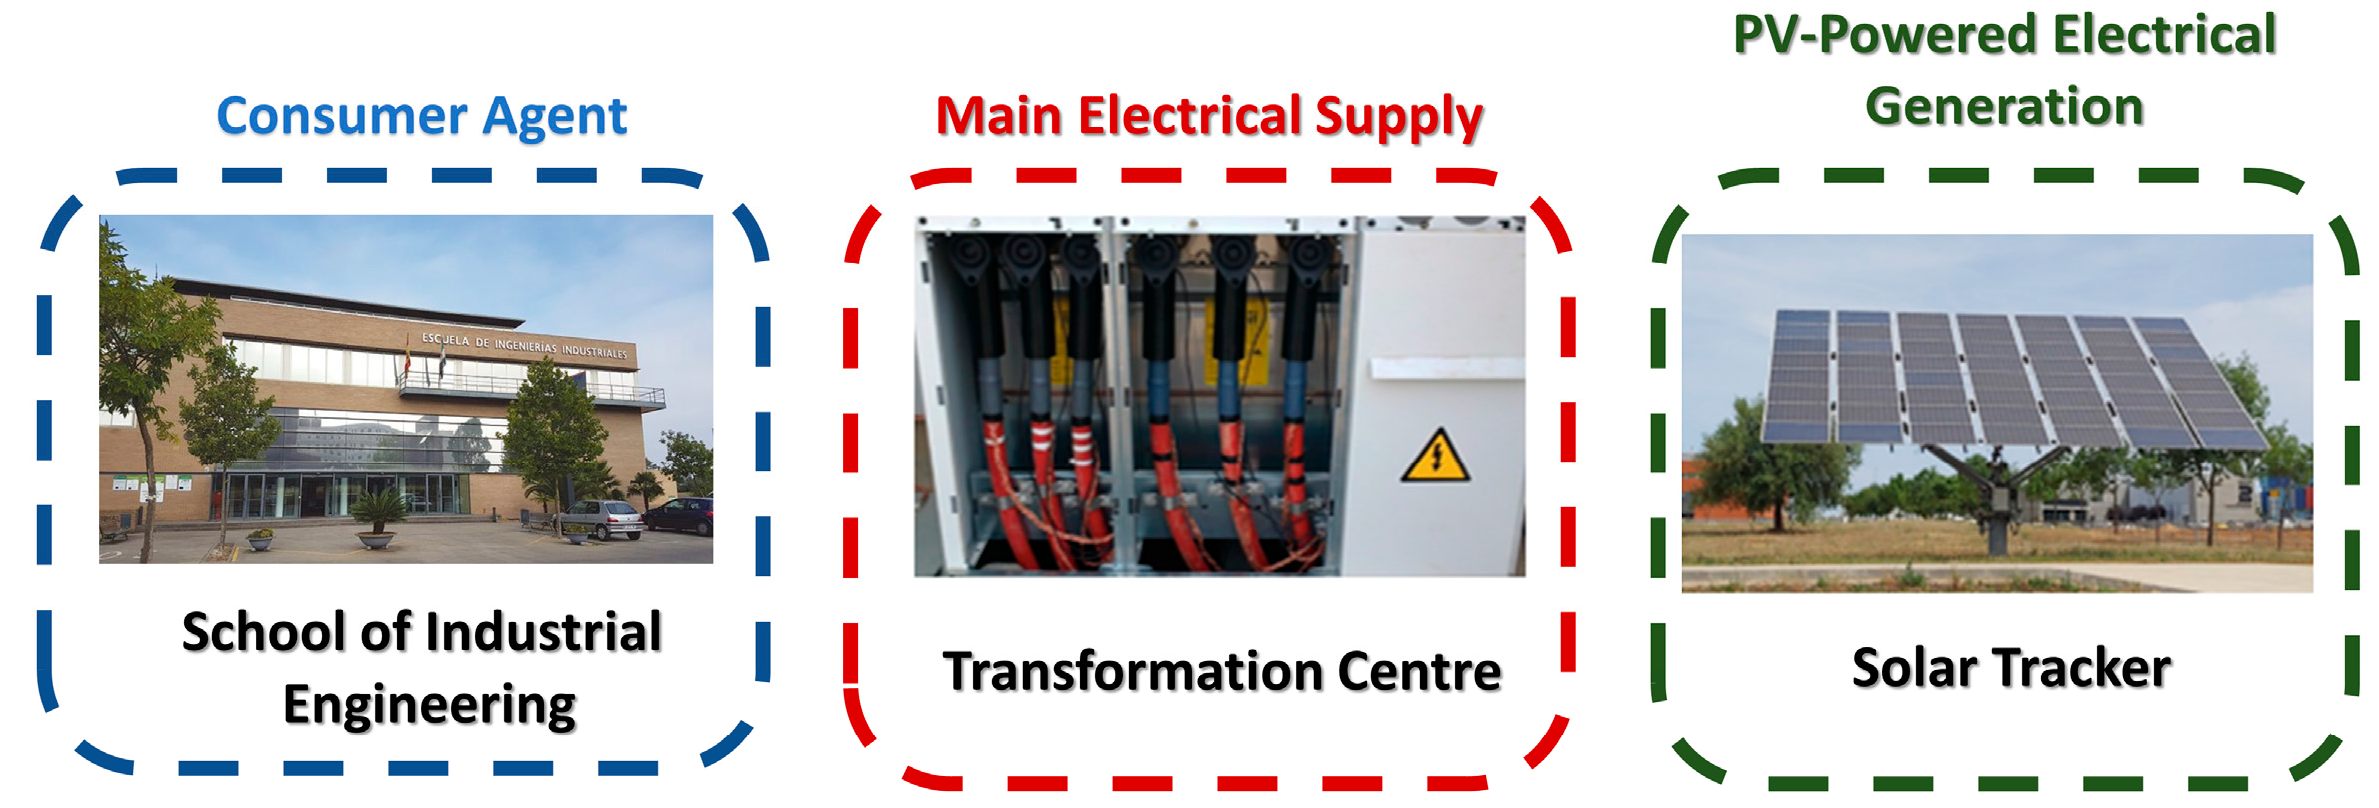
The middle-scale grid is integrated with three main facilities. Firstly, the School of Industrial Engineering serves as the consumer agent of the grid, with its wind tunnel annex building as the primary electricity consumer. Secondly, a nearby transformation center functions as the primary power supply for the grid. Lastly, the solar tracker, powered by photovoltaic energy, generates electricity utilized by the consumer agent.
Figure 1 depicts the three primary installations of the grid.
2.2. Sensing of the Installation
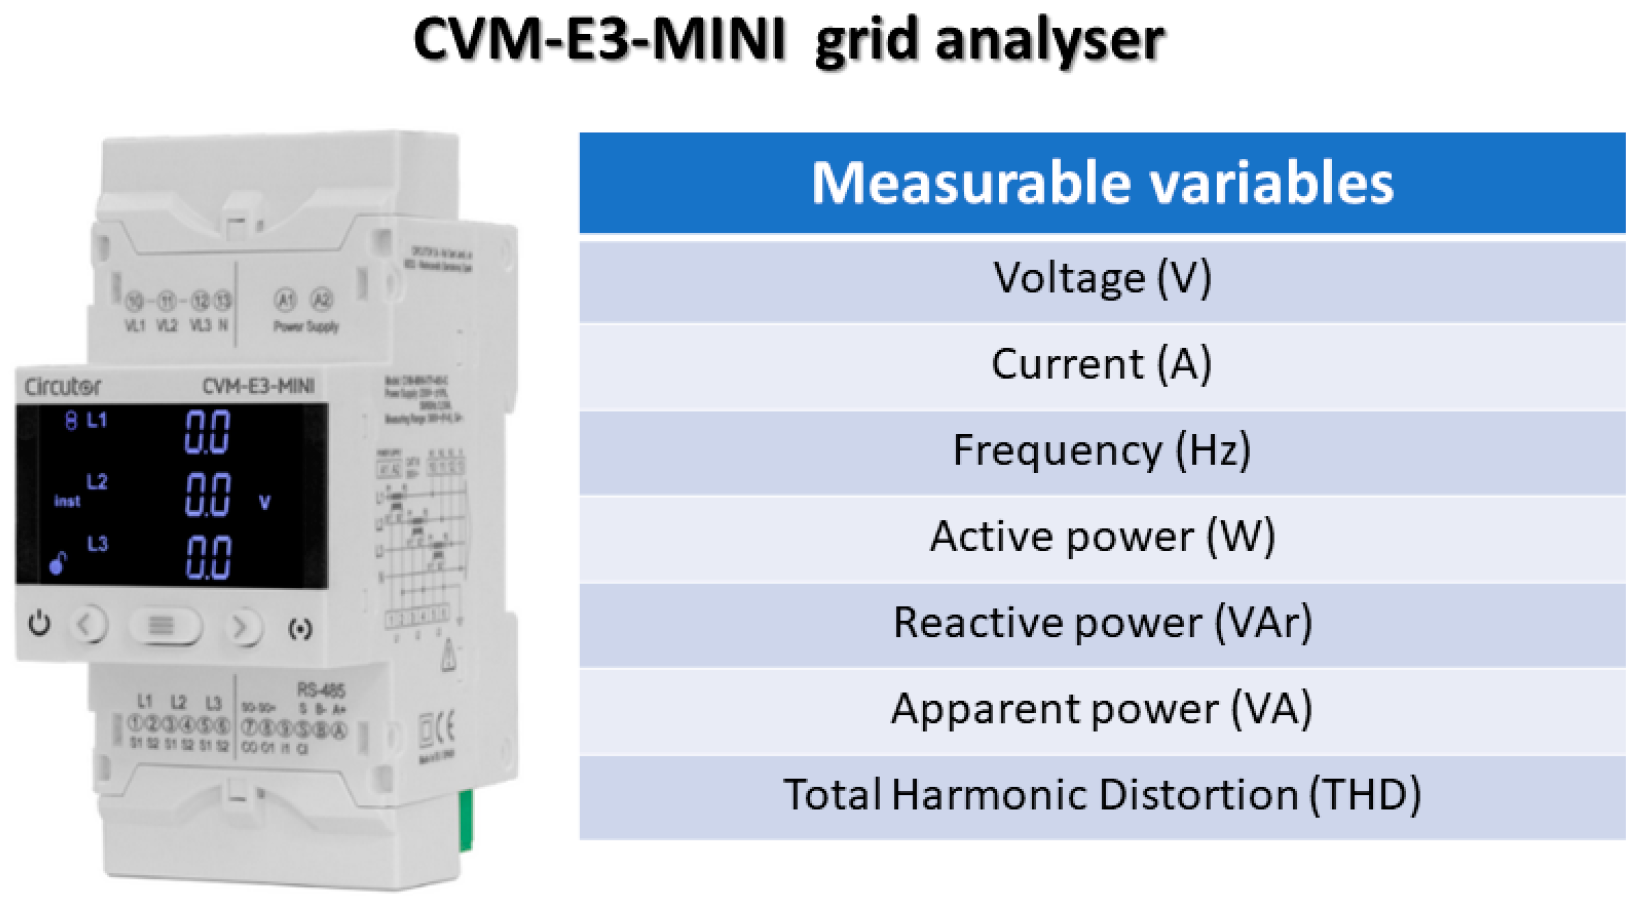
To establish the monitoring system, it is imperative to acquire the pertinent data/information that requires representation. To this end, two three-phase CVM-E3-MINI grid analyzers(Circutor, Barcelona, Spain) [
1] were employed in the sensorization phase, installed in the solar tracker and transformation center to obtain data regarding the electrical characteristics of these installations. Grid analyzers are measuring instruments that enable the analysis of numerous properties of the electrical grid.
Figure 2 illustrates the physical aspects of this sensor and provides a list of variables measured in this work.
The data related to the consumer agent are determined via an energy balance between the transformation center and the solar tracker.
2.3. Data Acquisition
Regarding the acquisition of data from the analyzers, this task was performed through Node-RED, an IoT middleware notable for its extensive catalog of functions and versatility in communication with a wide variety of devices, whether commercial or open-source in nature [
2]. As an additional advantage, it presents an intuitive and user-friendly environment through its visual block-based programming. Within this variety of applications, Node-RED is employed as part of energy monitoring and supervision systems [
3].
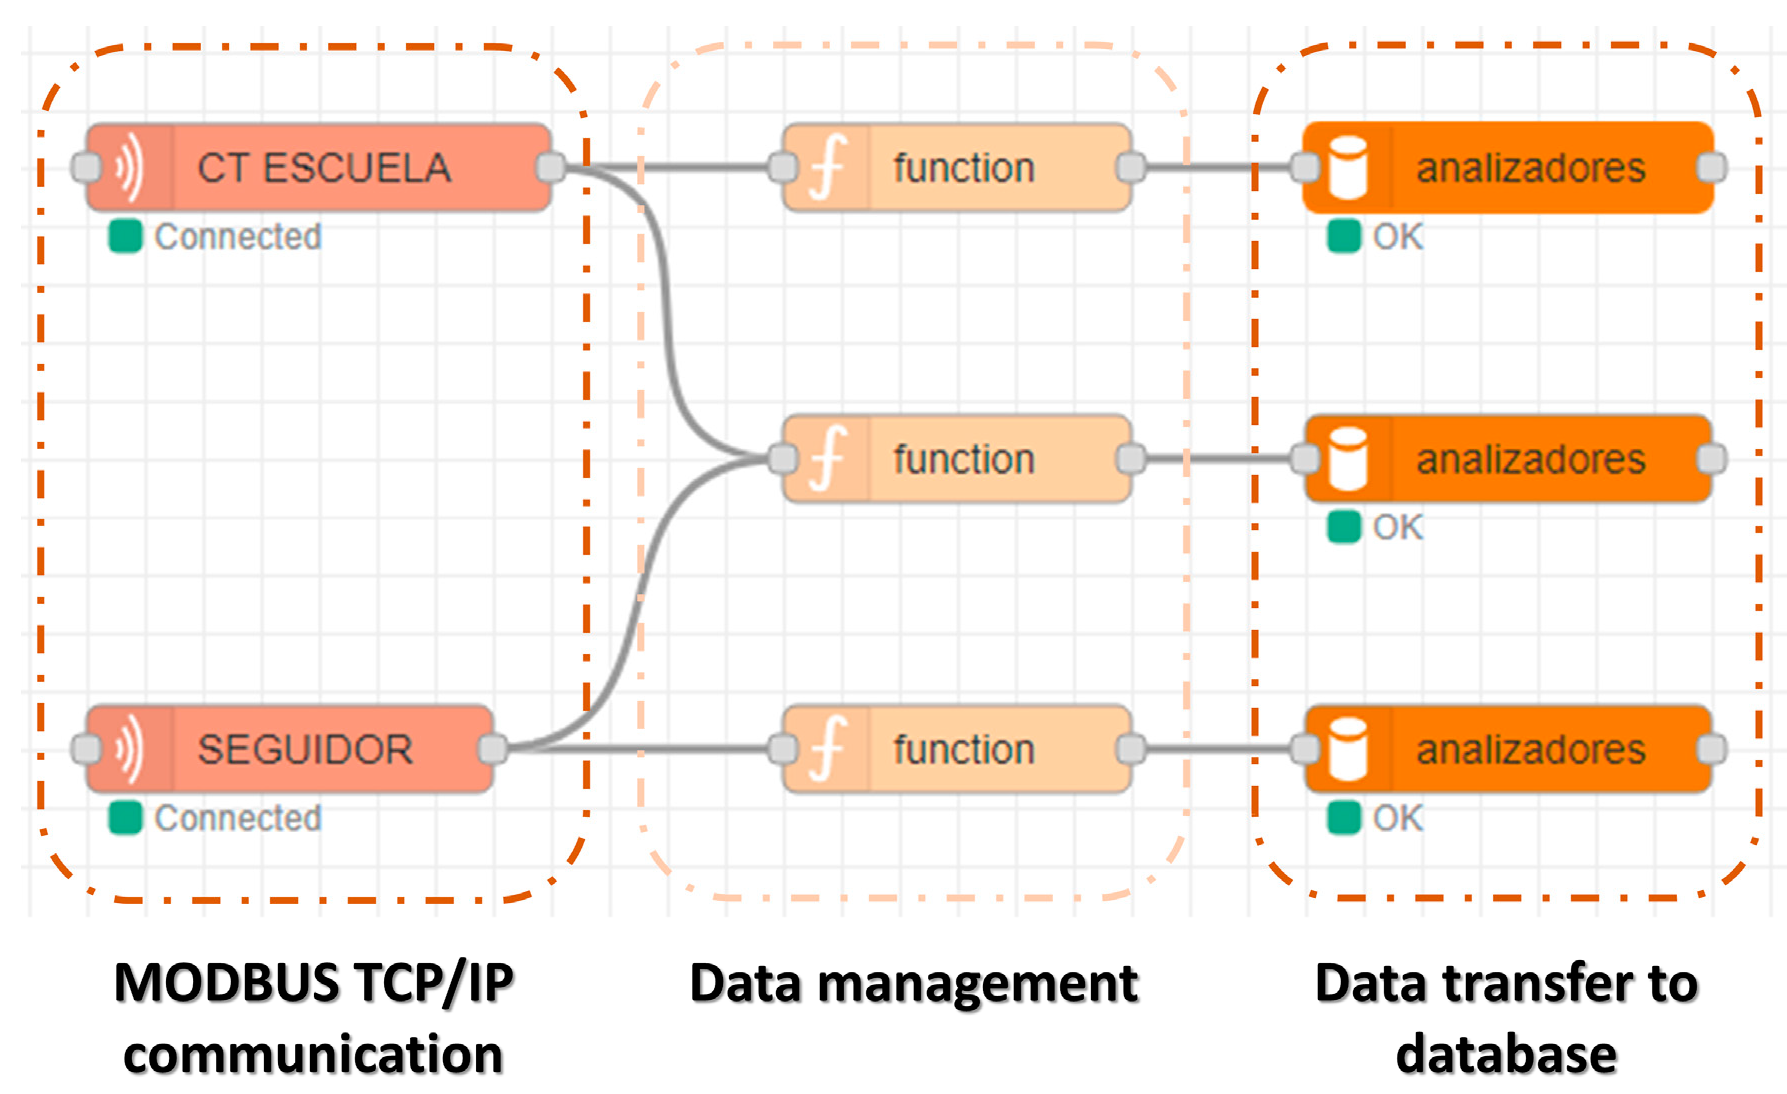
In particular, for the developed system, Node-RED cyclically executes a program composed of three differentiated functions. Firstly, communication is established with the “CT ESCUELA” and “SEGUIDOR” analyzers, which refer to the sensors installed for the transformer center and the solar tracker, respectively. For this purpose, a block is executed that performs communication with each analyzer through the MODBUS TCP/IP protocol. This communication protocol is widely implemented in applications framed within the industrial and energy sectors [
4,
5,
6]. Next, the data obtained from the registers are processed using a “function” block, which contains a script that combines the necessary registers and modifies their format to obtain the values of the electrical parameters. Finally, these parameters are sent to a database called “analizadores” through a block that performs a write request using Structured Query Language (SQL).
Figure 3 depicts the Node-RED program execution along with the interconnection among the constituent blocks and the respective actions performed by each of them. It is important to highlight that the monitoring system developed is intended to be operated within the facilities of the School of Industrial Engineering of Badajoz. Therefore, both the names of the variables and the language employed in the different software environments are in Spanish, as can be appreciated in the following figures.
2.4. Data Storage
One of the functions to be performed by the monitoring system developed is the visualization of the historical data of the electrical parameters. Thus, combined with real-time monitoring, a new dimension of traceability of the key variables of the middle-scale grid is acquired. For this purpose, a data storage system has been implemented through MariaDB, an open-source relational databases server designed by the original developers of MySQL [
7]. In addition, phpMyAdmin, a web-based software tool for MySQL administration, has been employed [
8].
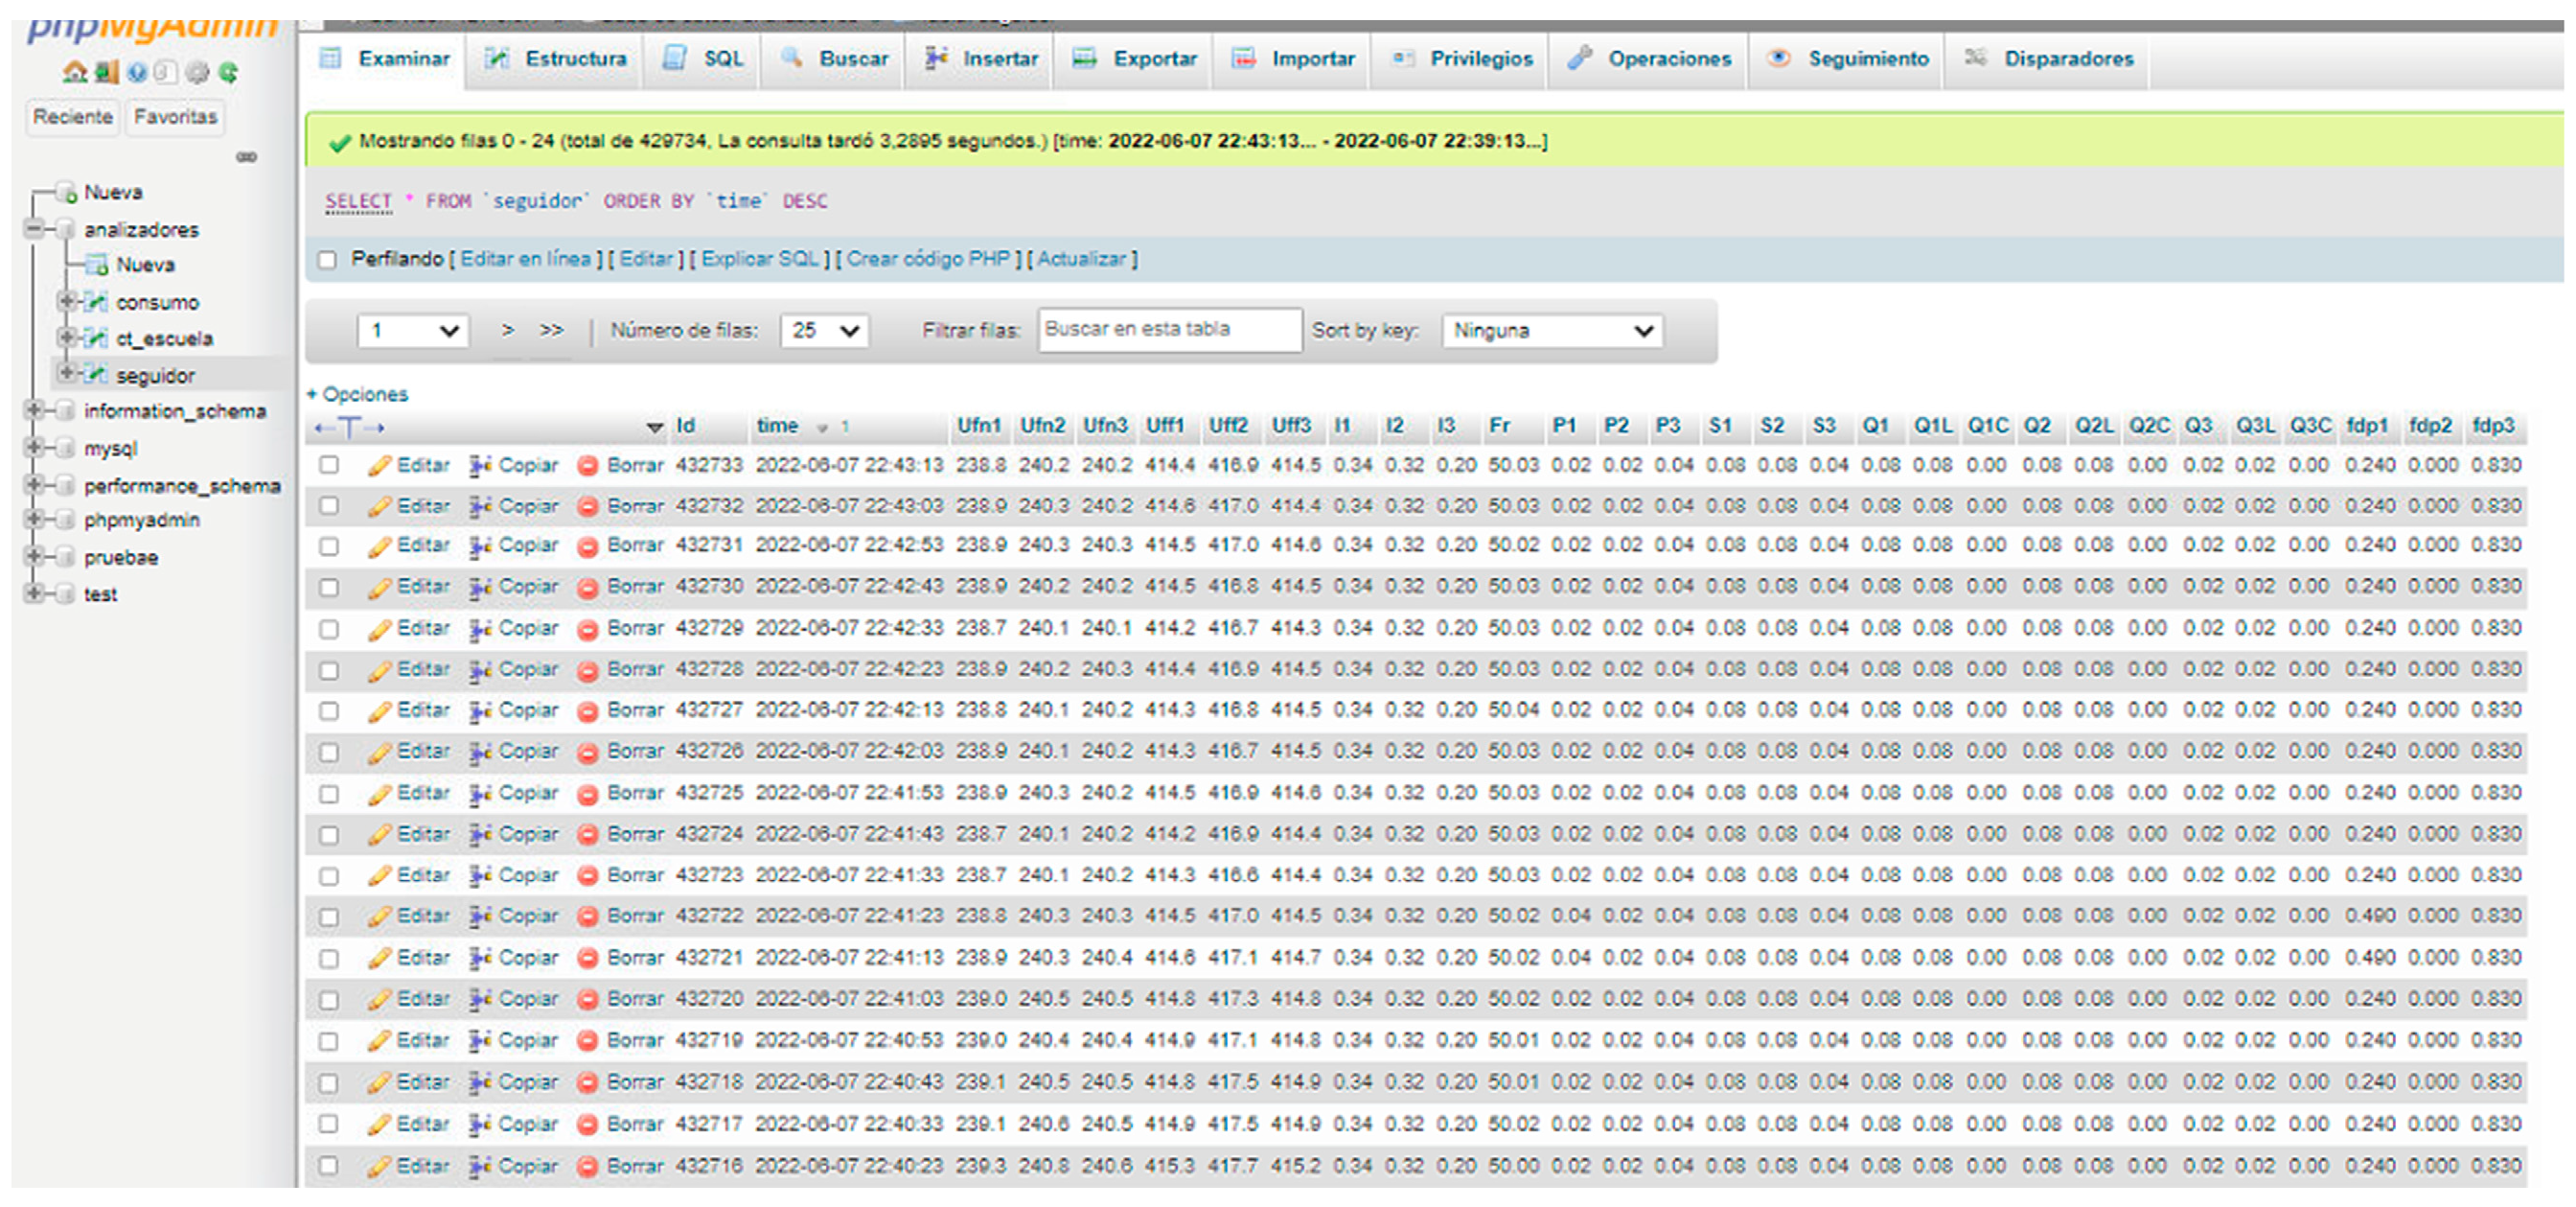
Regarding its operation, the data storage system was configured through phpMyAdmin, whereby a database called “analizadores” was created. This database is composed of three tables: “ct_escuela”, “seguidor”, and “consumo”. In each table, the information is gathered from the Node-RED block with the same name.
Figure 4 depicts the phpMyAdmin workspace, where the content of the “seguidor” table is shown.
2.5. Data Visualization and Monitoring
To perform the task of data monitoring and visualization, Grafana was employed, an IoT software focused on monitoring information through requests to different databases [
9]. Its principle of operation is based on user-configurable panels or dashboards through an extensive catalog of elements and libraries. This versatility facilitates the implementation of monitoring systems for a wide variety of applications [
10,
11,
12].
Regarding its graphical operation, each dashboard presents a configurable workspace where various synoptics, such as graphs, histograms, gauges, or numerical indicators, can be inserted. Each of these graphical elements is individually configured by means of a configuration tab. In this tab, both visual aspects, such as color, visibility, fill, and shape, as well as the variable or parameters to be displayed through the graphical element, are configured.
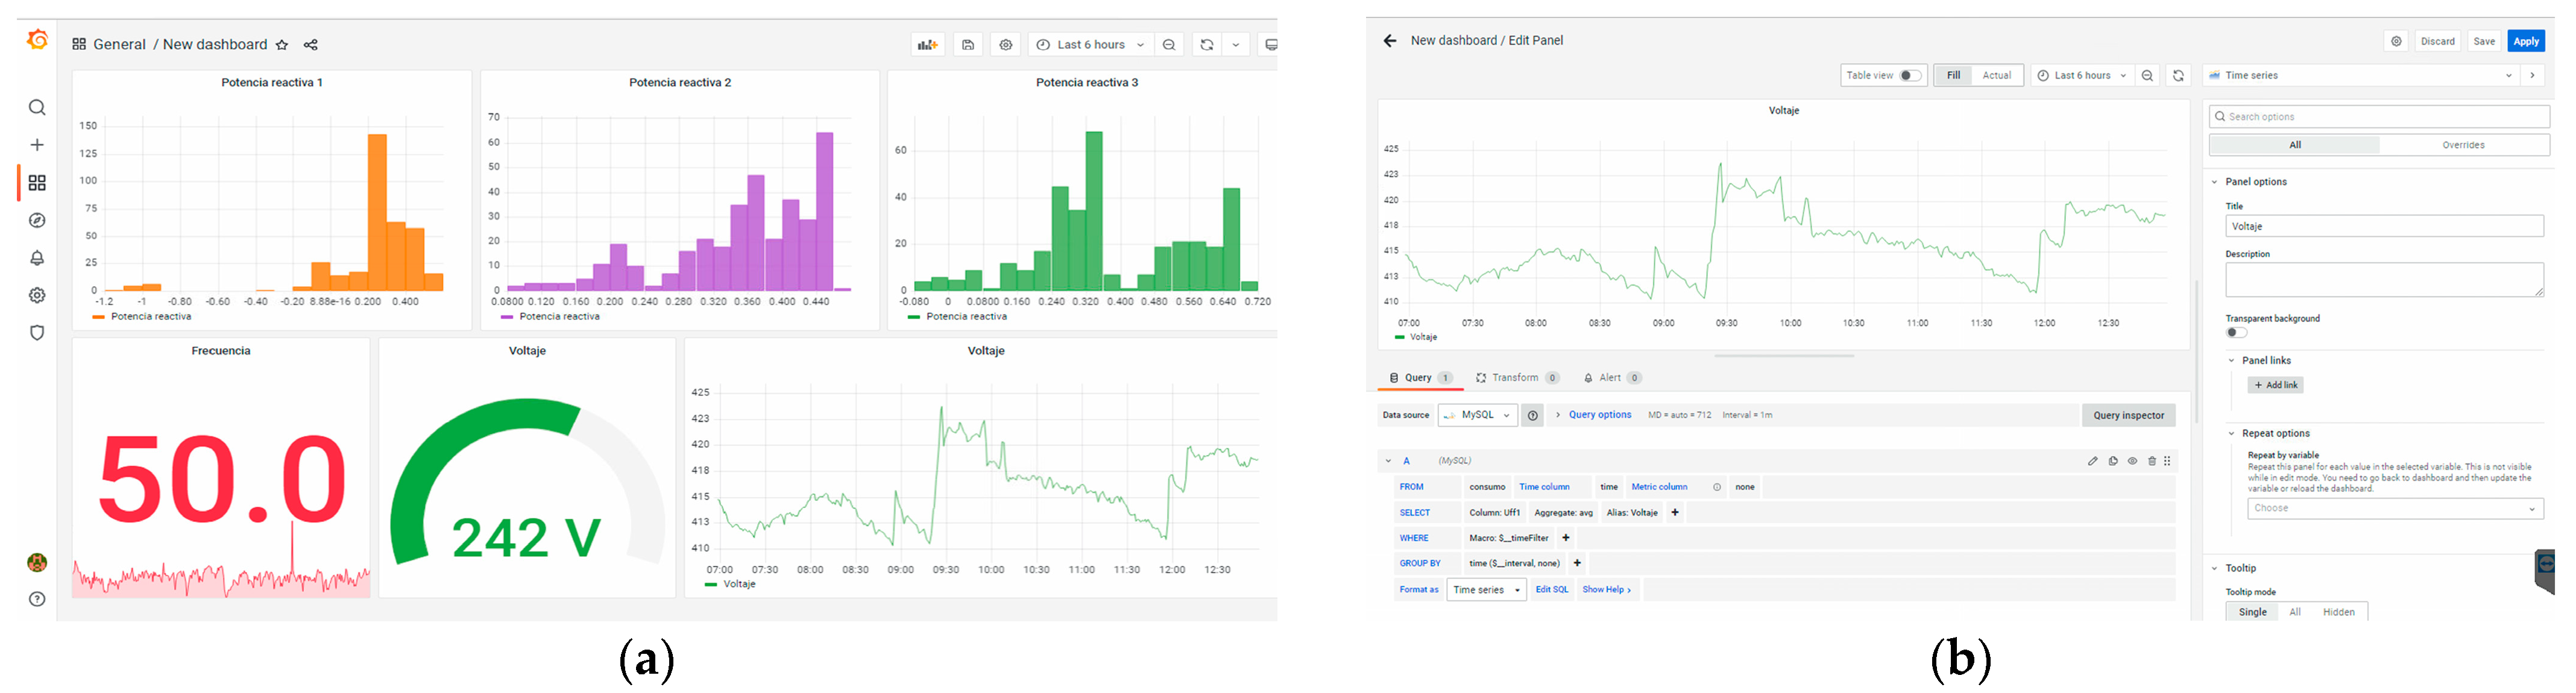
Figure 5 depicts the graphical appearance and operation of Grafana.
Figure 5a shows the appearance of a dashboard and the possible elements and organization that compose it.
Figure 5b shows the configuration tab of a graph, where the configuration tools and the associated database variable, in this case voltage, are observed.
3. Results and Discussion
After the implementation of the components and programs described in
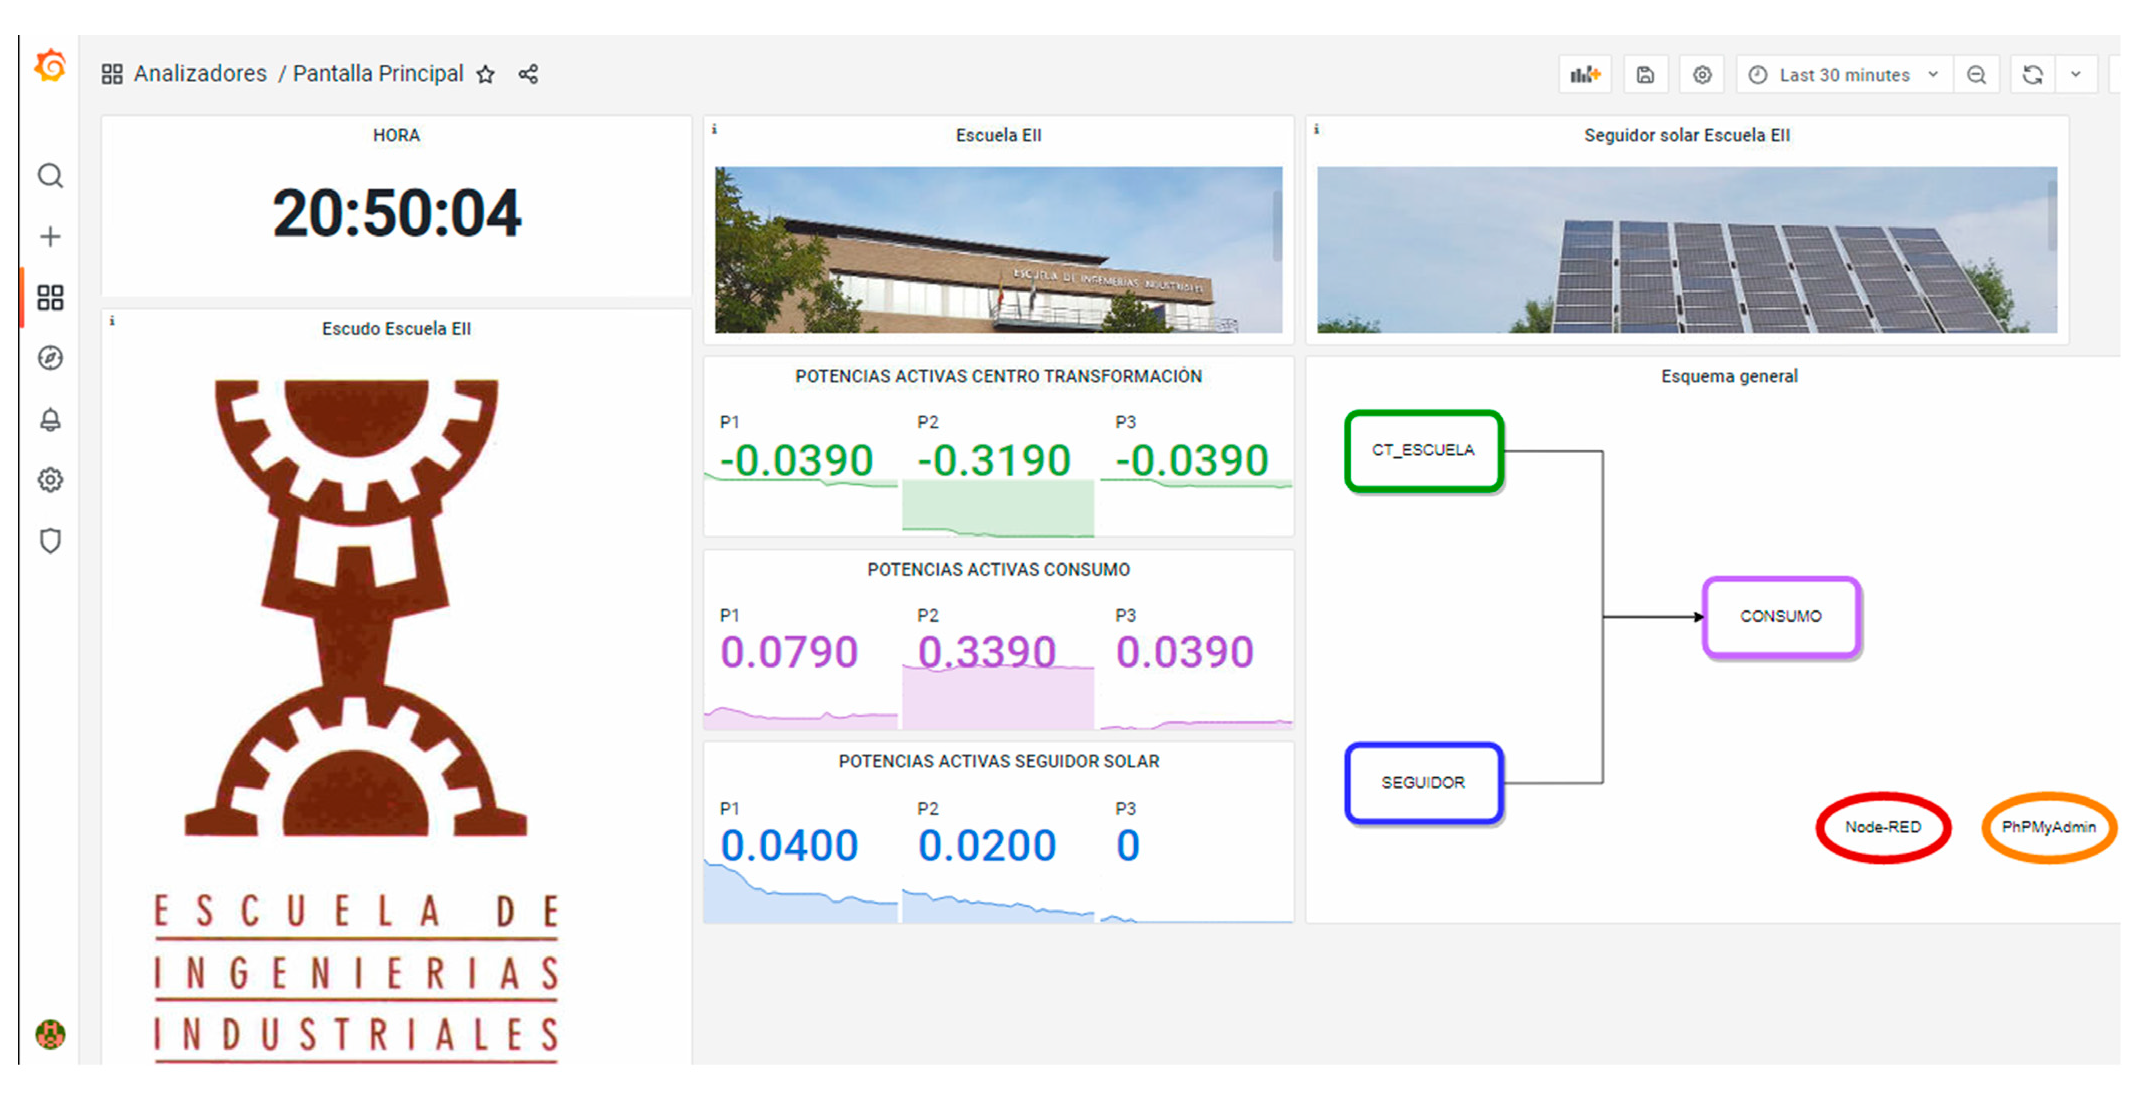
Section 2, the monitoring system is presented in real operation by displaying data in Grafana. The operation of this system is based on dashboards navigations, such as “ct_escuela”,” seguidor”, and “consume”, by means of a main dashboard. In this main panel, the real-time values of the active powers of each physical system of the middle-grid are displayed. Furthermore, it is accompanied by an interactive flowchart that allows navigation between the different dashboards of the monitoring system, as well as access to the Node-RED program and the phpMyAdmin database manager.
Figure 6 depicts the appearance of the main dashboard of the monitoring system.
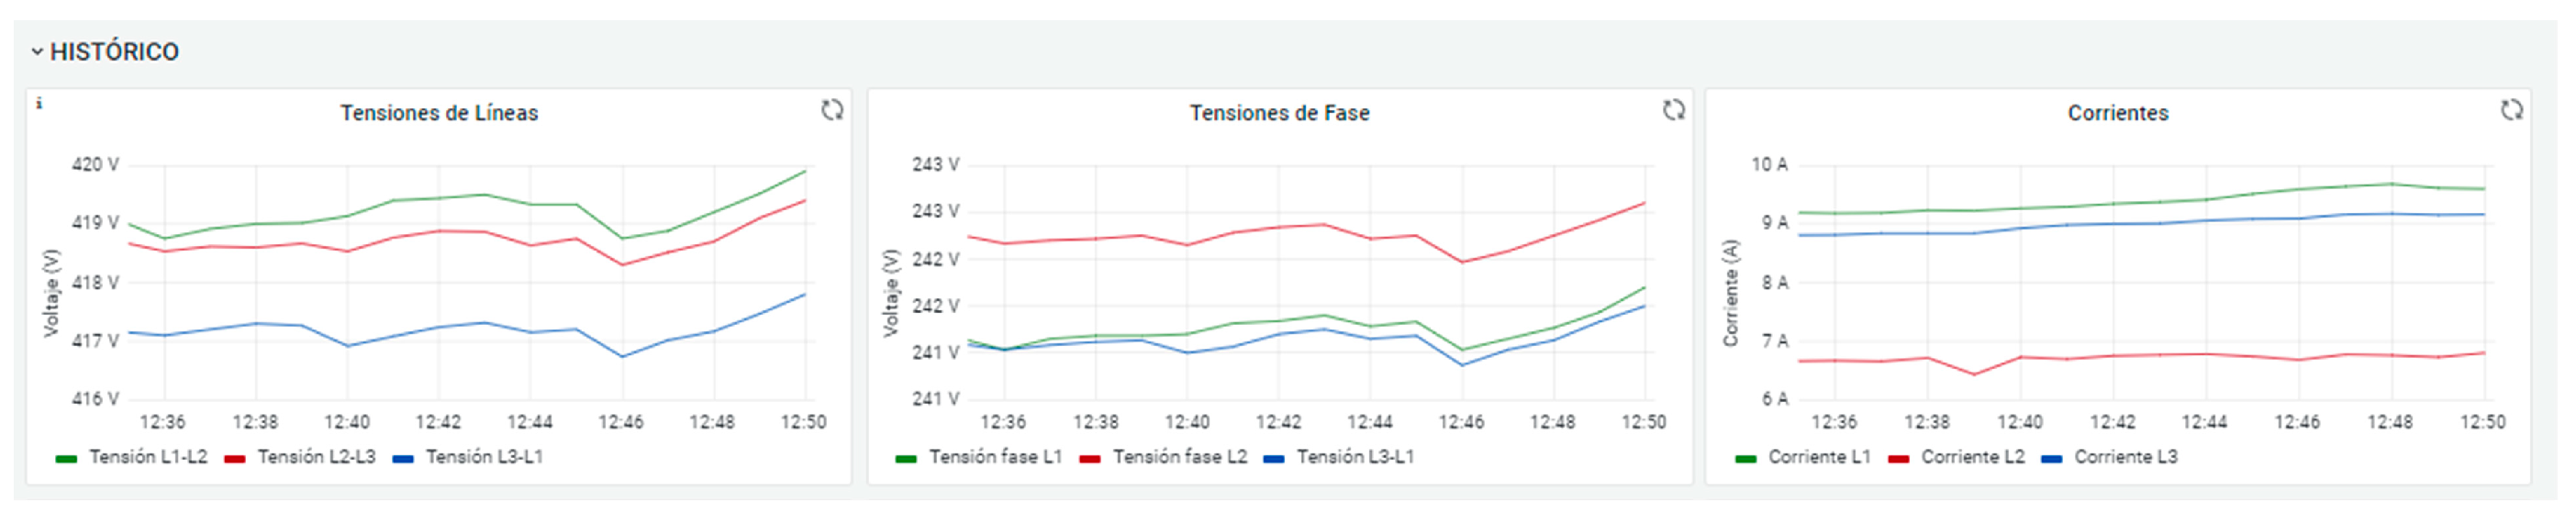
The structure of the remaining dashboards is identical, differing only in the values represented. First, a historical record of the line and phase voltages of the system is displayed, as well as the line currents (
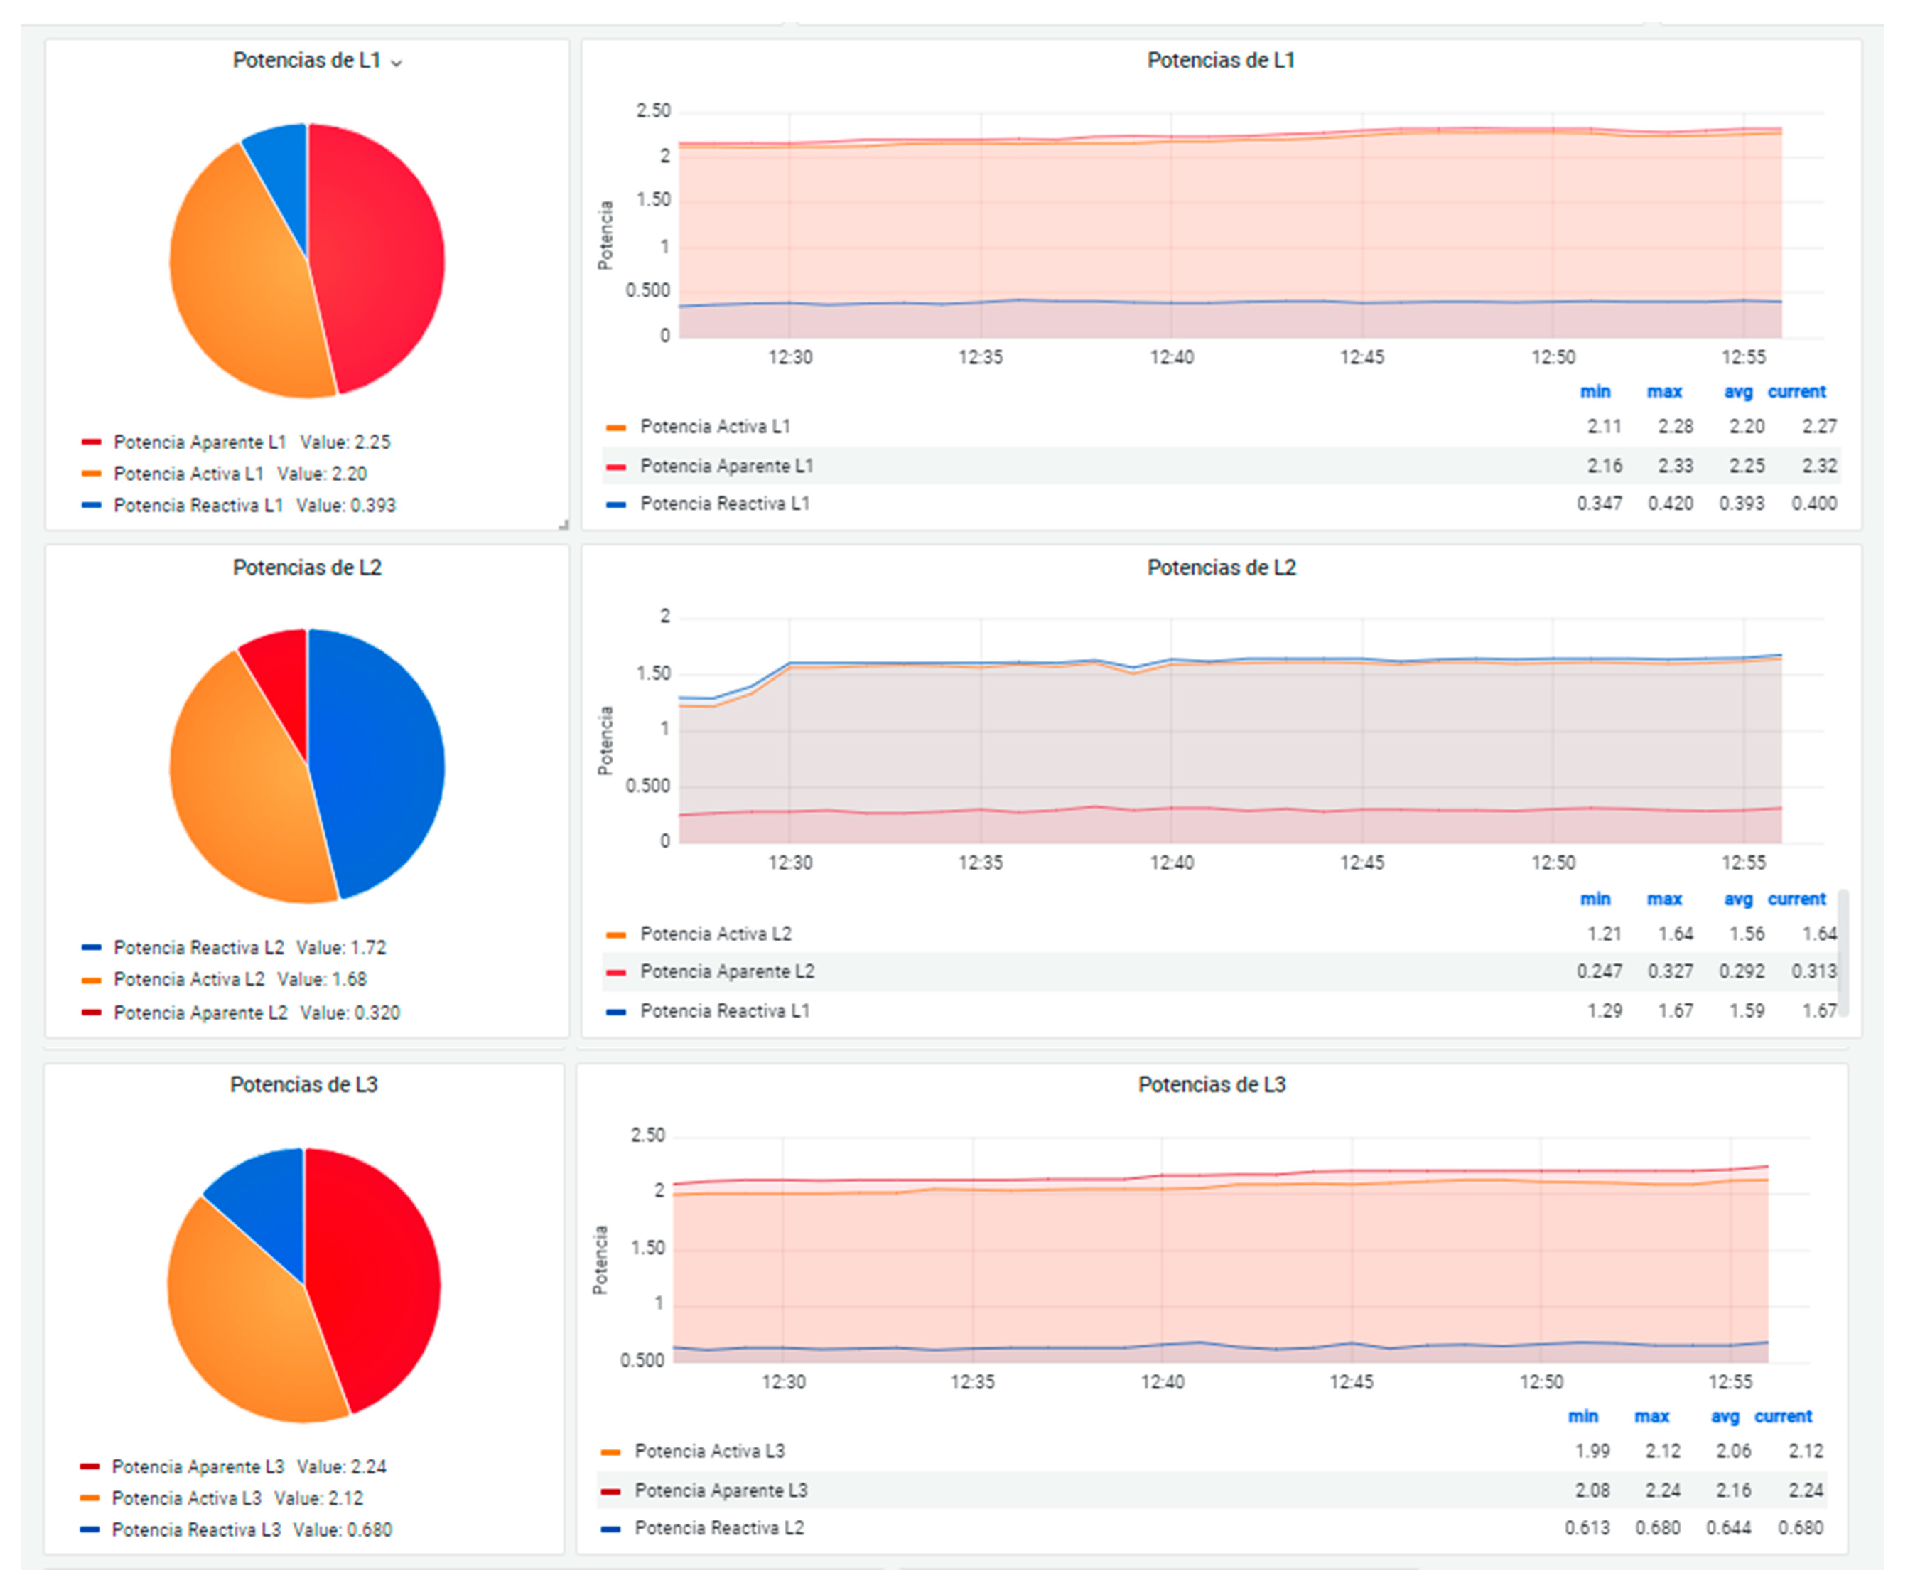
Figure 7). Next, the active, reactive, and apparent powers per line are presented through a pie chart for instantaneous values and a graph for the historical data (
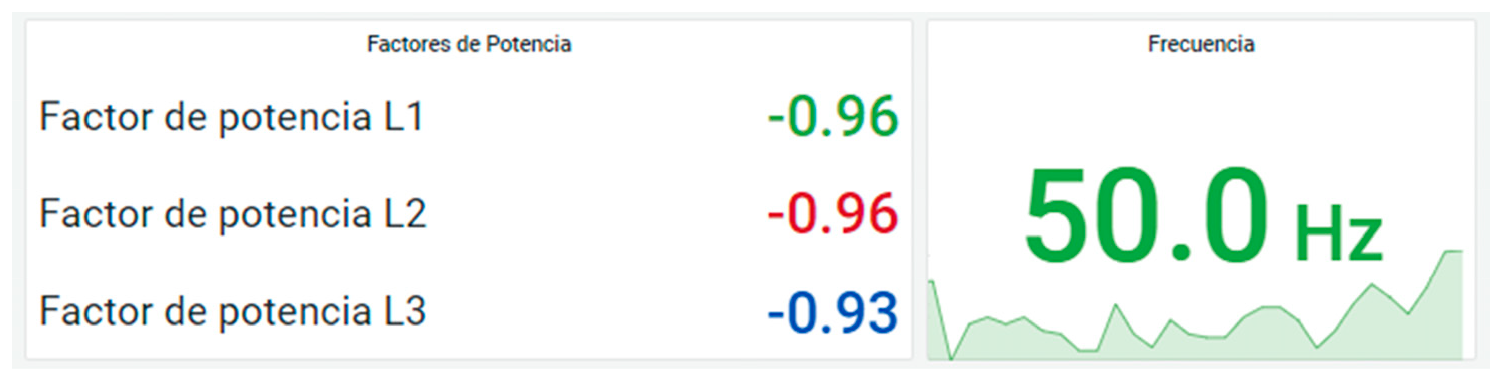
Figure 8). Finally, the power factor per line and the frequency of the grid are shown using numerical indicators (
Figure 9).
4. Conclusions
This paper has presented a monitoring solution based on IoT application for a middle-grid powered by a solar tracker. To this end, all aspects related to its operation were addressed and described, from sensorization and data acquisition to data storage and monitoring. For this purpose, IoT and open-source philosophies were integrated through applications and platforms such as Node-RED and Grafana, providing the system with versatility in terms of functionalities. Regarding its operation, the system is oriented to be user-friendly and intuitive, enhancing the global comprehension of the key parameters of the middle-grid by means of graphical elements and environments.
Further works will address the implementations of new features that will provide the monitoring system with useful functionalities for the study of the electrical parameters of the middle-grid, while maintaining a user-friendly handling and appearance. Another future guideline consists of developing a digital replica of the solar tracker including the visualization of the values obtained from the model in the dashboard created for the tracker in order to validate the model and obtain comparative results.
Author Contributions
Conceptualization, F.J.F. and A.J.C.; Methodology, I.G.; Software, F.J.F. and D.C.; Validation, A.J.C. and M.C.; Investigation, F.J.F., I.G. and A.J.C.; Data curation, F.J.F. and D.C.; Writing—original draft preparation, F.J.F. and I.G.; Writing—review and editing, I.G., M.C. and A.J.C.; Supervision, I.G. and A.J.C.; Project administration, A.J.C.; Funding acquisition, A.J.C. All authors have read and agreed to the published version of the manuscript.
Funding
This project was cofinanced by the sponsorship chair of industrial group CL “Transición Tecnológica para una economía sostenible y competitiva” (2021/00038/001).
Institutional Review Board Statement
Not applicable.
Informed Consent Statement
Not applicable.
Data Availability Statement
Data sharing not applicable.
Conflicts of Interest
The authors declare no conflict of interest.
References
- CVM-E3-MINI Datasheet. Available online: https://circutor.com/en/products/fixed-power-analyzers/fixed-power-analyzer/power-analyzer-three-phase-din-rail/product/M56480./ (accessed on 14 March 2023).
- Node-RED. Available online: https://nodered.org/ (accessed on 14 March 2023).
- Omidi, S.A.; Baig, M.J.A.; Iqbal, M.T. Design and Implementation of Node-Red Based Open-Source SCADA Architecture for a Hybrid Power System. Energies 2023, 16, 2092. [Google Scholar] [CrossRef]
- González, I.; Calderón, A.J.; Portalo, J.M. Innovative multi-layered architecture for heterogeneous automation and monitoring systems: Application case of a photovoltaic smart microgrid. Sustainability 2021, 13, 2234. [Google Scholar] [CrossRef]
- Cagnano, A.; De Tuglie, E.; Mancarella, P. Microgrids: Overview and guidelines for practical implementations and operation. Appl. Energy 2020, 258, 114039. [Google Scholar] [CrossRef]
- MODBUS Organization. Available online: https://modbus.org (accessed on 14 March 2023).
- MariaDB Foundation. Available online: https://mariadb.org (accessed on 14 March 2023).
- phpMyAdmin MySQL Administrator. Available online: https://www.phpmyadmin.net (accessed on 14 March 2023).
- Grafana Labs. Available online: https://grafana.com (accessed on 14 March 2023).
- González, I.; Calderón, A.J.; Folgado, F.J. IoT real time system for monitoring lithium-ion battery long-term operation in microgrids. J. Energy Storage 2022, 51, 104596. [Google Scholar] [CrossRef]
- Savaşcı Şen, S.; Cicioğlu, M.; Çalhan, A. IoT-based GPS assisted surveillance system with inter-WBAN geographic routing for pandemic situations. J. Biomed. Inform. 2021, 116, 103731. [Google Scholar] [CrossRef] [PubMed]
- Cicioğlu, M.; Çalhan, A. Smart agriculture with internet of things in cornfields. Comput. Electr. Eng. 2021, 90, 106982. [Google Scholar] [CrossRef]
| Disclaimer/Publisher’s Note: The statements, opinions and data contained in all publications are solely those of the individual author(s) and contributor(s) and not of MDPI and/or the editor(s). MDPI and/or the editor(s) disclaim responsibility for any injury to people or property resulting from any ideas, methods, instructions or products referred to in the content. |
© 2023 by the authors. Licensee MDPI, Basel, Switzerland. This article is an open access article distributed under the terms and conditions of the Creative Commons Attribution (CC BY) license (https://creativecommons.org/licenses/by/4.0/).


 ,
, 


