Proceeding Paper

APF Applied on PV Conversion Chain Network Using FLC †

LREEI, M’hamed Bougara of Boumerdes University, Boumerdes 35000, Algeria
*
Author to whom correspondence should be addressed.
Presented at the 2nd International Conference on Computational Engineering and Intelligent Systems, Online, 18–20 November 2022.
Eng. Proc. 2023, 29(1), 17; https://doi.org/10.3390/engproc2023029017
Published: 19 April 2023

Abstract

:
This paper focuses on regulation of the parallel active power filter (APF) Dc Voltage bus by judicious choice of rule bases and intervals for each selected fuzzy variable of suitable fuzzy logic controller. In addition, an algorithm describes the main steps for designing an FLC that has any number of rules with direct application to the APF capacitor voltage regulation. Where their simulation, by MATLAB, applied to PV conversion chain network will be represented in the booths cases, constant and variable non-linear loads after modeling, to show the effectiveness of this kind of regulators on electrical power quality and improve the reliability of the APF on PV system. The delivered voltage of PV plant has been regulated and controlled with MPPT using P&O technique and FLC regulator after modeling of each part of the conversion chain. PV plant supplies a nonlinear load from the rectifier installed on the output of the conversion chain via a controlled power inverter. A 3 × 3 rules fuzzy regulator is implanted in the control part of the APF to examine the influence of the FLC on the produced electrical power quality. Simulation results are represented and analyzed.

1. Introduction

PV plant conversion chain description and the MPPT technique based on P&O under irradiation and temperature variation influence the generated amplitude of output voltage [1,2,3] and the detailed modeling behavioral Matlab simulation. For obtaining good performance and efficiency energy, it is proposed to host a diverse suitable controls strategy to replace the power electronic interface to achieve the needed performance results for the system [3].

2. Description and Modeling of PV Conversion Chain

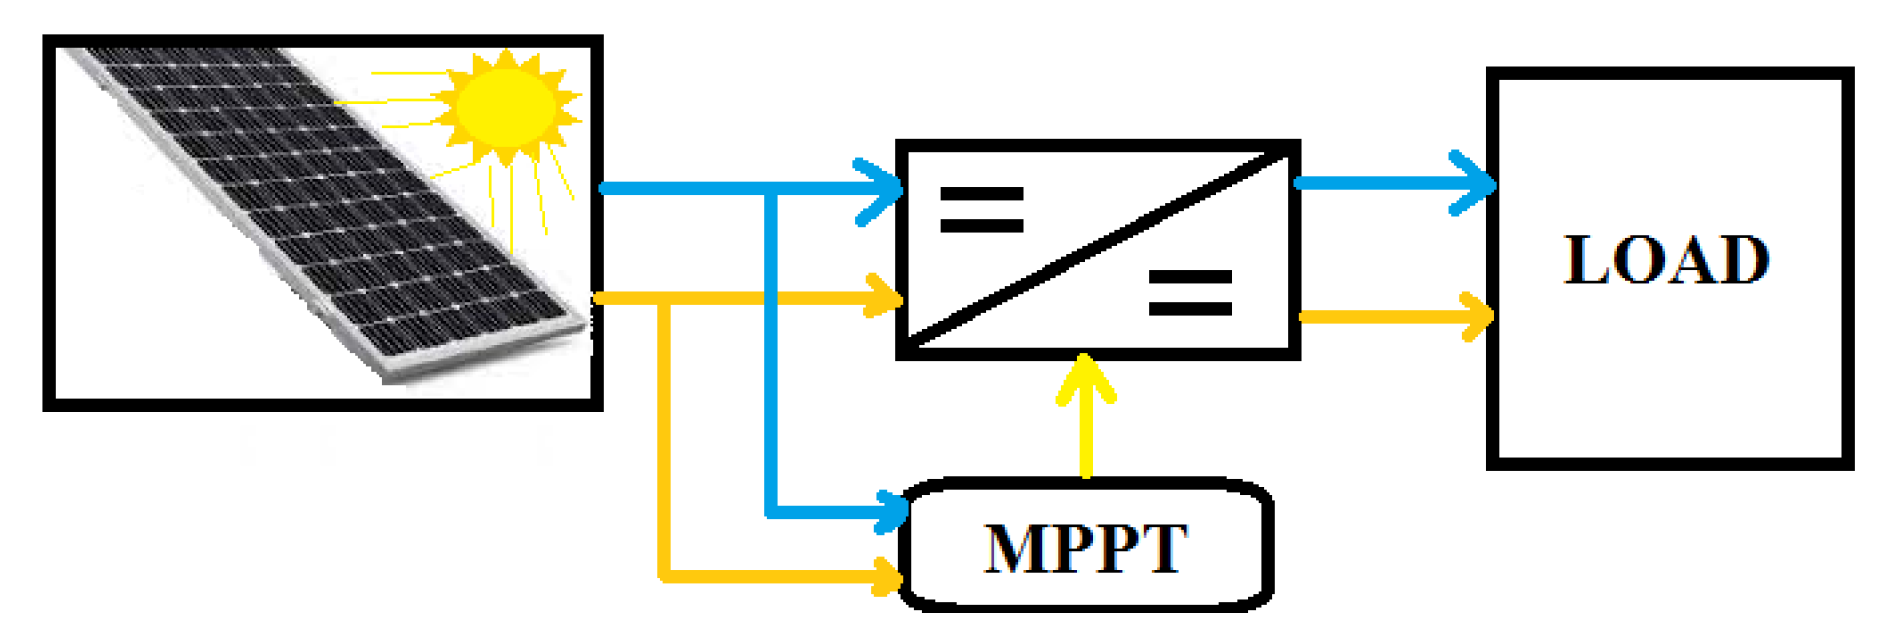
2.1. PV System Description

The global scheme present in Figure 1 shows the main parts dedicated to converting sun power to electrical energy. The use of PV allows the conversion to be achieved, and the system will be modeled.

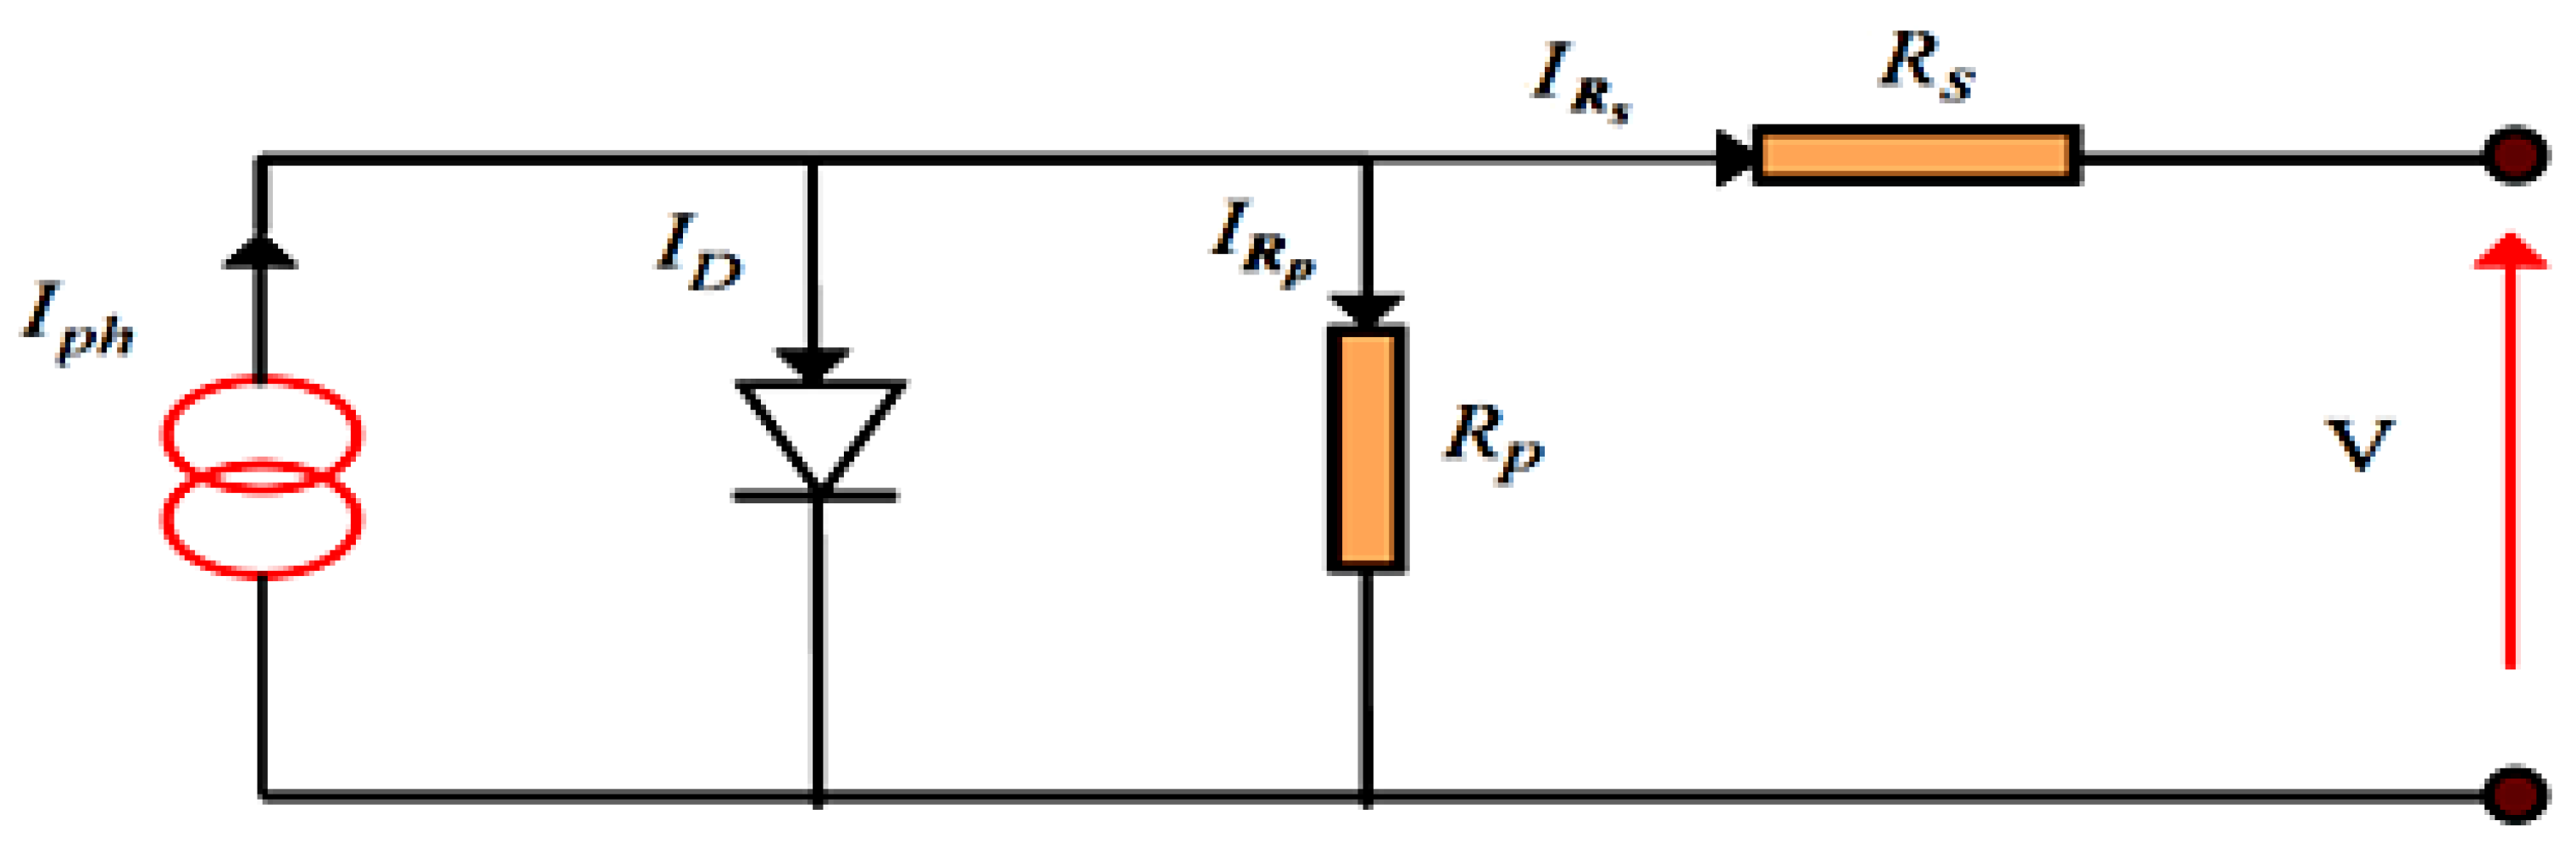
2.2. PV System Modeling

Solar cells’ modeling is essential to the study of photovoltaic plant generators. Generally, it is represented by an equivalent circuit [4] shown in Figure 2 below.
From Figure 2, for equivalent circuit, we can obtain
I p h = I D + I R p + I .
The resistor Rp current is obtained by
I R p = V + I R s R p ,
and diode current is obtained by
I D = I s e V + I R s n V t 1 ,
where Is is the diode saturation current obtained by
I s = K 1 T 3 e E g K T ,
where
  • Vt = KT/q: Thermal stress at temperature T;
  • q: Electron charge 1   .602 × 10 19   C ;
  • K: Boltzmann constant 1.381 × 10 23   J / k ;
  • K1: Constant 1.2   A / cm 2 K 3 ;
  • n: Junction non-ideality factor;
  • T: Effective cell temperature in Kelvin;
  • Eg: Gap energy (for crystalline silicon is equal to 1.12 eV).
Therefore, the expression of the characteristic I (V) is
I = I p h I s e V + I R s n V t 1 V + I R s R p .
The application of the Newton method makes it possible to calculate the value of the current I for each iteration with
I n + 1 = I n I c c I n I s [ e V + R s . I n V T 1 ] 1 I s R s n V T . [ e V + I n . R s n V T ] .
Then, the new value of Icc, short circuit courant, corresponds to an irradiation G, and a given temperature T is calculated according to the following equation:
I c c G , T = I c c r G 1000 [ 1 + a T T r e f ] .
Diode saturation current depends on the temperature. Its value for a given temperature T can be calculated by
I s T = I s r T r e f T T r e f 3 n e q . E g n K 1 T 1 T r e f .
Influence of solar radiation and temperature on PV power is represented by Equation (9):
P P V = I s c t N P I 0 S e V P V N s + R s I P V N p V T 1 V P V R p R s I P V R p . V P V .
A PV energy conversion system must have other components ensuring the operation of the system in a more reliable and optimum mode for power and efficiency indices, such as the use of DC-DC converters controlled by different control techniques [3,4,5], to have the desired output power able to supply industrial equipment.

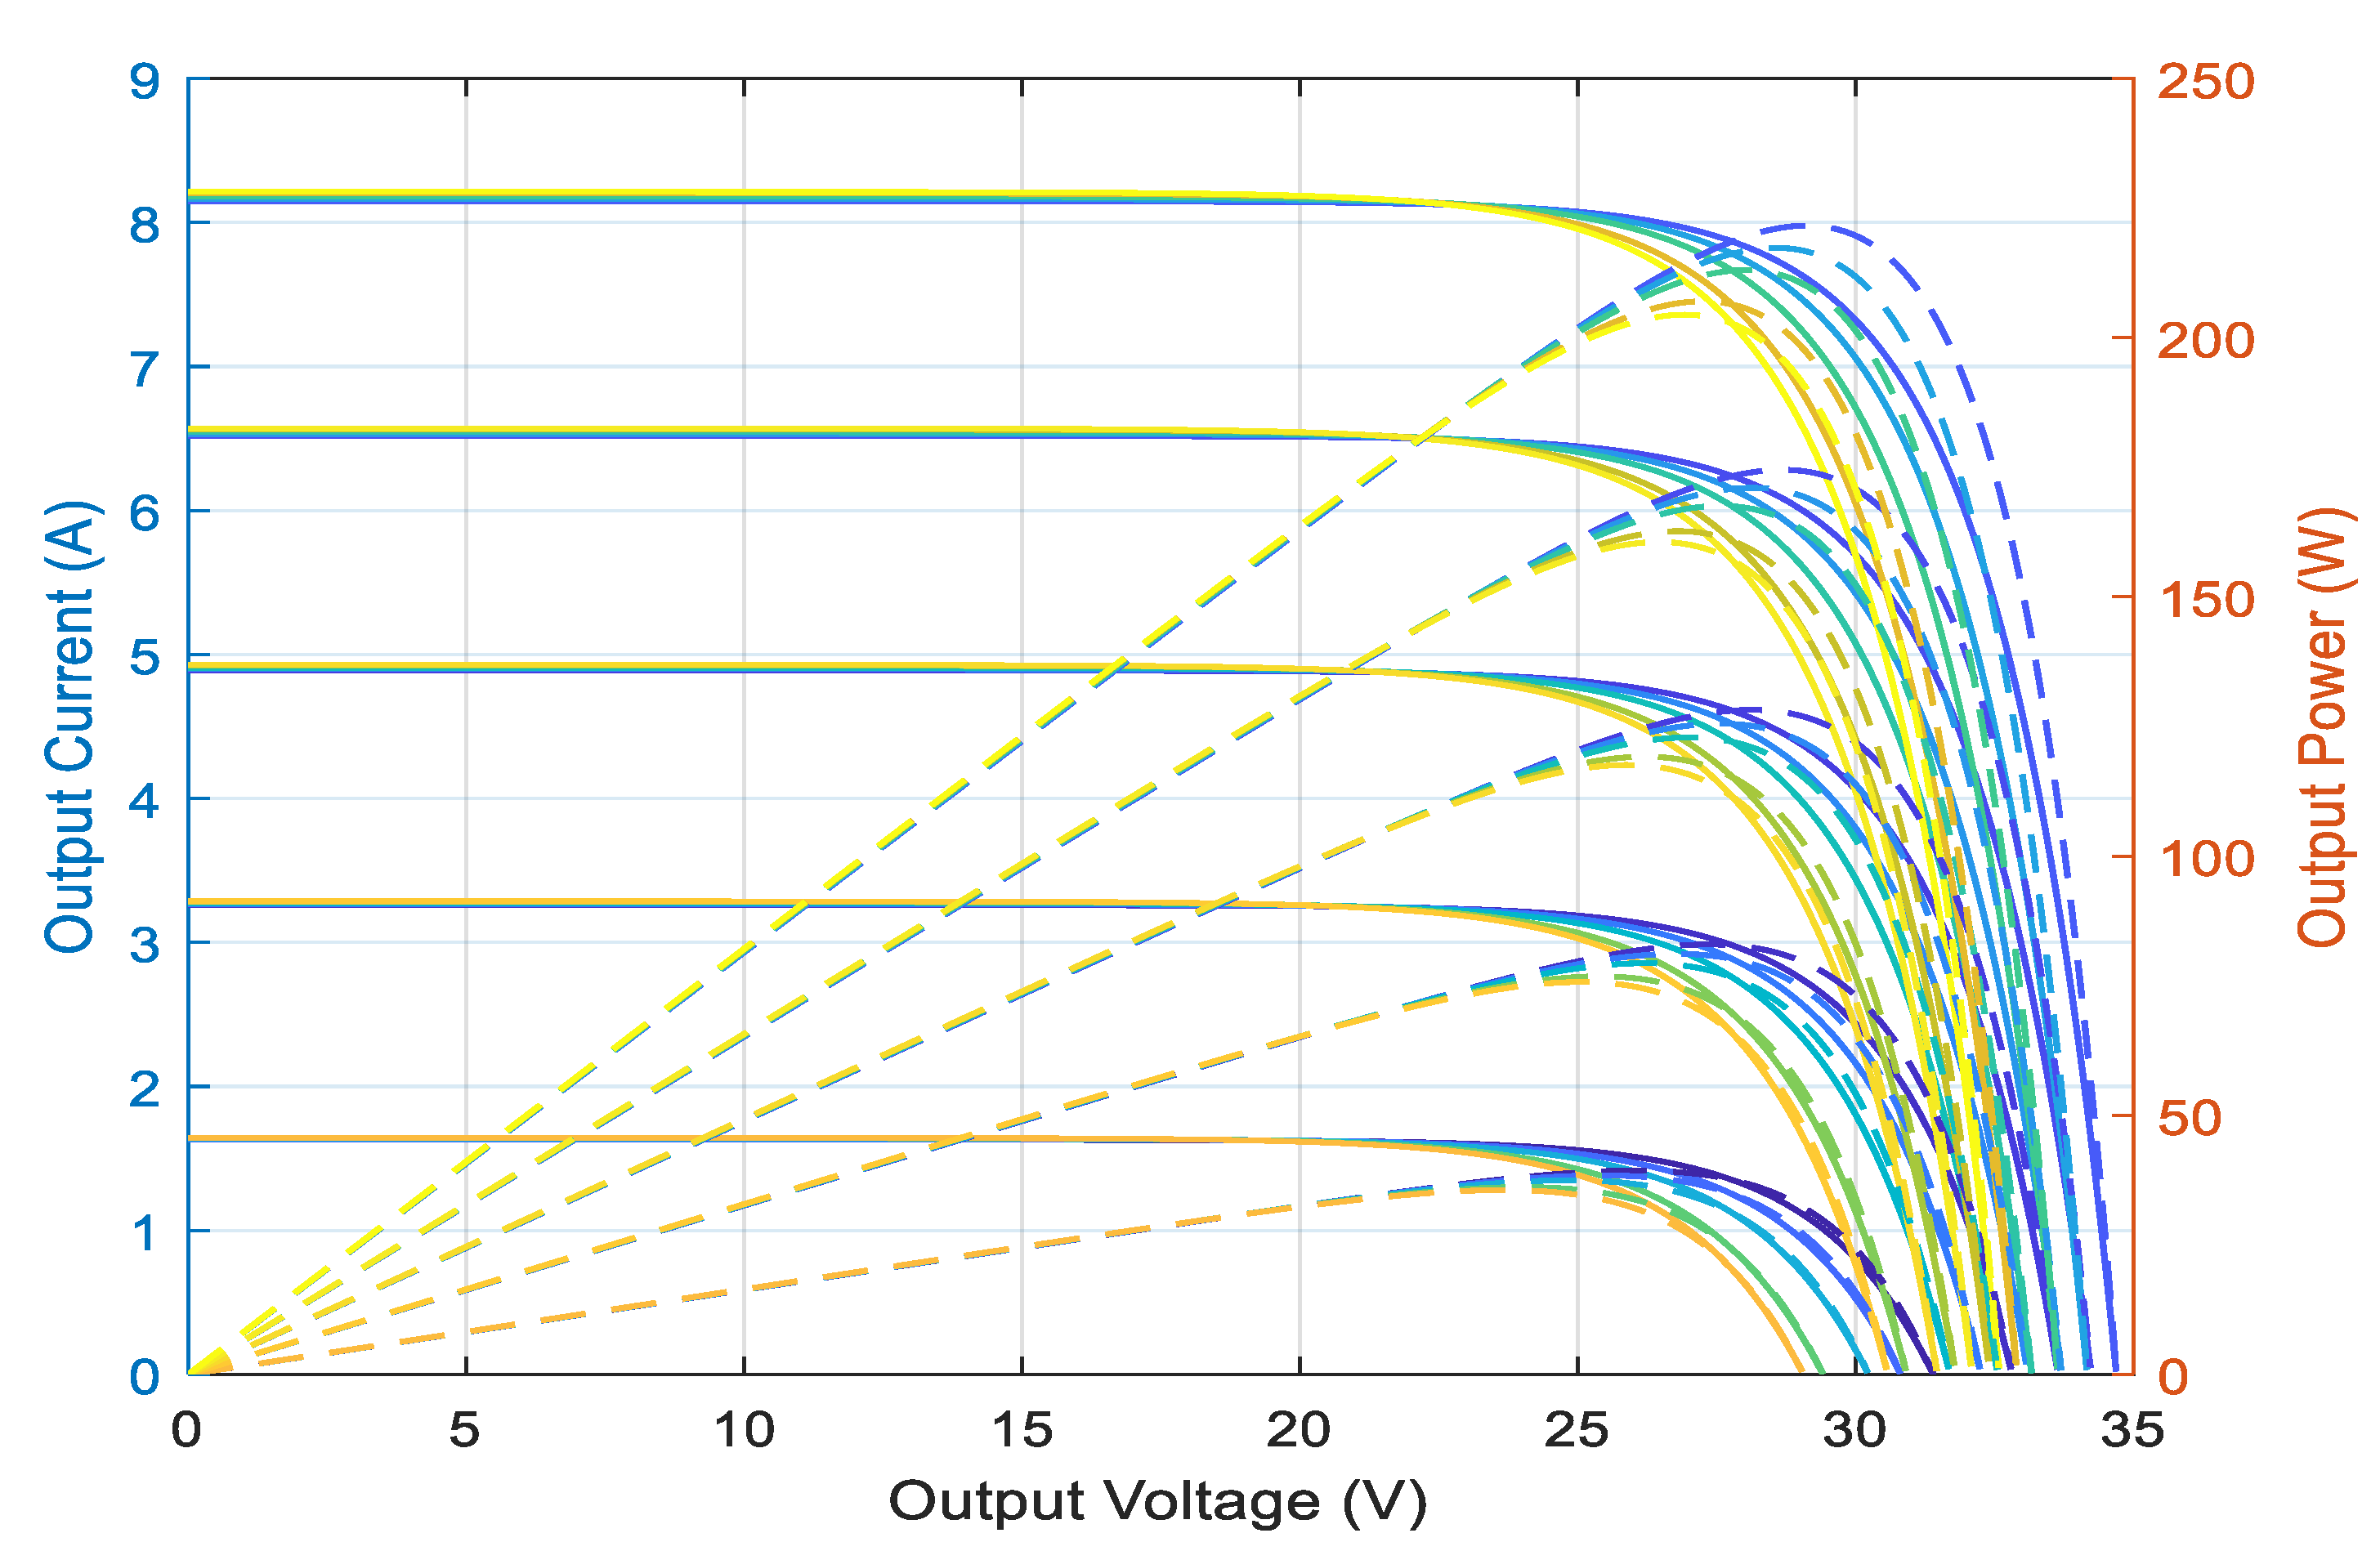
2.3. PV System MPPT Dependency on T & Ir

The power delivered by a PV depends on the ambient temperature, the wind speed, the mounting of the module (integrated in the roof or ventilated), and all these parameters change according to the chosen site for module installation. In addition, the coefficients linked to the temperature differ according to the materials used for the manufacture of the module [4].
Temperature is a very important parameter in the behavior of PV cells [4]. Figure 3 describes the behavior of the module under a fixed illumination of 1000 W/m2, and at temperatures between 15 °C and 40 °C. We notice that the current increases with the temperature; on the other hand, the open circuit voltage decreases. This leads to a decrease in the maximum power available.

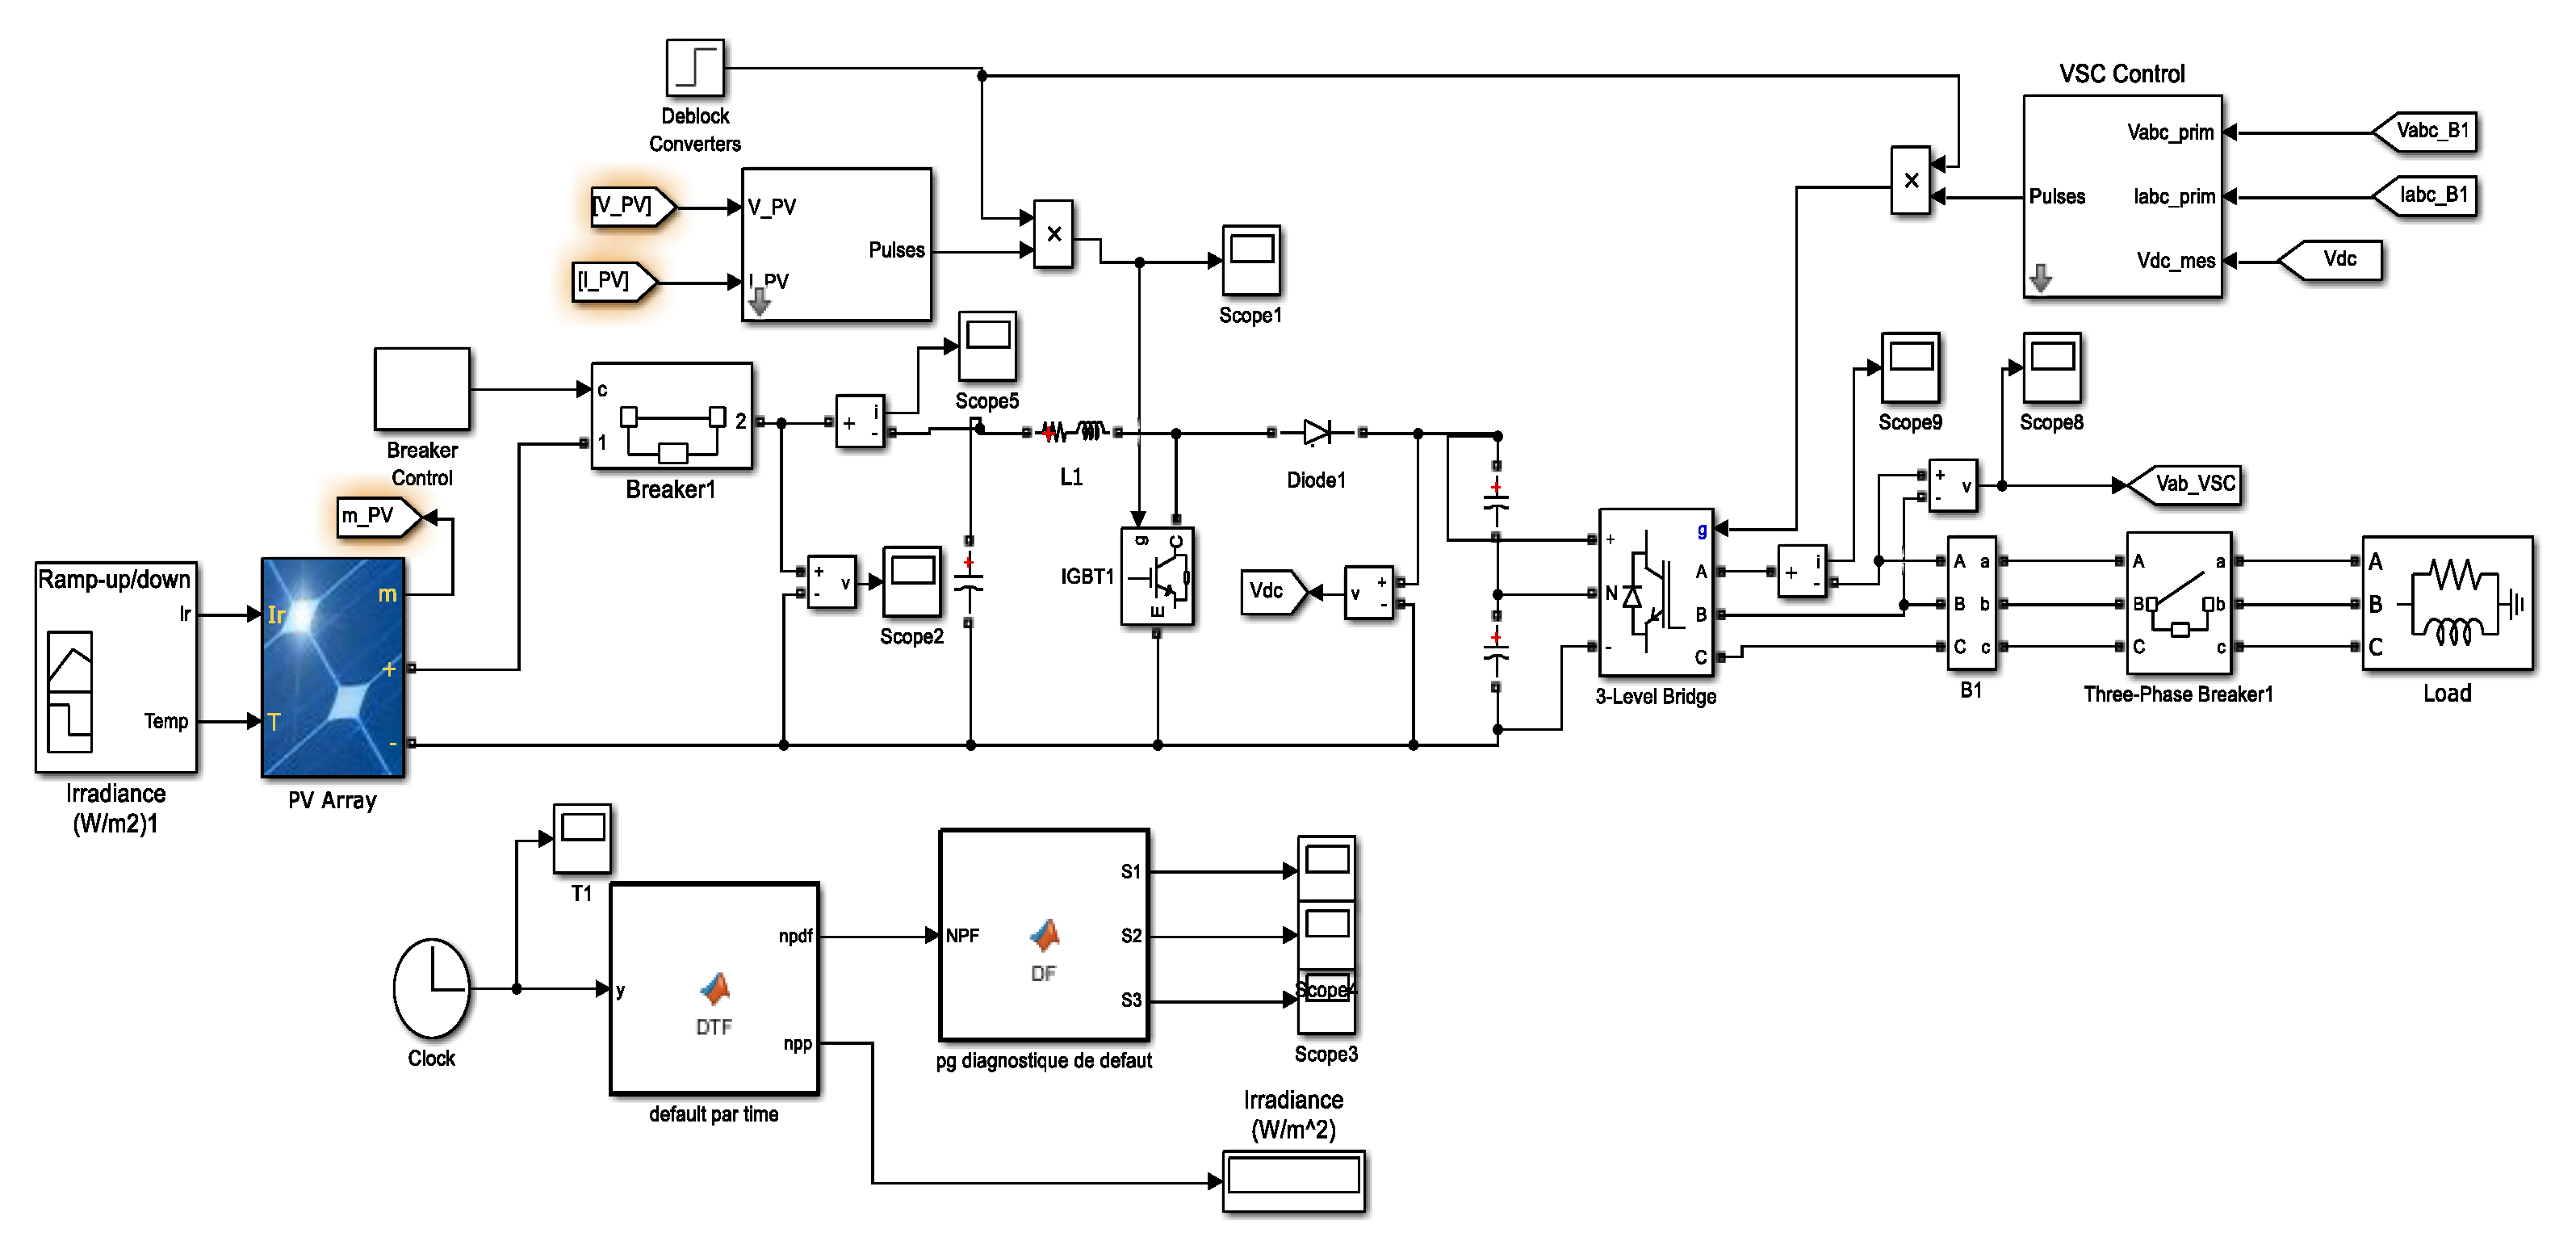
3. PV Power Quality Improvement Using APF and Simulation

The simulation block diagram presented in Figure 4 for an autonomous PV system based on polycrystalline solar panels under standard temperature and irradiation conditions (25 °C, 1000 W/m2) which supplies a load via a DC-DC-AC converter is used to supply the industrial plant with integration of an APF on the output of the PV inverter to minimize the harmonic presence and assure the power quality in the acceptable range. A fuzzy logic controller is used to ensure the DC voltage control of the parallel APF which is based on rules shown in the figure below.
Where the member sheep functions of error and the error variation are chow on Figure 5 and the output control cis represented by Figure 6 below
μ z [ e ( t ) ] = { 0 if e < ae 2 ( e ae 2 ) / ( ae 3 - ae 2 ) if ae 2 < e < ae 3 ( ae 4 e ) / ( ae 4 ae 3 ) if ae 3 < e < ae 4 0 if e > ae 4 ,
where the inference table is given by Table 1.
The aggregation rules are the following:
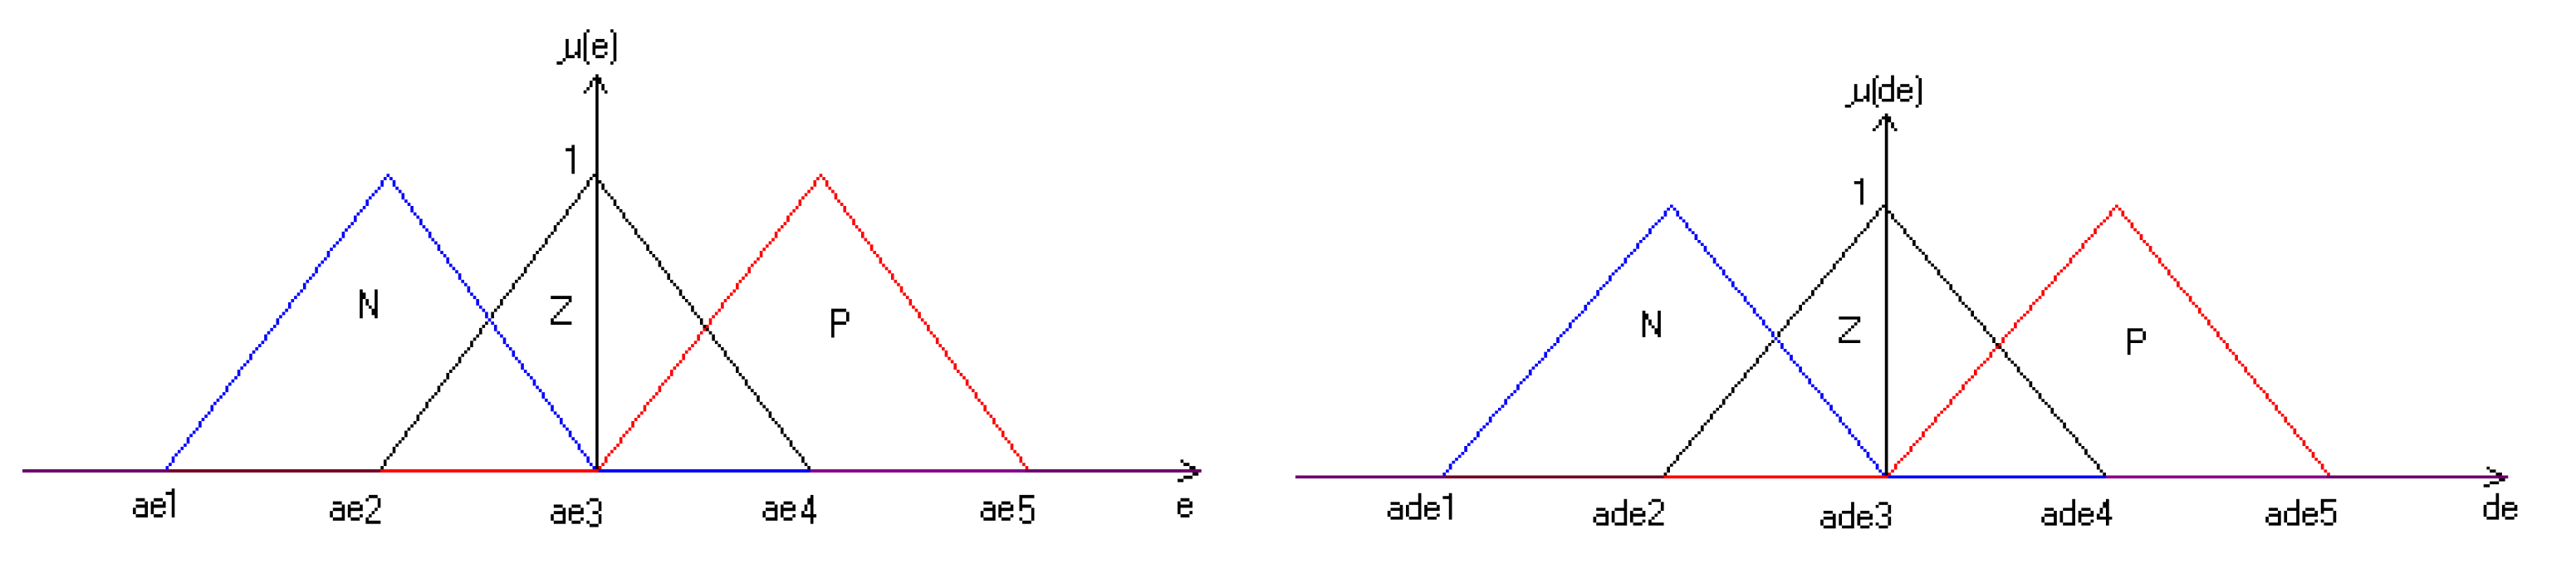
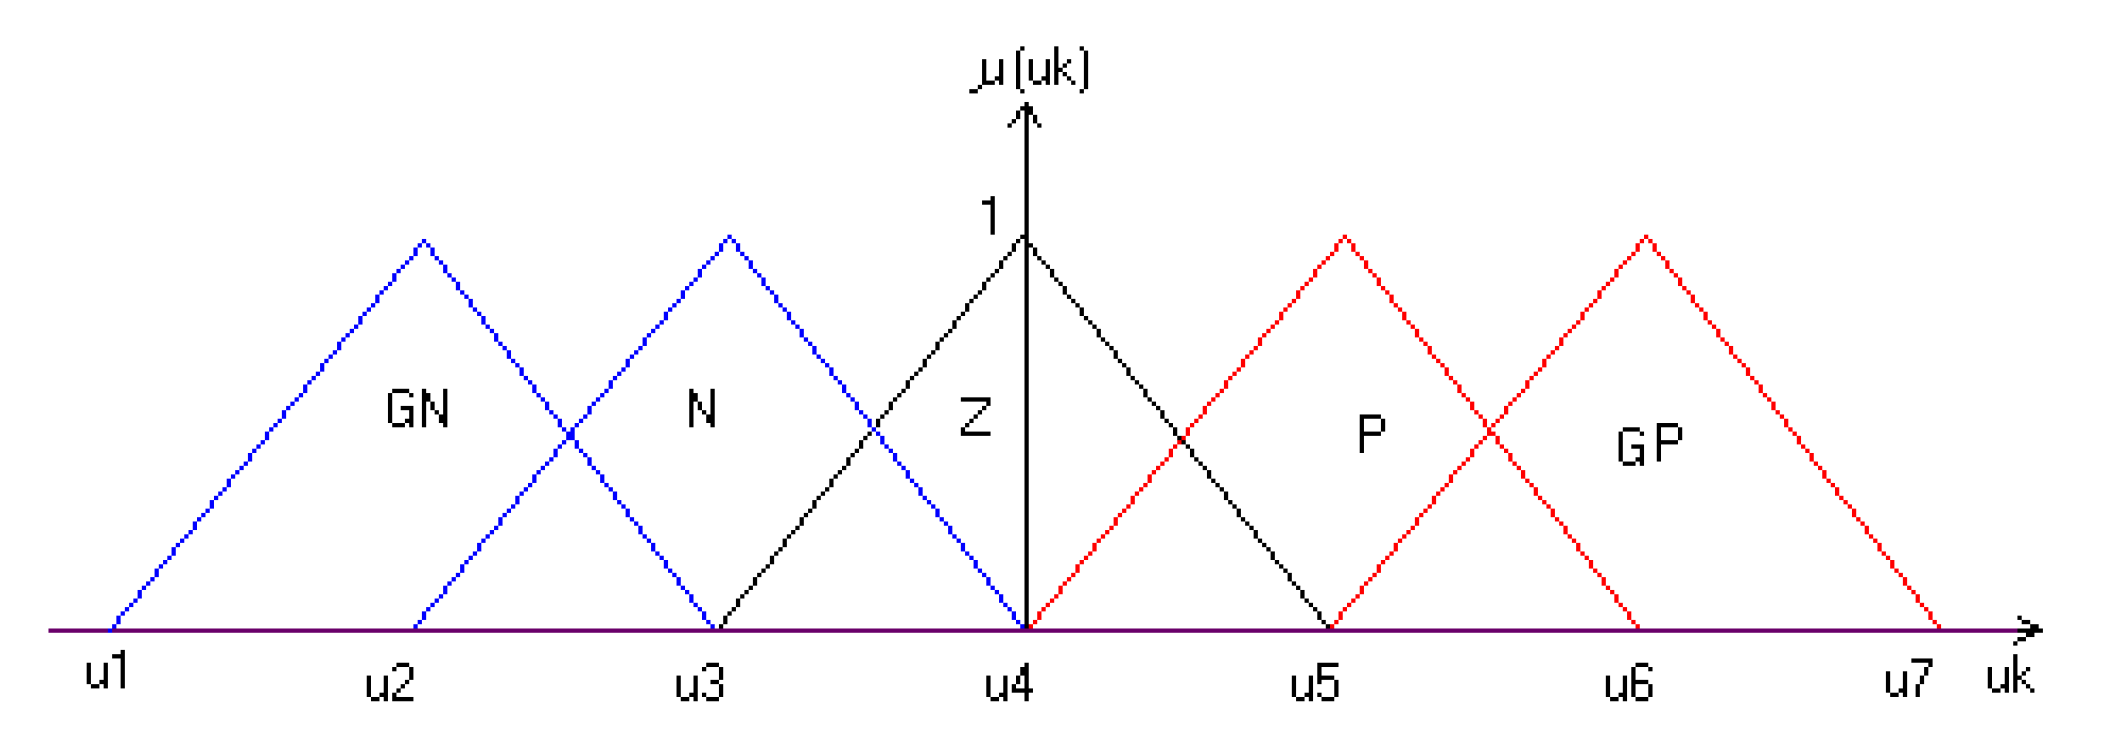
  • if (e < 0 & ∆e(t) < 0) ==> Ue is GN;
  • if (e > 0 et ∆e(t) > 0) ==> U is GP;
  • if (e < 0 & ∆e(t) > 0) OR (e = 0 & ∆e(t) = 0) OR (e = 0 & ∆e(t) > 0) OR (e = 0 & ∆e(t) < 0);
  • OR (e > 0 & ∆e(t) < 0) ====> U is Z ;
  • if (e < 0 & ∆e(t) = 0) ==> U is N ;
  • if (e > 0 & ∆e(t) = 0) ==> U is P.
The obtained results represented on Figure 7, Figure 8 and Figure 9 show the effect of the FLC on power quality improvement and the APF Dc voltage regulation with a response time less than 0.01 s.
Also static error obtained is near to zero in the two cases PI and FLC controllers results.
Where the harmonic specter represented on Figure 9 show the values of each harmonic before and after APF integration on Pv installation.

4. Conclusions

Nonlinear loads supplied by PV station harmonic have been described by the use of an APF controlled by PI controller and FLC controller. The APF installation on the network connected with the PV conversion chain decreased the THD of the network current from THD > 23% to less than THD < 5% with the use of a fuzzy logic controller.
We hope to apply more intelligent techniques to the studied system to obtain more suitable results for industrial application.

Author Contributions

Conceptualization, B.F.; methodology, B.F.; software, B.F.; validation, B.F.; formal analysis, B.F.; investigation, B.F.; resources, B.F.; data curation, B.F.; writing—original draft preparation, B.F.; writing—review and editing, B.F., T.S.A. and H.I.; visualization, B.F.; supervision, B.F., T.S.A. and H.I.; project administration, T.S.A. and H.I. All authors have read and agreed to the published version of the manuscript.

Funding

This research received no external funding for the university M’hamed Bougara of Boumerdes.

Institutional Review Board Statement

Validation by CS of LREE laboratory.

Informed Consent Statement

This study don’t involving humans.

Data Availability Statement

The work has been elaborated in the university of M’hamed Bougara of Boumerdes, faculty of hydrocarbons and chemistry, LREE laboratory directed by Habi Idir.

Conflicts of Interest

The authors declare no conflict of interest.

References

  1. Benchouia, M.; Ghadbane, I.; Golea, A.; Srairi, K.; Benbouzid, M. Implementation of adaptive fuzzy logic and PI controllers to regulate the DC bus voltage of shunt active power filter. Appl. Soft Comput. 2015, 28, 125–131. [Google Scholar] [CrossRef]
  2. Zelloumaa, L.; Rabhib, B.; Saadc, S.; Benaissad, A.; Benkhorise, M.F. Fuzzy logic controller of five levels active power filter. Energy Procedia 2015, 74, 1015–1025. [Google Scholar] [CrossRef]
  3. Li, H.-X.; Gatland, H.B. New methodology for designing a fuzzy logic controller. IEEE Trans. Syst. Man Cybern. 1995, 25, 3. [Google Scholar]
  4. Hassan, A.A.; Fahmy, F.H.; El-Shafy, A.; Nafeh, A.; Hosam, K.M. Youssef, Control of Three-Phase Inverters for Smart Grid Integration of Photovoltaic Systems. J. Electr. Syst. 2022, 18, 109–131. [Google Scholar]
  5. Kamel, K.; Laid, Z.; Kouzou, A.; Hafaifa, A.; Khiter, A. Comparison of Control Strategies for Shunt Active Power Filters in Three-Phase Three-Wire Systems. In Proceedings of the 3rd International Conference on Power Electronics and their Applications ICPEA 2017, Djelfa, Algeria, 16–17 September 2017. [Google Scholar]
Figure 1. PV station power conversion basic part.
Engproc 29 00017 g001
Figure 2. One-diode equivalent circuit of the solar cell.
Engproc 29 00017 g002
Figure 3. MPPT function of irradiation and temperature.
Engproc 29 00017 g003
Figure 4. PV plant simulation bloc.
Engproc 29 00017 g004
Figure 5. Error and error variation membership functions.
Engproc 29 00017 g005
Figure 6. Command membership functions.
Engproc 29 00017 g006
Figure 7. Load, APF and Supply current with and without APF connection.
Engproc 29 00017 g007
Figure 8. APF VDC voltage regulation with PI then FLC controller.
Engproc 29 00017 g008
Figure 9. Harmonic specter of supply current before and after APF connecting.
Engproc 29 00017 g009
Table 1. FLC inference table.
∆e/eNZP
NGNZZ
ZNZP
PZZGP
Disclaimer/Publisher’s Note: The statements, opinions and data contained in all publications are solely those of the individual author(s) and contributor(s) and not of MDPI and/or the editor(s). MDPI and/or the editor(s) disclaim responsibility for any injury to people or property resulting from any ideas, methods, instructions or products referred to in the content.

