Proceeding Paper

Pricing Policy Applied to Power Quality Enhancement in Smart Metering Systems †

by
Abdelmadjid Recioui
* and
Fatma Zohra Dekhandji
Laboratory of Signals and Systems, Institute of Electrical and Electronic Engineering, University M’hamed Bougara of Boumerdes, Boumerdes 35000, Algeria
*
Author to whom correspondence should be addressed.
Presented at the 2nd International Conference on Computational Engineering and Intelligent Systems, Online, 18–20 November 2022.
Eng. Proc. 2023, 29(1), 15; https://doi.org/10.3390/engproc2023029015
Published: 18 January 2023

Abstract

:
Power quality problems exist in every power system; the more advanced the system is, the higher the probability for issues to occur is, and the smart grid is no exception. In this paper, a study of a residential area is implemented using the LABVIEW simulation software, in which the power of each house with its own appliances is monitored in real time, meaning the power of the whole system is also monitored, including instantaneous and accumulative power, current, power factor—all elements required for system assessment. In addition, a billing policy of each individual house to see the total price to be paid for the power supplied is also devised. All these factors contribute to the analysis and overview of the effect of power quality problems on the grid, both electrically and economically. The results of the simulation indicate that the pricing policy proposed is indeed effective for both sides of the grid, the supplier and the consumer.

1. Introduction

Power quality (PQ) is defined as supplying the clearest sinusoidal waveforms for voltage and current for the electrical network at the recommended frequency and magnitude [1,2,3,4,5]. PQ can be influenced by a variety of factors, including voltage and frequency fluctuations, imbalance, interruption, flicker, and harmonics [6,7,8]. The surveillance and regulating of PQ is a significant hurdle for electricity companies. As a result, energy suppliers do not quantify or sustain PQ for residential customers.
Introducing a PQ-based penalty/incentive strategy for residential clients necessitates the installation of smart meters for each client. Traditional digitizedor smart electricity meters are created to monitor particular electric indicators, such as power, energy, and power factor, among others. Due to hardware and software restrictions, they are not suitable for the deployment of a PQ-based tariffingsystem. PQ meters should also possess extra functionalities, such as higher sampling rates for voltage and current, synchronized sampling, denoising, data processing, and the ability to handle largedata [9].
Engineers, electricians, and technicians primarily use commonly produced PQ analysis tools to track and troubleshoot electronic systems or locations [10]. Yet, these are prohibitively expensive and impractical for an electricity company to install at each residential client’s home for direct PQ meter reading. Furthermore, it is difficult for customers to interpret such complicated meters and understand the quality of the electricity they obtain. As a result, an easy-to-usesmart meter including useful energy and PQ monitoringcapabilities togetheris required. Moreover, the meter must be robust, user-friendly, simple to comprehend, and inexpensive.
With a suitable PQ surveillance equipment and the implementation of a PQ-based tariffing for low voltage clients, a whole distribution network can be controlled from the PQ point of view [9]. The penalty or reward pricing scheme based on PQ thresholds must be launched. Based on the techno-economic characteristics of poor PQ, the penalty and incentive value for reactive power level and harmonic content may be determined [11].
Numerous techniques to create a tariffing related to the PQ level have been suggested in the literature. Several countries, including Belgium, the United States, the United Kingdom, Germany, and Poland, have put in place reactive energy tariffs to minimize losses in their distribution networks [12,13]. Ref. [14] suggests a tariff strategy for residential clients based on reactive energy and provides the supplier’s savings as well. This strategy, on the other hand, mainlyemphasizes capital expenditure (capex) payback, with price breakdown values estimated experimentally. Other tariff strategies [15,16] provide reactive energy rewards depending on the power factor, active power, or reactive energy, with all reward parameters derived experimentally.
A lot of important work has been conducted lately in the area of PQ-based smart metering. Ref. [17] suggests design criteria and important attributes for a PQ-based smart meter. One more work, [18], illustrates a smart PQ meter for residential clientsthat monitors PQ metrics, voltage and frequency incidents. It does not, however, indicate or track the client’s current. Furthermore, it necessitates an outside computer and does not include an energy metering feature. The authors of [19] presented an ethernet-based smart meter for PQ monitoring that assesses voltage quality using the LABVIEW software. It encompasses aload scheduling feature for onlinePQ enhancement. Such ameter further necessitates a separate computer to operate LABVIEW and does not monitor clients’ current anomalies. Under solelylinear load situations, a stand-alone smart meter presented in [20] can identify voltage sag and swell, supply frequency, and power factor. Nevertheless, it is not suitable for quantifying the harmonic content for both voltage and current of power–electronic fedloads, neither it is adequate for measuring the displacement power factor (DPF). The authors of [21] created a smart meter relying on a Raspberry Pi that cannot quantify clients’ current disturbance. The voltage metrics are the only ones measured by an accessible Raspberry-Pi-based PQ monitoring system described in [22]. Furthermore, the use of Raspberry Pi is repetitive, costly, and has a comparatively greater energy usage. The multi-purpose smart meter in [23] can measure both power and PQ disturbancesand has anti-theft functionalities. However, it missesthe feature ofassessing clients’ current distorsion. The authors in [24] propose an advanced FPGA-based PQ surveillance system that turns out to becomplex and requires a peripheral computer to run LABVIEW. One more FPGA-based intelligent power meter described in [25] is a stand-alone instrument for residential applications. However, it turns out to have acomplicated structure that is not cost-effective for residential use.It may be deduced that the smart meters built around FPGA and RaspberryPiare not self-contained and cost-effective for residential PQ surveillance applications.
The aim of this work is to examine the power quality disturbances in areas equipped with smart meters and their effect on the power consumption and pricing from both the consumer’s and supplier’s perspectives. To fulfill the goals of this study, a simulation of a residential area with a composition of 60 houses equipped with 8 appliances, with houses influenced by the earlier cited power quality problems, has been developed to clarify and detect the slight change in the electrical system parameters, which revealed that power quality problems increase the power demand and the pricing bills for the consumer and the supplier.

2. State of Art on Electrical Energy Pricing Policies

Tariffs are the costsof providing electric power to an end user [26,27,28,29,30]. The quantity of power that the load receives determines the price of generating electricity. Tariffs must be adapted to different kinds of clients (e.g., industrial, residential and commercial). Pricing estimation for variousclients is far more difficult. The pricing policy includes several objectives to be accomplished.
Utility companies sell electricity at a rate that not only encloses its expensesbut generates a reasonable profit as well. Tariff rates should aim to accomplish the following goals: The expense of generating electrical power at the power station is covered. Costs associated with the capital spending in distribution and transmission infrastructure. Restoration of the operating and maintenance expenses for electrical power availability. A reasonable return on capital funding.There are several types of tariffing strategies [30,31,32,33]. These are outlined in what follows:

2.1. Simple Tariff

A simple pricing or standard price has a specified priceper amount of electrical power expended. This tariff scheme is straight forward, and the cost does not vary with the number of units used. An energy meter is used to track the amount of electricity spent at the client connectors. Clients can understand this tariffing scheme because it is rudimental. Every consumer should reimburse the same set price irrespective of usagevariability. The price per supplied amountis substantial. It does not advocate for the consumption of energy.

2.2. Flat Rate Tariff

A flat rate tariff refers to when various kinds of clients are billed at diverse uniform per unit prices. In this scheme, clients are divided into various categories, and each category has a specified uniform price. The various consumer categories are created with their variability and load conditions in mind. This scheme is more beneficial to the various kinds of clients. Flat rate tariffing is very easy in terms of calculations. Distinct meters are needed for lighting load, power load, and so on. The implementation of such a tariff is complex and expensive. A specific category of clients is billed at the same price regardless of the amount of electricity utilized.

2.3. Block Rate Tariff

Block rate tariffing means a particular interval of electricity is required to be paid at a specified priceand subsequent levels of electricity are billed at gradually lower prices [30]. The electricity usage is grouped into clusters, with a set cost per share at every cluster. The cost per electricity usagein the first cluster is the most expensive and it is gradually decreased for the subsequent intervals of consumption. The client receives a reward for utilizing more electricity. This enhances the power factor of the network and, thus, the electricity generation expenses are lowered. Nevertheless, this scheme fails to monitor the clients’ electricity demand. This kind of tariffing is deployed in most domestic and low-consumption commercial clients.

2.4. Two-Part Tariff

A two-part tariffing refers to the case when the price of electricity is billed relative to the user’s peak power as well as the utilized amounts of energy [30,31,32,33]. The overall client’s billis separated into two parts in a two-part tariffing scheme: fixed costs and running fees. The fixed costs are determined relative tothe user’s peak power, whereas the running fees are measured in terms of power consumed. As a result, the client is billed a set fee per kW of peak power plus a predefined costper kWh of electricity expended. This kind of tariffingis typically utilized with industrial customers that havehigher peak power. Users can easily understand this scheme. It restores the expenses that are derived fromthe users’ peak power. This scheme is unaffected by the amount of energy spent. The client should reimburse the direct costs regardless of the amount of electricity utilized. There arefrequently mistakes in estimating the peak user power usage.

2.5. Maximum Demand Tariff

This is similar to a two-part tariffing scheme; however, the peak power is actually monitored by installing a peak loaddemand meter in the user’s home. The highest usage is determined solely by the presale estimate. This tariffing strategyis often applied to large customers. This is not appropriate for relativelysmallerclients. It is necessary to have a dedicated maximum power meter.

2.6. Power Factor Tariff

The power factor tariffingis the pricethat considers the user’s load power factor. A poor power factor raises the rated capacity of the powerstation transformers and multiplies transmission losses. A user with a poor power factor must be punished. The nextare some examples of power factor tariffs: kVA pricefor peak consumption: It is a two-part tariffing systemin a mutated way. In this situation, the set costs are calculated based on the highest consumption in kVA rather than kW. A client with a poor power factor must make a significant contribution to the fixed costs. Tariffing based on a relative scale: This is additionally namedan average power factor tariffing.Within that scenario, a mean power factor, assume 0.8 lagging, is used as a guide. In case the user’s power factor drops below this level, appropriate extra fees are levied. If the power factor is greater than a certain threshold, the client is entitled to a price reduction.

2.7. KW and KVAR Tariff

This tariffing formcharges for both active power (kW) and reactive power (kVAR) delivered [34,35]. A client with a lower power will use more reactive power and thus reimburse more expenses.

2.8. Three-Part Tariff

A three-part tariffing implies thatthe total cost to bepaid by the client is divided into three parts: a fixed fee, a semi-fixed cost, and an operating price, and is given as [30]:
Total charge = Rs(a + b × kW + c × kWh)
where:
a = setfee made at each bill establishement phase;
b = cost per kW of peakpower usage;
c = price per kWh of electricity utilized.
It is evident that appending a fee to a two-part tariffing schemeresults in a three-part tariff. The main criticism of this form of tariffingis that the costsare divided into three parts. This strategyis typically imposed on large consumingclients.

3. Results and Discussions

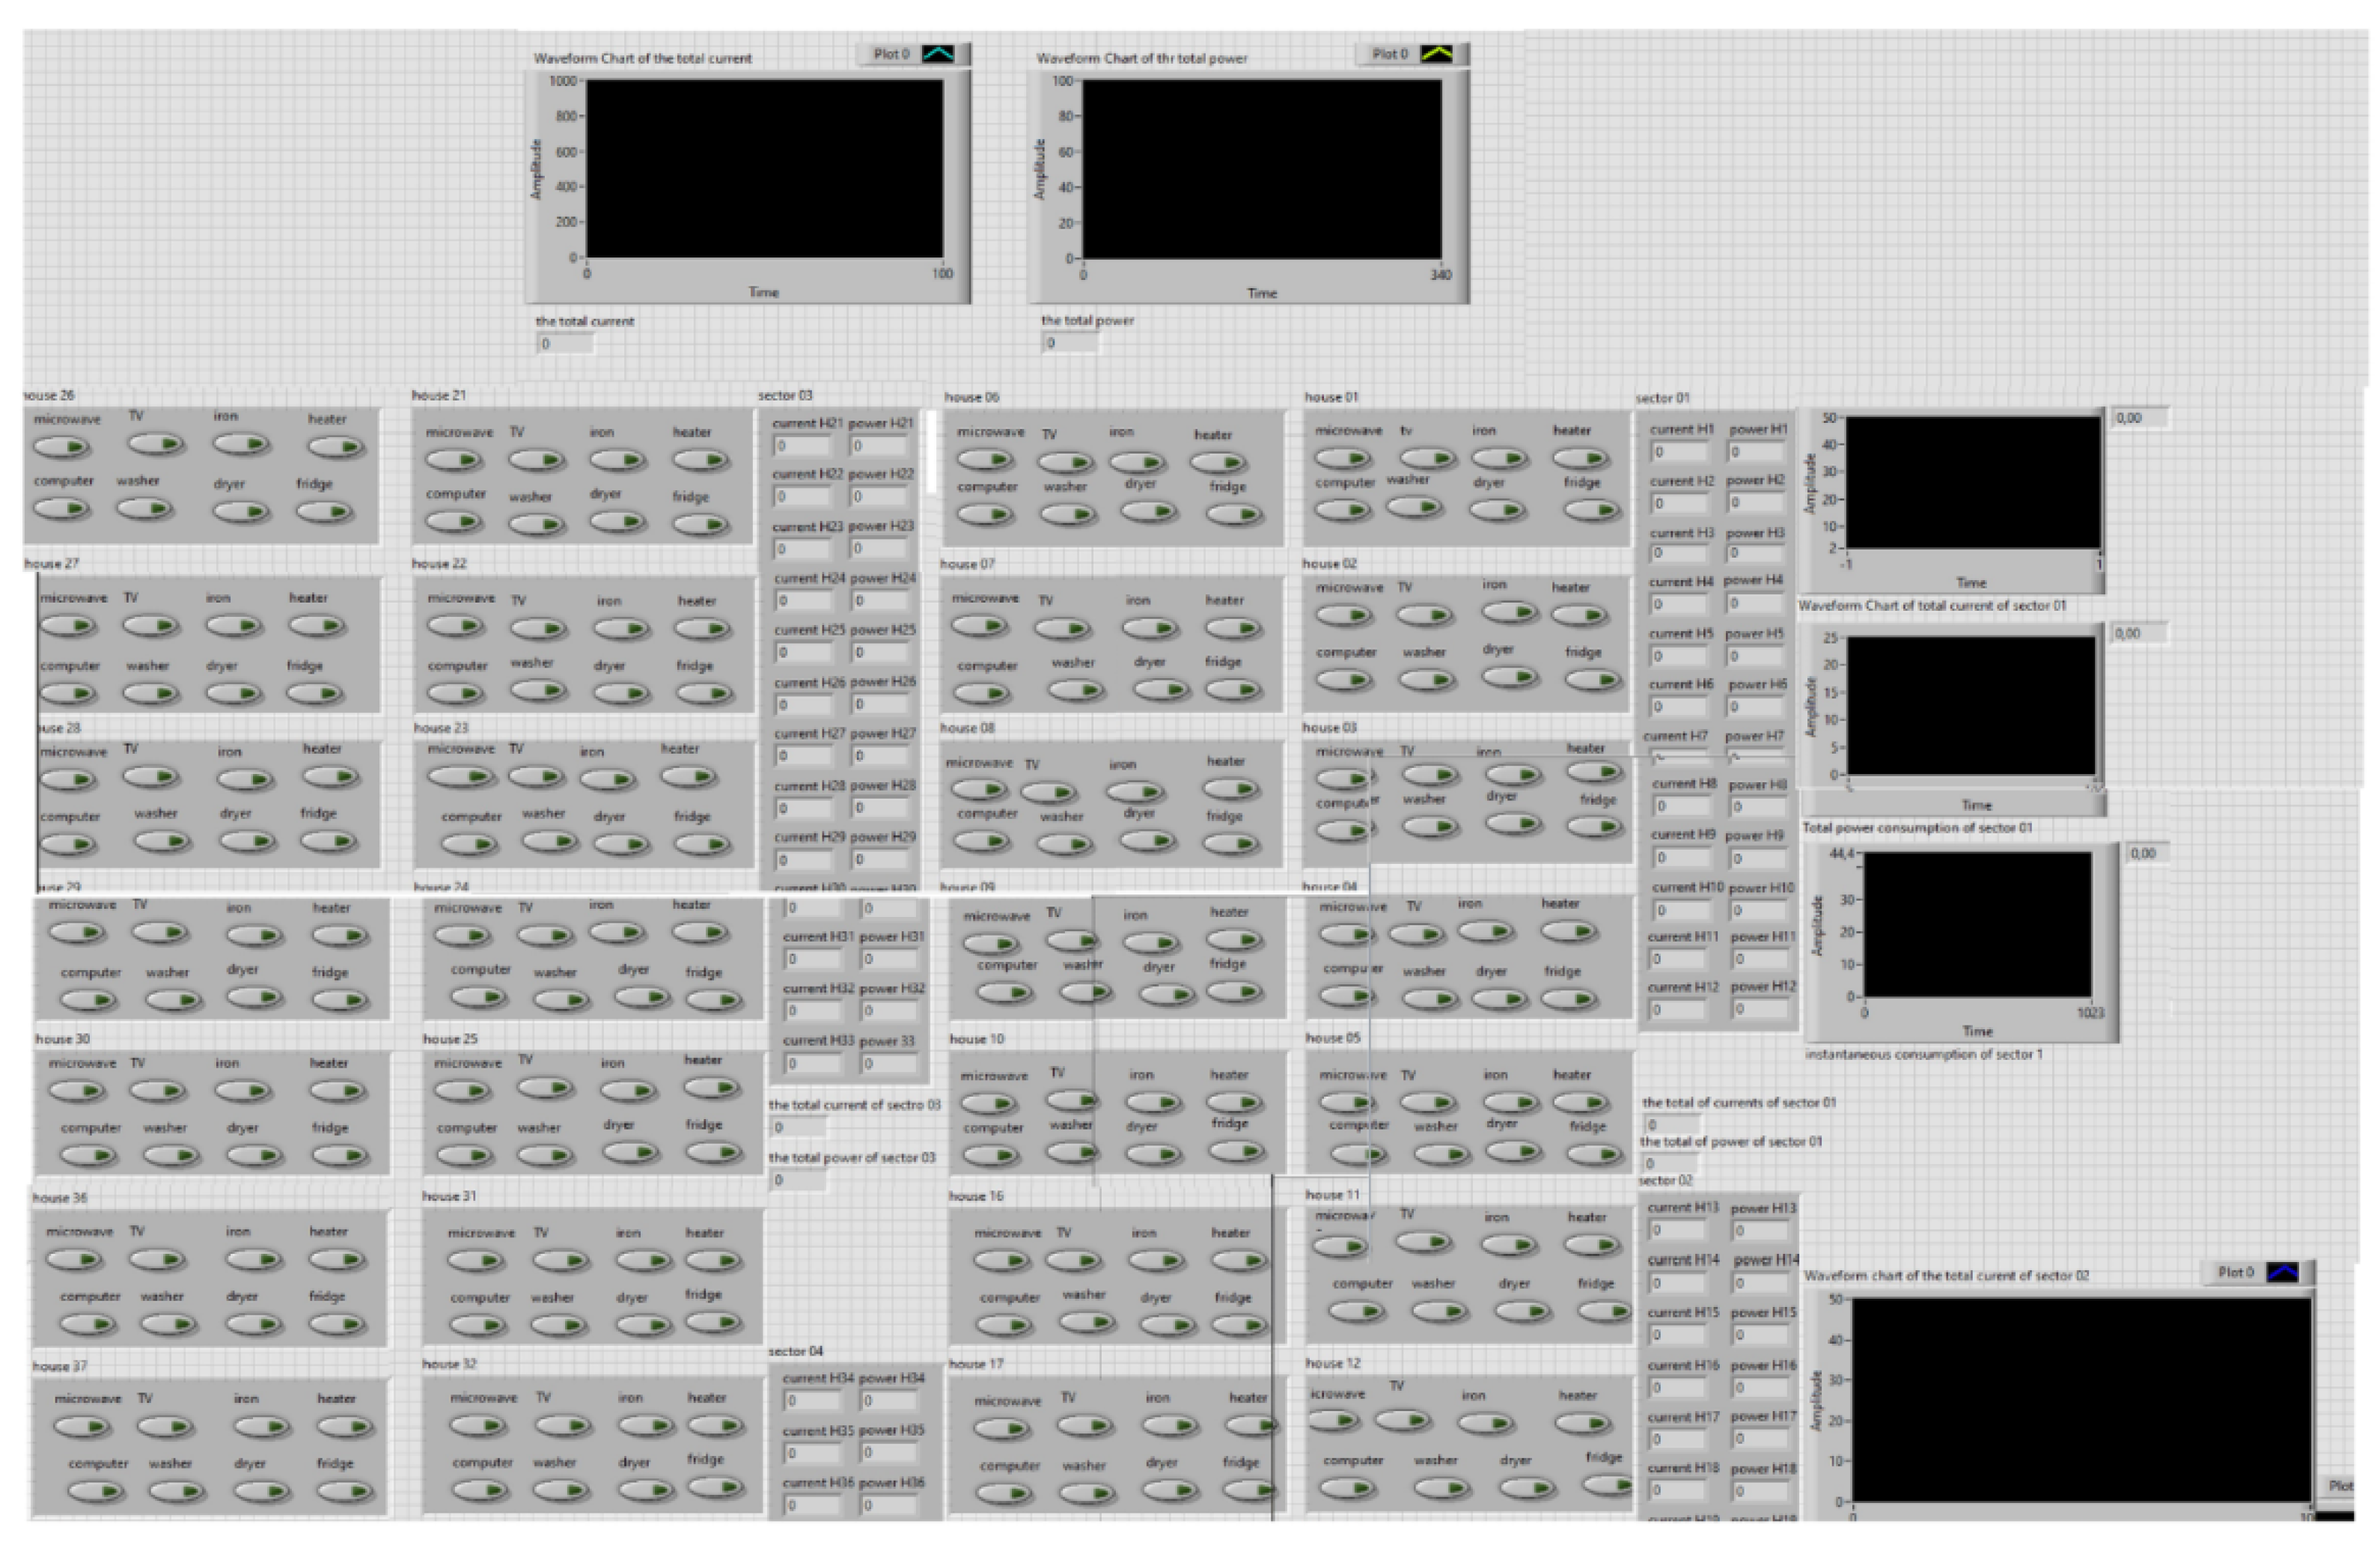
3.1. Simulated System Description

Using LABVIEW software, a simulation of a smart city with 60 houses numbered from 1 to 60 is performed in order to investigate and quantify some major power quality problems. The city has been arbitrarily divided into sectors, each sector with a number of houses, and each house with different appliances. The six sectors andtheir corresponding houses are: houses 1–12 for sector 1, 13–20 for sector 2, 21–33 for sector 3, 34–40 for sector 4, 41–51 for sector 5, and 52–60 for the last sector. Each house is equipped with different appliances: TV, washer, dryer, iron, fridge, microwave, computer and heater.Voltage and current waveforms are generated with amplitude and phase calculated from power factor consumption, withthe voltage as a fixed value of 220 V, a phase of 0 rad, and a frequency of 50 Hz. As for the current, it is deduced from the power consumption factor and the power factor for each appliance. Table 1 presents the real life estimated usage power for each appliance to make the simulation as close as possible to real life scenarios.
To account for harmonic content, harmonics are added to the sinusoidal waveform. Three block diagrams of signals have been added with frequency multiple of the fundamental frequency to imitate the effect of the third, fifth, and seventh harmonics. The calculation of the total harmonic distortion (THD) is carried outby taking the ratio of the square root of the sum of the square RMS values of the current harmonic signals to the RMS value of the fundamental current signal.

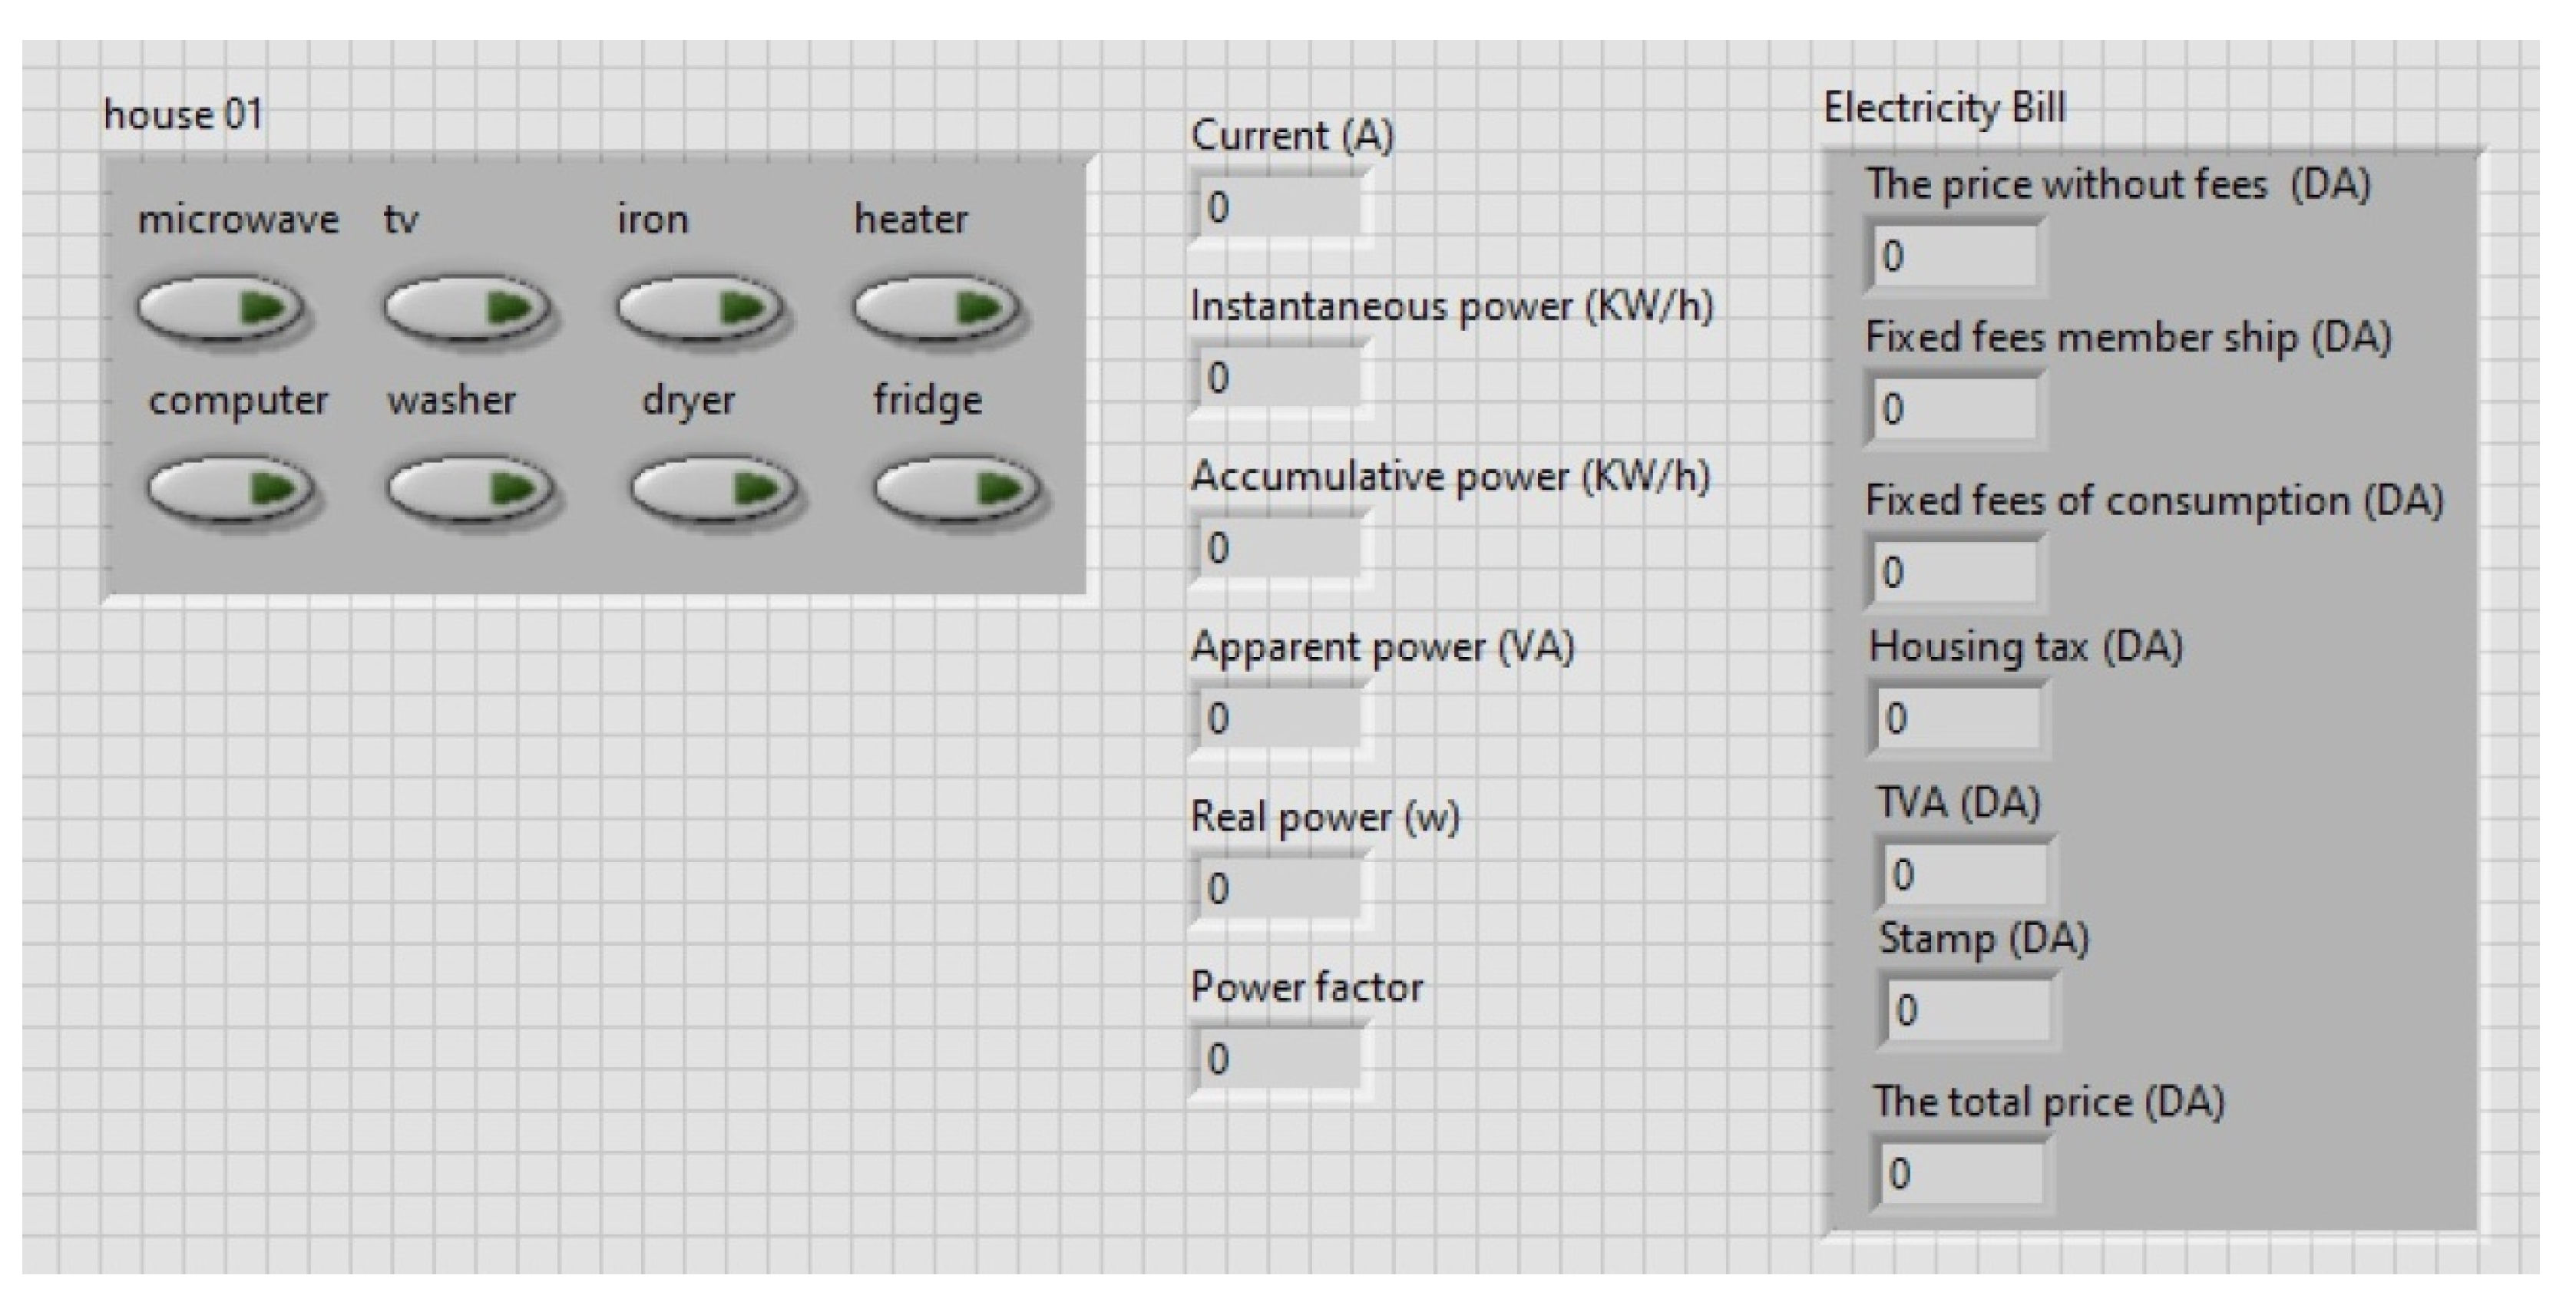
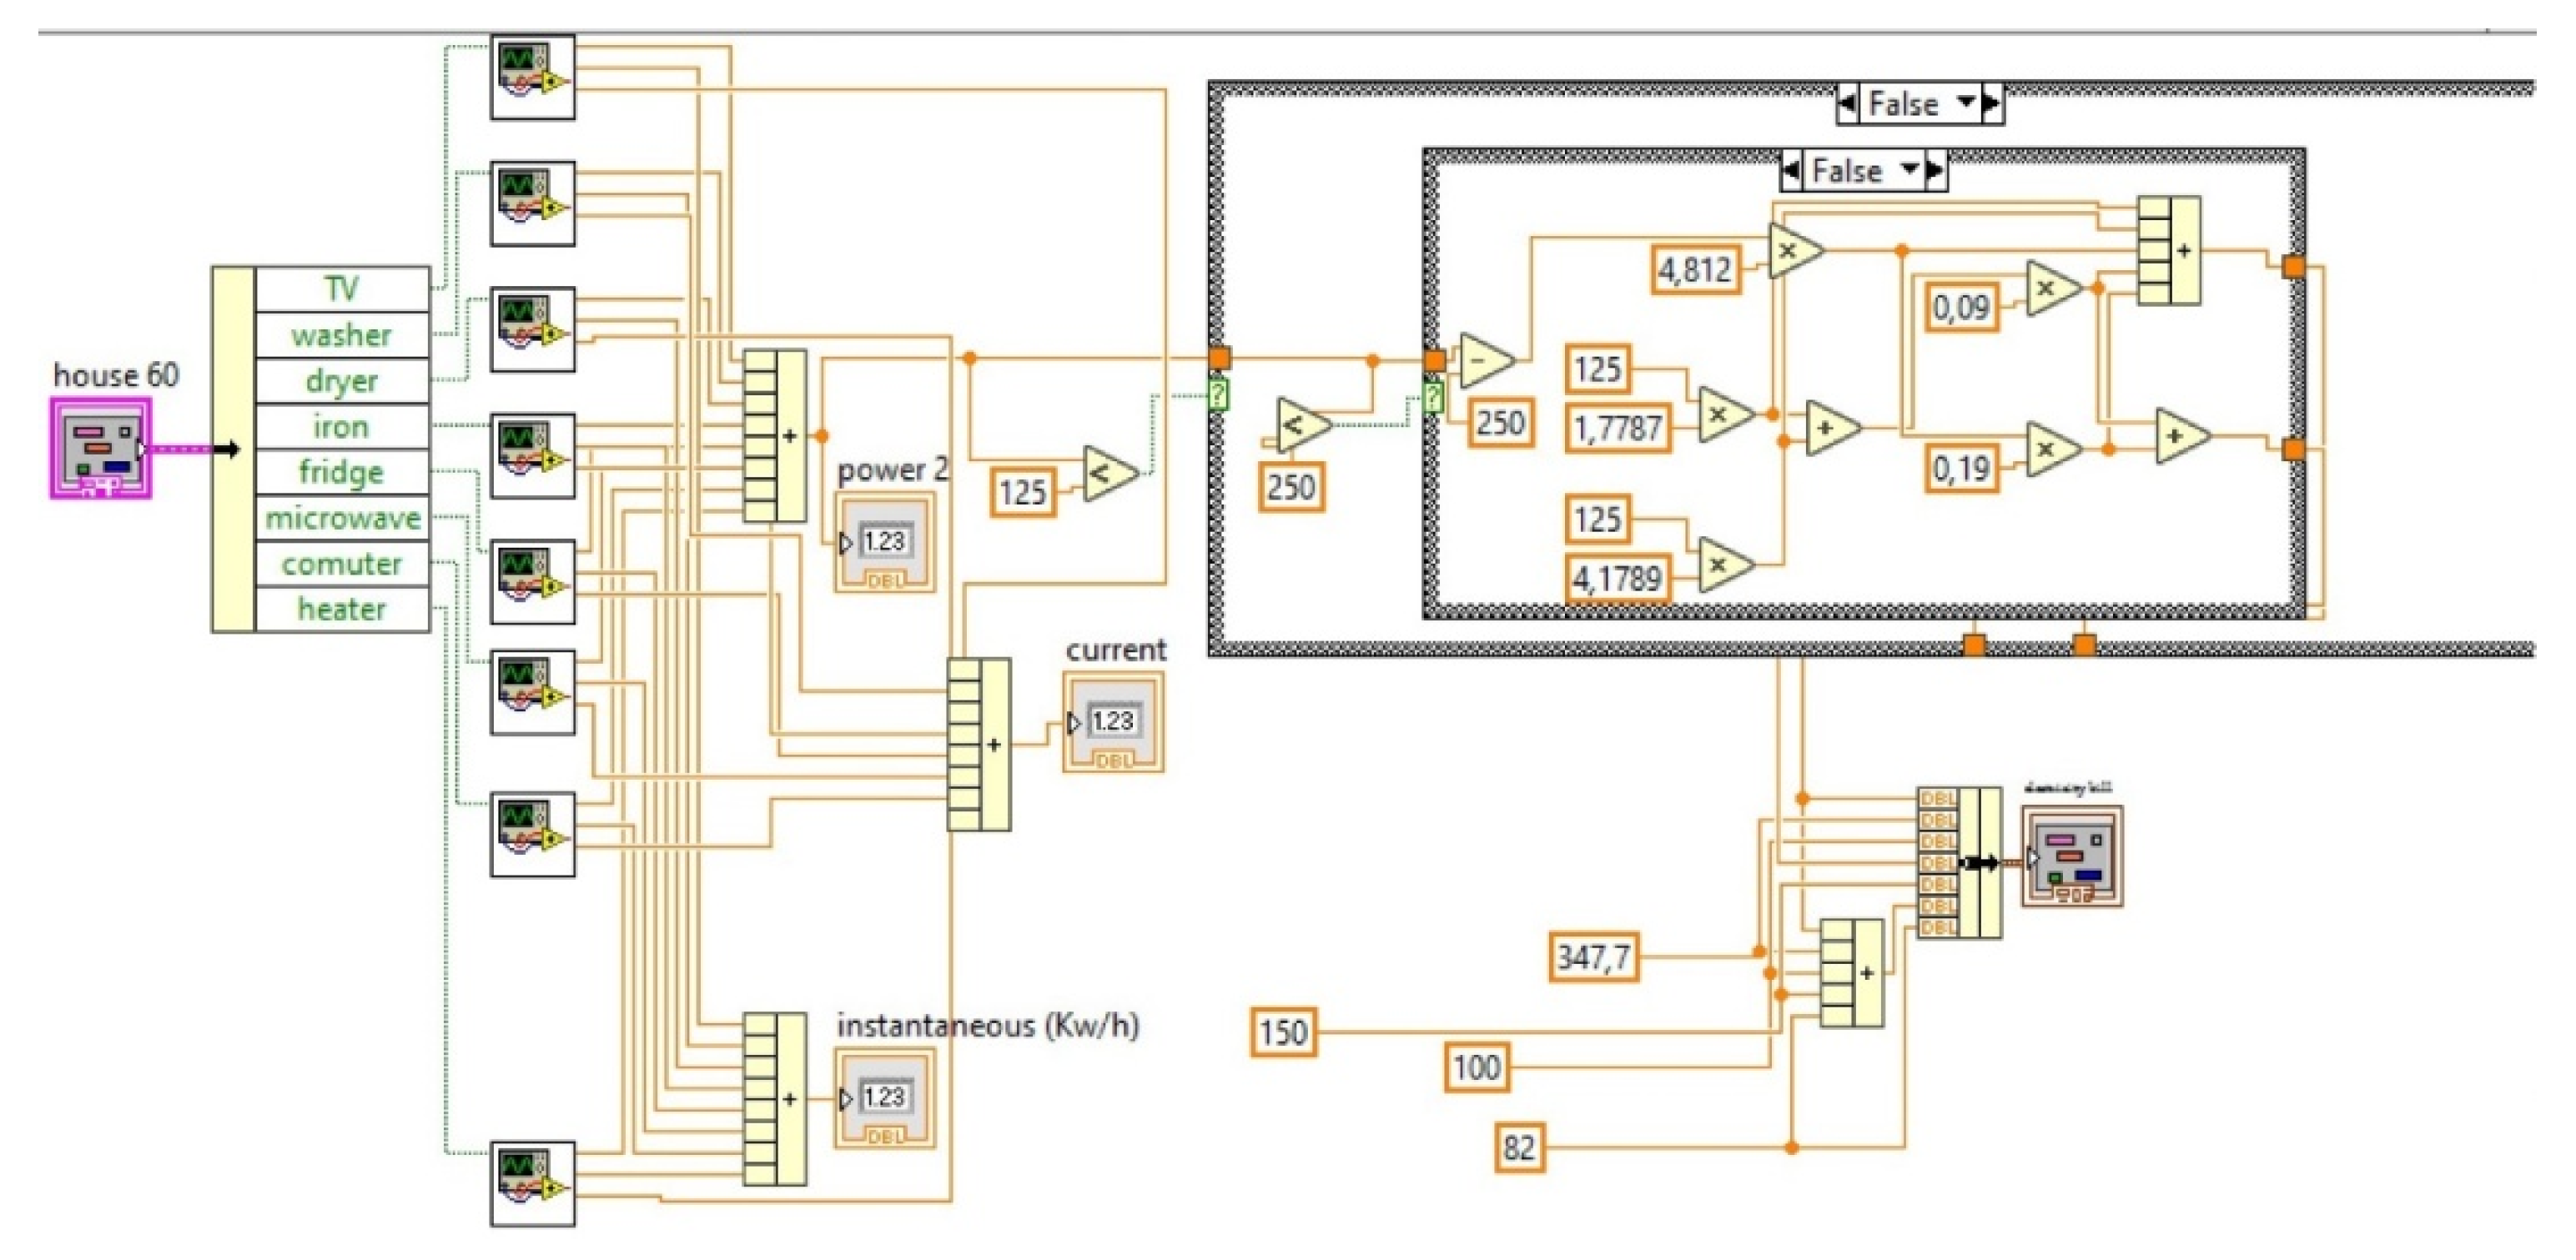
3.2. Simulation at One House Level

Figure 1 shows the appliances’ ON/OFF switches grouped in one cluster, the electricity bill that demonstrates the different fees, the price without fees and the total price, andthe house parameters outcomes such ascurrent, instantaneous power, accumulative power, apparent power, real power and power factor. Figure 2 presents the detailed block diagram for that house.In the block diagram, eight sub-VIs that simulate the eight house appliances, each with its own ON/OFF switch button are presented. The KWh consumed instantaneously and cumulatively, the current, the apparent power and real power of the all eight appliances outputs are added to obtain the total instantaneous power, the total cumulative power, the overall current, the total real power and the total apparent power. Then, the resultant total real power is divided over the total apparent power in order to obtain the power factor.

3.3. Proposed Pricing Policy for Power Quality Improvement

A penalty/incentive pricing policy is deployed with the objective of encouraging electricity consumers to provide devices that correct and eliminate the harmful power quality issues, along with shaping their consumption manners is such a way that respects the criteria of healthy electric grid. Four power quality issues are considered in this incentive/penalty policy. For the power factor, a poor power factor (below 90%) results in a 20% penalty (of the bill price) as an additional cost to be paid by the client, while no extra fees are applied if this power factor is within the limit (>90%). For the THD, if it is below 5%, a 20% incentive (deduced from the overall bill) applies. If the THD is more than 5% but less than 10%, a 30% penalty is charged for the user. If the THD exceeds 10%, a 50% penalty is applied. For the voltage sags and swells, a ±20% limit for a 220 V nominal value should not be exceeded. If the voltage falls below 209 or exceeds 231, a 50% penalty is applied, while no extra fees are charged if the voltage is confined in the interval [209–231]V.

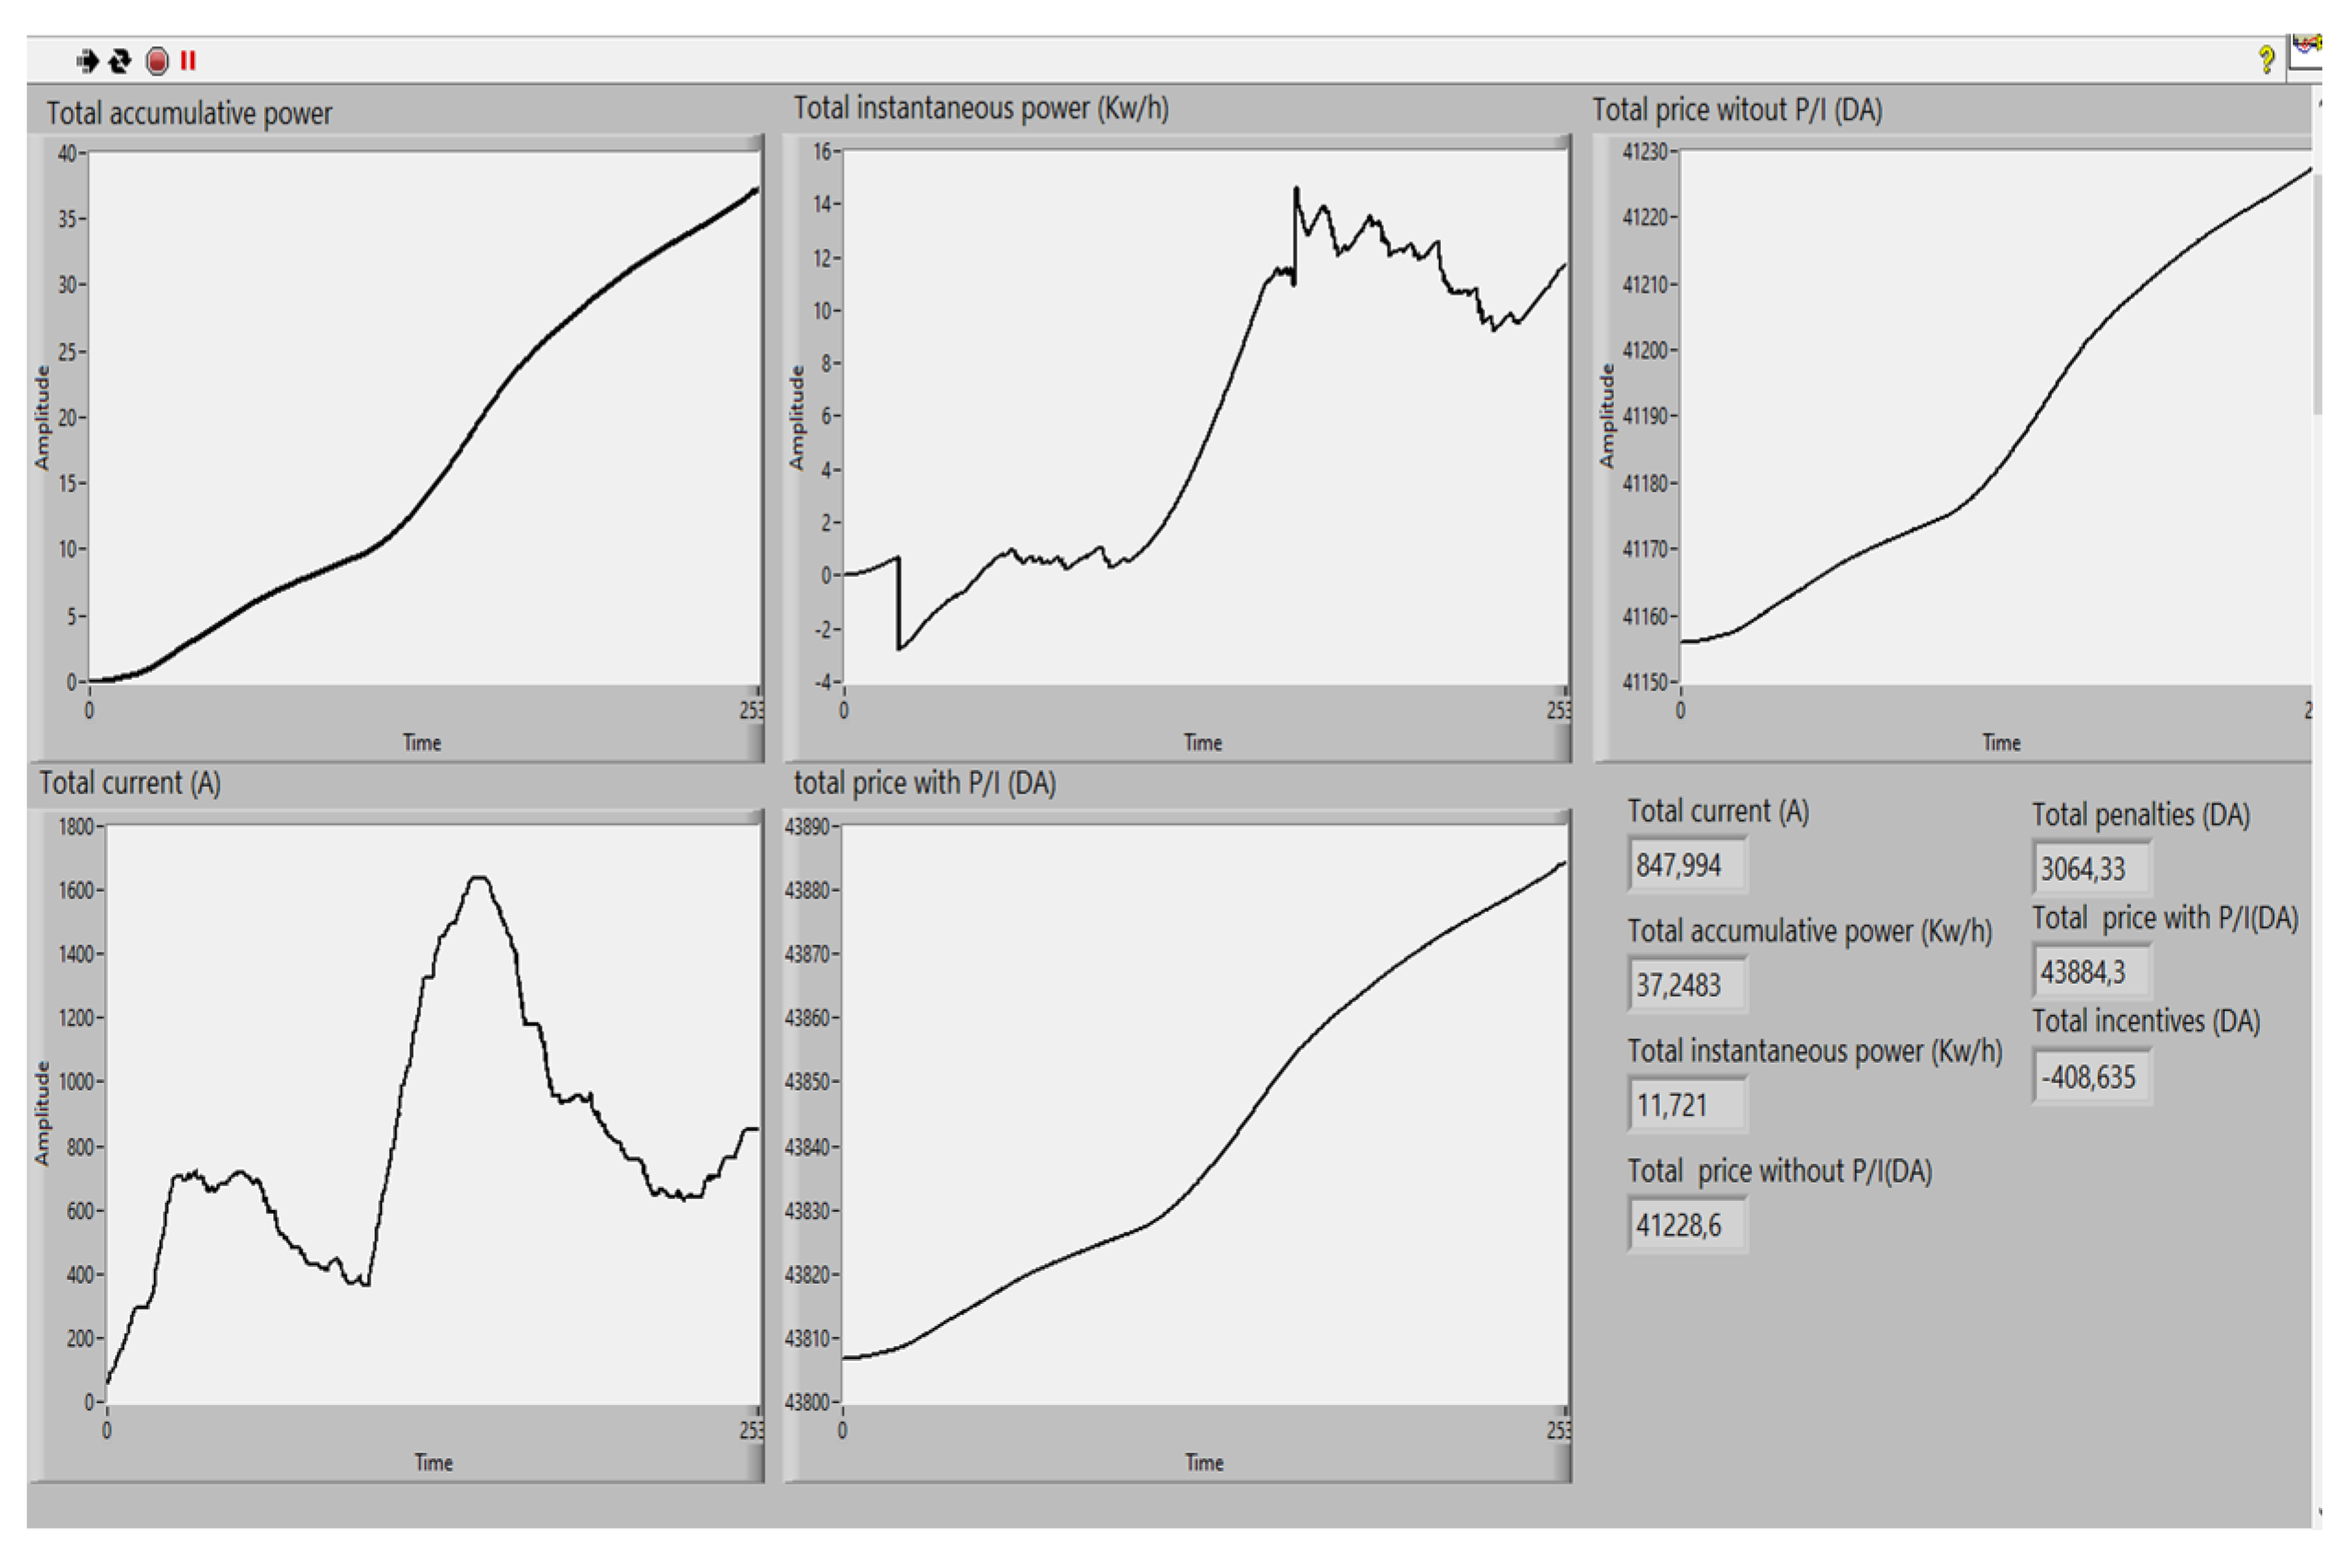
3.4. Results and Discussion

Figure 3 represents the front panel of the whole smart city that is composed of six sectors where each sector provided with two clusters: one that contains current and accumulative power numeric indicators of each house that is a part of the sector, and a second one that contains all the ON/OFF buttons of appliances of each house in the sector. There are three graphs for each sector with digital visual indicators: the total accumulative power consumption, the total instantaneous power consumption, and the total current of the sector. A numerical indicator provides the amount of money that the consumer is paying for the electrical company supplier for each sector and for the entire smart city, in addition to a graph with digital indicator of the sum of currents and instantaneous consumption power of all the six sectors.
Figure 4 represents the front panel of the smart city’s electrical grid that provides the cumulative and instantaneous power consumption, total current, total incentive prices, total penalties prices, total price with penalty/incentive, and total price without penalty/incentive. These are presented in both numerical indicators and using graphical representation. It is noticed that, duringthe peak hours, the total current reaches its largest values, which indicates that the demand on power has peaked due to the increase in the power consumption of the houses. At the end of the simulation, it has been observed that the amount of cumulative power and the total price without incentive/penalty were considerable. This can be explained by the effect of power quality issues that raised the voltage and the current, leading the power consumption to be increased, which means that the supplier is required to provide more power than the normal amount in order to satisfy the demand. It can be noticed that deploying the incentive and penalty pricing policy results in more money earned by the supplying company, which can be used to cover the additional expenses of the additional power and entice the faulty consumers to correct their PQ issues.
Figure 5 presents the front panel of the smart grid after the correction of the detected PQ problems. The total penalties are insignificant and the incentives are substantial, indicating that a large number of users have fixed their PQ problems. The peak power demand and the final accumulative power have been lowered compared to the values of the system with the power quality problems. This reduced the amount of additional power that is consumed with the existing PQ problems, resulting in a decrease in the utility company investments to produce more electricity. It is remarked that a slight difference exists between the total price with and without an incentive/penalty policy, which justifies its usefulness, as there is additional financial stress on the utility company.

4. Conclusions

In this paper, a simulation of a smart area with a mix of houses are affected by four kinds of power quality problems (voltage swell, voltage sag, poor power factor and harmonics) has been presented, along with some healthy houses. A pricing policy has been employed to cut down the effect of these problems by encouraging and raising awareness of consumers to adopt a healthy consumption behavior. The simulation results strengthened the basic idea that the pricing policy used by the supplier companies is not practical in the process of fixing power quality problems because it provides a strategy that urges clients to correct their PQ problems. The ordinary billing counts the excess of power resulting from PQ issues as an ordinary power with the same price as the consumed one. This policy has bad financial effects on both the utility company, which invests more money with the aim of generating excess power to satisfy the power demand, and the client, who pays for extra, unnecessary power.

Author Contributions

Conceptualization, F.Z.D. and A.R.; methodology, A.R.; software, F.Z.D.; validation, A.R.; formal analysis, F.Z.D.; investigation, A.R.; resources, F.Z.D.; data curation, F.Z.D.; writing—original draft preparation, F.Z.D.; writing—review and editing, A.R.; visualization, F.Z.D.; supervision, A.R.; project administration, A.R. All authors have read and agreed to the published version of the manuscript.

Funding

No external funding was received to carry out this research.

Institutional Review Board Statement

Not applicable.

Informed Consent Statement

Not applicable.

Data Availability Statement

The data presented in this study are available on request from the corresponding author. The data have been synthesized for the purpose of this study and are not publicly available.

Conflicts of Interest

No conflicts of interest are declared by the authors.

References

  1. Dekhandji, F.Z.; Talhaoui, S.; Arkab, Y. Power Quality Detection, Classification and Monitoring Using LABVIEW. Alger. J. Signals Syst. 2019, 4, 101–111. [Google Scholar] [CrossRef]
  2. Dekhandji, F.Z.; Rais, M.C. A Comparative Study of Power Quality Monitoring Using Various Techniques. In Optimizing and Measuring Smart Grid Operation and Control; IGI Global: Hershey, PA, USA, 2021; pp. 259–288. [Google Scholar]
  3. Dekhandji, F.Z. Detection and mitigation of power quality problems based on phasor measurment units and renewable energy systems. In Proceedings of the 3rd International Conference on Computational and Experimental Science and Engineering (ICCESEN 2016), Antalya, Turkey, 19–24 October 2016. [Google Scholar]
  4. Dekhandji, F.Z.; Douche, M.; Zebidi, N. DVR and D-STATCOM Mitigation Techniques of Power Quality Effects on Induction Motors. Alger. J. Signals Syst. 2017, 2, 110–129. [Google Scholar] [CrossRef]
  5. Chattopadhyay, S.; Mitra, M.; Sengupta, S. Electric power quality. In Electric Power Quality; Chattopadhyay, S., Mitra, M., Sengupta, S., Eds.; Springer: Dordrecht, The Netherlands, 2011; pp. 5–12. [Google Scholar]
  6. Kappagantu, R.; Daniel, S.A.; Yadav, A. Power quality analysis of smart grid pilot project, Puducherry. Procedia Technol. 2015, 21, 560–568. [Google Scholar] [CrossRef] [Green Version]
  7. Moses, P.S.; Deilami, S.; Masoum, A.S.; Masoum, M.A. Power quality of smart grids with plug-in electric vehicles considering battery charging profile. In Proceedings of the IEEE PES Innovative Smart Grid Technologies Conference Europe (ISGT Europe), Gothenberg, Sweden, 11–13 October 2010; pp. 1–7. [Google Scholar]
  8. Niitsoo, J.; Jarkovoi, M.; Taklaja, P.; Klüss, J.; Palu, I. Power quality issues concerning photovoltaic generation and electrical vehicle loads in distribution grids. Smart Grid Renew. Energy 2015, 6, 164. [Google Scholar]
  9. Balwani, M.R.; Thirumala, K.; Mohan, V.; Bu, S.; Thomas, M.S. Development of a Smart Meter for Power Quality-Based Tariff Implementation in a Smart Grid. Energies 2021, 14, 6171. [Google Scholar] [CrossRef]
  10. Viciana, E.; Alcayde, A.; Gil Montoya, F.; Baños, R.; Arrabal-Campos, F.M.; Zapata-Sierra, A.; Manzano-Agugliaro, F. OpenZmeter: An Efficient Low-Cost Energy Smart Meter and Power Quality Analyzer. Sustainability 2018, 10, 4038. [Google Scholar] [CrossRef] [Green Version]
  11. Da Silva, R.P.B.; Quadros, R.; Shaker, H.R.; da Silva, L.C.P. Effects of mixed electronic loads on the electrical energy systems considering different loading conditions with focus on power quality and billing issues. Appl. Energy. 2020, 277, 115558. [Google Scholar] [CrossRef]
  12. ACER European Union Agency for the Cooperation of Energy Regulatory. ACER Report on Distribution Tariff Methodologies in Europe. February 2021. Available online: https://documents.acer.europa.eu/Official_documents/Acts_of_the_Agency/Publication/ACER%20Report%20on%20D-Tariff%20Methodologies.pdf (accessed on 1 June 2022).
  13. Bućko, P.; Wilczyński, A. Reactive Energy Billing in Operator Tariffs in Poland. Acta Energetica 2015, 4, 4–9. [Google Scholar] [CrossRef]
  14. Ahmad, A.; Kashif, S.A.R.; Saqib, M.A.; Ashraf, A.; Shami, U.T. Tariff for reactive energy consumption in household appliances. Energy 2019, 186, 115818. [Google Scholar] [CrossRef]
  15. Jay, D.; Swarup, K.S. Game theoretical approach to novel reactive power ancillary service market mechanism. IEEE Trans. Power Syst. 2020, 36, 1298–1308. [Google Scholar] [CrossRef]
  16. Cerbantes, M.C.; Fernandez-Blanco, R.; Ortega-Vazquez, M.A.; Mantovani, J.R.S. Incorporating a Nodal Reactive Power Pricing Scheme Into the DisCo’s Short-Term Operation. IEEE Trans. Smart Grid 2018, 10, 3720–3731. [Google Scholar] [CrossRef]
  17. Chang, T.Y.; Wang, Y.; Sun, H.J. The Design of Smart Meter with Power Quality Monitoring. Electr. Meas. Instrum. 2012, 49, 74–77. [Google Scholar]
  18. Ramos, N.R.; Pereira, P.; Martins, J. Smart-meter in power quality. In Proceedings of the 2017 International Young Engineers Forum (YEF-ECE), Costa da Caparica, Portugal, 5 May 2017; Institute of Electrical and Electronics Engineers (IEEE): New York, NY, USA, 2017; pp. 42–46. [Google Scholar]
  19. Das, H.; Saikia, L. Ethernet based smart energy meter for power quality monitoring and enhancement. In Proceedings of the 2017 Recent Developments in Control, Automation & Power Engineering (RDCAPE), Noida, Indi, 26–27 October 2017; Institute of Electrical and Electronics Engineers (IEEE): New York, NY, USA, 2017; pp. 187–191. [Google Scholar]
  20. Madhu, G.M.; Vyjayanthi, C.; Modi, C.N. Design and Development of a Novel IoT based Smart Meter for Power Quality Monitoring in Smart Grid Infrastructure. In Proceedings of the TENCON 2019 IEEE Region 10 Conference (TENCON), Kochi, India, 17–20 October 2019; pp. 2204–2209. [Google Scholar]
  21. Castello, P.; Muscas, C.; Pegoraro, P.A.; Sulis, S. Low-Cost Energy Meter with Power Quality Functionalities. In Proceedings of the 24th Imeko TC, 2020; Available online: https://www.imeko.org/publications/tc4-2020/IMEKO-TC4-2020-56.pdf (accessed on 1 June 2022).
  22. Medvedr, D.; Conka, Z.; Kolcun, M.; Kanalik, M.; Zbojovsky, J.; Pavlik, M. Project design of the electric power quality analyzer using an open-source platform. In Proceedings of the 2018 International IEEE Conference and Workshop in Óbuda on Electrical and Power Engineering (CANDO-EPE), Budapest, Hungary, 20–21 November 2018; pp. 000169–000172. [Google Scholar]
  23. Amankhan, A.; Kural, A.; Temirbek, I.; Abukhan, A.; Mukashov, D.; Azamat, A.; Kudaibergenov, K.; Bagheri, M. Multi-functional Smart Electricity Metering System. In Proceedings of the 2019 IEEE International Conference on Environment and Electrical Engineering and 2019 IEEE Industrial and Commercial Power Systems Europe (EEEIC/I&CPS Europe), Genova, Italy, 11–14 June 2019; pp. 1–6. [Google Scholar]
  24. Xavier, M.V.E.; Boaventura, W.D.C.; Noronha, M.D. High performance power quality monitoring system. In Proceedings of the 2016 17th International Conference on Harmonics and Quality of Power (ICHQP), Belo Horizonte, Brazil, 16–19 October 2016; pp. 974–979. [Google Scholar]
  25. Arenas, L.D.O.; Melo, G.D.A.E.; Canesin, C.A. A Methodology for Power Quantities Calculation Applied to an FPGA-Based Smart-Energy Meter. IEEE Trans. Instrum. Meas. 2021, 70, 1–11. [Google Scholar] [CrossRef]
  26. Dekhandji, F.Z. Signal Processing Deployment in Power Quality Disturbance Detection and Classification. Acta Phys. Pol. A 2017, 132, 415–419. [Google Scholar] [CrossRef]
  27. Arrillaga, J.; Watson, N.R.; Chen, S. Power System Quality Assessment. 1.2 Disturbances; Wiley-Blackwell: Hoboken, NJ, USA, 2000. [Google Scholar]
  28. De Almeida, A.; Moreira, L.; Delgado, J. Power quality problems and new solutions. Int. Conf. Renew. Energies Power Quality 2003, 3, 1–45. [Google Scholar] [CrossRef]
  29. Bingham, R.P. Sags and Swells. Original Draft September 1994. Revised 16 February 1998. Available online: http://www.northwoodpower.ca/technicaldocuments/sags-and-swells.pdf (accessed on 1 June 2022).
  30. Unit V: Energy, Economic and Environmental Issues of Power Plants. Available online: https://stannescet.ac.in/cms/staff/qbank/EEE/Notes (accessed on 1 June 2022).
  31. Price, M.; Allmeroth, T.; Cleveland, M.; Regenwether, J. Implementing Dynamic Pricing Meter Configuration Trade-Offs; Deloitte Development LLC: Tirana, Albania, 2012. [Google Scholar]
  32. Dekhandji, F.Z.; Recioui, A. An Investigation into Pricing Policies in Smart Grids. Eng. Proc. 2022, 14, 15. [Google Scholar] [CrossRef]
  33. Dassa, K.; Recioui, A. Application of Optimization to Sizing Renewable Energy Systems and Energy Management in Microgrids: State of the Art and Trends. In Applications of Nature-Inspired Computing in Renewable Energy Systems; IGI Global: Hershey, PA, USA, 2022; pp. 60–94. [Google Scholar]
  34. Meehan, P.; McArdle, C.; Daniels, S. An Efficient, Scalable Time-Frequency Method for Tracking Energy Usage of Domestic Appliances Using a Two-Step Classification Algorithm. Energies 2014, 7, 7041–7066. [Google Scholar] [CrossRef]
  35. Mukherjee, S.; Ganguly, A.; Paul, A.K.; Kumar Datta, A. Load Flow Analysis and Reactive Power Compensation. In Proceedings of the 2018 International Conference on Computing, Power and Communication Technologies (GUCON), Greater Noida, India, 28–29 September 2018; pp. 207–211. [Google Scholar]
Figure 1. Front panel of house 01.
Engproc 29 00015 g001
Figure 2. House 01 block diagram.
Engproc 29 00015 g002
Figure 3. Front panel of the simulated smart city.
Engproc 29 00015 g003
Figure 4. Front panel of smart grid with problems at the end of the simulation.
Engproc 29 00015 g004
Figure 5. Front panel of smart grid after PQ problems correction at the end of simulation.
Engproc 29 00015 g005
Table 1. List of appliances’ estimated wattage.
Common AppliancesEstimated Wattage
TV 42″ Plasma240
Washing Machine500–1000
Hair Dryer1000–1875
Clothes Iron1000–1500
Refrigerator500–750
Microwave Oven1000–2000
Computer Laptop 20–75
Space Heater750/1500
Disclaimer/Publisher’s Note: The statements, opinions and data contained in all publications are solely those of the individual author(s) and contributor(s) and not of MDPI and/or the editor(s). MDPI and/or the editor(s) disclaim responsibility for any injury to people or property resulting from any ideas, methods, instructions or products referred to in the content.

