Proceeding Paper

Polarimetric Distortion Analysis of L- and S-Band Airborne SAR (LS-ASAR): A Precursor Study of the Spaceborne Dual-Frequency L- and S-Band NASA ISRO Synthetic Aperture Radar (NISAR) Mission †

Indian Institute of Remote Sensing (IIRS), ISRO, Dehradun, India
Presented at the 9th International Electronic Conference on Sensors and Applications, 1–15 November 2022; Available online: https://ecsa-9.sciforum.net/.
Eng. Proc. 2022, 27(1), 77; https://doi.org/10.3390/ecsa-9-13186
Published: 1 November 2022

Abstract

:
The polarimetric calibration (PolCal) is an essential process to ensure the minimization of distortions from airborne and spaceborne SAR data for scattering-based characterization of the targeted objects. The present study investigates the polarimetric distortions in the L-and S-band airborne dual-frequency SAR data. The L- and S-band airborne SAR (LS-ASAR) is a precursor mission of the spaceborne dual-frequency L- and S-band NASA ISRO Synthetic Aperture Radar (NISAR). The present work utilizes the LS-ASAR data acquired over the Rosamond Corner Reflector Array (RCRA). The polarimetric signature analysis of co-pol and cross-pol channels shows that perfect behavior is shown by the co-pol signature but the distortions could be easily identified in the cross-pol signatures.
Keywords:
PolCal; LS-ASAR; NISAR; RCRA

1. Introduction

The polarimetric distortions impact the PolSAR scattering-based identification and geophysical parameters characterization of the ground targets [1,2,3]. These distortions may result in overestimation and/or underestimation of scattering elements after polarimetric decomposition modeling that may lead to an error in any PolSAR model-based geophysical/biophysical parameters retrieval [4,5,6,7]. The prime objective of this research is polarimetric distortion analysis between co- and cross-polarimetric channels of L-band and S-band airborne SAR (LS-ASAR), which is a precursor study of the spaceborne dual-frequency L- and S-band NASA ISRO Synthetic Aperture Radar (NISAR) mission.

2. Study Area and Data

The L- and S-band data of the Rosamond Corner Reflector Array (RCRA) are used in this study to analyze the polarimetric signatures of the five 4.8-m corner reflectors (CRs). Figure 1 shows the presence and locations of five corner reflectors (CRs) in the HH-polarization of the L- and S-band SAR data and these CRs are circled in red and represented in yellow text. The LS-ASAR data over RCRA were acquired on 4 December 2019, and the corner reflectors were mounted accordingly to fulfill the calibration requirement. A detailed data description is provided in Table 1.

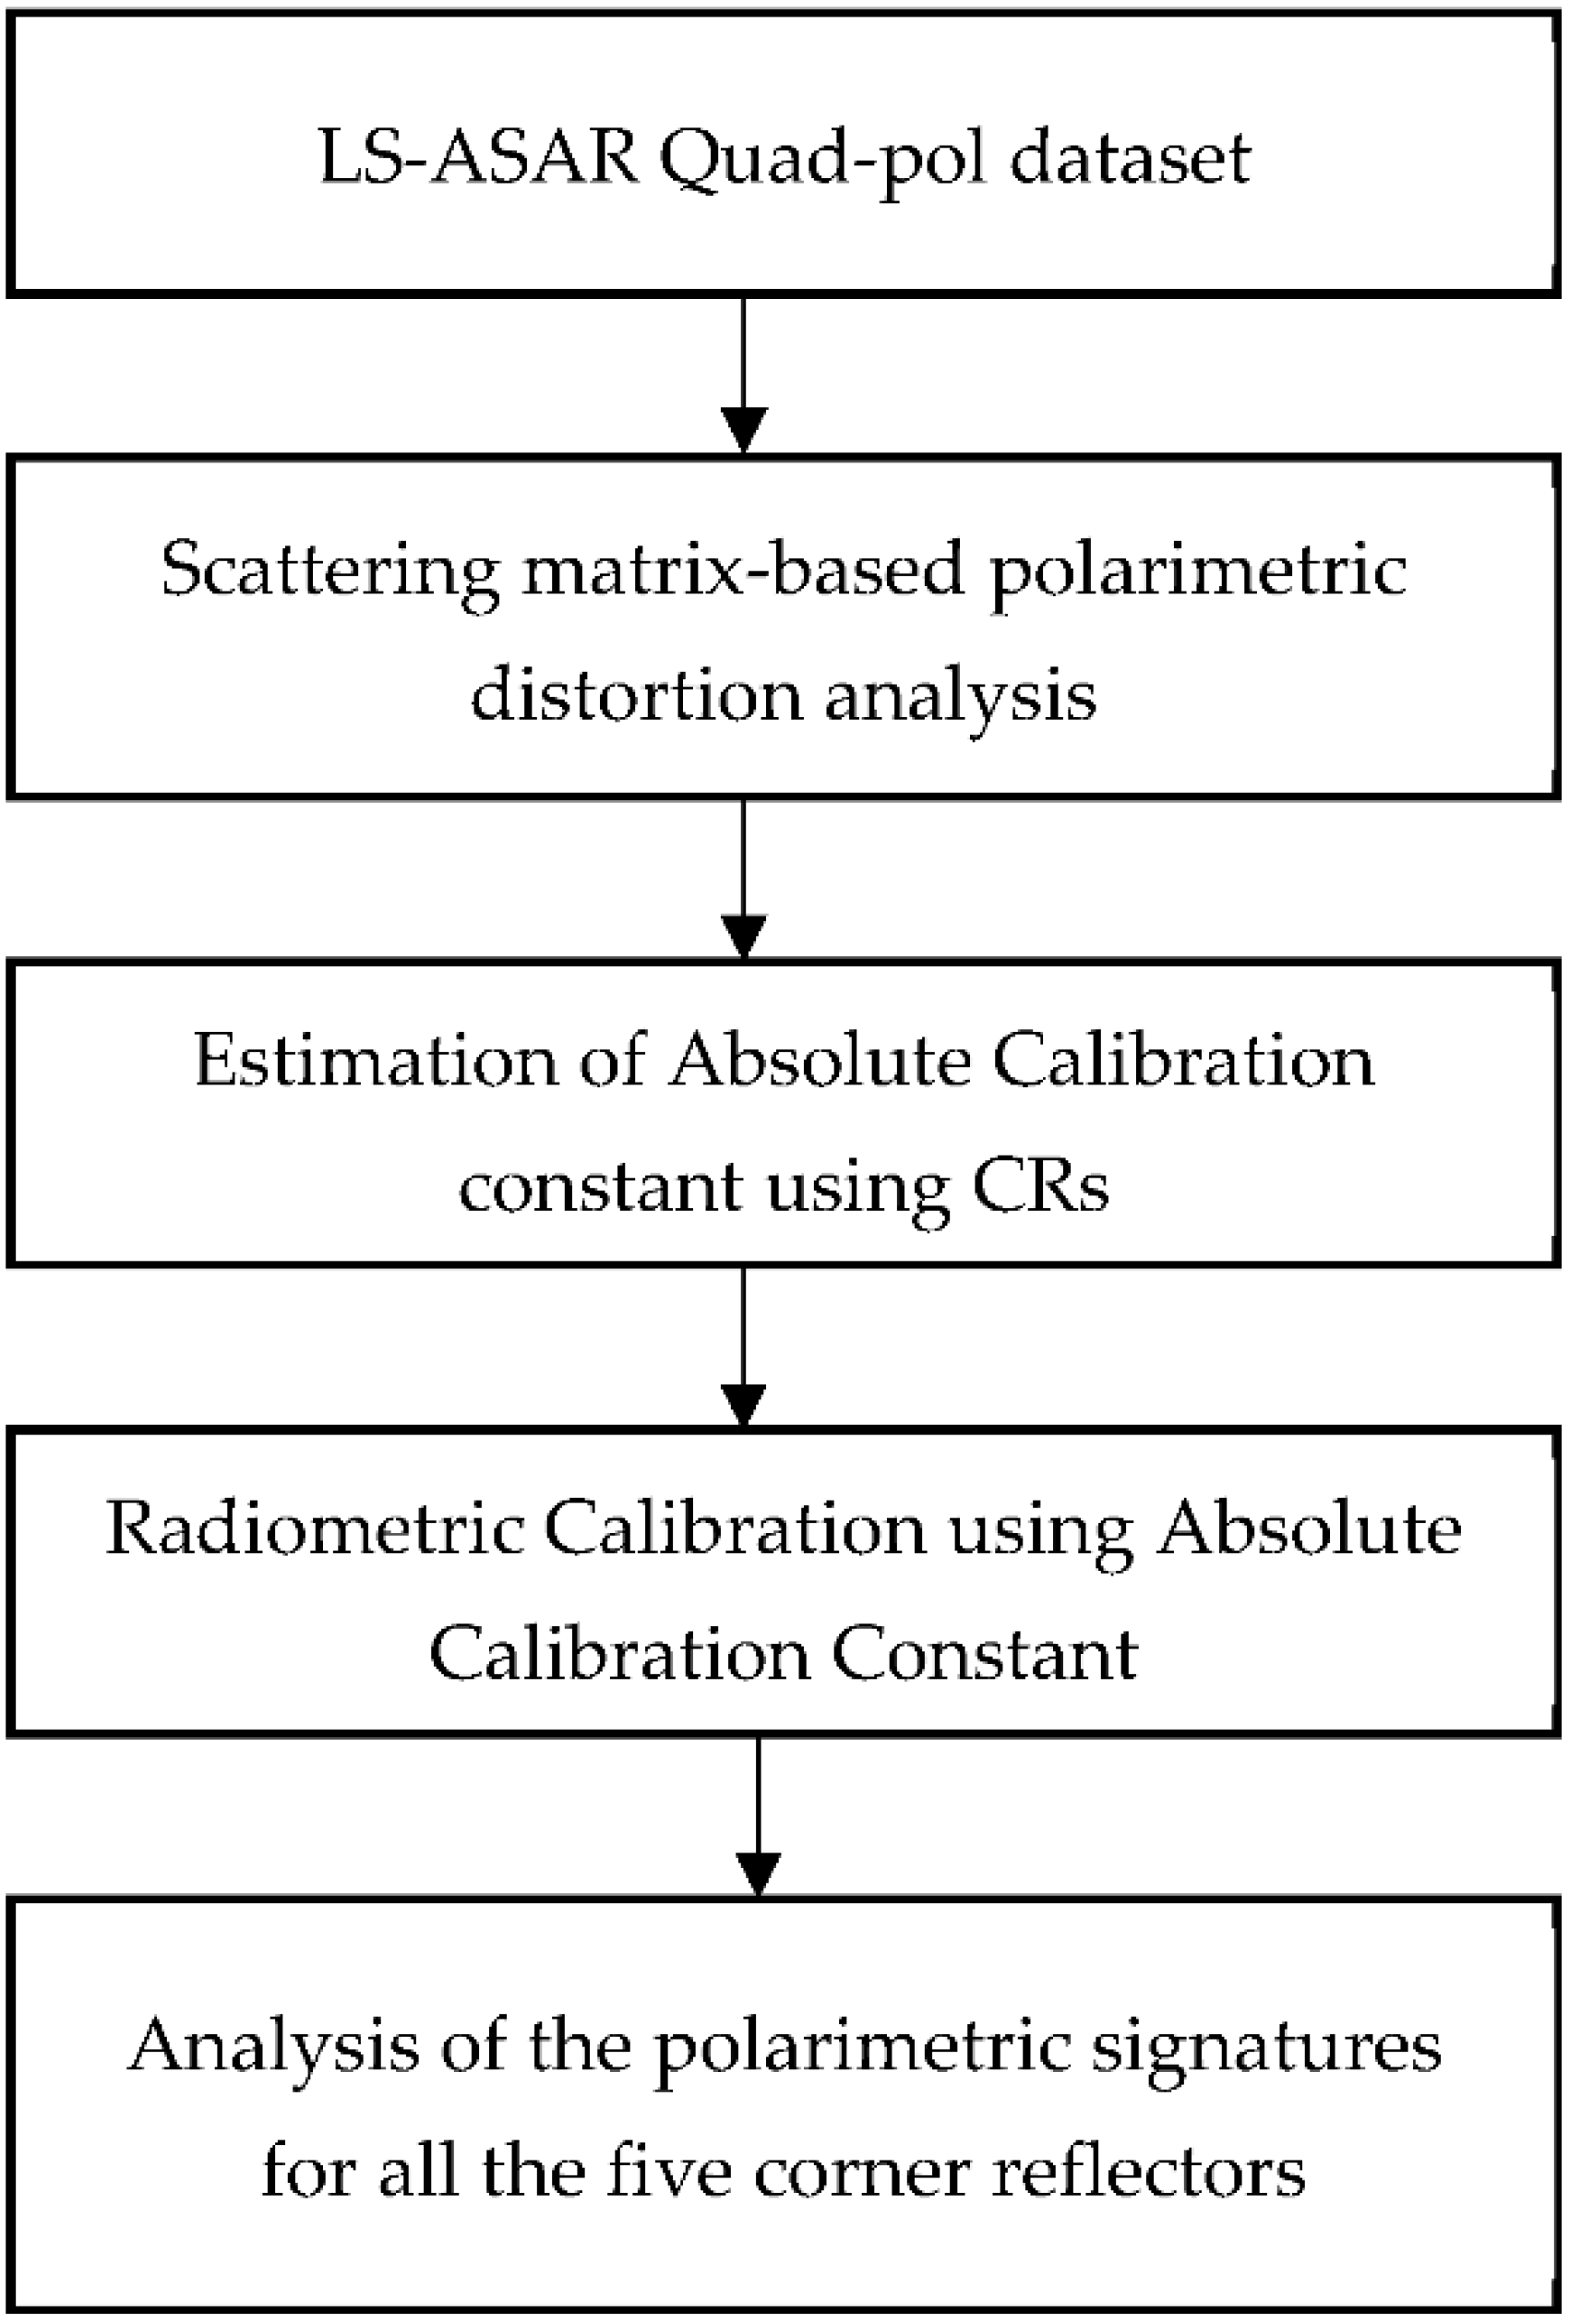
3. Section Methodology of the Polarimetric Analysis

The methodological flow diagram shown in Figure 2 provides the steps for the polarimetric distortion analysis between co-polar and cross-polar channels of L-and S-band Airborne SAR data. The first step of the analysis was performed with the correlation between cross-pol and co-pol channels of the scattering matrix. Next, the absolute calibration constant was measured with the help of the theoretical radar cross-section (RCS) [1,2,4,5]. The LS-ASAR data were radiometrically calibrated with the absolute calibration constant for the polarimetric signature-based analysis.

4. Results and Discussions

The results obtained from scattering matrix-based and polarimetric signature-based analysis for the polarimetric distortions in the L-and S-band airborne SAR data are assessed in this section.

4.1. Scattering Matrix-Based Polarimetric Distortion Analysis

The scatterplots between cross-pol and co-pol channels of the L-band S-band SAR data were plotted to evaluate the reciprocity condition for monostatic SAR systems. Figure 3 shows the scatterplot between co-pol and cross-pol channels of L-band SAR data. The co-pol channel’s scatterplot (Figure 3a) is plotted by keeping the HH channel at the horizontal axis and the VV channel at the vertical axis. In the scatterplot for cross-pol channels, HV polarization is chosen as the horizontal axis and VH as the vertical axis. It is visible in Figure 3a that HH and VV are not identical and that they do not carry the same information. The cross-polarimetric channels HV and VH are carrying the same and equal information that is an essential requirement for the reciprocity assumption of a monostatic SAR system.
Figure 4 shows the correlation scatterplot analysis of co-pol and cross-pol channels of S-band SAR data. It is visible in Figure 4a that co-pol channels HH and VV of S-band SAR data are not equal and they do not carry the same information. The S-band SAR system also follows the reciprocity assumption similar to the L-band SAR system. The reciprocity assumption of the monostatic S-band SAR system is evident in Figure 4b which shows the equal and same information carried by both the cross-pol channels to make them equal (HV=VH). From Figure 3 and Figure 4, it is confirmed that both the SAR sensors follow the monostatic reciprocity assumptions.

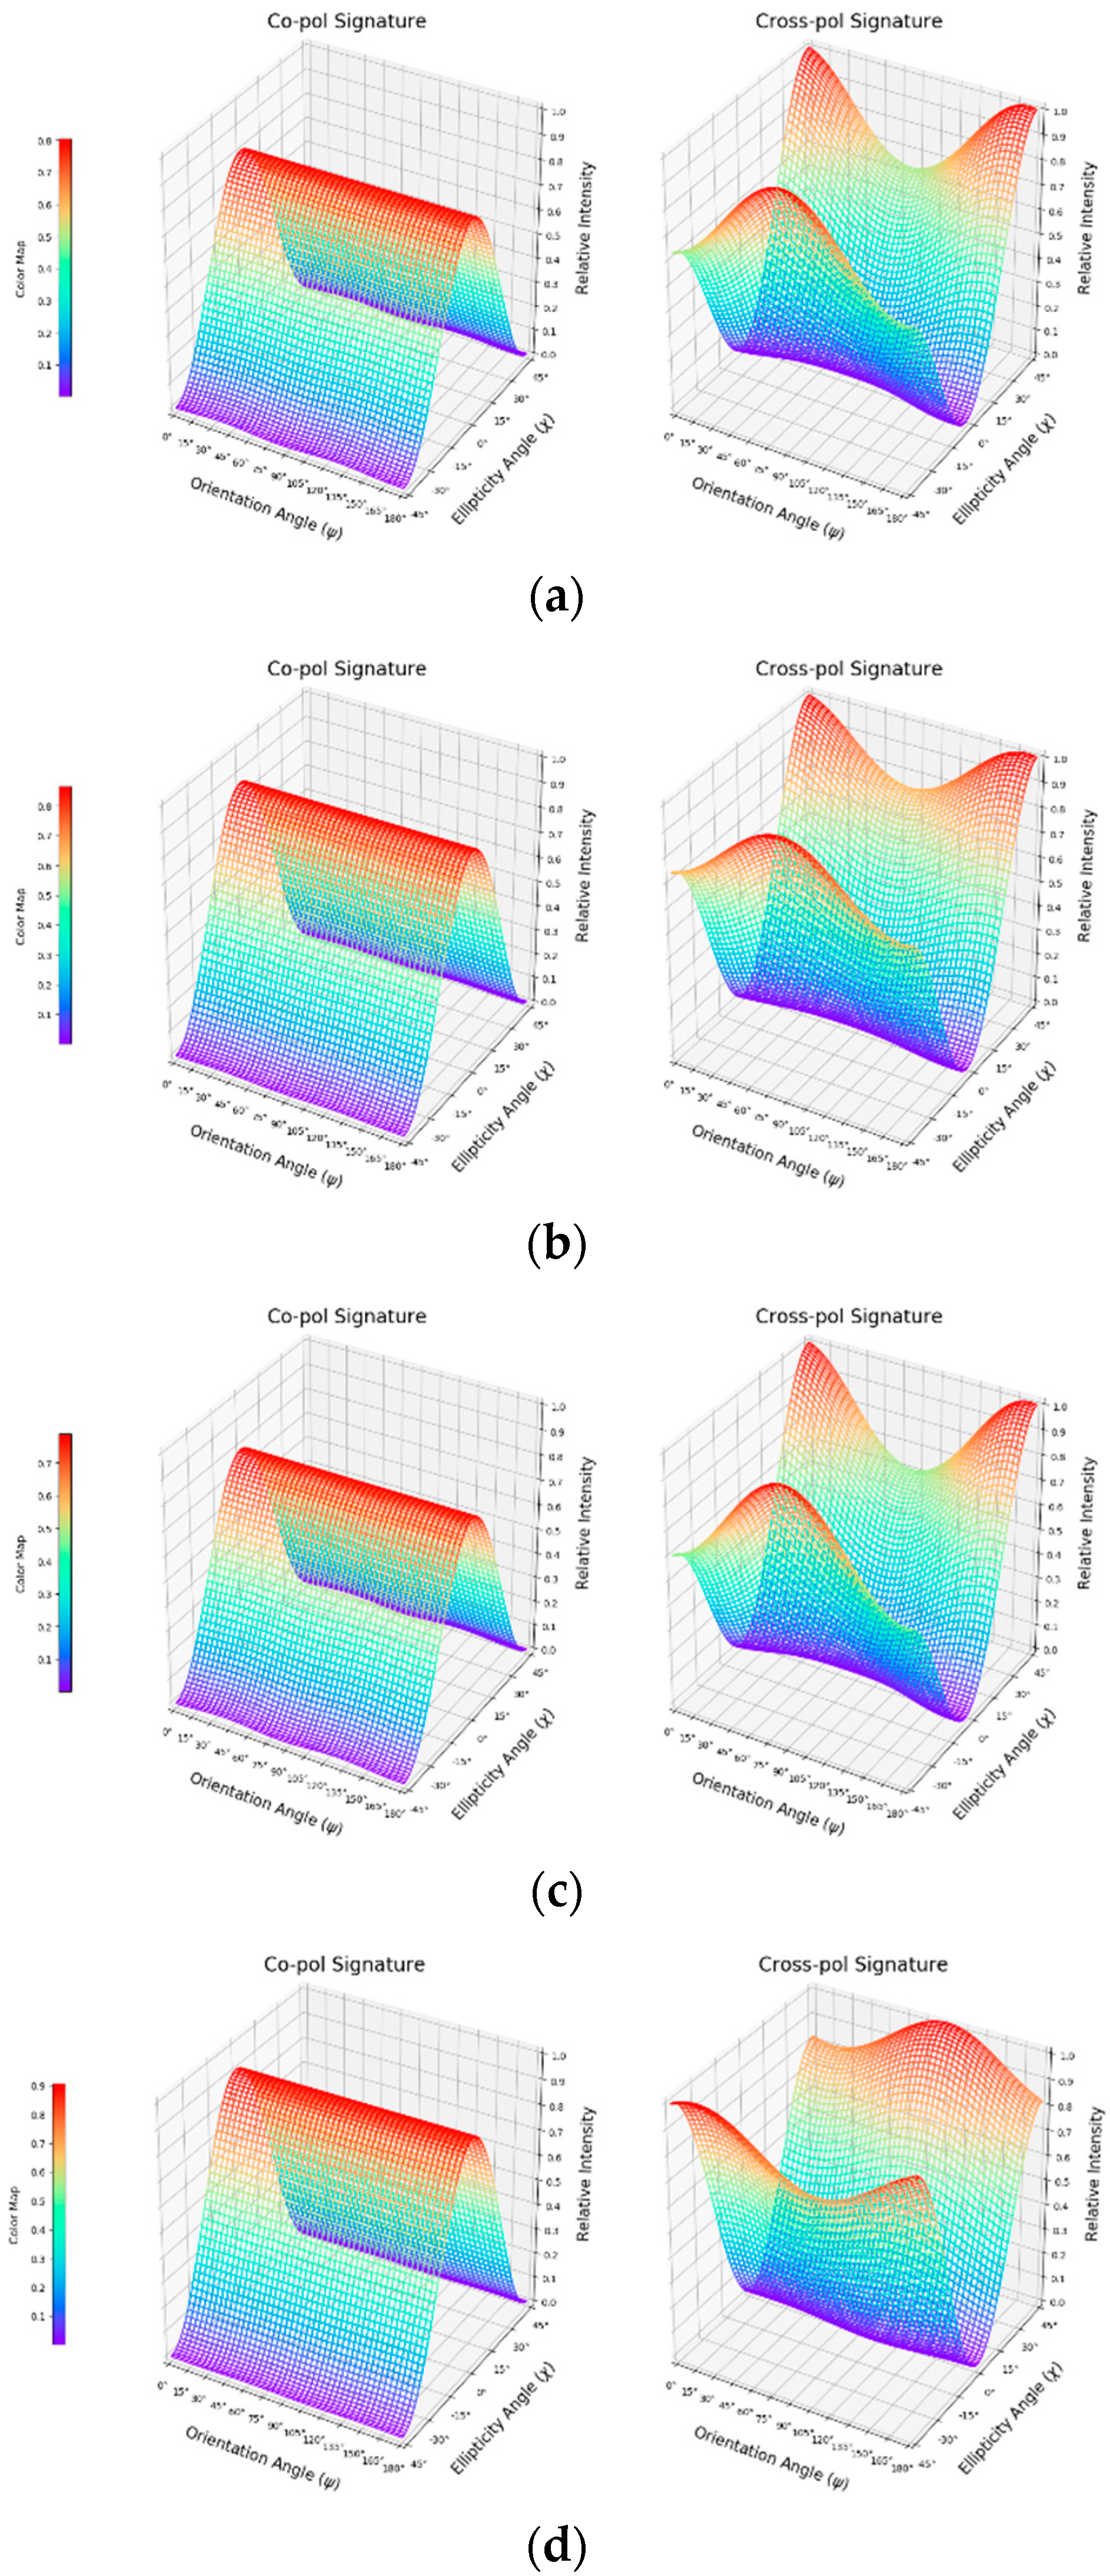
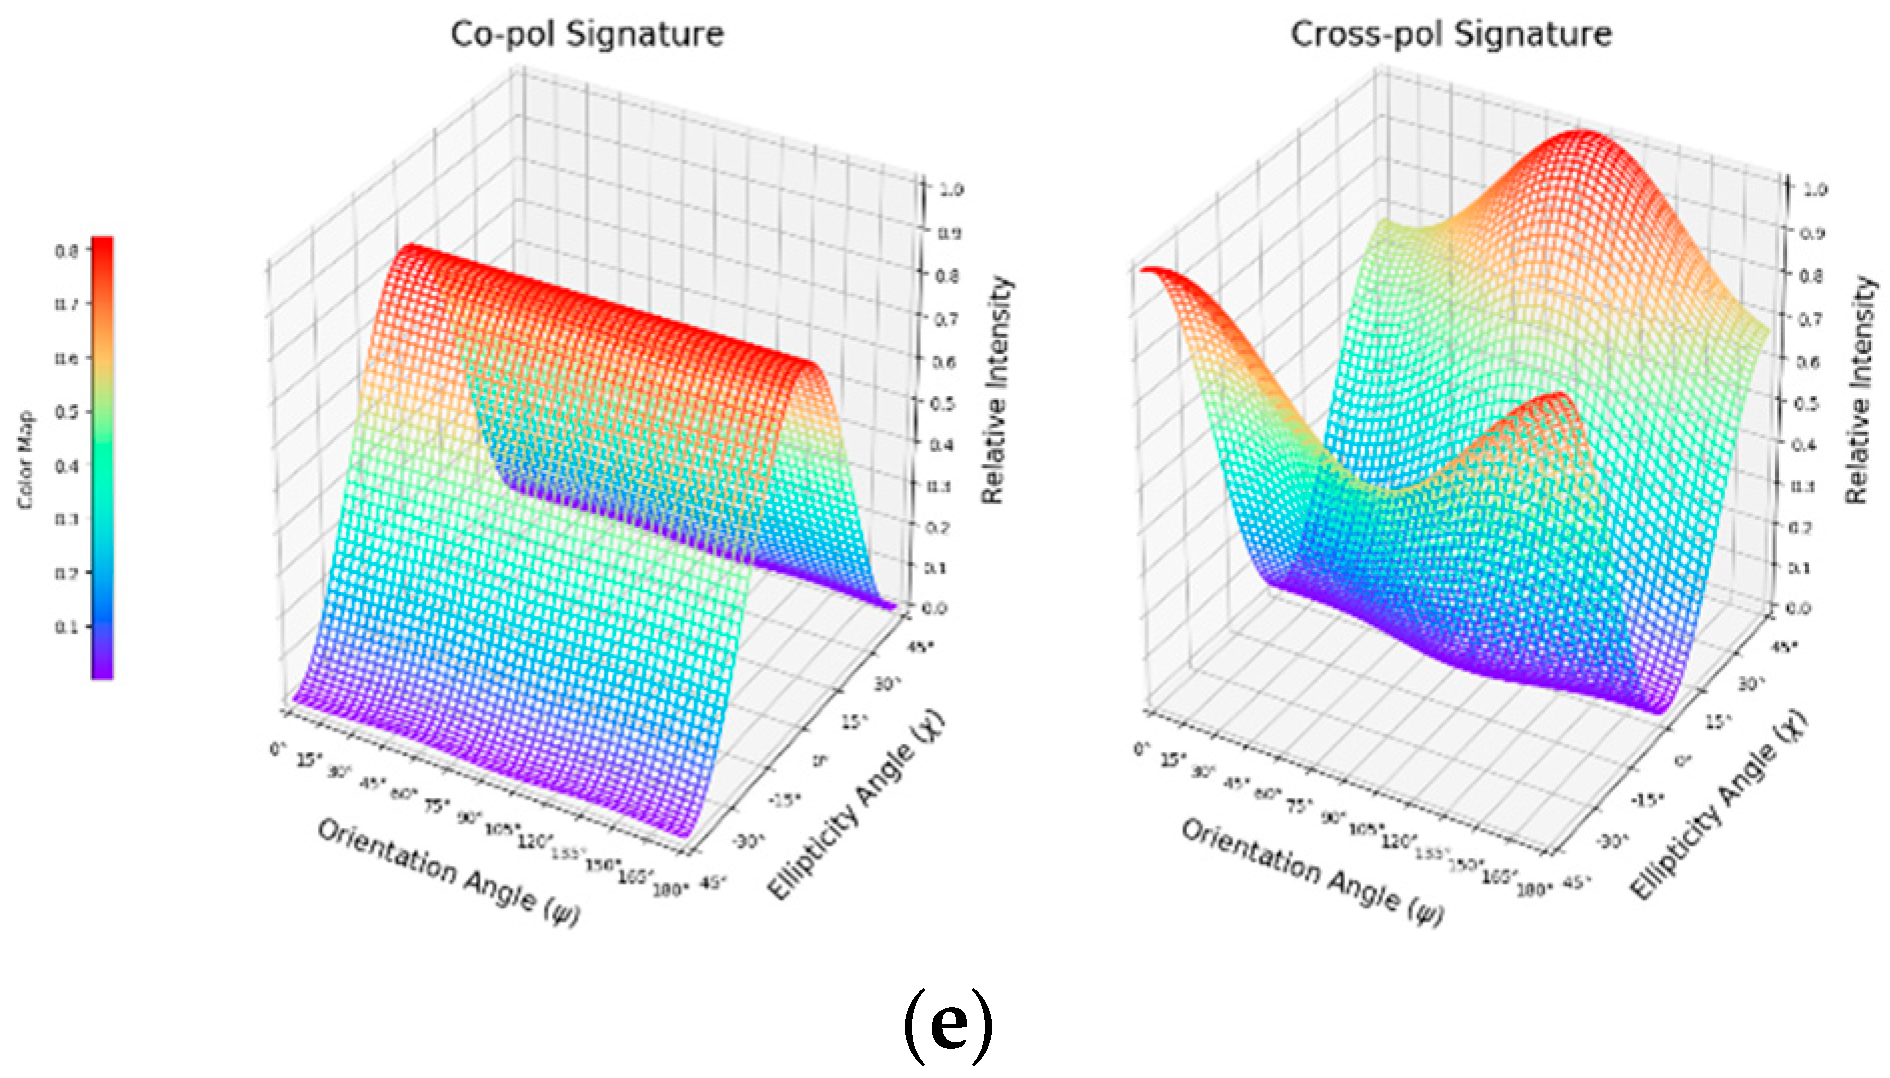
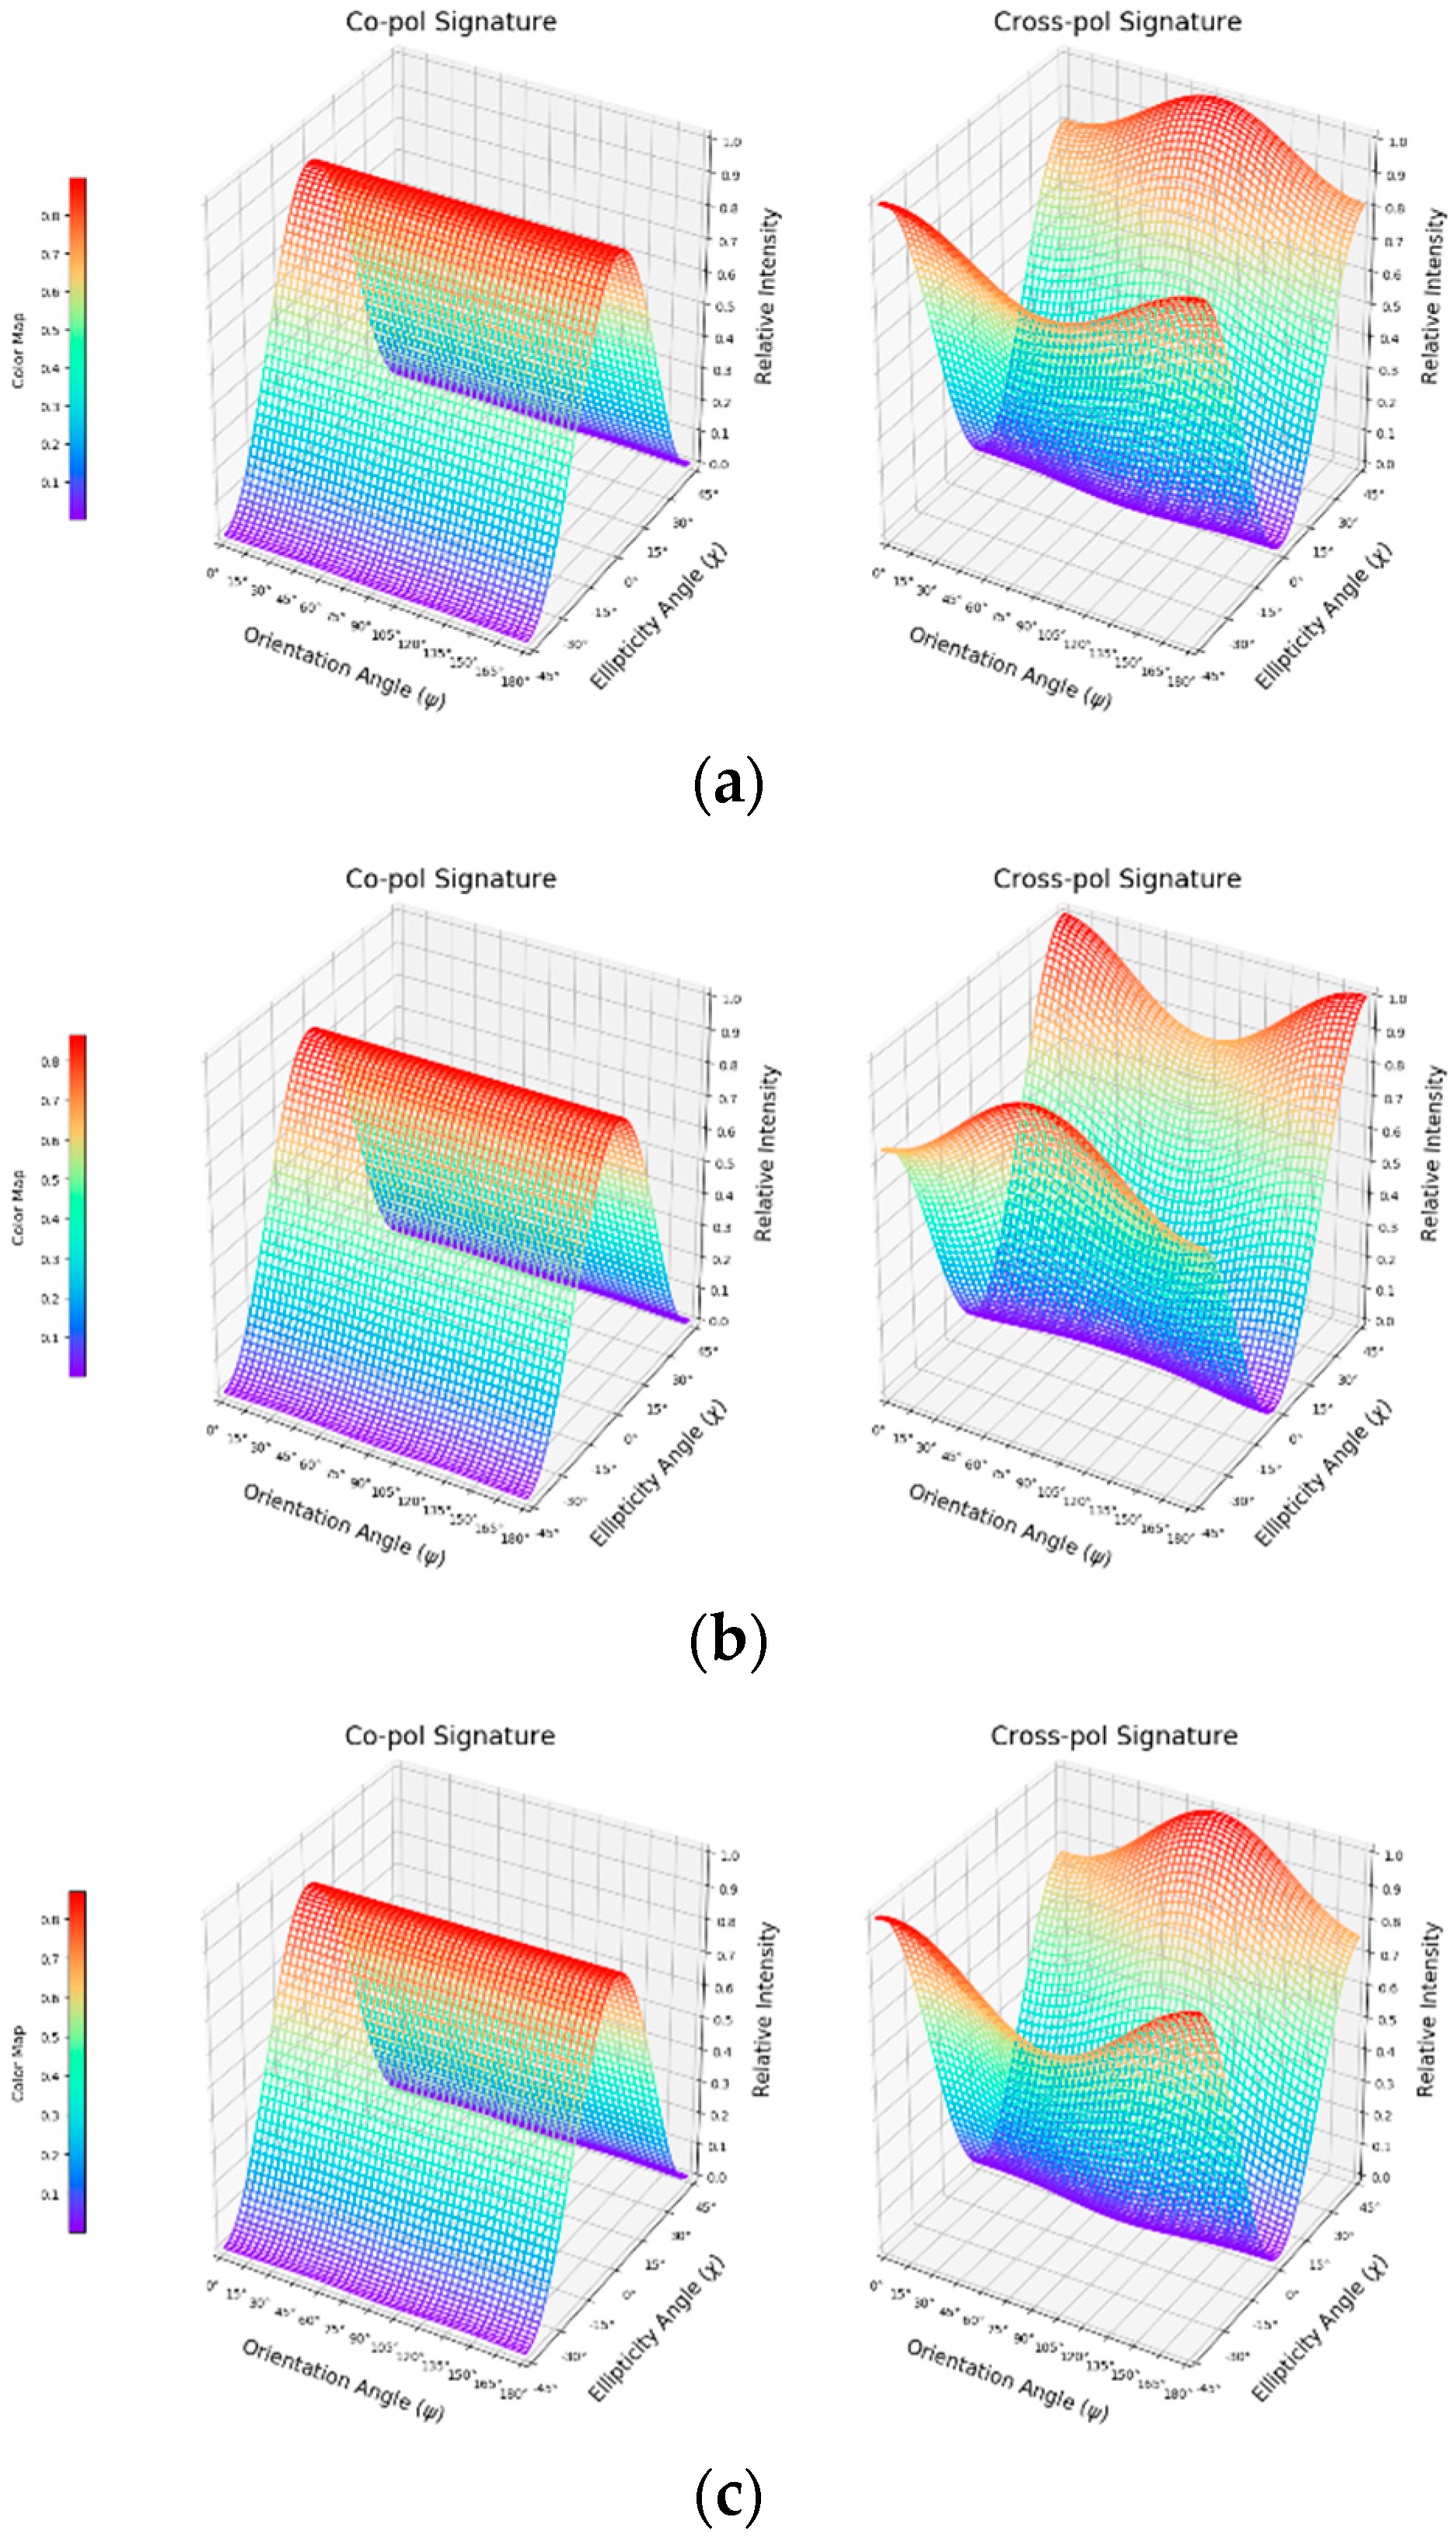
4.2. Analysis of Polarimetric Signatures for Distortion Assessment

Polarimetric signature analysis is one of the best ways to analyze the polarimetric distortions in PolSAR data by using the co-pol and cross-pol backscatter from a known class of targets. The triangular trihedral corner reflector gives three reflections of the incident electromagnetic wave and behaves similar to an odd-bounce scatterer. The three-dimensional graphs of the polarimetric signature for co-and cross-pol channels were plotted by keeping the orientation angle of the electric field vector between 0° to 180° and ellipticity between −45° to +45°.
Figure 5 shows the polarimetric signatures of the 4.8-m triangular trihedral corner reflectors in L-band SAR data. The perfect shape with maximum received power (at 0° ellipticity angle) of the co-pol signatures is obtained from all the five corner reflectors. A similar pattern of polarimetric signatures (Figure 6) for co-pol channels is obtained from S-band SAR data for all the five corner reflectors. This shows that there is no polarimetric distortion in the co-polar polarimetric signatures. The polarimetric signatures for cross-pol for all the five corner reflectors in both L-and S-band SAR data show distortions and are visible in Figure 5 and Figure 6.

5. Conclusions and Recommendations

This study was carried out to evaluate the polarimetric distortion in the dual-frequency LS-ASAR data that was acquired over RCRA, Rosamond, California. Monosattic SAR reciprocity assumptions between polarisation channels and polarimetric signatures were analyzed to evaluate the polarimetric distortions in the data. L- and S-band both the SAR system follows the reciprocity assumptions and it is evident from Figure 3b and Figure 4b. The cross-pol channels are linearly correlated and the amplitude values of the pixel in HV polarization are exactly equal to the corresponding pixel in VH polarization. Polarimetric signature analysis in Figure 5 and Figure 6 showed the ideal shape of the co-pol channels for all the corner reflectors. Though the cross-pol channels showed an ideal behavior in scatterplot analysis and followed the reciprocity assumptions for monostatic SAR systems, small distortions were also observed during polarimetric signature analysis. This study concludes that the LS-ASAR data are already well-calibrated and showed some of the polarimetric distortions in cross-pol channels. The distortion in cross-pol signatures could be minimized or removed by implementing appropriate PolCal methods.b

Funding

This research received no external funding.

Informed Consent Statement

Not Applicable.

Data Availability Statement

This study was carried out to evaluate the polarimetric distortion in the dual-frequency LS-ASAR data that were acquired over RCRA, Rosamond, California. The data are available on the given link https://uavsar.jpl.nasa.gov/cgi-bin/asar-data.pl (accessed on 30 July 2021).

Conflicts of Interest

The authors declare no conflict of interest

References

  1. Babu, A.; Kumar, S.; Agrawal, S. Polarimetric Calibration and Spatio-Temporal Polarimetric Distortion Analysis of UAVSAR PolSAR Data. Earth Sp. Sci. 2022, 9, e2020EA001629. [Google Scholar] [CrossRef]
  2. Kumar, S.; Babu, A.; Agrawal, S.; Asopa, U.; Shukla, S.; Maiti, A. Polarimetric Calibration of Spaceborne and Airborne Multifrequency SAR Data for Scattering-Based Characterization of Manmade and Natural Features. Adv. Sp. Res. 2022, 69, 1684–1714. [Google Scholar] [CrossRef]
  3. Maiti, A.; Kumar, S.; Tolpekin, V.A.; Agarwal, S. A Computationally Efficient Hybrid Framework for Polarimetric Calibration of Quad-Pol SAR Data. Earth Sp. Sci. 2021, 8, e2020EA001447. [Google Scholar] [CrossRef]
  4. Babu, A.; Kumar, S.; Agrawal, S. Polarimetric Calibration of L-Band UAVSAR Data. J. Indian Soc. Remote Sens. 2021, 49, 541–549. [Google Scholar] [CrossRef]
  5. Babu, A.; Kumar, S.; Agrawal, S. Polarimetric Calibration of RISAT-1 Compact-Pol Data. IEEE J. Sel. Top. Appl. Earth Obs. Remote Sens. 2019, 12, 3731–3736. [Google Scholar] [CrossRef]
  6. Babu, A.; Kumar, S.; Agrawal, S. RISAT-1 Compact Polarimetric Calibration and Decomposition. In Proceedings of the 3rd International Electronic Conference on Remote Sensing, Online, 22 May–5 June 2019; Wang, Q., Ed.; Volume 18, p. 3. [Google Scholar]
  7. Maiti, A.; Kumar, S.; Tolpekin, V.; Agarwal, S. Polarimetric Calibration of L-Band Airborne SAR. In Proceedings of the ISPRS Annals of the Photogrammetry, Remote Sensing and Spatial Information Sciences; Paparoditis, N., Mallet, C., Lafarge, F., Hinz, S., Feitosa, R., Weinmann, M., Jutzi, B., Eds.; International Society for Photogrammetry and Remote Sensing (ISPRS): Nice, France, 2020; Volume 1, pp. 369–374. [Google Scholar]
Figure 1. The presence of five 4.8-m corner reflectors (CRs) in HH-polarisation of (a) L-band and (b) S-band SAR images.
Engproc 27 00077 g001
Figure 2. The methodology of the LS-ASAR polarimetric distortion analysis.
Engproc 27 00077 g002
Figure 3. The scatterplot between (a) HH and VV polarizations and (b) HV and VH polarizations of L-band SAR data.
Engproc 27 00077 g003
Figure 4. The scatterplot between (a) HH and VV polarizations and (b) HV and VH polarizations of S-band SAR data.
Engproc 27 00077 g004
Figure 5. The L-band polarimetric signatures for (a) CR 23, (b) CR 24, (c) CR 25, (d) CR 26, and (e) CR 27.
Engproc 27 00077 g005aEngproc 27 00077 g005b
Figure 6. The S-band polarimetric signatures for (a) CR 23, (b) CR 24, (c) CR 25, (d) CR 26, and (e) CR 27.
Engproc 27 00077 g006aEngproc 27 00077 g006b
Table 1. A description of ASAR data.
ASAR DataL-BandS-Band
Product IDL_S_JOINT_FP_ID_3505K_LINE04_RUN01_04122019114327
SatIDLS_ASAR
Software VersionSOFTWARE_VERSION = 1.2_19022021
Date of Acquisition4 December 2019
Central Frequencies1.25 GHz for L band and 3.20 GHz for S-band
Near Incidence Angle26.269793°
Far Incidence Angle53.445926°
Output Line Spacing1.302329 m
Output Pixel Spacing1.249135 m
SAR ModeFully polarimetric Quad-pol (HH+HV+VH+VV)
Publisher’s Note: MDPI stays neutral with regard to jurisdictional claims in published maps and institutional affiliations.

