Proceeding Paper

Air-MIT: Air Quality Monitoring Using Internet of Things †

Department of Telecommunications Engineering, NED University of Engineering and Technology, Karachi 75270, Pakistan
*
Author to whom correspondence should be addressed.
Presented at the 7th International Electrical Engineering Conference, Karachi, Pakistan, 25–26 March 2022.
Eng. Proc. 2022, 20(1), 45; https://doi.org/10.3390/engproc2022020045
Published: 30 August 2022
(This article belongs to the Proceedings of The 7th International Electrical Engineering Conference)

Abstract

:
In both developed and developing countries, air pollution is increasing daily, compromising the air quality index and causing harm to everyone. Some of the reasons for this rapid increase in air pollution include the growing population, rising number of industries, rapid urbanization, and excessive use of fuel-consuming transportation. Hence, there is an ever-increasing need to monitor air quality using an energy-efficient, ubiquitous and connected manner. In this paper, we are presenting the design, working, and results of our device named Air-MIT, which is an air quality monitoring device, which uses the Internet of Things (IoT) to populate and upload data securely to the cloud server. We have developed a low-cost IoT-based air monitoring system capable of detecting carbon dioxide (CO2), Carbon Monoxide (CO), methane gas (CH4), Ammonium (NH4), with the provision of adding more sensors capable of detecting other harmful gases and particulates in the air as well. The system has been designed to monitor indoor air quality in real-time and to trigger an alarm if any one of the readings crosses the predefined threshold. The device also has the provision of turning on the exhaust fan in the house or kitchen to clear out the air and ventilate the space to minimize the exposure of harmful gases, resulting in avoidance of any accidents or fires.

1. Introduction

The paper presents a network of indoor air quality monitoring systems, fire alarms, and the prevention of accidents due to gas leakage. This portable device has embedded sensors that can be mounted at houses, malls, hospitals, garages, and industries. This is an IoT-based project.
In recent days, air pollution has reached alarming levels in Pakistan especially in metropolitan cities According to the Ministry of Natural Resources and Environment, there are a lot of factors that add to pollution. For instance, emissions from vehicles, development projects, industries, forest fires, power generation increase the concentration of CO2 [1]. Air pollution greatly affects human health and leaves a significant influence on industry workers and the people around them. Numerous harmful gases affect the air quality and make it unsafe to breathe in. Also, there are some gases like methane gas that can cause major accidents if not eliminated or at least detected at the correct time [2]. In Pakistan, industries are more focused on equipping the fire extinguisher detectors rather than the air monitoring detector. Focusing on an individual’s health is also very vital because this type of minor negligence leads to severe health concerns and sometimes even death.
Numerous gases are harmful to one’s health and unable to detect by human senses. Hence, it is immensely important to keep the air pollution levels checked, specifically in the urban areas. To execute this plan, we will need to develop an air pollution detector [3]. We sought a model that could detect the degree of pollution. We designed the prototype of an IoT-based air pollution detector to supervise or observe the increased air pollution levels. IoT has a vast application in today’s smart world. It helps in connecting everyday elements to the internet where computers allow us to use and exchange data with very little interference from humans. One of the important applications of IoT is natural environment detection. A record of the surroundings and environment is the most important aspect of human life. IoT has caused numerous evolutions in technology like cloud and machine learning. Not just this, IoT is helping us with making improvements in processes for environment monitoring, health improvement LCD, and other fields related to human well-being [4].
Back in time, detection of pollution was a difficult task but nowadays with the help of IoT-based technologies, it is easy to detect and find solutions to rising pollution enabling people to take safety measures at least in confined spaces [5]. Multiple IoT-based devices in the market are purely dedicated to environment monitoring like air quality and concentration measurement of gases. These sensors along with IoT applications create a marvelous environment for better surroundings [6]. The IoT-based Air Pollution Monitoring System analyses the air quality through the internet and will trigger an alarm if the air quality drops below a particular threshold, indicating the presence of dangerous gases such as CO2, smoke, alcohol, benzene, NH3, CH4, and LPG. The system will display the air quality in parts per million on the LCD and webpage enabling easy monitoring. Moreover, the fan will also switch on to clear the pollution in the room.
The model is not very high priced and can be easily deployed in every industry, covering lesser space. In this model, with the aid of NodeMCU ESP8266. NodeMCU ESP8266 12E is a microcontroller used for IoT applications. NodeMCU gives the ability to openly perform editing, modification, and rebuilding of project programs and functions through different programming environments [7]. We are remotely measuring the air quality. The threshold level is set, and once the air pollution level escalates to the threshold level, it will be notified on the web app, and things will proceed further to get rid of the excessive pollution.

2. System Model

The system is designed by using hardware components operated by software and programming tools that are discussed below.

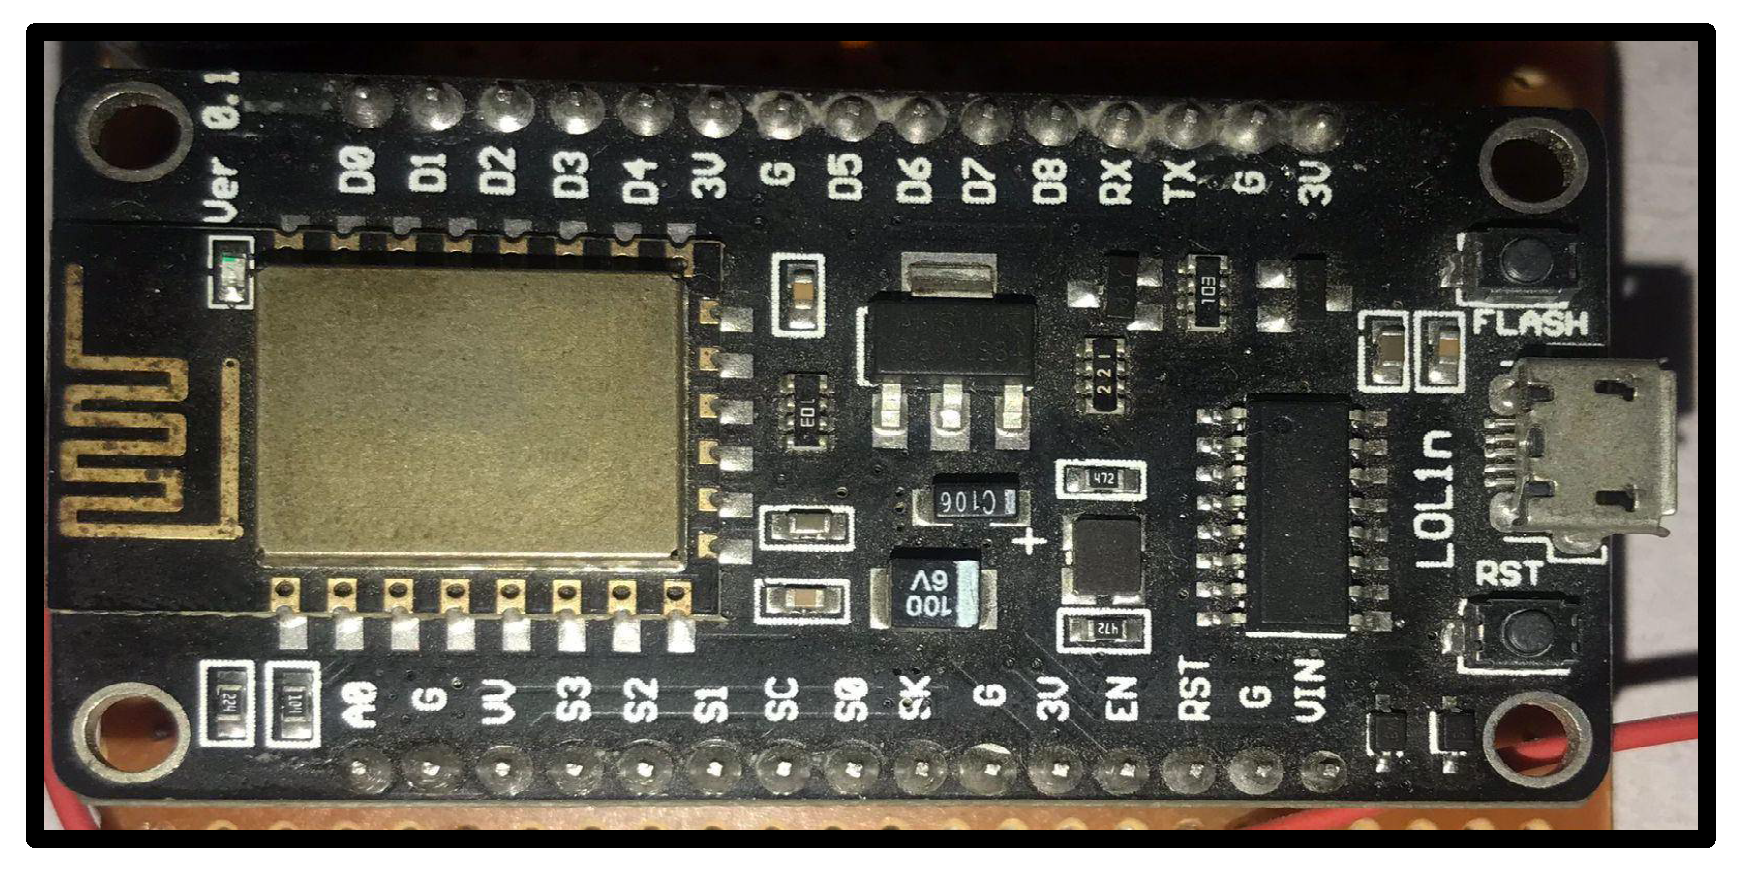
2.1. Hardware Components

The hardware components used in the system is NodeMCU as a micro-controller (see Figure 1). NodeMCU gives the ability to openly perform editing, modification, and rebuilding of project programs and functions through different programming environments [7]. MQ series gas sensors include MQ-7 to detect carbon monoxide [5], MQ-4 to detect methane [6], MQ-2 to detect smoke and LPG [7], MQ-137 to detect ammonia gas, and MQ 135 to detect overall pollutants [8]. These sensors detect gasses like Methane, CO, LPG, and overall air quality. MQ Series Gas Sensors are composed of micro-AL2O3 ceramic tubes, Tin Dioxide (SnO2) sensitive layer, measuring electrodes, and heater, which is fixed into a crust, composed of plastic and stainless steel net [9]. MG-811 gas senor to detect carbon dioxide is used from MG series sensors. This sensor has a rapid response and recovery characteristics with low-temperature dependency and humidity [10].
ADS1115 is used to convert analog inputs into digital. On the single input pin in NOdeMCU [11,12]. On the output side of the microcontroller, an LCD, exhaust fan, and a buzzer are connected for alarming and alerting about the rising air pollution level.

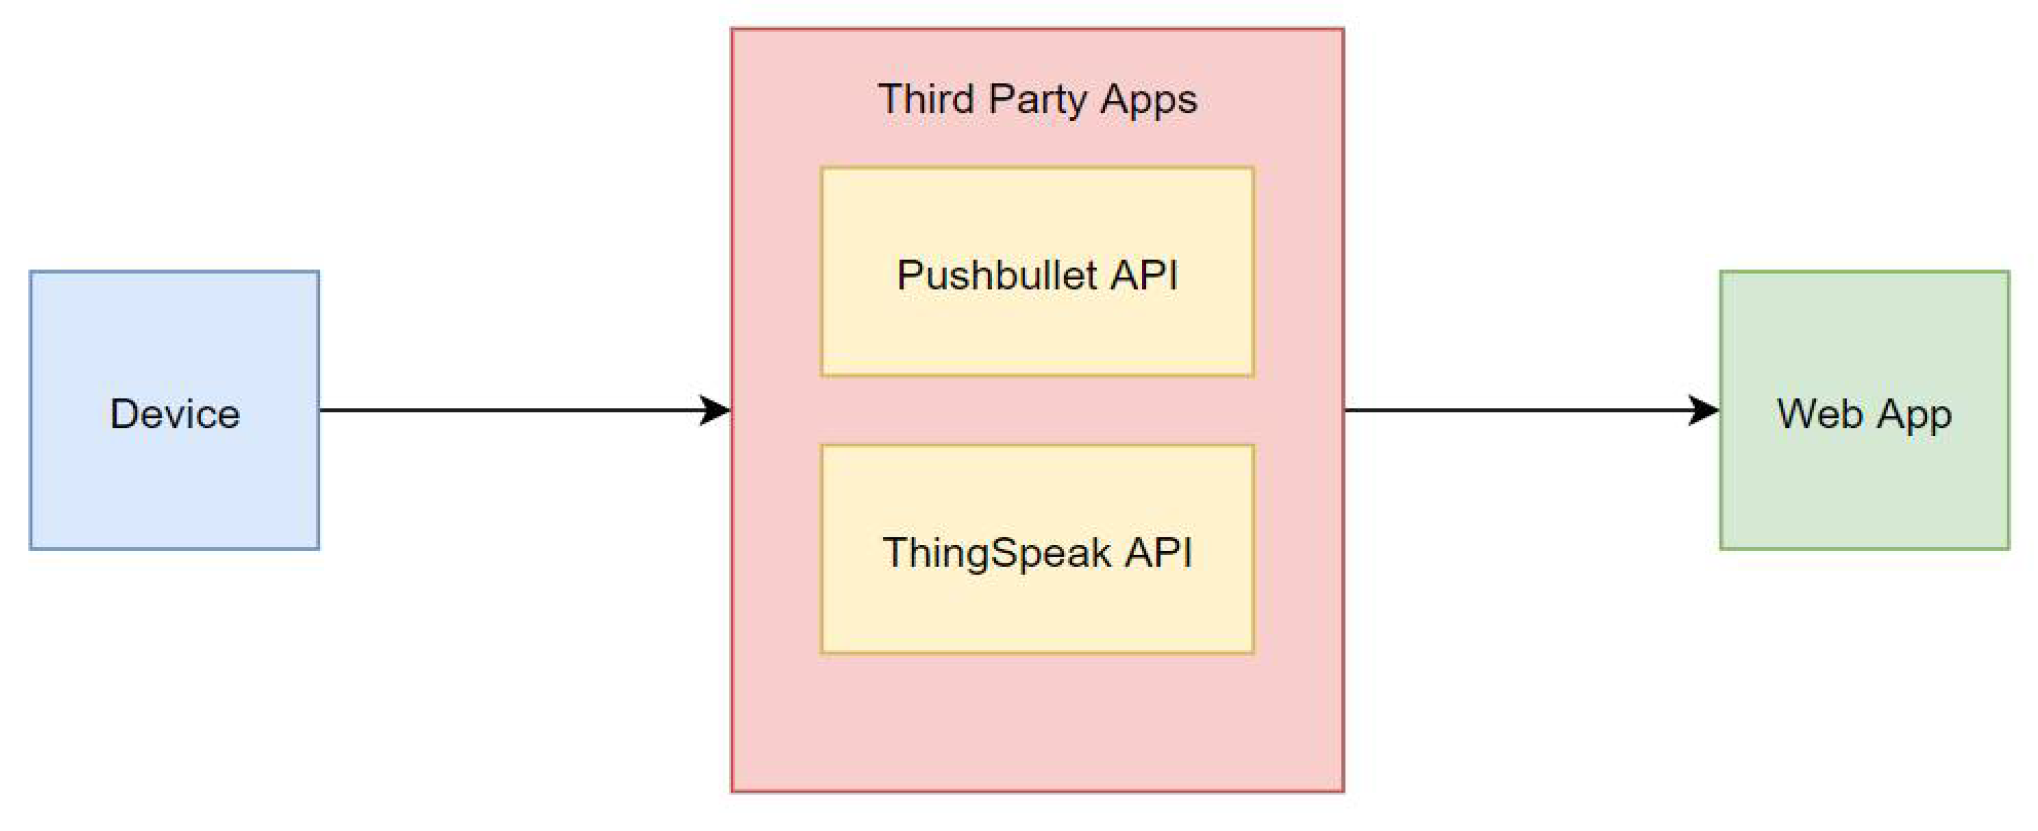
2.2. Software Components
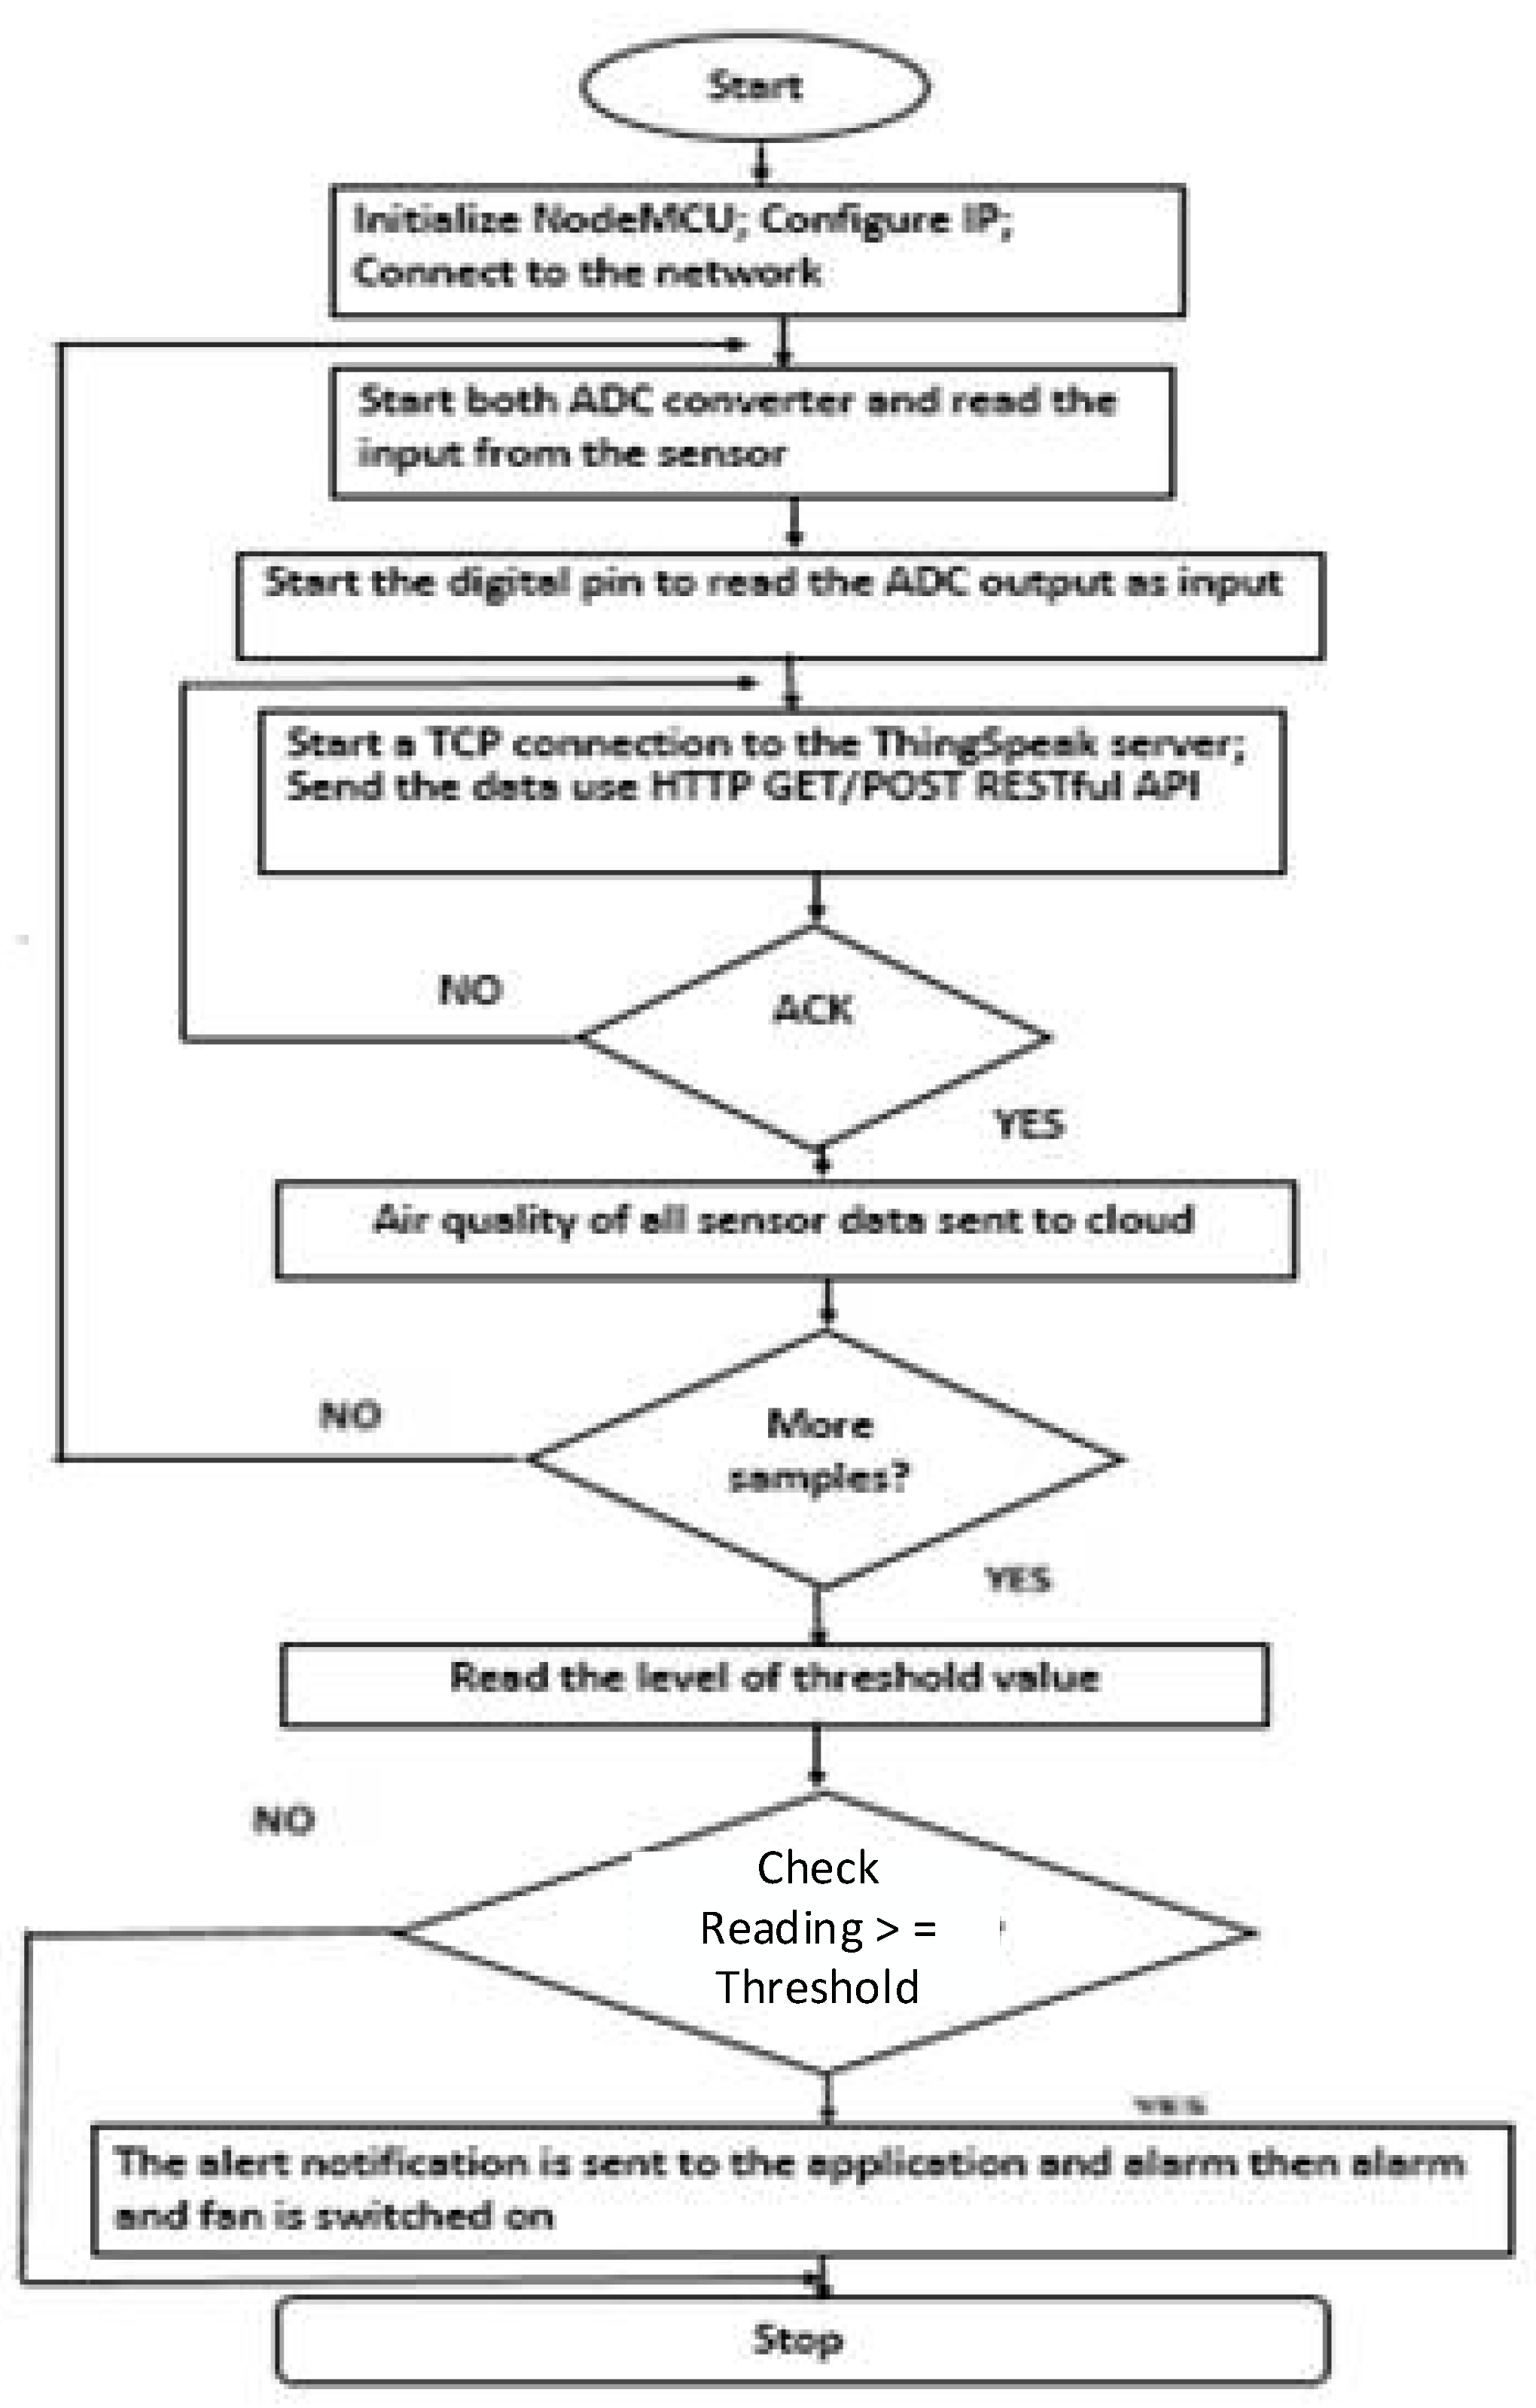
Arduino IDE is used to program NodeMCU to run the system. It is a platform used for compiling and uploading programs to the microcontrollers. It is exceptionally user-friendly and easy to use; therefore, even non-specialists can use it. This platform supports C and C+ [13]. Also, ThingSpeak to show the graphical results and PushBullet for notification purposes is used, and our own created Web App is used to collect data from both apps and present it on one platform. Figure 2 shows the connectivity between the application and the hardware.

3. System Design

This project’s methodology comprises investigating the rising air pollution levels in a specific environment. To precisely detect the gas level at each site or area, the deployment of different types of sensors has been made necessary. Different sensors have been connected to the microcontroller with the help of ADS1115. Each sensor measures analog values of different pollutants and the real-time data from the sensors is being processed and delivered to the microcontroller via ADC for further processing. After processing NodeMCU will send the sensor readings to the Internet and LCD connected to the microcontroller. ThingSpeak is used as a medium to read the results from NodeMCU. As long as NodeMCU connects to the Internet, the result readings can be monitored every time. We have integrated our sensors with NodeMCU using IoT.
Once the system starts, NodeMCU configuration of IP of the network takes place. It then collects data from the sensors via the ADC controller and sends it to ThingSpeak and LCD. Then it checks for the threshold value. If the detected value is greater than the assigned threshold then it will turn on the fan and the buzzer otherwise it will restart the process.
Moreover, our web application collects data from ThingSpeak to display it in a proper format along with the warning notification and records (insights). A buzzer is connected to the D4 pin of NodeMCU for alarming purposes. A relay is connected to the D6 pin of NodeMCU, which operates the fan once the threshold is reached. The flowchart below describes the pictorial representation of the hardware and software development approach. Figure 3 shows the system design flowchart.

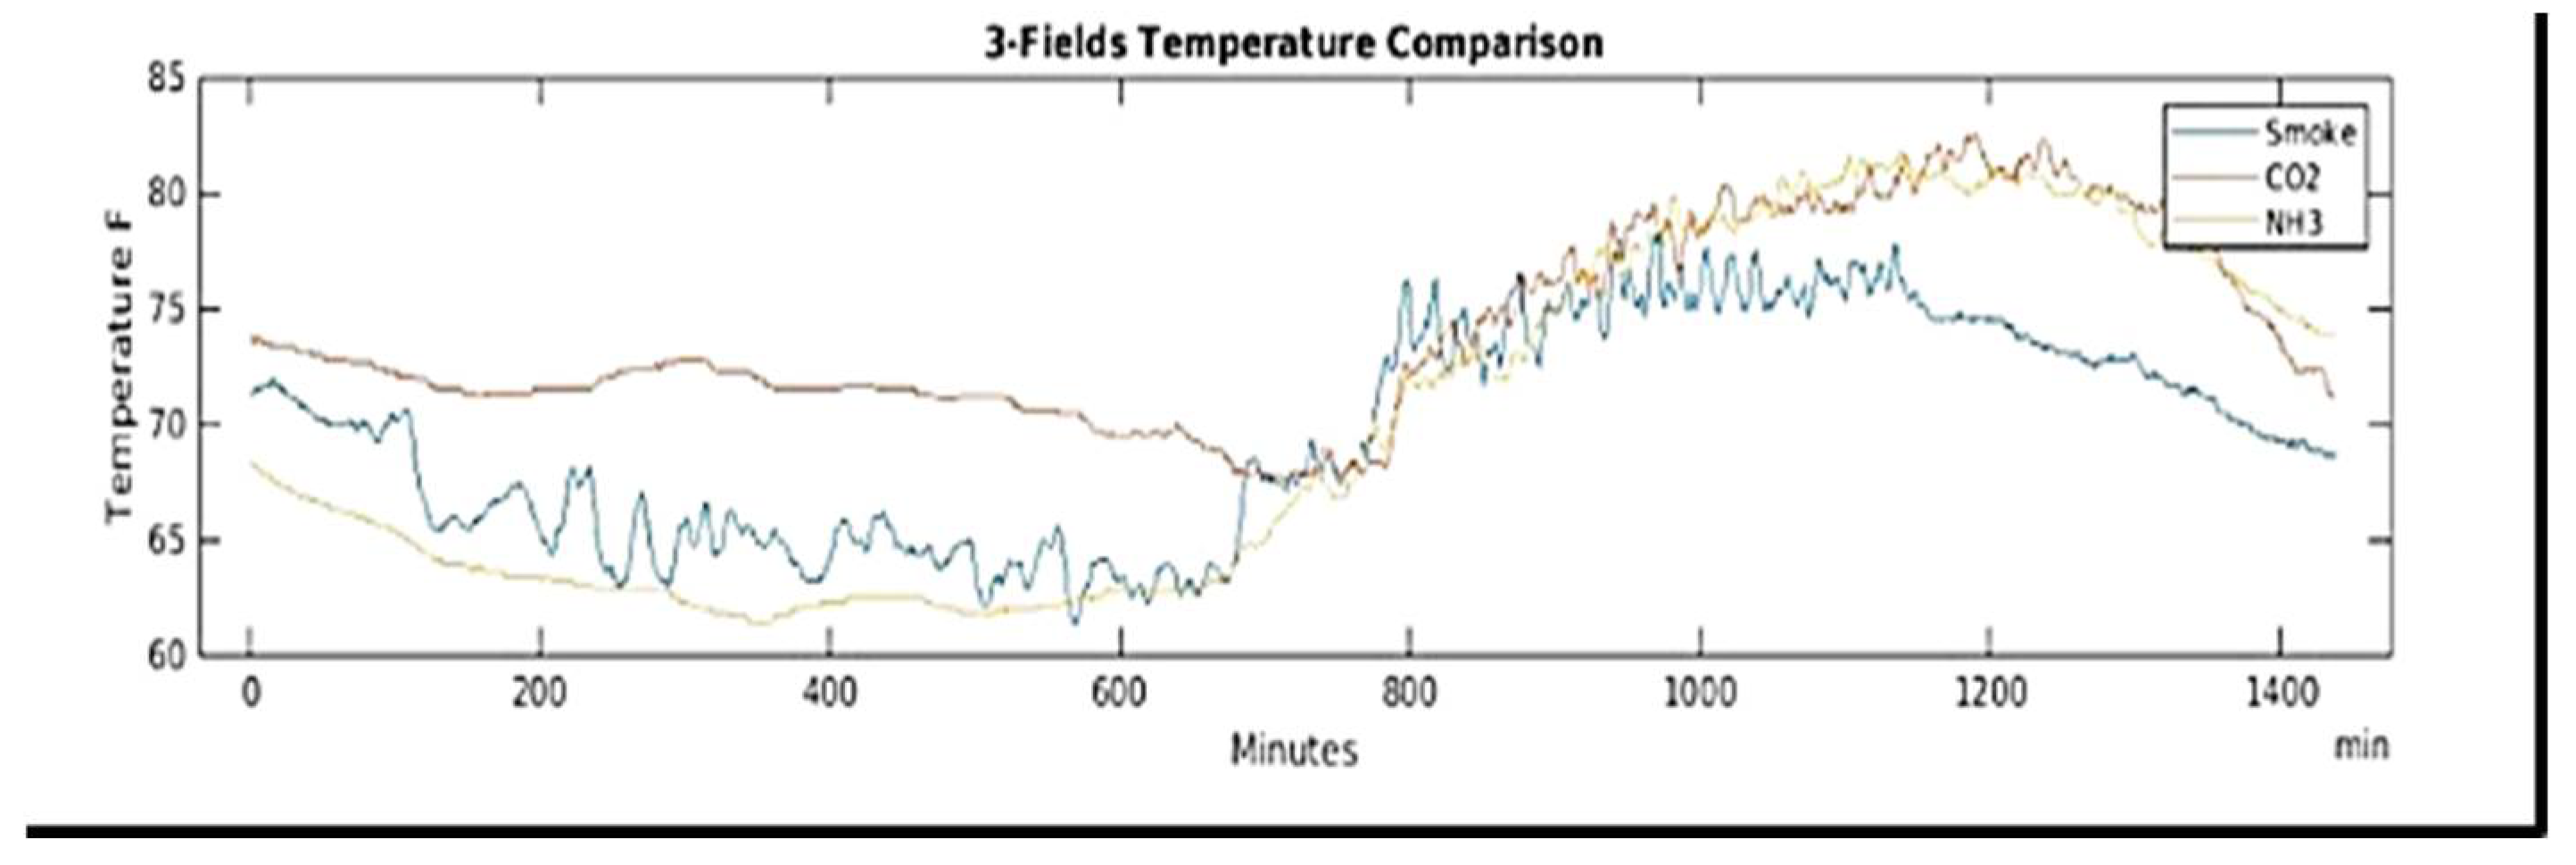
4. Results and Discussion

We tested out the project in a highly polluted and highly crowded closed environment in the metropolitan city, and results suggested that the air there is unhealthy. Data was sent to ThingSpeak by the nodeMCU; it was then collected by the web application that we created, the comparison was made against the range of pollution levels stored, and then it was declared whether the air was healthy, unhealthy, or hazardous. We were able to acquire data from all the sensors but are discussing the findings of some of them in the subsequent paragraphs.
Figure 4 shows the comparison between Smoke, CO2, and NH3 emissions (sensed by MQ2, MQ7, MQ137 sensors) in the targeted environment when the system is initialized. The data has been recorded over a long period of 1400 minutes. We emulated a house fire after which, as can be seen from the figure, during that time of the fire, the emissions rise with a rise in ambient temperature. As a result, the buzzer started to ring, and the exhaust fan is turned on. After turning on the exhaust fan, the concentration values and ambient temperature decrease due to the dispersion of gases, as evident from Figure 4.
Figure 5 depicts the detection of overall Air-Quality in a highly polluted and crowded environment. As evident, over the time where we have emulated a small fire, there is a rise in the air pollutants (sensed by the MQ135 sensor).

5. Conclusions

In this paper, we have presented the results of a air quality and hazardous pollutants monitoring system using IoT. We have developed the hardware composed of NodeMCU and have incorporated a range of sensors capable of detecting and gauging various kinds of hazardous gases and pollutants. Such a system can be further improved to make marketable product.

Author Contributions

Hardware development: S.M., A.S.; Software and app development: A.A., R.K.; Project Coordination and Technical Guidance: S.A.; Conceptualization and Project Management: M.I.A. All authors have read and agreed to the published version of the manuscript.

Funding

This research was funded by IGNITE NGIRI.

Institutional Review Board Statement

Not applicable.

Informed Consent Statement

Not applicable.

Data Availability Statement

Not applicable.

Acknowledgments

We would like to extend our gratitude to IGNITE National Grass root ICT Research Initiative for NGIRI for funding the project.

Conflicts of Interest

The authors declare no conflict of interest.

References

  1. Nunez, C. Carbon Dioxide Levels Are at a Record High. Here’s What You Need to Know. Available online: https://www.nationalgeographic.com/environment/article/greenhouse-gases (accessed on 1 March 2022).
  2. Adeuti, B.R. Analysis of Environmental Pollution in Developing Countries. Am. Sci. Res. J. Eng. Technol. Sci. 2020, 65, 39–48. [Google Scholar]
  3. Maurya, A.; Chinchane, A.; Sumant, O. Air Quality Monitoring Market by Product Type (Indoor Monitor and Outdoor Monitor), Pollutant (Chemical, Biological, and Physical) and End User (Government & Academic, Oil & Gas, Power Plants, Commercial & Residential, and Others): Global Opportunity Analysis and Industry Forecast, 2021–2030; Report on Air Quality Monitoring Market, Allied Market Research: Portland, OR, USA, 2022. [Google Scholar]
  4. Aarthi; Kapoor, K.; Musfik, M.; Sharma, R. Air sound monitoring system using IoT. IRJET 2018, 5, 1659–1664. [Google Scholar]
  5. Pololu Robotics and Electronics. Available online: https://www.pololu.com/ (accessed on 1 March 2022).
  6. MQ-4 Sensors Datasheet. Available online: https://www.sparkfun.com/datasheets/Sensors/Biometric/MQ-4.pdf (accessed on 1 March 2022).
  7. How MQ2 Gas/Smoke Sensor Works? & Interface It with Arduino. Available online: https://lastminuteengineers.com/mq2-gas-senser-arduino-tutorial/ (accessed on 1 March 2022).
  8. MQ-135-Gas Sensor for Air Quality. Available online: https://components101.com/sensors/mq135-gas-sensor-for-air-quality (accessed on 1 March 2022).
  9. Nayyar, A.; Puri, V.; Le, D.-N. A Comprehensive Review of Semiconductor-Type Gas Sensors for Environmental Monitoring. Rev. Comput. Eng. Res. 2016, 3, 55–64. [Google Scholar] [CrossRef]
  10. Using the ADS1115: A Precision 16 Bit ADC with Amazing Accuracy. Instantly Improve Your Analog Measurements with High Resolution Capability. Available online: https://www.best-microcontroller-projects.com/ads1115.html (accessed on 1 March 2022).
  11. Mohamed, F.; Ali, A.D. Integrated Development Environment “IDE” For Arduino. Available online: https://www.researchgate.net/publication/328615543_Integrated_Development_Environment_IDE_For_Arduino (accessed on 1 March 2022).
  12. Parihar, Y.S. Internet of things and NodeMCU a review of NodeMCU ESP8266 in IoT products. JETIR 2019, 6, 1085–1088. [Google Scholar]
  13. Acharyya, S.; Hazra, S.; Pal, A.; Sengupta, N. Indoor Air Quality Management Using Raspberry Pi And Graphlab. Int. J. Res. Eng. Technol. 2017, 6, 29–36. [Google Scholar] [CrossRef]
Figure 1. NodeMCU Interface.
Engproc 20 00045 g001
Figure 2. Connection between Application and Hardware.
Engproc 20 00045 g002
Figure 3. Flow chart of system design.
Engproc 20 00045 g003
Figure 4. Comparison between Ammonia NH3, CO2, and Smoke in a highly polluted and highly crowded environment.
Engproc 20 00045 g004
Figure 5. Detection of overall Air-Quality in a highly polluted and crowded environment.
Engproc 20 00045 g005
Publisher’s Note: MDPI stays neutral with regard to jurisdictional claims in published maps and institutional affiliations.

