Proceeding Paper

Saturation and Hue Analysis Using Complex Hadamard Transform †

1
Department of Electronic Engineering, Sir Syed University of Engineering and Technology, Karachi 75300, Pakistan
2
Department of Computer Science & Information Technology, Sir Syed University of Engineering and Technology, Karachi 75300, Pakistan
3
Department of Biomedical Engineering, Sir Syed University of Engineering and Technology, Karachi 75300, Pakistan
4
Department of Computer Engineering, Sir Syed University of Engineering and Technology, Karachi 75300, Pakistan
*
Author to whom correspondence should be addressed.
Presented at the 7th International Electrical Engineering Conference, Karachi, Pakistan, 25–26 March 2022.
Eng. Proc. 2022, 20(1), 36; https://doi.org/10.3390/engproc2022020036
Published: 5 August 2022
(This article belongs to the Proceedings of The 7th International Electrical Engineering Conference)

Abstract

:
This paper presents an overview in relation to observed changes in saturation and hue. The magnitude and phase components of color images are analyzed using the Complex Hadamard Transform. By considering the human visual system, CIE La*b* color space is applied to RGB images in the transform domain. It is determined that by changing the phase in a sequency domain, the hue varies when the saturation is kept the same, and the opposite occurs when the magnitude is changed. The results are compared with those of the Discrete Fourier Transform in the frequency domain. The above parameters play an integral part in the functioning of color images on different applications using the Complex Hadamard Transform.

1. Introduction

The Complex Hadamard Transform (CHT) is a discrete and orthogonal transform [1]. It is the generalized form of the Real Hadamard Transform (RHT). This transform is well-known due to its simplicity; for example, its transformation-matrix values depend on the { ± 1 , ± j } unit complex plane [2]. It works in a sequency domain that is more closely related to the frequency of the Discrete Fourier Transform (DFT) [3].
Color images are stimulated by two important factors. First, color plays powerful role in recognizing an object from its intensity bands and allocating them to different channels [4]. The spatiochromatic features of color images have been analyzed using eigen-images [5]. Color PCA (principle component analysis) has been performed for background surfaces and boundaries. The second vital reason for image processing is that the human eye can discriminate thousands of color shades [6]. Full-color and pseudo-color processing are the main areas of color-image processing. A pseudo-natural color technique has been developed on the basis of the spectral similarity scale [7]. Generally, color-image processing techniques are divided in the chromatic information, for extracting the color, and the topological information of the color images [8]. Color-image enhancement is needed to reduce the noise and sharpen the image boundaries. Different levels of histogram equalization have been studied, such as gray-level and saturation-level histograms, for the contrast enhancement of color images [9].
This paper is based on the analysis of the magnitude and phase angle of color images in the sequency domain. The Conjugate Symmetric Sequency-Ordered Complex Hadamard Transform (CS-SCHT), a variant of the CHT, is applied to color images using CIE La*b*. This color space provides the best results in terms of the correlation and sharpening of color images [10,11]. This color model provides (1) luminance and (2) chromatic channels. Luminance is based on gray shades from 0 (black) to 100 (white). The chromaticity value a* for the chromatic components varies from red to green, whereas, b* varies from yellow to blue [12,13].

2. Background and Motivation

2.1. Human Visual System (HVS)

The HVS, described as the image that is actually displayed and perceived by the human eye, is different. The human eye and brain can easily process an object via the light rays emitted and reflected within the electromagnetic band [6]. Research based on the HVS has been developed over several years, and a small portion of it has been developed for color images for a number of reasons. The HVS alone is more confined in the transform domain by spectral coefficients; in particular, the HVS is more sensitive to changes in the hue of color images [14].

2.2. CIE La*b* Color Space

Color spaces are represented by their particular chromaticity diagrams [15]. These are the mathematical standards that describe the ranges of colors. The International Commission on Illumination (CIE) developed CIE La*b* [13], which is perceptually uniform. It has been determined that the distance between two color points is perceptual to the HVS [13] as follows:
Δ E * = ( Δ L ) 2 + ( Δ a * ) 2 + ( Δ b * ) 2
where the total difference in the color is Δ E * , the difference between red–green ( + a * to a * ) colors is Δ a * , the distance measured between yellow–blue ( + b * to b * ) values is Δ b * , and Δ L describes the change in the luminance value of black–white. HVS can first observe the change in hue; second, the change in chroma or saturation; and finally, the change in luminance [16].
C * = ( a * + b * ) 2
Δ H * = tan 1 ( b * / a * )
C * represents the chroma, and the change in hue is represented by Δ H * .

2.3. HSV Color Space

The HSV color space is the most-referenced color space, consisting of hue, saturation, and value, with a cylindrical geometry system [6], in an RGB color model. Its vertical axes represent the gray level from black to white. In the chromaticity plane, hue and saturation are described as projections on the RGB cube [17].

3. CIE La*b* in Transform Domain

The RGB image is transformed into the CIE La*b*; then, the luminance ‘L’ component and the chromatic ‘a* and b*’ components are separated. CS-SCHT is applied to the two-dimensional chromatic components as a complex number a * ( n 1 , n 2 ) + j b * ( n 1 , n 2 ) as follows,
A * ( k 1 , k 2 ) + j B * ( k 1 , k 2 ) = { a * ( n 1 , n 2 ) + j b * ( n 1 , n 2 ) }
where the transformed coefficients are A * ( k 1 , k 2 ) + j B * ( k 1 , k 2 ) .

3.1. CS-SCHT

CS-SCHT is the conjugate version of the CHT. This transform has been applied in signal- and image-processing applications [18,19]. This transform has been performed on signals analysis as follows:
X ( k 1 , k 2 ) = 1 N { x * ( n 1 , n 2 ) }
The inverse is:
x * ( n 1 , n 2 ) = 1 { X ( k 1 , k 2 ) }
where, X ( k 1 , k 2 ) is the spectrum in the transform domain and x * ( n 1 , n 2 ) is the spatial domain image.

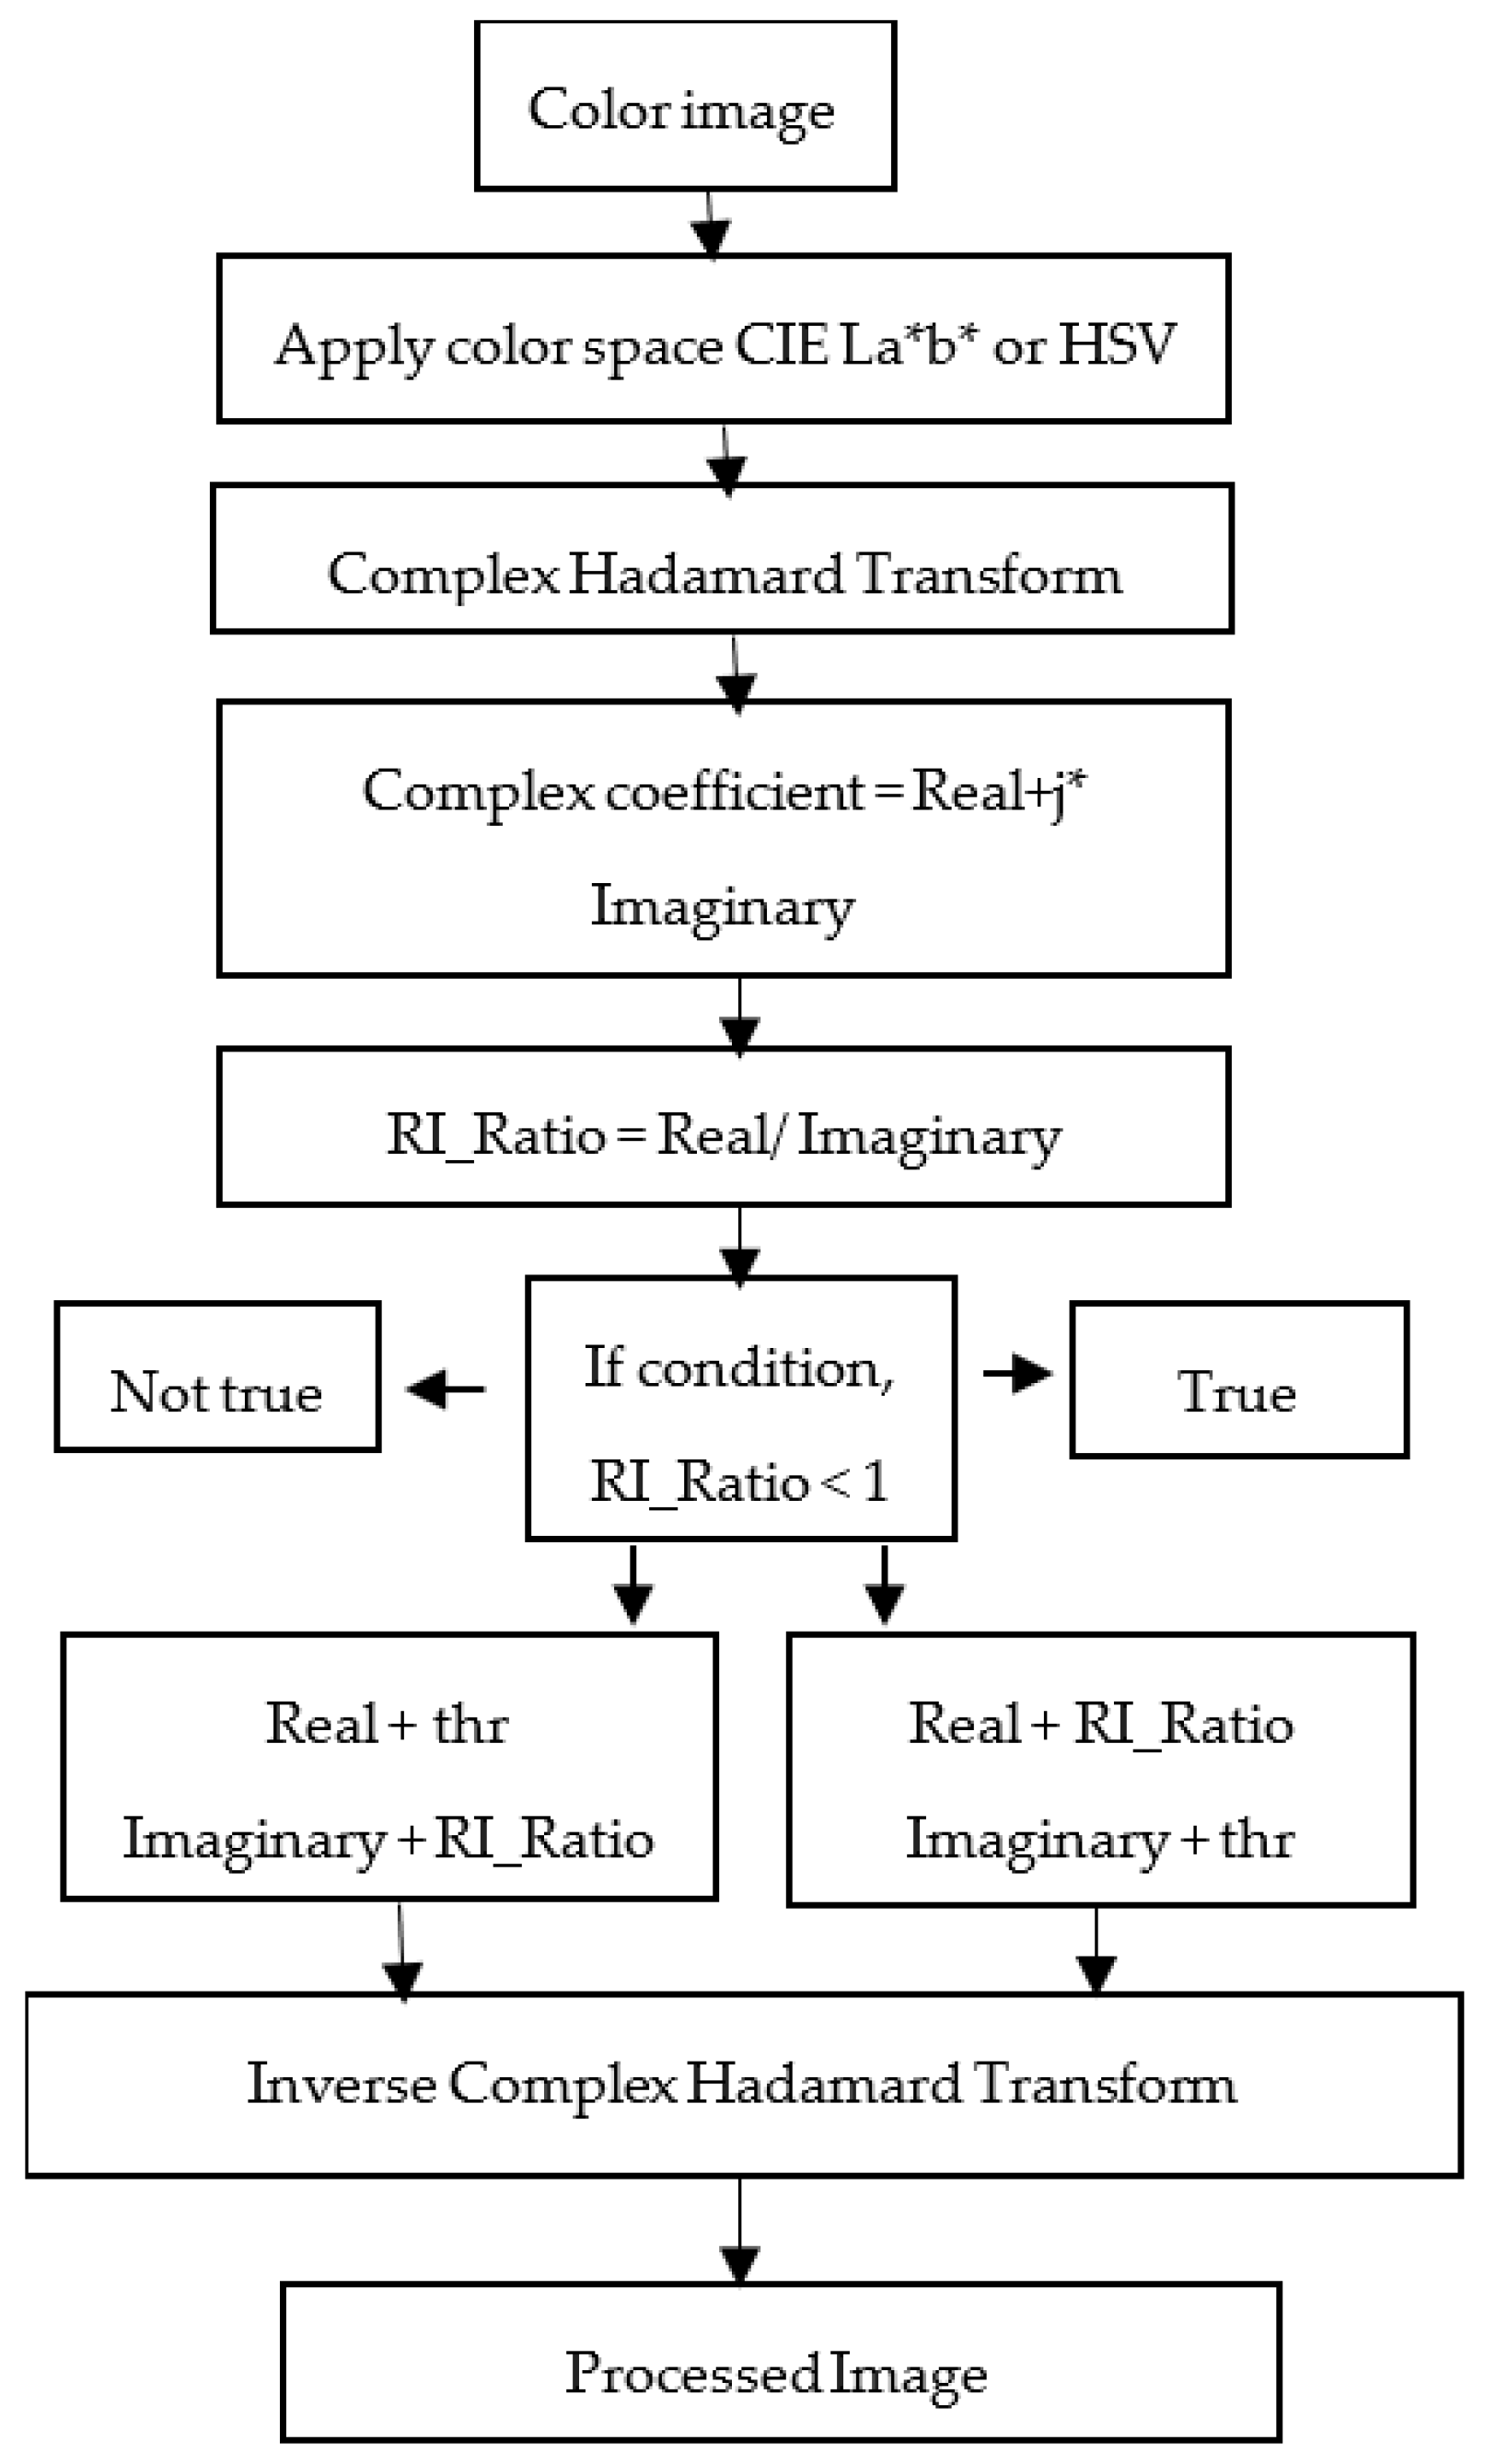
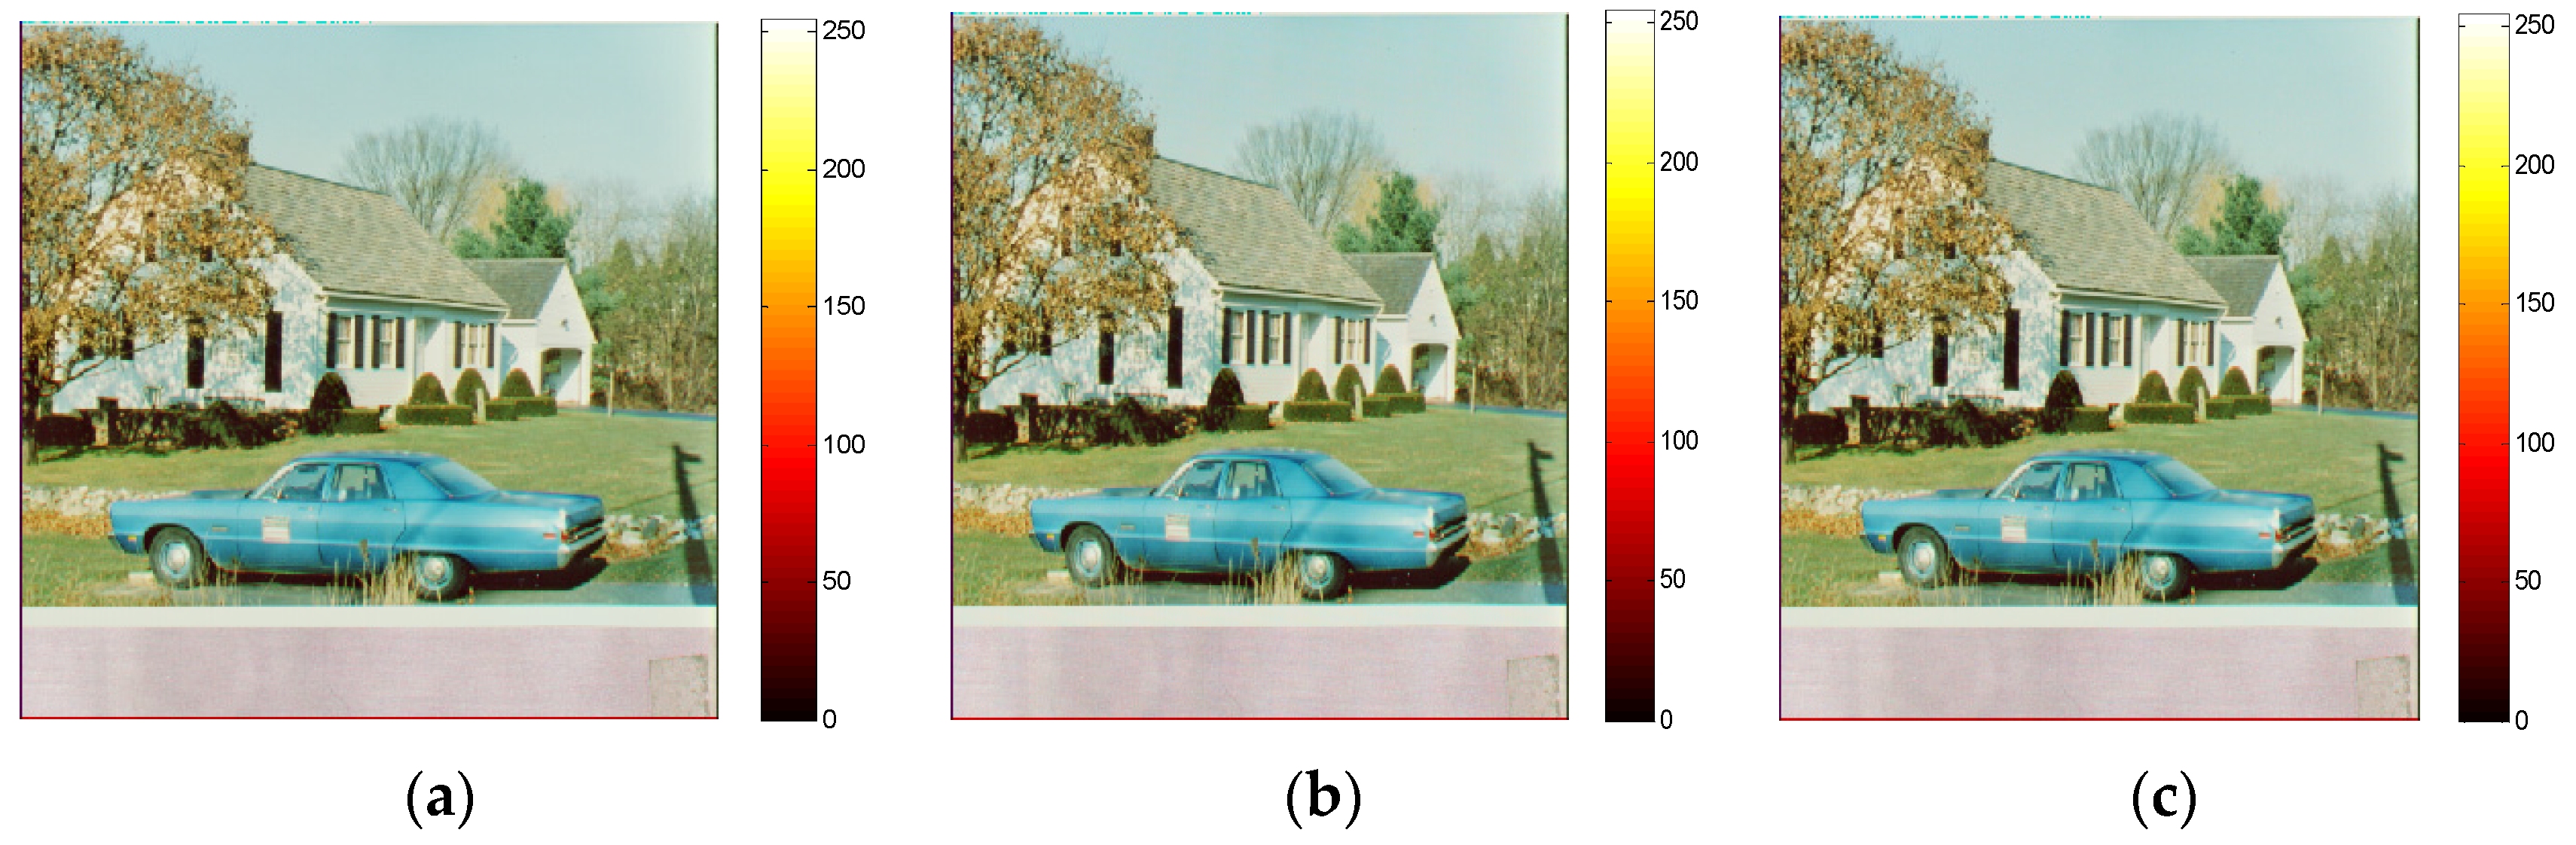
3.2. Change in Saturation
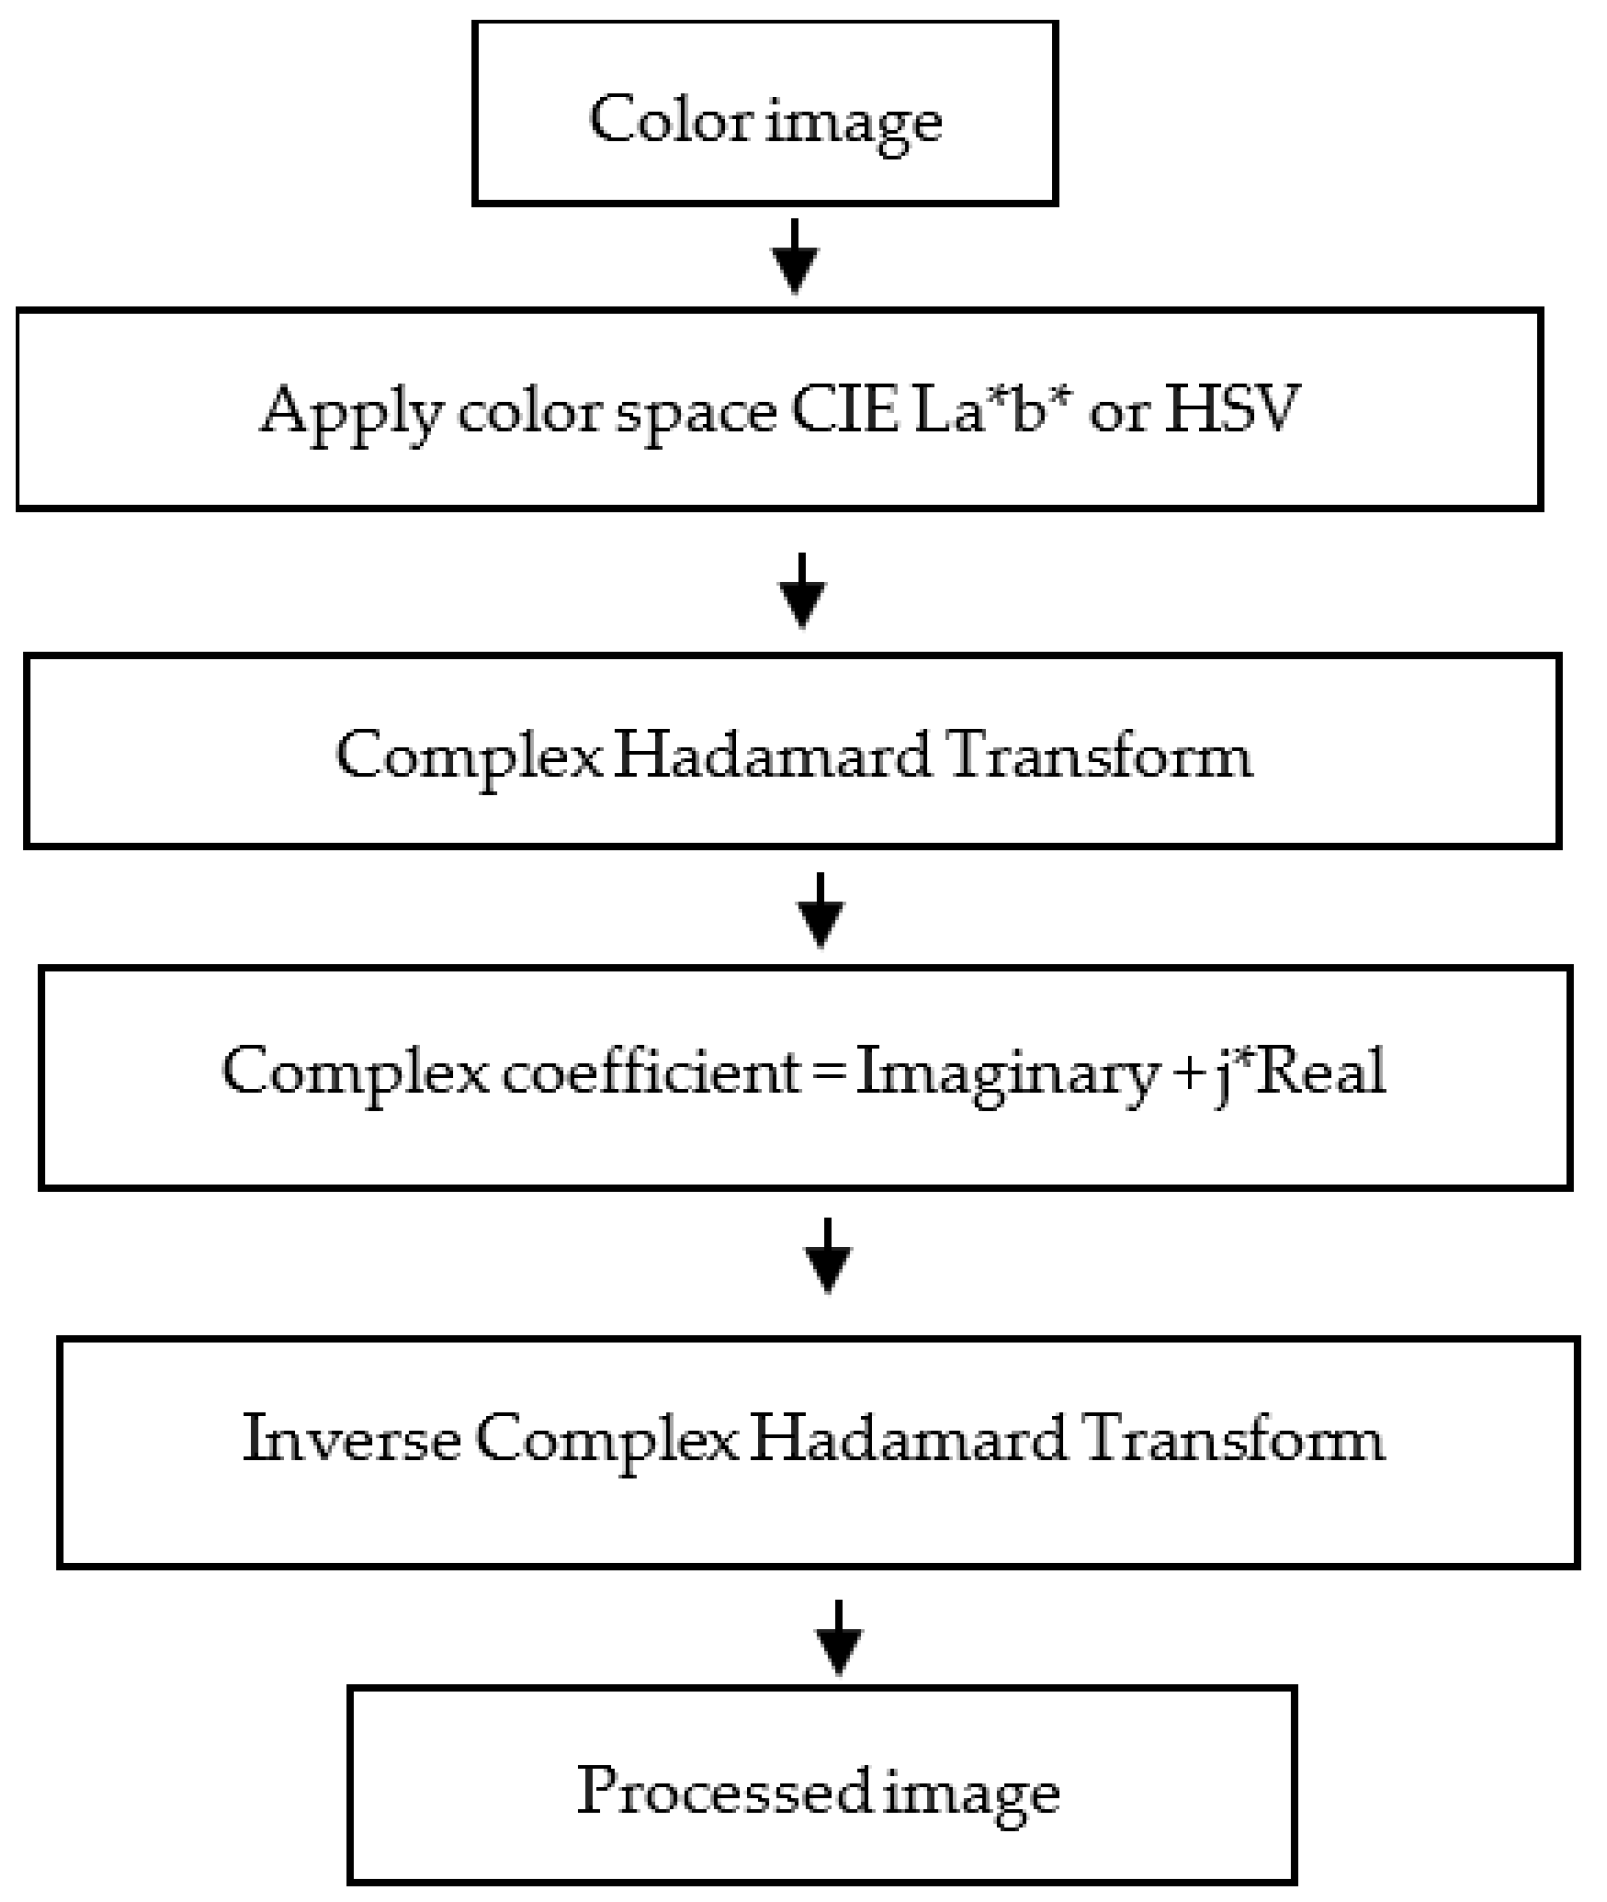
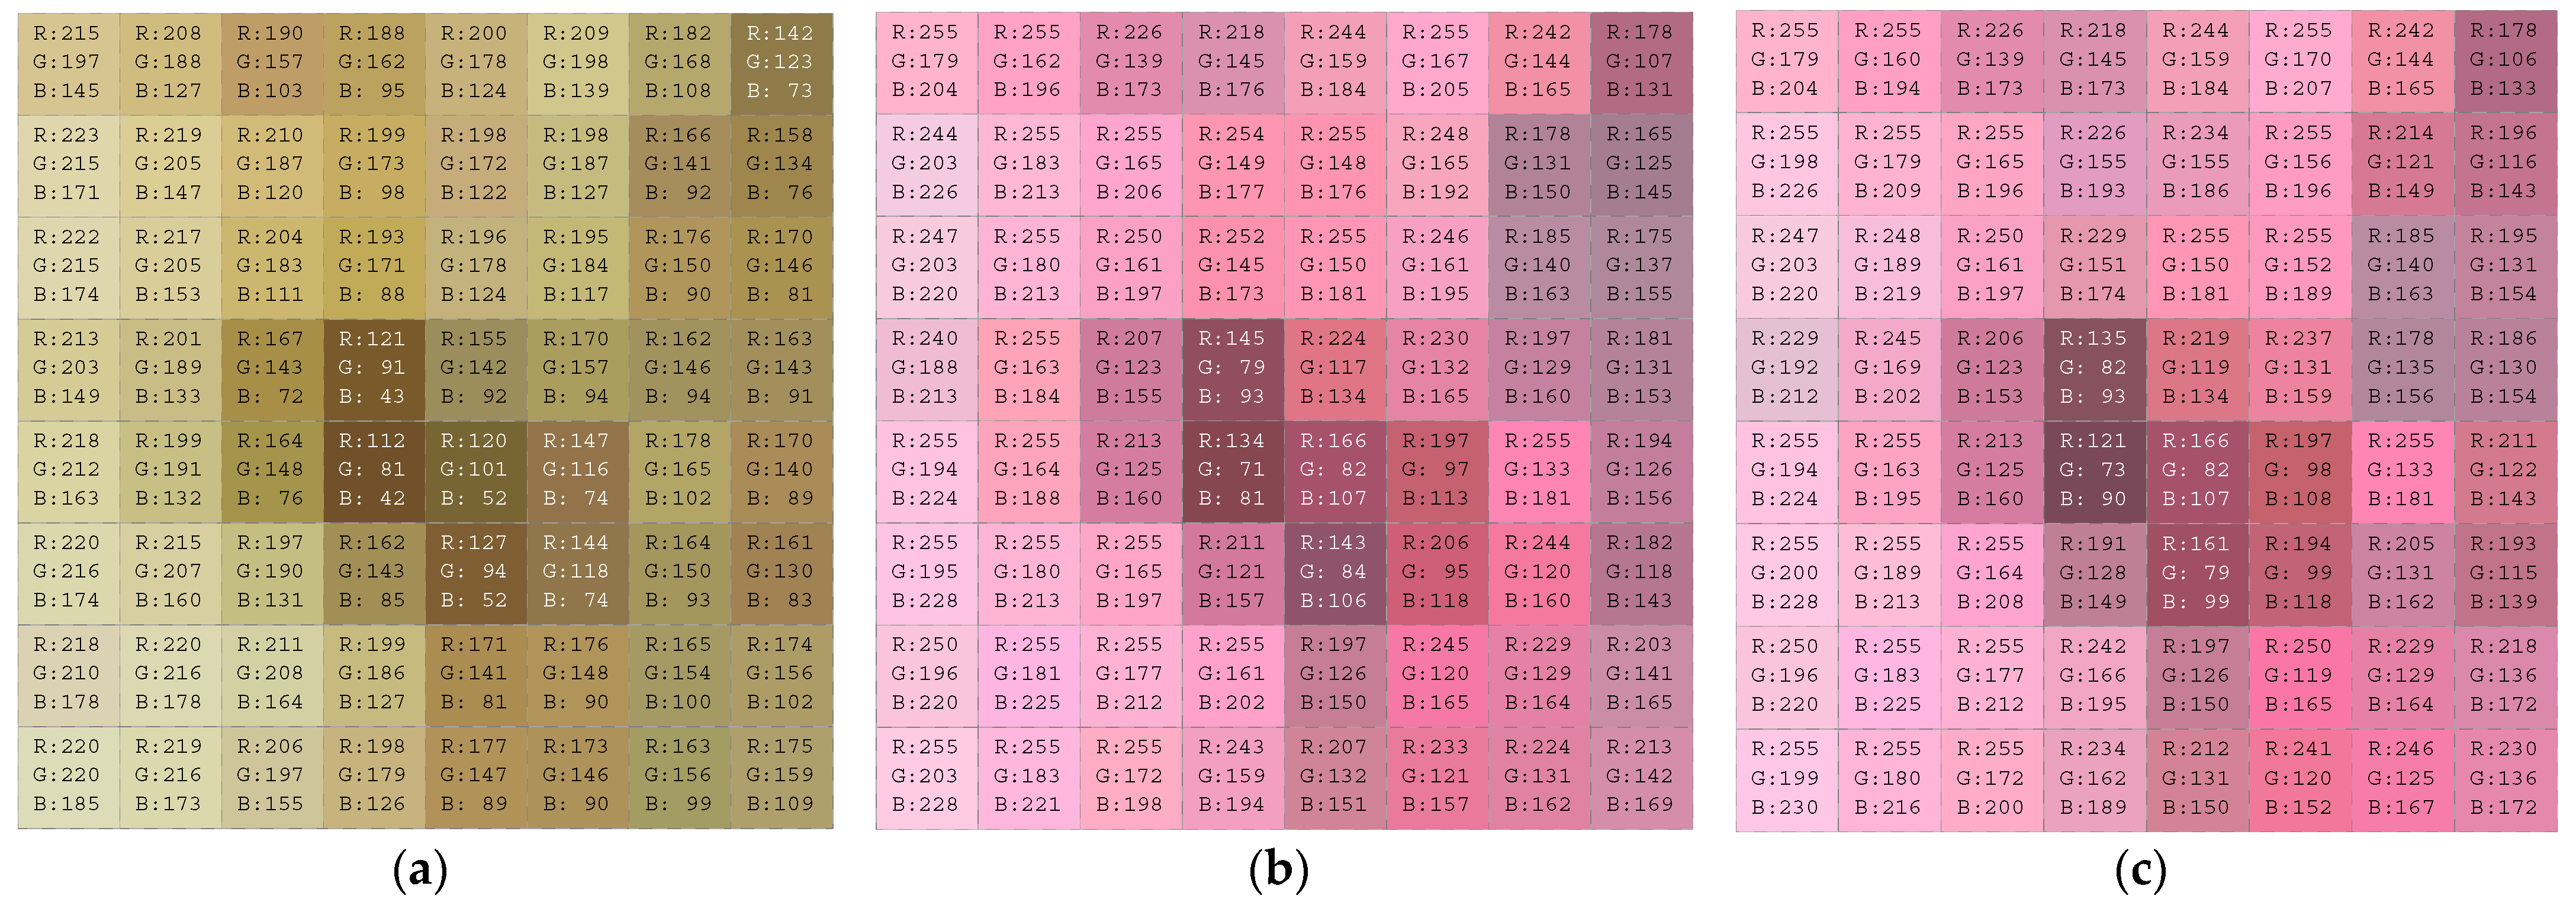
In the sequency domain, the way in which the saturation of the color image changes its magnitude is shown in Figure 1. For example,
X ( k 1 , k 2 ) = A * ( k 1 , k 2 ) + j B * ( k 1 , k 2 )
The real part is A * ( k 1 , k 2 ) and the imaginary part is j B * ( k 1 , k 2 ) . The RI_ratio is the real/imaginary ratio, as in:
R I _ R a t i o ( k 1 , k 2 ) = Re a l / Im a g i n a r y
X ( k 1 , k 2 ) = A * ( k 1 , k 2 ) + R I _ R a t i o ( k 1 , k 2 ) X ( k 1 , k 2 ) = j B * ( k 1 , k 2 ) + t h r }
X ( k 1 , k 2 ) = A * ( k 1 , k 2 ) + t h r X ( k 1 , k 2 ) = j B * ( k 1 , k 2 ) + R I _ R a t i o ( k 1 , k 2 ) }
A change in saturation of the color image is observed from brighter shades to dull shades. This depends on the threshold value ‘thr’ that is added to the real or imaginary parts of the coefficients, and it depends on the condition.
Equations (7a) and (7b) shows the variation in the saturation in the sequency domain using CS-SCHT. Figure 2a shows an 8 × 8 block of an image. Figure 2b,c are transform images using DFT and CS-SCHT, respectively. They show that saturation varies with varying threshold values. Meanwhile, Figure 3a is a 512 × 512 image titled “house.tiff”, and is processed using DFT and CS-SCHT, as shown in Figure 3b,c, respectively.

3.3. Change in Hue

Hue is a characteristic of the human eye’s perception of colors [20]. Sometimes, different colors have the same hue, but with dull or brighter saturation, different shades of the same color can be seen. The hues in CIE La*b* are red, yellow, green, and blue. Hue is measured in the transform domain: θ = tan 1 ( B * ( k 1 , k 2 ) / A * ( k 1 , k 2 ) ) .
A change in hue is observed as shown in Figure 4, by interchanging the real and imaginary values of the sequency domain coefficients as follows:
Re a l = B * ( k 1 , k 2 )
Im a g i n a r y = j * A * ( k 1 , k 2 )
θ = tan 1 ( A * ( k 1 , k 2 ) / B * ( k 1 , k 2 ) )
Equation (10) shows the changes in colors; this is shown in Figure 5a in 8 × 8 block images, whereas Figure 5b,c are DFT- and CS-SCHT-processed images. The values of the pixels show the variation in the R, G, and B color planes due to changes in the real and imaginary parts of the coefficients. CIE La*b* provides red–green along real axis and yellow–blue along imaginary axis.
Therefore, by interchanging the values, the CIE La*b* coordinates changed from red–green to yellow–blue and vice versa. Figure 6a,b show the changes in hue with both transforms, respectively. The CS-SCHT simulation was performed without multiplying the normalizing factor with CS-SCHT.

4. Conclusions

In this paper, changes in saturation and hue were analyzed with respect to the magnitude and phase angle of the transformed spectra. The ratio of the real and imaginary values of the coefficients shows the dullness and brightness in the color image without affecting the color of image. In a similar way, without affecting the saturation, the hue value is altered by swapping the axis of the color space in the sequency and frequency domains.
This work may be applied in digital color-image watermarking using different chromaticity planes. Watermarks could be inserted in the saturation part by considering the challenging parameters of the watermarking and steganography algorithms. They could be applied using color-image pattern-matching applications. The Complex Hadamard Transform and its variant need to be investigated for other applications in the fields of digital images and signal processing.

Author Contributions

D.-e.-J. worked on the concept of this study, data analysis and wrote the manuscript; T.K. performed the MATLAB code; S.A. (Samiya Asghar) helped to write the constructive discussions; S.A. (Sarah Ahmed) and Y.Z. contributed to the manuscript preparation. All authors have read and agreed to the published version of the manuscript.

Funding

No any funding agency is involved in this research study.

Institutional Review Board Statement

Under this study no any human subject involved therefore IRB assessment is not vaild for it.

Informed Consent Statement

All the authors have agreed and collectively worked.

Data Availability Statement

MATLAB is used to analyze the images used in this research paper are available at http://www.imageprocessingplace.com/root_files_V3/image_databases.htm (accessed on 20 June 2022).

Conflicts of Interest

The authors declare that they have no conflict of interest.

References

  1. Aye, A.; Boon Poh, N.; Rahardja, S. Conjugate Symmetric Sequency-Ordered Complex Hadamard Transform. IEEE Trans. Signal Process. 2009, 57, 2582–2593. [Google Scholar] [CrossRef]
  2. Aung, A. Sequency-Ordered Complex Hadamard Transforms And Their Applications To Communications And Signal Processing. Ph.D. Thesis, School of EEE, Nanyang Technological University, Singapore, 2009. [Google Scholar]
  3. Jabeen, D.; Monir, G.; Azim, F. Sequency Domain Signal Processing Using Complex Hadamard Transform. Circuits Syst. Signal Process. 2016, 35, 1783–1793. [Google Scholar] [CrossRef]
  4. Davidoff, J. Color perception. In The Handbook of Brain Theory and Neural Networks; Arbib, M.A., Ed.; MIT Pres: Cambridge, MA, USA, 1995; pp. 210–215. [Google Scholar]
  5. Carevic, D.; Caelli, T. Region-based coding of colour images using the Karhunen–Loeve transform. Graph. Models Image Process. 1997, 59, 27–38. [Google Scholar] [CrossRef] [Green Version]
  6. Gonzalez, R.C.; Woods, R.E. Digital Image Processing; Pearson Prentice Hall: Hoboken, NJ, USA, 2002. [Google Scholar]
  7. Xu, H.; Chen, Y. A Technique for Simulating Pseudo Natural Color Images Based on Spectral Similarity Scales. IEEE Geosci. Remote Sens. Lett. 2012, 9, 70–74. [Google Scholar] [CrossRef]
  8. Zhao, Z.; Mingbo, Z.; Bing, L.; Peng, T. ColorPCA: Color principal feature extraction technique for color image reconstruction and recognition. In Proceedings of the 2013 International Joint Conference on Neural Networks (IJCNN), Dallas, TX, USA, 4–9 August 2013; pp. 1–7. [Google Scholar]
  9. Nakai, K.; Hoshi, Y.; Taguchi, A. Color image contrast enhacement method based on differential intensity/saturation gray-levels histograms. In Proceedings of the 2013 International Symposium on Intelligent Signal Processing and Communications Systems (ISPACS), Naha, Japan, 12–15 November 2013; pp. 445–449. [Google Scholar]
  10. Wirth, M.; Nikitenko, D. The Effect of Colour Space on Image Sharpening Algorithms. In Proceedings of the 2010 Canadian Conference on Computer and Robot Vision (CRV), Ottawa, ON, Canada, 31 May–2 June 2010; pp. 79–85. [Google Scholar]
  11. Montenegro, J.; Gomez, W.; Sanchez-Orellana, P. A comparative study of color spaces in skin-based face segmentation. In Proceedings of the 2013 10th International Conference on Electrical Engineering, Computing Science and Automatic Control (CCE), Mexico City, Mexico, 30 September–4 October 2013; pp. 313–317. [Google Scholar]
  12. InternationalCommission on Illumination. CIE 15: Technical Report: ‘Colorimetry’, 3rd ed.; The Office of the Federal Register: Washington, DC, USA, 2004. [Google Scholar]
  13. Robertson, A.R. The CIE 1976 Color-Difference Formulae. Color Res. Appl. 1977, 2, 7–11. [Google Scholar] [CrossRef]
  14. Wandell, B.A. Foundations of Vision; Sinauer Associates: Sunderland, MA, USA, 1995. [Google Scholar]
  15. Konovalenko, I.A.; Smagina, A.A.; Nikolaev, D.P.; Nikolaev, P.P. ProLab: A Perceptually Uniform Projective Color Coordinate System. IEEE Access 2021, 9, 133023–133042. [Google Scholar] [CrossRef]
  16. A Guide to Undersatnd the Color Communication. Available online: https://www.google.com.pk/webhp?sourceid=chrome-instant&ion=1&espv=2&ie=UTF-8#q=A+Guide+to+Understanding+Color+Communication+X-Rite%2C+Incorporated+2007 (accessed on 20 March 2022).
  17. Dou, Z.; Wang, N.; Li, B.; Wang, Z.; Li, H.; Liu, B. Dual Color Space Guided Sketch Colorization. IEEE Trans. Image Process. 2021, 30, 7292–7304. [Google Scholar] [CrossRef] [PubMed]
  18. Wu, J.; Wang, L.; Yang, G.; Senhadji, L.; Luo, L.; Shu, H. Sliding Conjugate Symmetric Sequency-Ordered Complex adamard Transform: Fast Algorithm and Applications. IEEE Trans. Circuits Syst. I Regul. Pap. 2012, 59, 1321–1334. [Google Scholar] [CrossRef] [Green Version]
  19. Wu, J.; Wu, F.; Dong, Z.; Song, K.; Kong, Y.; Senhadji, L.; Shu, H. Fast Gray Code Kernel Algorithm for the Sliding Conjugate Symmetric Sequency-Ordered Complex Hadamard Transform. IEEE Access 2018, 6, 56029–56045. [Google Scholar] [CrossRef]
  20. Kinoshita, Y.; Kiya, H. Hue-Correction Scheme Based on Constant-Hue Plane for Deep-Learning-Based Color-Image Enhancement. IEEE Access 2020, 8, 9540–9550. [Google Scholar] [CrossRef]
Figure 1. Change in saturation by changing magnitude.
Engproc 20 00036 g001
Figure 2. Change in saturation by changing magnitude, 8 × 8 image block: (a) original image, (b) DFT-processed image, and (c) CS-SCHT-processed image.
Engproc 20 00036 g002
Figure 3. Change in saturation by changing magnitude, 512 × 512 image: (a) original image, (b) DFT-processed image, and (c) CS-SCHT-processed image.
Engproc 20 00036 g003
Figure 4. Change in hue by changing phase angle.
Engproc 20 00036 g004
Figure 5. Change in color by changing magnitude: (a) 8 × 8 image block, (b) DFT-processed image, (c) CS-SCHT-processed image.
Engproc 20 00036 g005
Figure 6. Change in hue: (a) DFT-processed image, (b) CS-SCHT-processed image.
Engproc 20 00036 g006
Publisher’s Note: MDPI stays neutral with regard to jurisdictional claims in published maps and institutional affiliations.

