Proceeding Paper

Technical and Economic Viability Analysis of Optical Fiber Sensors for Monitoring Industrial Bioreactors †

by
Marco César Prado Soares
1,*,
Thiago Destri Cabral
1,
Beatriz Ferreira Mendes
1,2,
Vitor Anastacio da Silva
2,
Elias Basile Tambourgi
2 and
Eric Fujiwara
1
1
School of Mechanical Engineering, University of Campinas, São Paulo 13083-860, Brazil
2
School of Chemical Engineering, University of Campinas, São Paulo 13083-852, Brazil
*
Author to whom correspondence should be addressed.
Presented at the 7th International Electronic Conference on Sensors and Applications, 15–30 November 2020; Available online: https://ecsa-7.sciforum.net/.
Eng. Proc. 2020, 2(1), 57; https://doi.org/10.3390/ecsa-7-08161
Published: 14 November 2020
(This article belongs to the Proceedings of 7th International Electronic Conference on Sensors and Applications)

Abstract

:
Bioreactors are employed in several industries, such as pharmaceutics, energy, biomedic and food. To ensure the proper operation of these bioreactors, Enzyme-Linked Immunosorbent Assay (ELISA) and High-Performance Liquid Chromatography (HPLC) systems are commonly used. Although ELISA and HPLC provide very precise results, they are incapable of real-time monitoring and present high operational costs. Given this context, in this work, we discuss the technical and economic viability of implementing fiber optics-based monitoring systems in lieu of traditional ELISA and HPLC systems. We selected fed-batch ethanol fermentative systems for our analysis, as the fed-batch mode is not only prevalent in different fermentative industries, but ethanol production represents a major sector of the Brazilian economy, with annual production in excess of 35 billion liters. Then, a simple fiber sensing system for measuring the refractive index of the fermentation broth, capable of real-time monitoring the fermentation process, is proposed and the advantages of the real-time process control are discussed. Afterward, we present the long-term economic gains of implementing such a system. We estimate that, by using readily commercially available components, the typical Brazilian ethanol plants will see a return for their investment in a time as short as 50 days, with a 5-year Internal Rate of Return (IRR) of 742%/year by setting up a fiber-optic monitoring system over HPLC. With the provided list of components, these numbers can be easily adjusted for industries worldwide, providing incredibly attractive economic prospects.

1. Introduction

Bioprocesses are relevant to different industries, including pharmaceutics, energy, biomedicine and food [1]. However, these processes are still difficult to monitor. Their assessment is usually performed by techniques unsuitable for automatic control, like microscopes, centrifuges, spectrophotometers, etc. [2,3]. Many traditional procedures, such as the quantifying of the dry mass from the broth, or evaluating the glucose concentration with colorimetric assays [4] are based on manual and time-consuming procedures [2]. More accurate techniques which are capable of evaluating multiple parameters, like high-performance liquid chromatography (HPLC), gas chromatography coupled to mass spectrometry (GC-MS), and the enzyme-linked immunosorbent assay (ELISA) are also widely applied to chemical and biochemical analysis, since they are sensitive and reliable. However, they require expensive and bulky instrumentation, highly specialized technicians, and procedures that are hard to automate and to use in field analysis. The best alternative, then, is to apply in-line sensors, which allow obtaining useful data with shorter operation times, with applications not only in the monitoring, but also in the preliminary screening prior to the investment on more precise equipment [3,5]. An interesting approach in this context is the use of optical fiber sensors (OFSs), since they are biocompatible, immune to electromagnetic interference, and show chemical and thermal stability, and lower fabrication costs, being suitable for the mass-fabrication of devices [3,6,7].
In this work, then, the technical and economic viability of implementing fiber optics fed-batch ethanol fermentation systems are analyzed and compared to traditional ELISA and HPLC systems. These particular bioreaction and operation mode were selected because the fed-batch is not only very prevalent in different fermentation industries, but ethanol production represents a major sector of the Brazilian economy, with annual production in excess of 35 billion liters [8,9]. A simple fiber sensing system is proposed and the advantages of real-time process control are verified. Finally, there are important economic aspects regarding the photonic industry itself which make it attractive for new investments such as the one proposed in this work. Only in the United Kingdom, in 2017, it was estimated that this industry sector contributed more than GBP 12.9 billion, with an annual growth rate over 5%. It also employed more than 65,000 people, with at least 75% of the production destined for exportation [10]. These data clearly show the potential of developing low-cost photonic sensors.

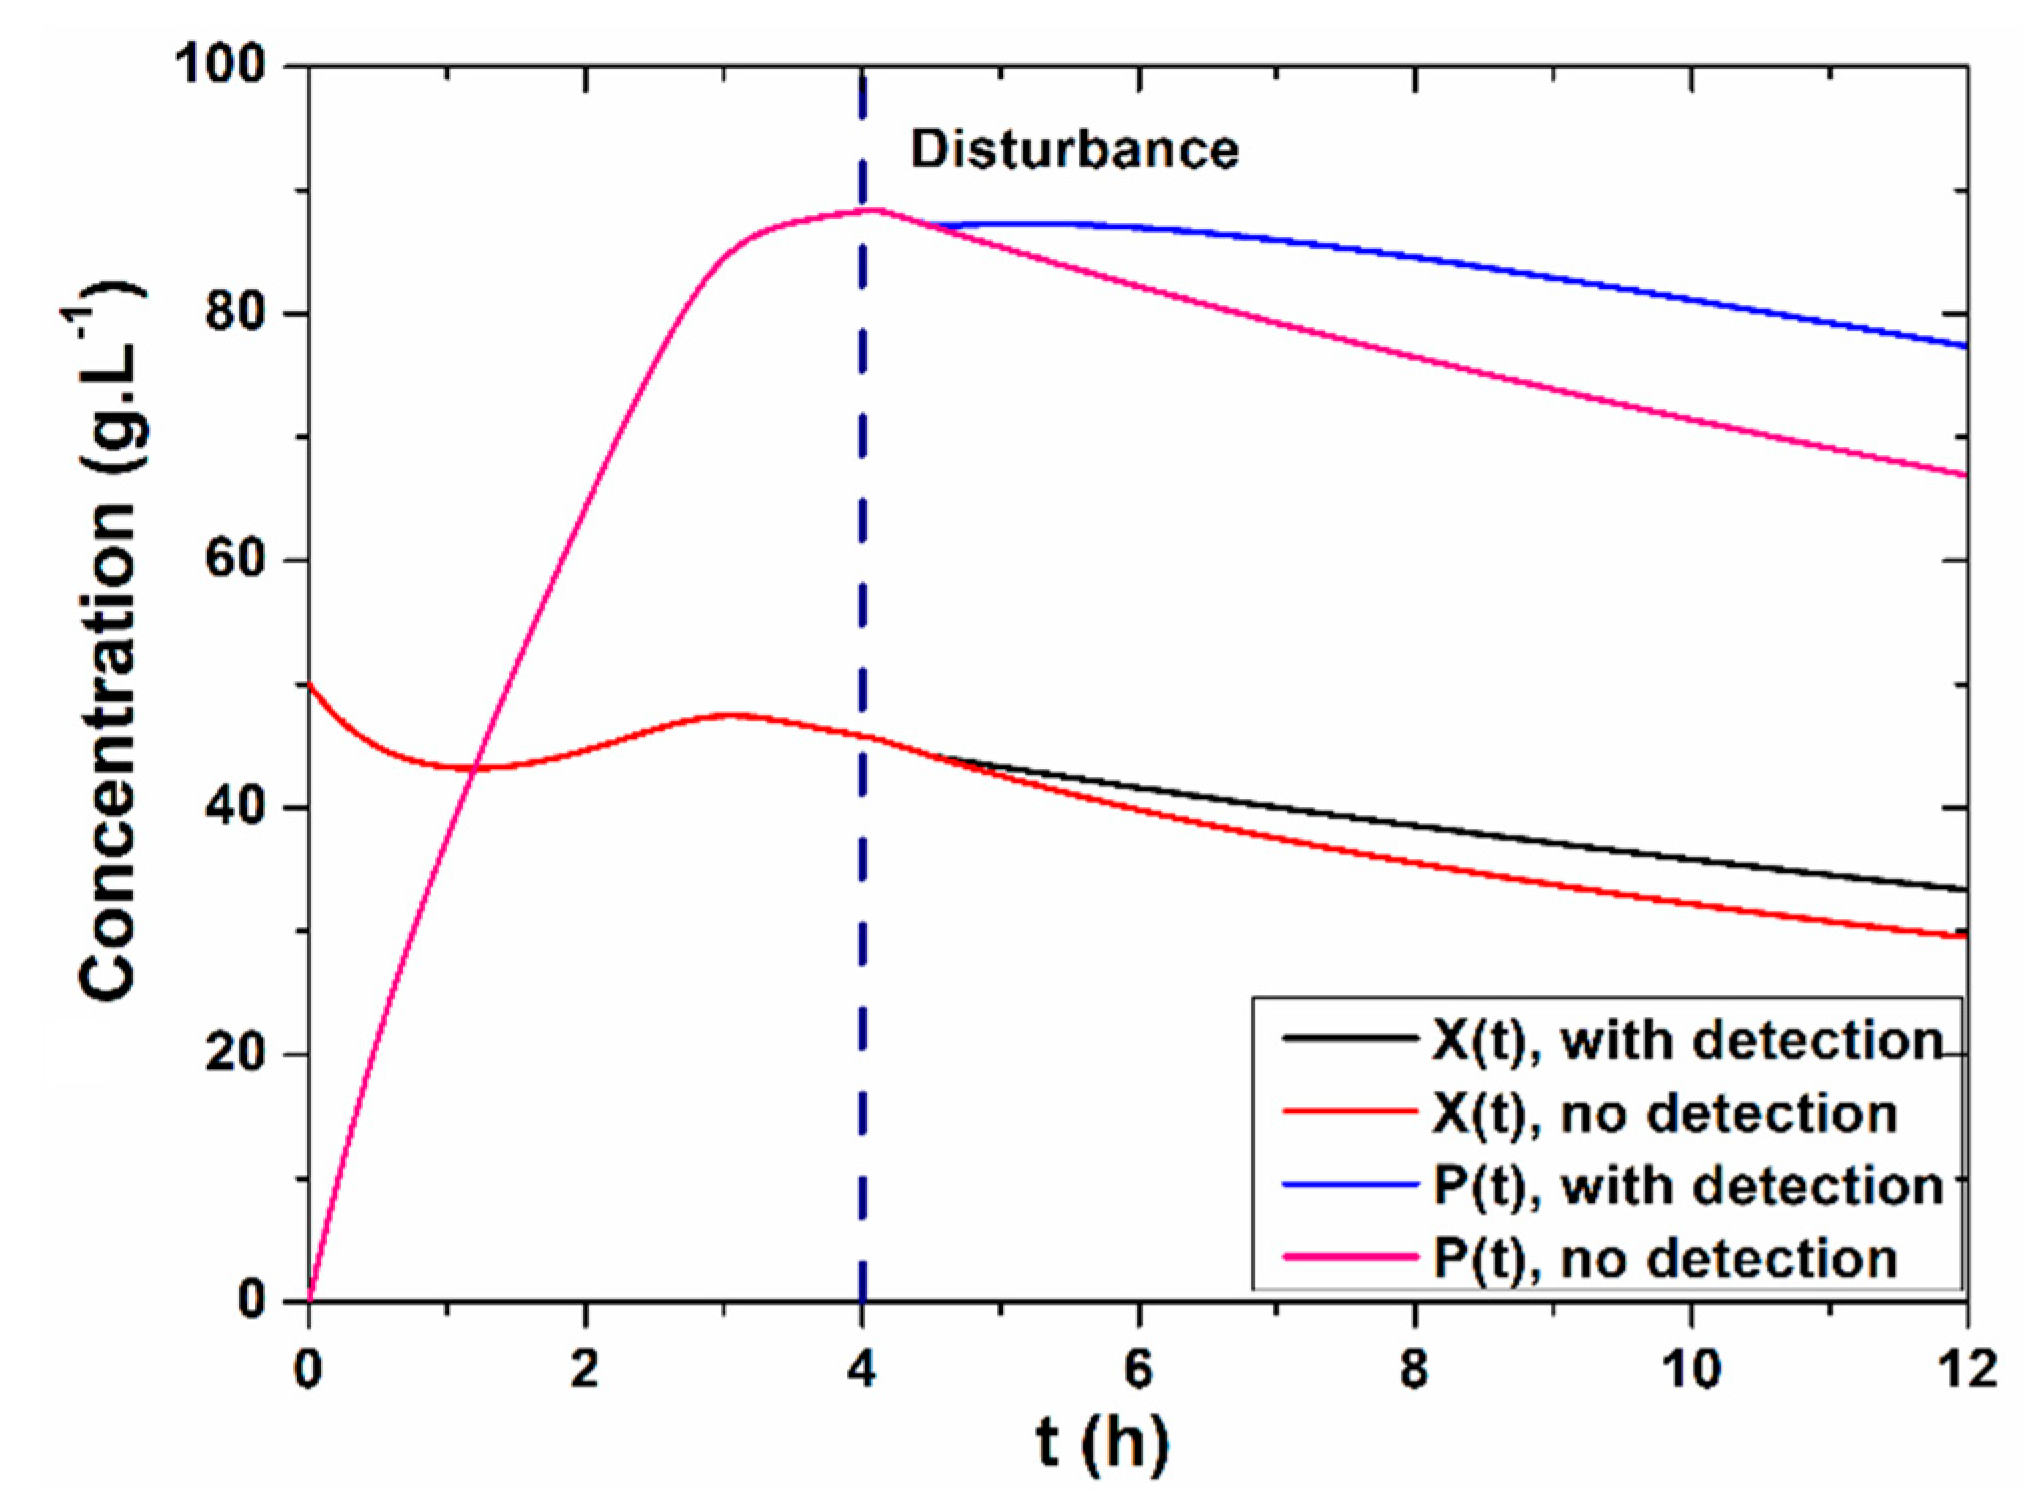
2. Real-Time Monitoring of Fed-Batch Bioreactors with Optical Fibers

2.1. Benefits of Real-Time Monitoring over HPLC

To demonstrate the benefits of monitoring ethanol bioreactors in real-time, we conducted a simulation study of a fed-batch reactor subjected to a disturbance. The model is derived from the general fermentative reaction X + S P + ( X + Δ X ) , where X is the concentration of the microorganisms (Saccharomyces cerevisiae), S is the substrate concentration, P is the products concentration (ethanol) and Δ X is an increase in cell concentration due to reproduction. [2,3,11]. Applying the Monod model [2,11], we arrive at the set of Equations (1) to (4) below [12], where μ s is the specific rate of substrate consumption, μ is the specific cell growth rate and q p is the specific rate of product formation. On fed-batch operation mode, the reaction is started with initial concentrations X 0 , P 0 and S 0 , and an initial volume of fermentation broth V 0 . A constant feed flow F supplies the reactor with a fresh substrate suspension, with concentration of substrate S F .
d V / d t = F V = V 0 + F
d X / d t = μ X F X / V
d P / d t = q p X F P / V
d S / d t = μ s X + F ( S F S ) / V
Figure 1 shows the simulation results for the concentration of cells X and products P for a fed-batch reactor operation at 33 °C (temperature for maximum cell growth [3]) and with X 0 = 50 gL−1, P 0 = 0, S 0 = 30 gL−1, V 0 = 1 L, F = 0.66 Lh−1 and S F = 192 gL−1. After 4 h of the process start, a disturbance in the form of a feed failure decreases S F to 160 gL−1 is verified. Without real-time monitoring, such as when using HPLC for process control, X follows the red curve and P the pink curve, but if in-line real-time instrumentation can detect the disturbance and S F is restored to the original levels just after 20 min, X and P follow the black and blue branching curves instead, respectively. After a 12 h cycle, this represents an 11.6% reduction in the concentration of cells and a 13.5% reduction in ethanol production for the system without real-time monitoring in relation to one with the in-line real-time assessment. These are very significant differences that clearly highlight the potential economic gain of a real-time sensing setup.

2.2. Instrumentation Setup and Costs

For instrumentation costs estimates, we will be considering the fiber optic reflectometer setup depicted in Figure 2. We previously proposed it for the evaluation of: silica nanofluids [13]; fast screening of microbial growth parameters [3]; and batch bioreactors [14].
In this setup, light from a 1310 nm laser is guided to the bioreactor by a single-mode optical fiber submerged in the fermentation broth. The luminous signal is partially reflected in the fiber/broth interface and is directed to a photodetector using a fiber optic coupler or circulator. The intensity of the reflected signal is given by Equation (5), which is Fresnel’s equation [15], where I R is the reflected signal intensity, I 0 is the emitted light intensity, k is a coupling coefficient that accounts for optical losses, and n f and n b are the refractive indexes of the optical fiber and fermentation broth, respectively. As demonstrated before in [14], n b is directly related to S and P concentrations in the broth, and therefore can be used as the monitoring parameter.
I R = k · I 0 [ ( n f n b ) ( n f + n b ) ] 2
Table 1 contains a list of all necessary components to implement the setup shown in Figure 2, along with the cost per unit and supplier. The total cost in Brazilian Reais (BRL) and United States Dollars (USD) is presented in the last row: an exchange rate of 5.48 BRL to 1 USD (June 2020) was used.
Aside from the individual components, qualified personnel are required to supervise the implementation of the optical fiber reflectometer. To that end, we are also considering in our calculations the cost of hiring a qualified engineer for a six months period. According to Brazilian law 4.950-A/66, the minimum wage for a qualified chemical engineer is 9405.00 BRL (1716.24 USD) per month for an 8 h-working shift, corresponding to 56,430 BRL (10,297.45 USD) over 6 months, bringing the 1st-year cost of implementing the fiber optic sensing setup (components + qualified work) up to 85,443.11 BRL (15,591.80 USD).

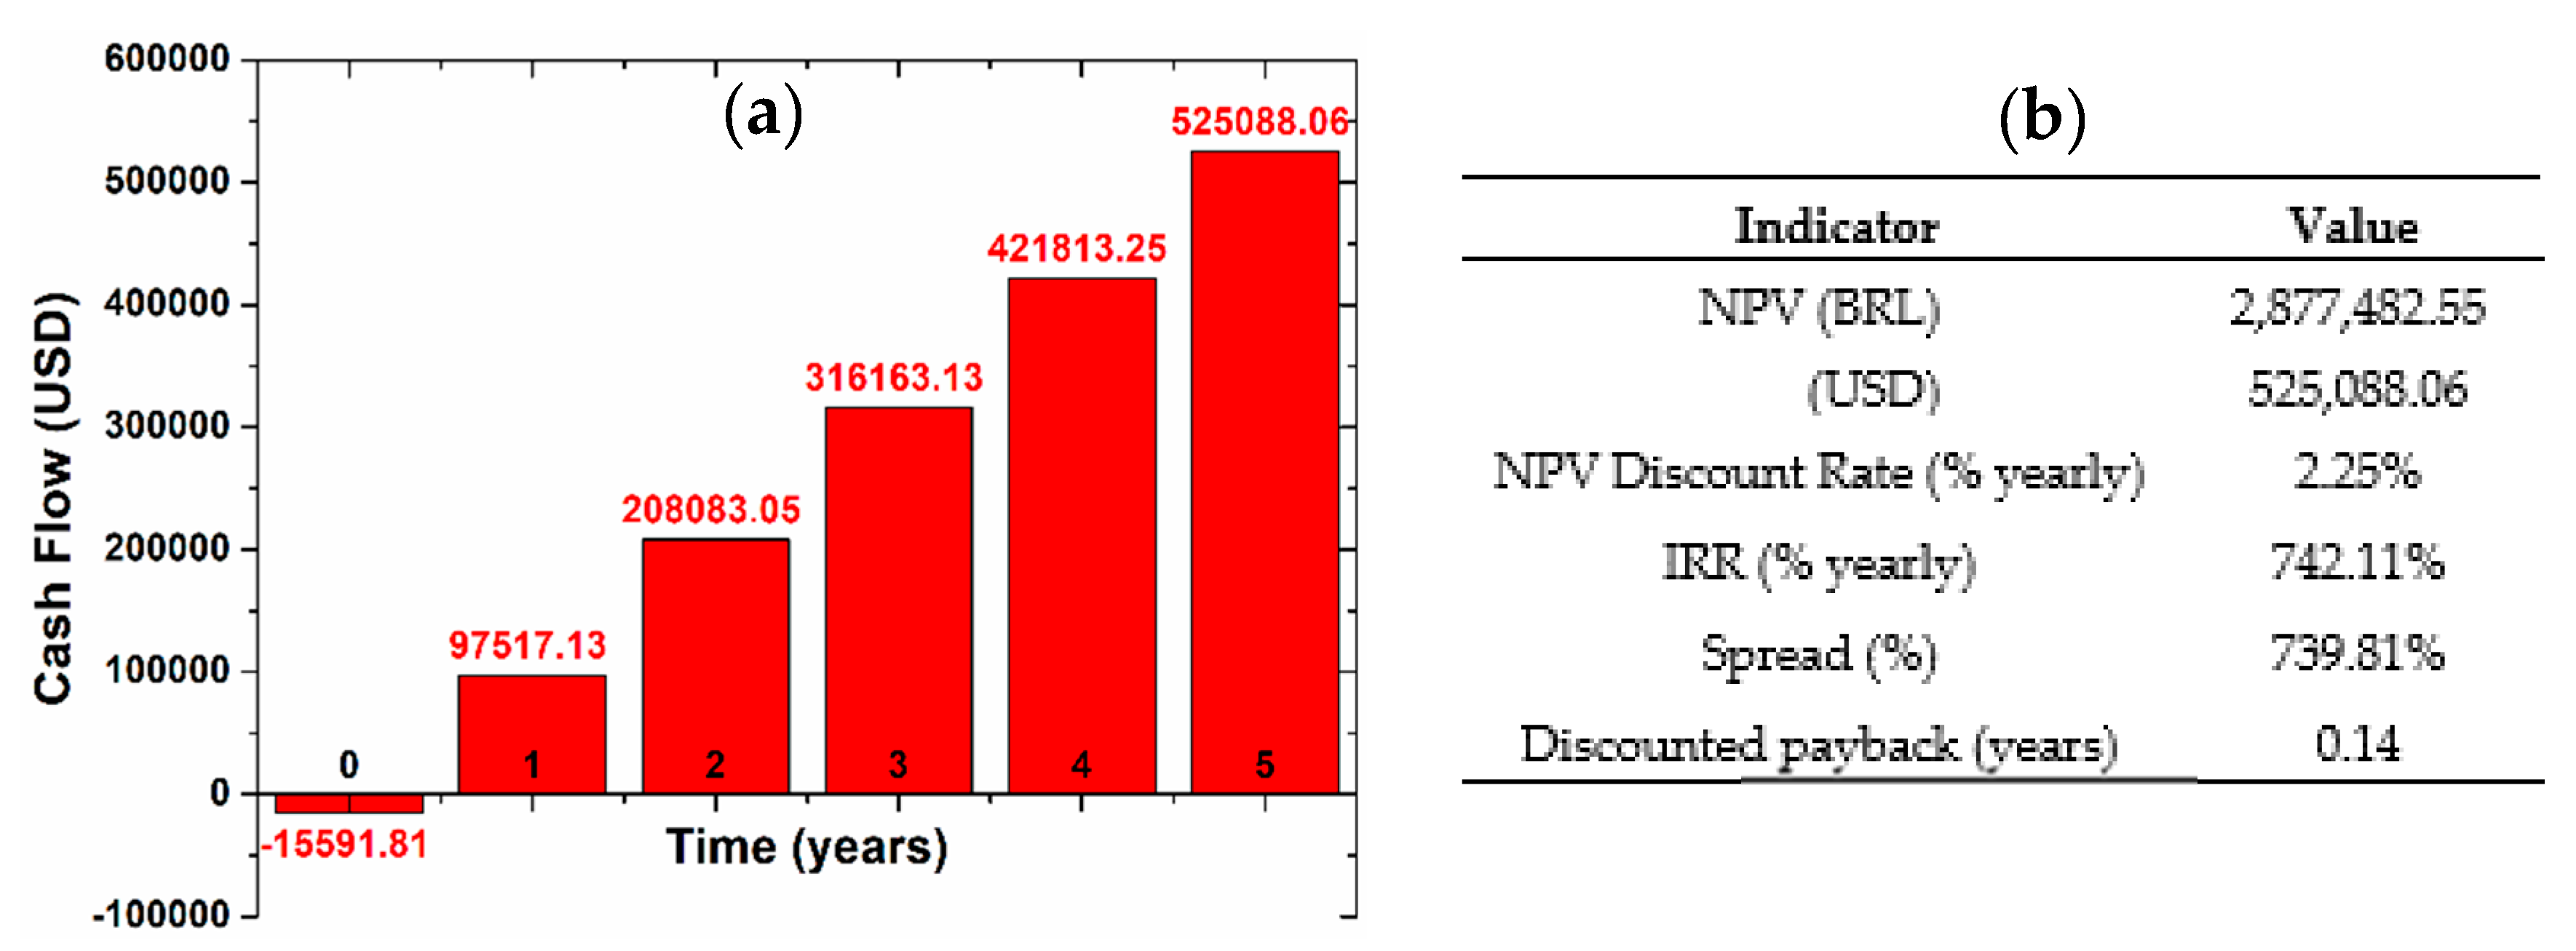
3. Economic Viability of Fiber Optics Sensing

Lastly, we must compare the costs of implementing the in-line optical fiber reflectometer with traditional HPLC analysis. We considered two scenarios: in the first scenario, an ethanol plant acquires their own HPLC equipment, but acquisition and maintenance costs for a chromatography column may be prohibitive; and so in the second scenario, the plant hires a third party specialized in providing HPLC analysis services.
For the first scenario (acquiring HPLC equipment), we contacted several suppliers and arrived at an average cost of 27,500.00 USD (150,700.00 BRL) for refurbished benchtop equipment, plus 200.00 USD/hour (1096.00 BRL/hour) installation costs. Acquisition and installation costs already far surpass those from acquiring all required components for the fiber optics setup, and the ethanol plant would still have to invest more resources to maintain a suitable stock of reagents for the HPLC column. As for the second scenario, on the Brazilian market, the average cost of contracting HPLC analysis services is of 100 BRL/hour (18.25 USD/hour). It is possible to estimate the yearly cost by considering the following assumptions: plant uptime = 200 days/year; batch runtime = 10 h [16]; number of analysis = 2/day; analysis runtime = 24 h. This returns a total cost of 960.000 BRL/year (175,182.48 USD/year). Table 2 summarizes the cost comparison between HPLC and in-line fiber optic sensing regarding the acquisition and 1st-year operation costs.
Finally, we can use this data to calculate, with a Weighted Average Capital Cost (WACC) model [17], the 5-year cash flow of an ethanol plant after implementation of the fiber optic instrumentation in detriment of contracting HPLC services (Figure 3a). From Figure 3a we can see a Net Present Value (NPV), which is the net cash flow, of 525,088.06 USD (2,877,482.55 BRL) over 5 years.
Considering a depreciation rate of 20% per year and an NPV discount rate of 2.25% per year (current 2020 Brazilian rate as per Brazil’s Central Bank—BACEN), we can calculate an Internal Rate of Return (IRR), an estimate of the profitability of the investment in the fiber optic platform, of 742.11%/year. Furthermore, the discounted payback (amount of time for the investment to pay for itself) can be calculated as 0.14 years (approximately 50 days) after the first year necessary to assembly the sensing system and to perform the tests necessary for guaranteeing its correct and reliable operation. These financial indicators are summarized in Figure 3b.
For the sake of completeness, we also provide a quick assessment of alternative solutions to HPLC and the proposed fiber optic reflectometer, in the case where the industry only wishes to access glucose concentration in the fermentation broth. There are two main choices in this case: an optical density measurement with a spectrophotometer, or the use of colorimetric kits such as [4]. Spectrophotometers are available for reasonably low prices starting at only a few thousand dollars, but come with the disadvantages of requiring regular sampling of the broth, and the measurements are not as direct, since different concentrations of other components will also affect the optical density. As for colorimetric kits, taking samples of the broth in regular intervals is also required, and if each test should be conducted once an hour (which is simple to do with the optical fiber setup), we can estimate costs as such: each kit in [4] can be used for analyzing 20 samples. Considering 12 analysis/day, 200 days per year, it results in total usage of 120 kits per year, or about 9360.00 USD/year (51,292.80 BRL/year) in costs. In this scenario, the costs of the kits alone, not including inflation and other required consumables or analytical equipment, is almost twice the costs of acquiring all the components for the fiber optic reflectometer. It is clear the fiber optic sensing approach is still very attractive when compared to optical density and colorimetric analysis.

4. Conclusions

The economic analysis clearly demonstrates considerable medium- and long-term financial gains from implementing fiber optic systems for monitoring fed-batch bioreactors as a substitute for traditional HPLC analysis. The average Brazilian ethanol plant is expected to see a return for their investment in about 50 days, together with a 5-year NPV of 525,088.06 USD, corresponding to an IRR of 742%/year. While these results are most accurate for ethanol plants operating in Brazil, similar results are expected for any industry worldwide that utilizes HPLC for monitoring their bioreactors, as the proposed fiber-optic setup is comparatively a very low-cost analytical solution which does not demand highly trained personnel to operate and maintain it. It is also worth mentioning that fiber optic systems are highly flexible and can be adapted to most industrial needs using commercially available components, being able to detect from sucrose to biomass concentration [3,12,13,14].

Author Contributions

M.C.P.S. and T.D.C. wrote the manuscript; B.F.M. and V.A.d.S. performed the economic analysis under the guidance of M.C.P.S., T.D.C. and E.B.T.; E.B.T. and E.F. provided funding and instrumentation support; all authors reviewed the paper and discussed the results. All authors have read and agreed to the published version of the manuscript.

Funding

This research was funded by São Paulo Research Foundation (FAPESP) under grant 2019/22554-4, CNPq and Capes (Finance Code—001).

Conflicts of Interest

The authors declare no conflict of interest.

References

  1. Shuler, M.; Kargi, F. Bioprocess Engineering. Basic Concepts, 2nd ed.; Prentice Hall: Upper Saddle River, NJ, USA, 2002. [Google Scholar]
  2. Bailey, J.; Ollis, D. Biochemical Engineering Fundamentals; McGraw-Hill: New York, NY, USA, 1986. [Google Scholar]
  3. Soares, M.C.P.; Vit, F.F.; Suzuki, C.K.; De la Torre, L.G.; Fujiwara, E. Perfusion Microfermentor Integrated into a Fiber Optic Quasi-Elastic Light Scattering Sensor for Fast Screening of Microbial Growth Parameters. Sensors 2019, 19, 2493. [Google Scholar] [CrossRef] [PubMed]
  4. Merck Sigma Aldrich. Glucose (GO) Assay Kit. Available online: https://www.sigmaaldrich.com/catalog/product/sigma/gago20 (accessed on 6 August 2020).
  5. Ju, H.; Kandimalla, V.K. Electrochemical Sensors, Biosensors and their Biomedical Applications; Zhang, X., Ju, H., Wang, J., Eds.; Elsevier: Amsterdam, The Netherlands, 2008. [Google Scholar]
  6. Li, X.; Nguyen, L.V.; Zhao, Y.; Ebendorff-Heidepriem, H.; Warren-Smith, S.C. High-sensitivity Sagnac-interferometer biosensor based on exposed core microstructured optical fiber. Sens. Act. B Chem. 2018, 269, 103–109. [Google Scholar] [CrossRef]
  7. Gong, C.; Gong, Y.; Chen, Q.; Rao, Y.-J.; Peng, G.-D.; Fan, X. Reproducible fiber optofluidic laser for disposable and array applications. Lab Chip 2017, 17, 3431–3436. [Google Scholar] [CrossRef] [PubMed]
  8. Souza, G.M.; Victoria, R.L.; Joly, C.A.; Verdade, L.M. (Eds.) Bioenergy and Sustentability: Bridging the Gaps; Scope—FAPESP—BIOEN—BIOTA—FAPESP Climate Change; SCOPE: São Paulo, Brazil, 2015. [Google Scholar]
  9. International Sugar Association (ISO). ISO Ethanol Yearbook 2019; ISO: Geneva, Switzerland, 2020. [Google Scholar]
  10. Optoelectronics Research Centre (Part of the Russell Group). Key Photonics Industry Facts (June 2017). Available online: https://www.orc.soton.ac.uk/who-we-are (accessed on 14 August 2020).
  11. Doran, P. Bioprocess Engineering Principles, 2nd ed.; Elsevier: Amsterdam, The Netherlands, 2013. [Google Scholar]
  12. Soares, M.C.P.; Luz, G.F.; Costa, A.C.; Gomes, M.K.; Mendes, B.F.; Torre, L.G.; Fujiwara, E. Saccharomyces cerevisiae Fed-Batch Fermentation and Artificial Intelligence Method for Adjusting Model Parameters to Experimental Data. Blucher Chem. Eng. Proc. 2018, 1, 2010–2014. [Google Scholar] [CrossRef]
  13. Soares, M.C.P.; Rodrigues, M.S.; Schenkel, E.A.; Perli, G.; Silva, W.H.A.; Gomes, M.K.; Fujiwara, E.; Suzuki, C.K. Evaluation of Silica Nanofluids in Static and Dynamic Conditions by an Optical Fiber Sensor. Sensors 2020, 20, 707. [Google Scholar] [CrossRef] [PubMed]
  14. Soares., M.C.P.; Fujiwara, E.; Gomes, M.K.; Mendes, B.F.; la Torre, L.G.; Suzuki, C.K. Application of Optical Fiber Sensor on Fermentation Monitoring. In Proceedings of the 26th International Conference on Optical Fiber Sensors, Lausanne, Switzerland, 24–28 September 2018. [Google Scholar] [CrossRef]
  15. Saleh, B.E.A.; Teich, M.C. Fundamentals of Photonics, 1st ed.; J. Wiley & Sons: Hoboken, NJ, USA, 1991. [Google Scholar] [CrossRef]
  16. Basso, L.C.; Basso, T.O.; Rocha, S.N. Biofuel Production. Recent Developments and Prospect; Bernardes, M.A.S., Ed.; IntechOpen: Rijeka, Croatia, 2011. [Google Scholar] [CrossRef]
  17. Damodaran, A. Damodaran on Valuation: Security Analysis for Investment and Corporate Finance, 2nd ed.; John Wiley & Sons: Hoboken, NJ, USA, 2011. [Google Scholar]
Figure 1. Temporal evolution of the concentration of Saccharomyces cerevisiae cells (X) and ethanol (P) after a disturbance is introduced with and without real-time detection and correction.
Engproc 02 00057 g001
Figure 2. Schematic representation of an optical fiber reflectometer setup for monitoring bioreactors.
Engproc 02 00057 g002
Figure 3. (a) 5-years cash flow results after implementing the fiber optic monitoring system as a substitute for HPLC. (b) Main financial indicators.
Engproc 02 00057 g003
Table 1. Estimated costs for each component of the fiber optic monitoring system.
ComponentPart NoCurrencyCost/UnitSupplier
1310 nm Benchtop SLD SourceS5FC1018SUSD3375.12Thorlabs
1310 nm CouplerTW1300R2A1USD398.22Thorlabs
1310 nm CirculatorCIR1310-APCUSD496.70Thorlabs
Switchable Gain Amplified DetectorPDA50B2USD568.12Thorlabs
50 MHz Digital OscilloscopeMVB-DSO-50BRL2500.00Minipa
Combined Cost-BRLUSD29,013.115294.36-
Table 2. Main cost comparison between High-Performance Liquid Chromatography (HPLC) and the Fiber Optic Reflectometer setup.
CostsHPLCFO ReflectometerCurrency
Acquisition150,700.00
27,500.00
29,013.11
5294.36
BRL
USD
1st-Year operation (third party hired)960,000.00
175,182.48
85,443.11
15,591.81
BRL
USD
Publisher’s Note: MDPI stays neutral with regard to jurisdictional claims in published maps and institutional affiliations.

