Proceeding Paper

A Sub-6 GHz Vital Signs Sensor Using Software Defined Radios †

Department of ECE, Florida Polytechnic University, Lakeland, FL 33805, USA
*
Author to whom correspondence should be addressed.
Presented at the 7th International Electronic Conference on Sensors and Applications, 15–30 November 2020; Available online: https://ecsa-7.sciforum.net/.
Eng. Proc. 2020, 2(1), 38; https://doi.org/10.3390/ecsa-7-08197
Published: 14 November 2020
(This article belongs to the Proceedings of 7th International Electronic Conference on Sensors and Applications)

Abstract

:
Recently, there has been high demand for contactless devices for monitoring vital signs, therefore developing a low-cost contactless breathing sensor would have a great benefit for many patients and healthcare workers. In this paper, we propose a contactless sub-6 GHz breathing sensor with an implementation using a low-cost universal software radio peripheral (USRP) B205-mini device. A detailed performance analysis of the proposed system with different sensor algorithms is presented. The proposed system estimates the channel phase shift and detects the presence of low frequency oscillations in the estimated phase shift. Compared to 24 or 77 GHz FMCW-radar-based systems using distance measurements, the proposed system is simpler, can be built using more economical RF components, and requires lower sampling frequencies. Another key advantage of the proposed system is that even a very narrow unused frequency band is enough for the operation of the sensor. When operated at frequencies shared by other devices, the proposed system can turn off the transmitter at randomly selected intervals to detect the presence of other transmission activities, and can then switch to a different operating frequency. We provide both Python- and Octave/MATLAB-based implementations, which are available in a public GitHub repository.

1. Introduction

Contactless vital signs detection and measurement is important problem for nursing homes and hospitals. There are various published papers using different kinds of radar techniques for contactless measurements, as well as optical techniques that are contact-based (see [1] and references therein). In this paper, we propose a low-cost channel phase-shift-estimation-based technique that can be easily implemented using commercial off-the-shelf components and software-defined radio (SDR) devices, more specifically a universal software radio peripheral (USRP) B205-mini device.
Use of SDR and USRP devices for prototying radar systems has been studied for some time, see [2,3] and the references therein. In [4], a wireless condition monitoring design is presented using microelectromechanical system (MEMS) sensors, in [5], a continuous-wave (CW) radar-based system is proposed for contactless monitoring, and in [6], another contactless microwave sensor is proposed for detection of vibrations. In [7], a digital signal processor system is proposed for Doppler radar sensing of vital signs. In [8], a multi-antenna-based contactless radar system is proposed for assessment of human respiration patterns. In [9,10], two different 77 GHz systems are proposed for remote monitoring of vital signs. Finally, [11] proposes a sub-6 GHz based noncontact vital signs sensor. Contrary to many reported systems, our proposed system is not based on distance measurements. It is based on channel phase shift estimation and does not require any kind of frequency sweep, which simplifies the RF subsystem considerably.
This paper is organized as follows: in Section 2 we describe the experimental setup and in Section 3 we present the implementation details. In Section 4, proposed features are presented with a detailed analysis of the performance of single feature-based classifiers. Finally, we make some concluding remarks in Section 5.

2. Experimental Setup

Our experimental setup is shown in Figure 1. There is laptop computer running Linux, a USRP-B205-mini, and two coffee can antennas. The USRP-B205-mini is a sub-6 GHz device, and has a tuneable phase-locked loop (PLL)-controlled local oscillator (LO). In this paper, we set the LO frequency to 3 GHz, however the LO frequency is a design parameter that will be investigated in a future version of the paper.
The high-level system block diagram is shown in Figure 2. On the transmitter side the signal x b ( t ) is chosen as a complex sinusoid of frequency approximately 20 kHz, and on the receiver side y b ( t ) is the received baseband signal. The proposed vital signs detector estimates the phase shift between x b ( t ) and y b ( t ) at a rate of 50 times per second, which is also a configurable design parameter. The baseband sampling frequency is set as 4 MHz, and is two orders of magnitude larger than the baseband analog signal frequency of 20 kHz.
The phase shift, θ , is estimated by comparing the peak values of FFTs of x b ( t ) and y b ( t ) , more precisely by division and conversion to polar format. Estimated phase shift values are then fed to a single-feature-based detector system. We propose the use of two different features and linear classifiers for vital signs detection. Estimation of vital parameters, like the breathing rate, are not addressed and will be investigated in a future version of the paper. In this paper, we focus on the binary classification problem for vital signs detection.

3. Implementation Details

We developed two different software packages for this research, which are available at the public GitHub repository https://github.com/onurtoker/vitalSigns.

3.1. Python and UHD Driver-Based Implementation

Our first approach is based on the UHD driver and Python, and does not use any GNU radio package or MATLAB/Octave-like high-level tools. Compared to a GNU radio and MATLAB/ Octave-based approach, our approach may be less user friendly, but it can show the estimated phase shift in a scope-like window in real-time. The current implementation available in the GitHub repository does not have a specific real-time feature extraction and classification method coded, however all of these can be added easily by using NumPy and SciPy libraries. For the research results presented in this paper, we first recorded data, i.e., θ values, and then tested different features and classifiers using an offline approach. In Table 1, we summarize the version numbers of the major software components used in the Python and UHD driver-based approach.

3.2. GNU Radio and Octave Implementation

Our second approach is based on higher level and more user-friendly tools: GNU radio and Octave. For the data transfer between a GNU radio graph and an Octave script, we used the ZMQ library, which is a standard high-performance asynchronous messaging library. The GNU radio graph used for this experiment is shown in Figure 3. The default transmitter frequency is 2.4 GHz, but we performed all experiments at 3 GHz. The optional XMLRPC block of the GNU radio allows the Octave script to change GNU radio graph parameters while the graph is running.

4. Proposed Features and Results

In this section, we will summarize the proposed features and the corresponding linear classifiers for vital signs detection. An the top of Figure 4, we have phase shift plots for three different positive cases, i.e., when there is breathing activity in front of the sensor (Class 1). Plots shown at the bottom of Figure 4 are for three different negative cases, i.e., when there is no motion or breathing activity around the sensor (Class 0). To be able to illustrate all data in fewer plots, we first remove the DC bias, and then level shift everything by a different amount to make sure that phase plots do not overlap. As is clear from Figure 4, phase plots for the positive cases (Class 1) look quite different compared to the negative cases (Class 0).

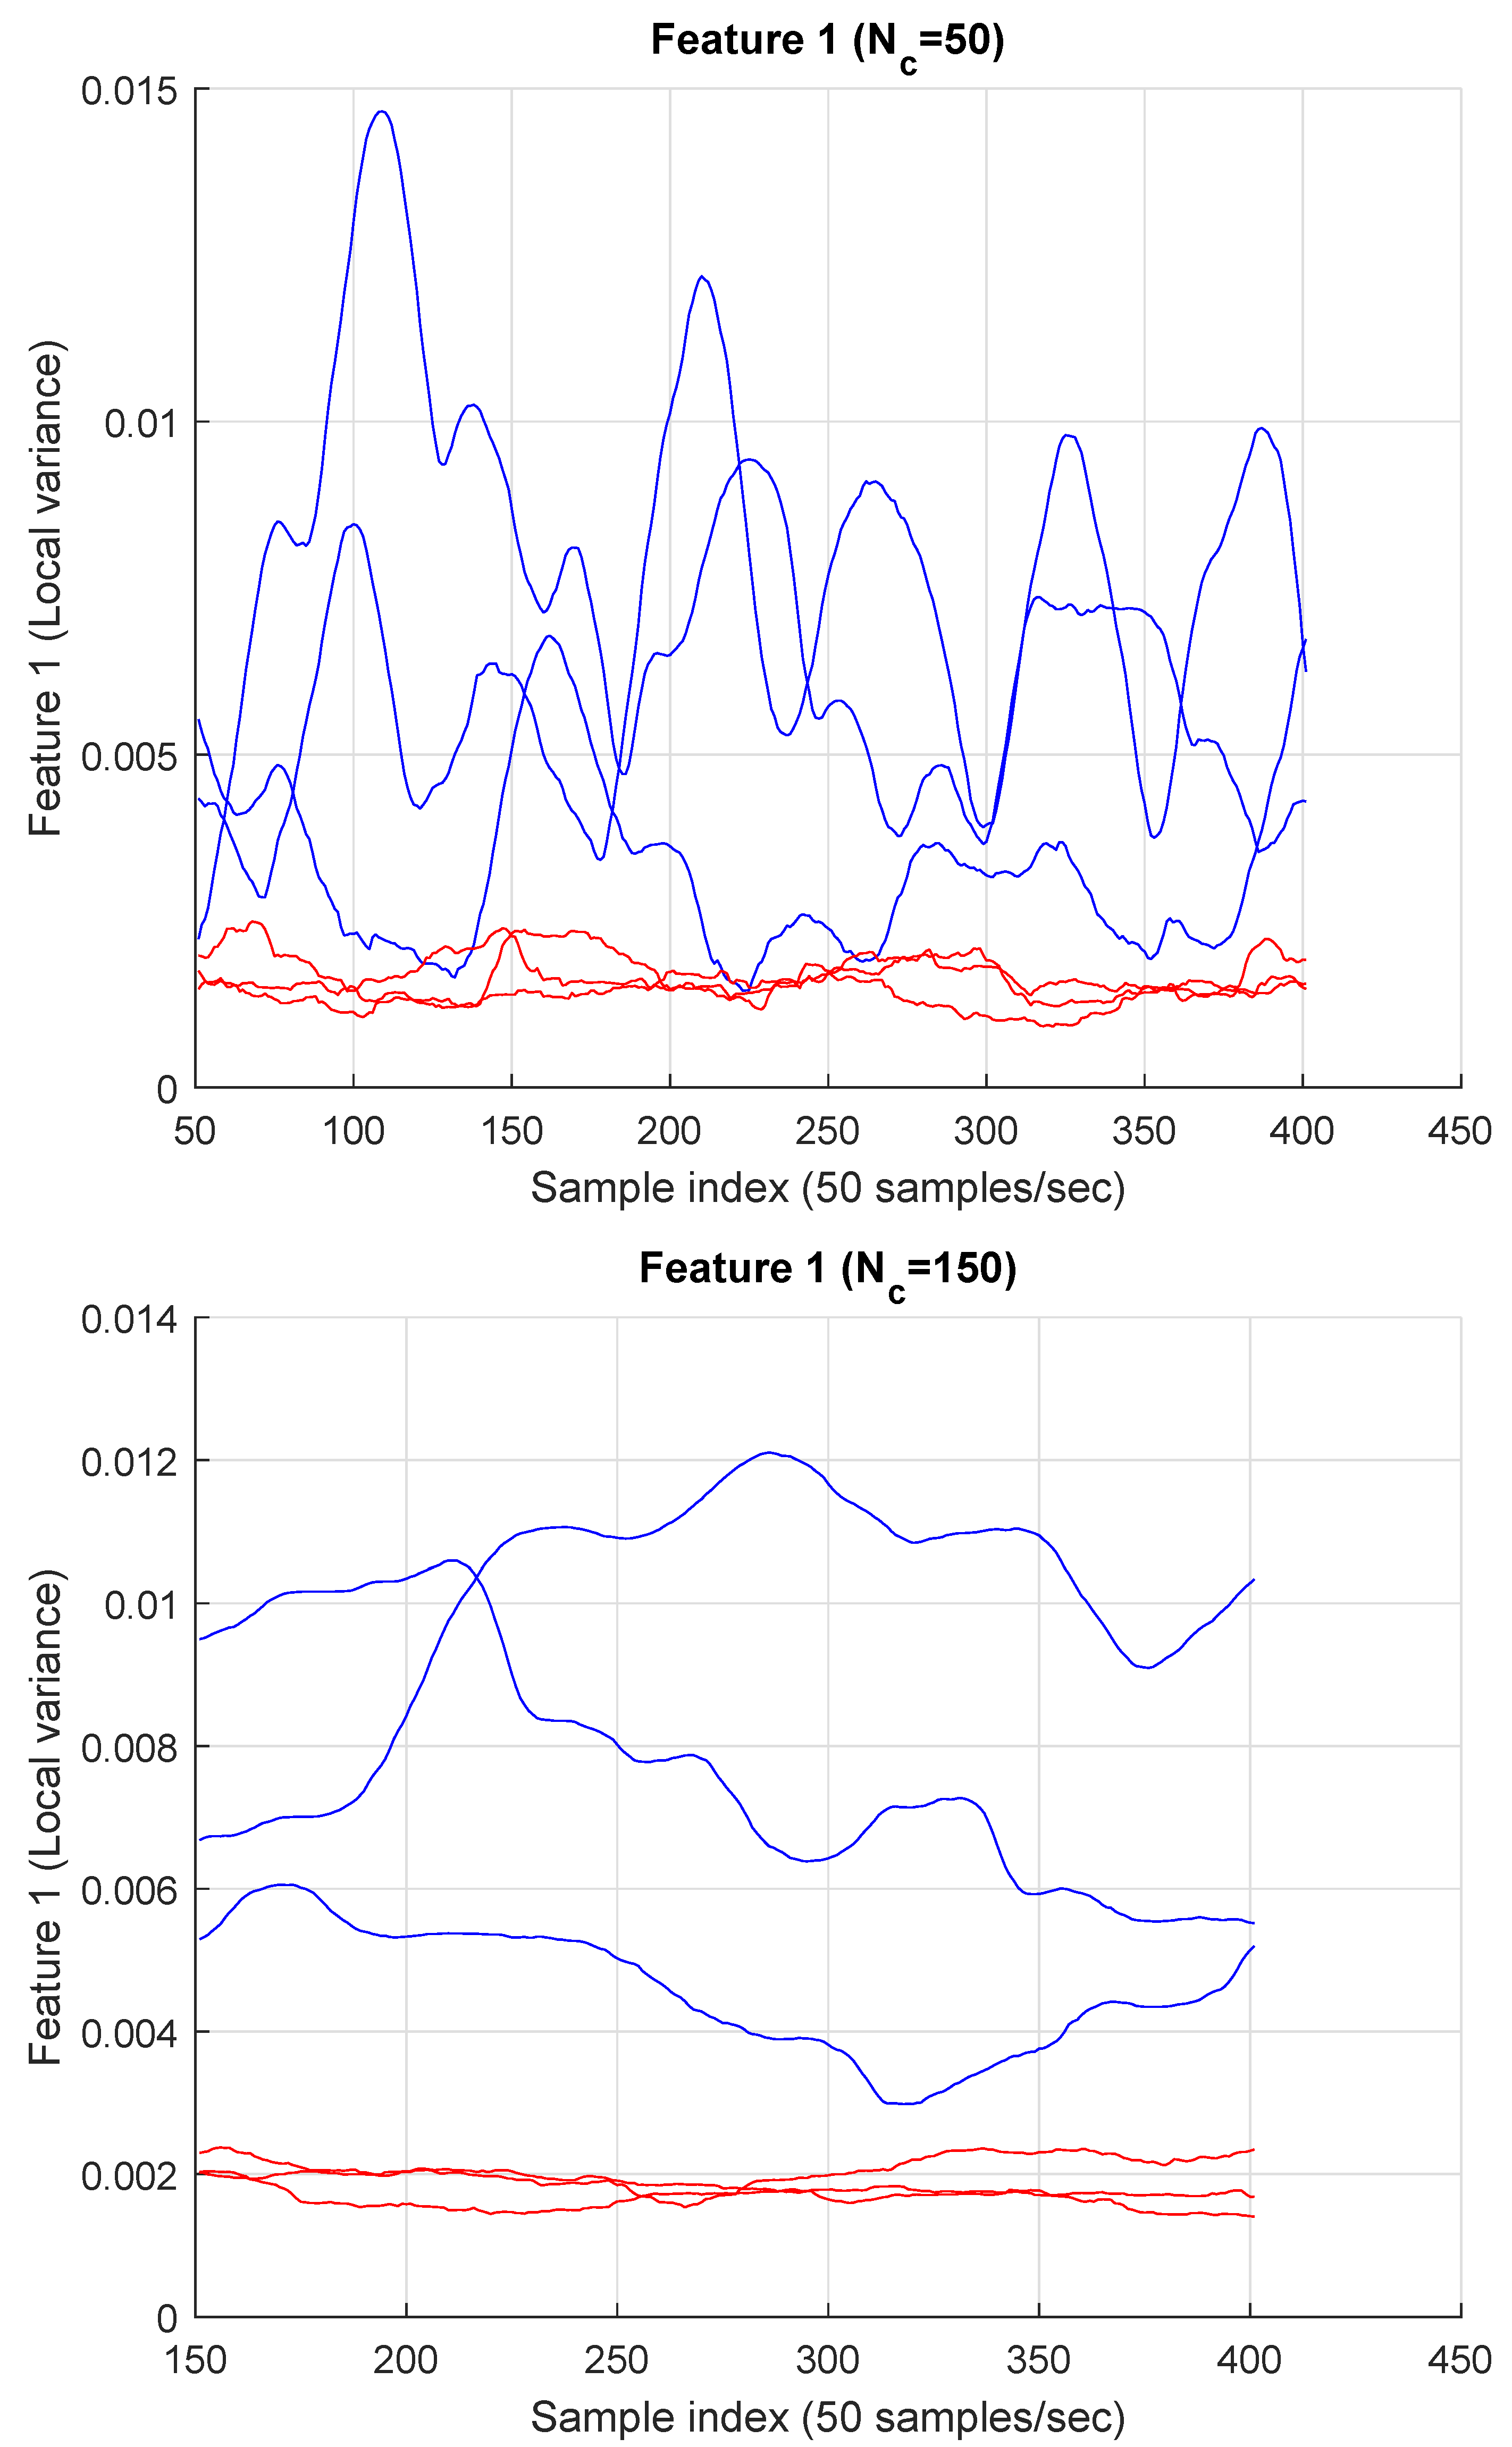
4.1. Feature 1 (Local Variance)

Our first proposed feature is the variance of local N c phase shift values, or in a real-time setting variance of the latest N c phase shift measurements. We have chosen N c = 50 , and N c = 150 , and computed the variance of local/past N c samples. In Figure 5, the variance is plotted as a function of the sample index.
In Figure 6, histogram confusion plots for N c = 50 and N c = 150 are shown. The overlap is smaller for N c = 150 , however a design based on N c = 50 uses measurements acquired within 1 s, whereas N c = 150 corresponds to 3 s. Hence, although N c = 150 results in a more reliable detector, in the event of loss of vital signs, it is expected to respond after a longer delay compared to N c = 50 . Both reliability and response time in the event of loss of vital signs are critical performance metrics.
A false alarm is defined as the detector output being Class 0 although there are still vital signs, and a miss is defined as the detector output being Class 1 although there are no vital signs. The optimal classifier will be the detector that minimizes the sum of P F , the false alarm rate, and P M , the probability of a miss. More precisely, it will be
If Feature 1 γ , then classify as Class 1 ,
If Feature 1 < γ , then classify as Class 0 .
where γ = 0.00200 and 0.00235 for N c = 50 and 150 respectively. The value of γ is estimated as the x axis of the intersection of the two Gaussian distributions in Figure 6.

4.2. Feature 2 (Ratio of Low-Frequency Energy Content)

Our second feature is the percentage of energy (of the estimated phase shift signal, θ ) that lies between 0.35 and 1.5 Hz. Note that the DC bias is always removed, and the end points of the band 0.35–1.5 Hz are design parameters that can be varied for further optimization.
In Figure 7, FFT plots for a positive and a negative case are shown, and it is clear that for the positive case the frequency band [ 0.35, 1.5] Hz has a much higher relative energy content compared to the negative case. Furthermore, the frequency at which the peak is observed can be used to estimate the breathing rate as well.
We define our second feature as
Feature 2 = Energy of θ ( t ) in 0.35 Hz 1.5 Hz Total energy of θ ( t )
and according to this definition, we obtain the values shown in Table 2.
In Figure 8, Feature 2 values are shown on a 1-D axis, which exhibits a very clear separation between the two classes.
Our Feature 2-based classifier is
If Feature 2 γ , then classify as Class 1 ,
If Feature 2 < γ , then classify as Class 0 .
where γ is selected as the average of class means, i.e., γ 0.65 .
For this feature, the histograms do not overlap and both distributions are well separated from each other. This is clearly better than the first feature, however it is more demanding computationally. If a mobile low-power device is intended to be designed for vital signs monitoring, computational load and associated increase in the power consumption may be a concern.

5. Conclusions

In this paper, we have presented a sub-6 GHz vital signs detector system and experimentally analyzed its performance. We only considered the binary classification problem and proposed two different features. Estimation of vital parameters was not addressed and will be considered in a future version of the paper. Sensor fusion using both of these features will also be addressed in a future study. Overall, use of the first or the second of the proposed features results in an effective and low-cost vital signs detection system. For both features, the histogram confusion plots imply a low rate of false positives and negatives.

Author Contributions

Both authors contributed to all parts equally. Both authors have read and agreed to the published version of the manuscript.

Funding

This work has been supported in part by Florida Polytechnic University grant GR-1900022, Advanced Mobility Institute grants GR-2000028, GR2000029, and the NSF grant 1919855. Both authors acknowledge their individual startup funds.

Conflicts of Interest

The authors declare no conflicts of interest. The funders had no role in the design of the study; in the collection, analyses, or interpretation of data; in the writing of the manuscript; or in the decision to publish the results.

References

  1. Raffo, A.; Costanzo, S.; Massa, G.D. Software Defined Doppler Radar as a Contactless Multipurpose Microwave Sensor for Vibrations Monitoring. Sensors 2017, 17, 115. [Google Scholar] [CrossRef] [PubMed]
  2. Braun, M. OFDM Radar Algorithms in Mobile Communication Networks. Ph.D. Thesis, Karlsruhe Institute of Technology, Karlsruhe, Germany, 2014. Available online: https://publikationen.bibliothek.kit.edu/1000038892/2987095 (accessed on 25 November 2020).
  3. Prager, S.; Thrivikraman, T.; Haynes, M.S.; Stang, J.; Hawkins, D.; Moghaddam, M. Ultrawideband Synthesis for High-Range-Resolution Software-Defined Radar. IEEE Trans. Instrum. Meas. 2020, 69, 3789–3803. [Google Scholar] [CrossRef]
  4. Vogl, A.; Wang, D.T.; Storås, P.; Bakke, T.; Taklo, M.M.; Thomson, A.; Balgård, L. Design, process and characterisation of a high-performance vibration sensor for wireless condition monitoring. Sens. Actuators A Phys. 2009, 153, 155–161. [Google Scholar] [CrossRef]
  5. Pieraccini, M.; Fratini, M.; Parrini, F.; Macaluso, G.; Atzeni, C. High-speed CW step-frequency coherent radar for dynamic monitoring of civil engineering structures. Electron. Lett. 2004, 40, 907–908. [Google Scholar] [CrossRef]
  6. Grazzini, G.; Pieraccini, M.; Dei, D.; Atzeni, C. Simple microwave sensor for remote detection of structural vibration. Electron. Lett. 2009, 45, 567–569. [Google Scholar] [CrossRef]
  7. Lohman, B.; Boric-Lubecke, O.; Lubecke, V.M.; Ong, P.W.; Sondhi, M.M. A digital signal processor for Doppler radar sensing of vital signs. IEEE Eng. Med. Biol. Mag. 2002, 21, 161–164. [Google Scholar] [CrossRef] [PubMed]
  8. Gu, C. Assessment of Human Respiration Patterns via Noncontact Sensing Using Doppler Multi-Radar System. Sensors 2015, 15, 6383–6398. [Google Scholar] [CrossRef] [PubMed]
  9. Wang, Y.; Wang, W.; Zhou, M.; Ren, A.; Tian, Z. Assessment of Human Respiration Patterns via Noncontact Sensing Using Doppler Multi-Radar System. Sensors 2020, 20, 2999. [Google Scholar] [CrossRef] [PubMed]
  10. Alizadeh, M.; Shaker, G.; Almeida, J.C.M.D.; Morita, P.P.; Safavi-Naeini, S. Remote Monitoring of Human Vital Signs Using mm-Wave FMCW Radar. IEEE Access 2019, 7, 54958–54968. [Google Scholar] [CrossRef]
  11. Park, J.; Hong, Y.; Lee, H.; Jang, C.; Yun, G.; Lee, H.; Yook, J. Noncontact RF Vital Sign Sensor for Continuous Monitoring of Driver Status. IEEE Trans. Boimed. Circuits Syst. 2019, 13, 493–502. [Google Scholar] [CrossRef] [PubMed]
Figure 1. Sub-6 GHz vital signs detector using a universal software radio peripheral (USRP) B205-mini.
Engproc 02 00038 g001
Figure 2. High-level block diagram of the proposed system.
Engproc 02 00038 g002
Figure 3. GNU radio graph with default parameters.
Engproc 02 00038 g003
Figure 4. Phase plots for 3 positive (top) and 3 negative cases (bottom). All after DC bias removal and some level shifting.
Engproc 02 00038 g004
Figure 5. Feature 1: blue is for Class 1, and red is for Class 0. On the top N c = 50 and at the bottom N c = 150 .
Engproc 02 00038 g005
Figure 6. Blue is for Class 1, red is for Class 0, and green indicates fitted Gaussian distributions. On the top N c = 50 and at the bottom N c = 150 .
Engproc 02 00038 g006
Figure 7. FFT amplitude plots vs. frequency: red for Class 0 and blue for Class 1.
Engproc 02 00038 g007
Figure 8. Feature 2: red for Class 0 and blue for Class 1.
Engproc 02 00038 g008
Table 1. Software versions.
Ubuntu18.04.1
PyCharm2020.1
Python3.6.9
NumPy1.16.3
SciPy1.2.1
Table 2. Feature 2 (energy ratios).
Experiment No.Class Type“Feature 2”
1Class 00.3699
2Class 00.4555
3Class 00.5833
4Class 10.8067
5Class 10.8354
6Class 10.9283
Publisher’s Note: MDPI stays neutral with regard to jurisdictional claims in published maps and institutional affiliations.

