1. Introduction
In the current wake of the COVID-19 pandemic, preventing and/or limiting the community spread of the virus is a mammoth task, with governments and administrations across the world applying different strategies to restrict population movement and social interaction. A result has been serious socio-economic impacts. A recent survey conducted on 5800 small US businesses [
1] concluded that 43% of businesses were temporarily closed and falls in the employment of 40%.
Preventing community transmission is the key to reducing the load on healthcare systems and to keep the economy rolling. Businesses are required to follow standard operating procedures (SOPs) provided by their governments in efforts to curb community transmission of the virus. However, there is a financial impact on small businesses to implement specific SOPs and compliance rules and this is exacerbated when required to hire or re-appropriate staff members to implement compliance such as measuring the temperature of incoming customers and ensuring physical distance between them. According to a news article [
2], one pharmacy business in New South Wales (NSW), Australia, had to spend AUD 1000–1500 per week to higher staff for monitoring temperature and ensuring distancing.
Internet of things (IoT), as an enabler of data sharing through connectivity, is very attractive in healthcare applications [
3,
4]. An advantage of this technology is that it enables remote health monitoring. IoT also enables human-to-human, machine-to-human, and machine-to-machine communication without any external intervention. It can therefore be a very useful tool in implementing and monitoring human social interaction during COVID-19. Safework Australia has prepared a checklist [
5] for small businesses in retail that outlines workplace safety procedures. Two key areas are physical distancing and monitoring COVID-19 symptoms (such as fever). We propose a low-cost option for small businesses to measure and report key COVID-19 workplace safety parameters such as body temperature (fever), the number of people per square meter, and distance between individuals in the queue area. Furthermore, we present an active LED-based real-time solution to dynamically manage physical distancing for individuals standing in a queue.
Various existing works have reported implementations for COVID-19 detection and reporting. Otoom et al. [
6] proposed a five (5) component IoT-based framework for early detection of COVID-19 cases, using real-time symptom data collected to identify suspected cases of infection. Kaplan et al. [
7] implemented rapid screening of fever to distinguish between healthy and non-healthy students in an academic setting, using infrared sensors installed on a stationary gantry. Temperature readings were communicated wirelessly to a wearable watch display for the operator. For detecting several people, Sabanci et al. [
8] implemented a camera-based person counting system in a library. The information on the number of people counted was communicated to a mobile application using IoT technology. An indoor IoT-based monitoring system was reported by Petrovic et al. [
9] in which contactless temperature, mask, and social distancing check was implemented using an Arduino-based setup.
Current practices to ensure COVID-19 SOP compliance include hiring or appointing staff to monitor the body temperature of attendees and ensure physical distancing. While prior implementations consider elements of symptom and distance monitoring, they do not provide a comprehensive real-time solution that can dynamically manage attendees to maintain COVID-SOP compliance.
2. Design and Setup
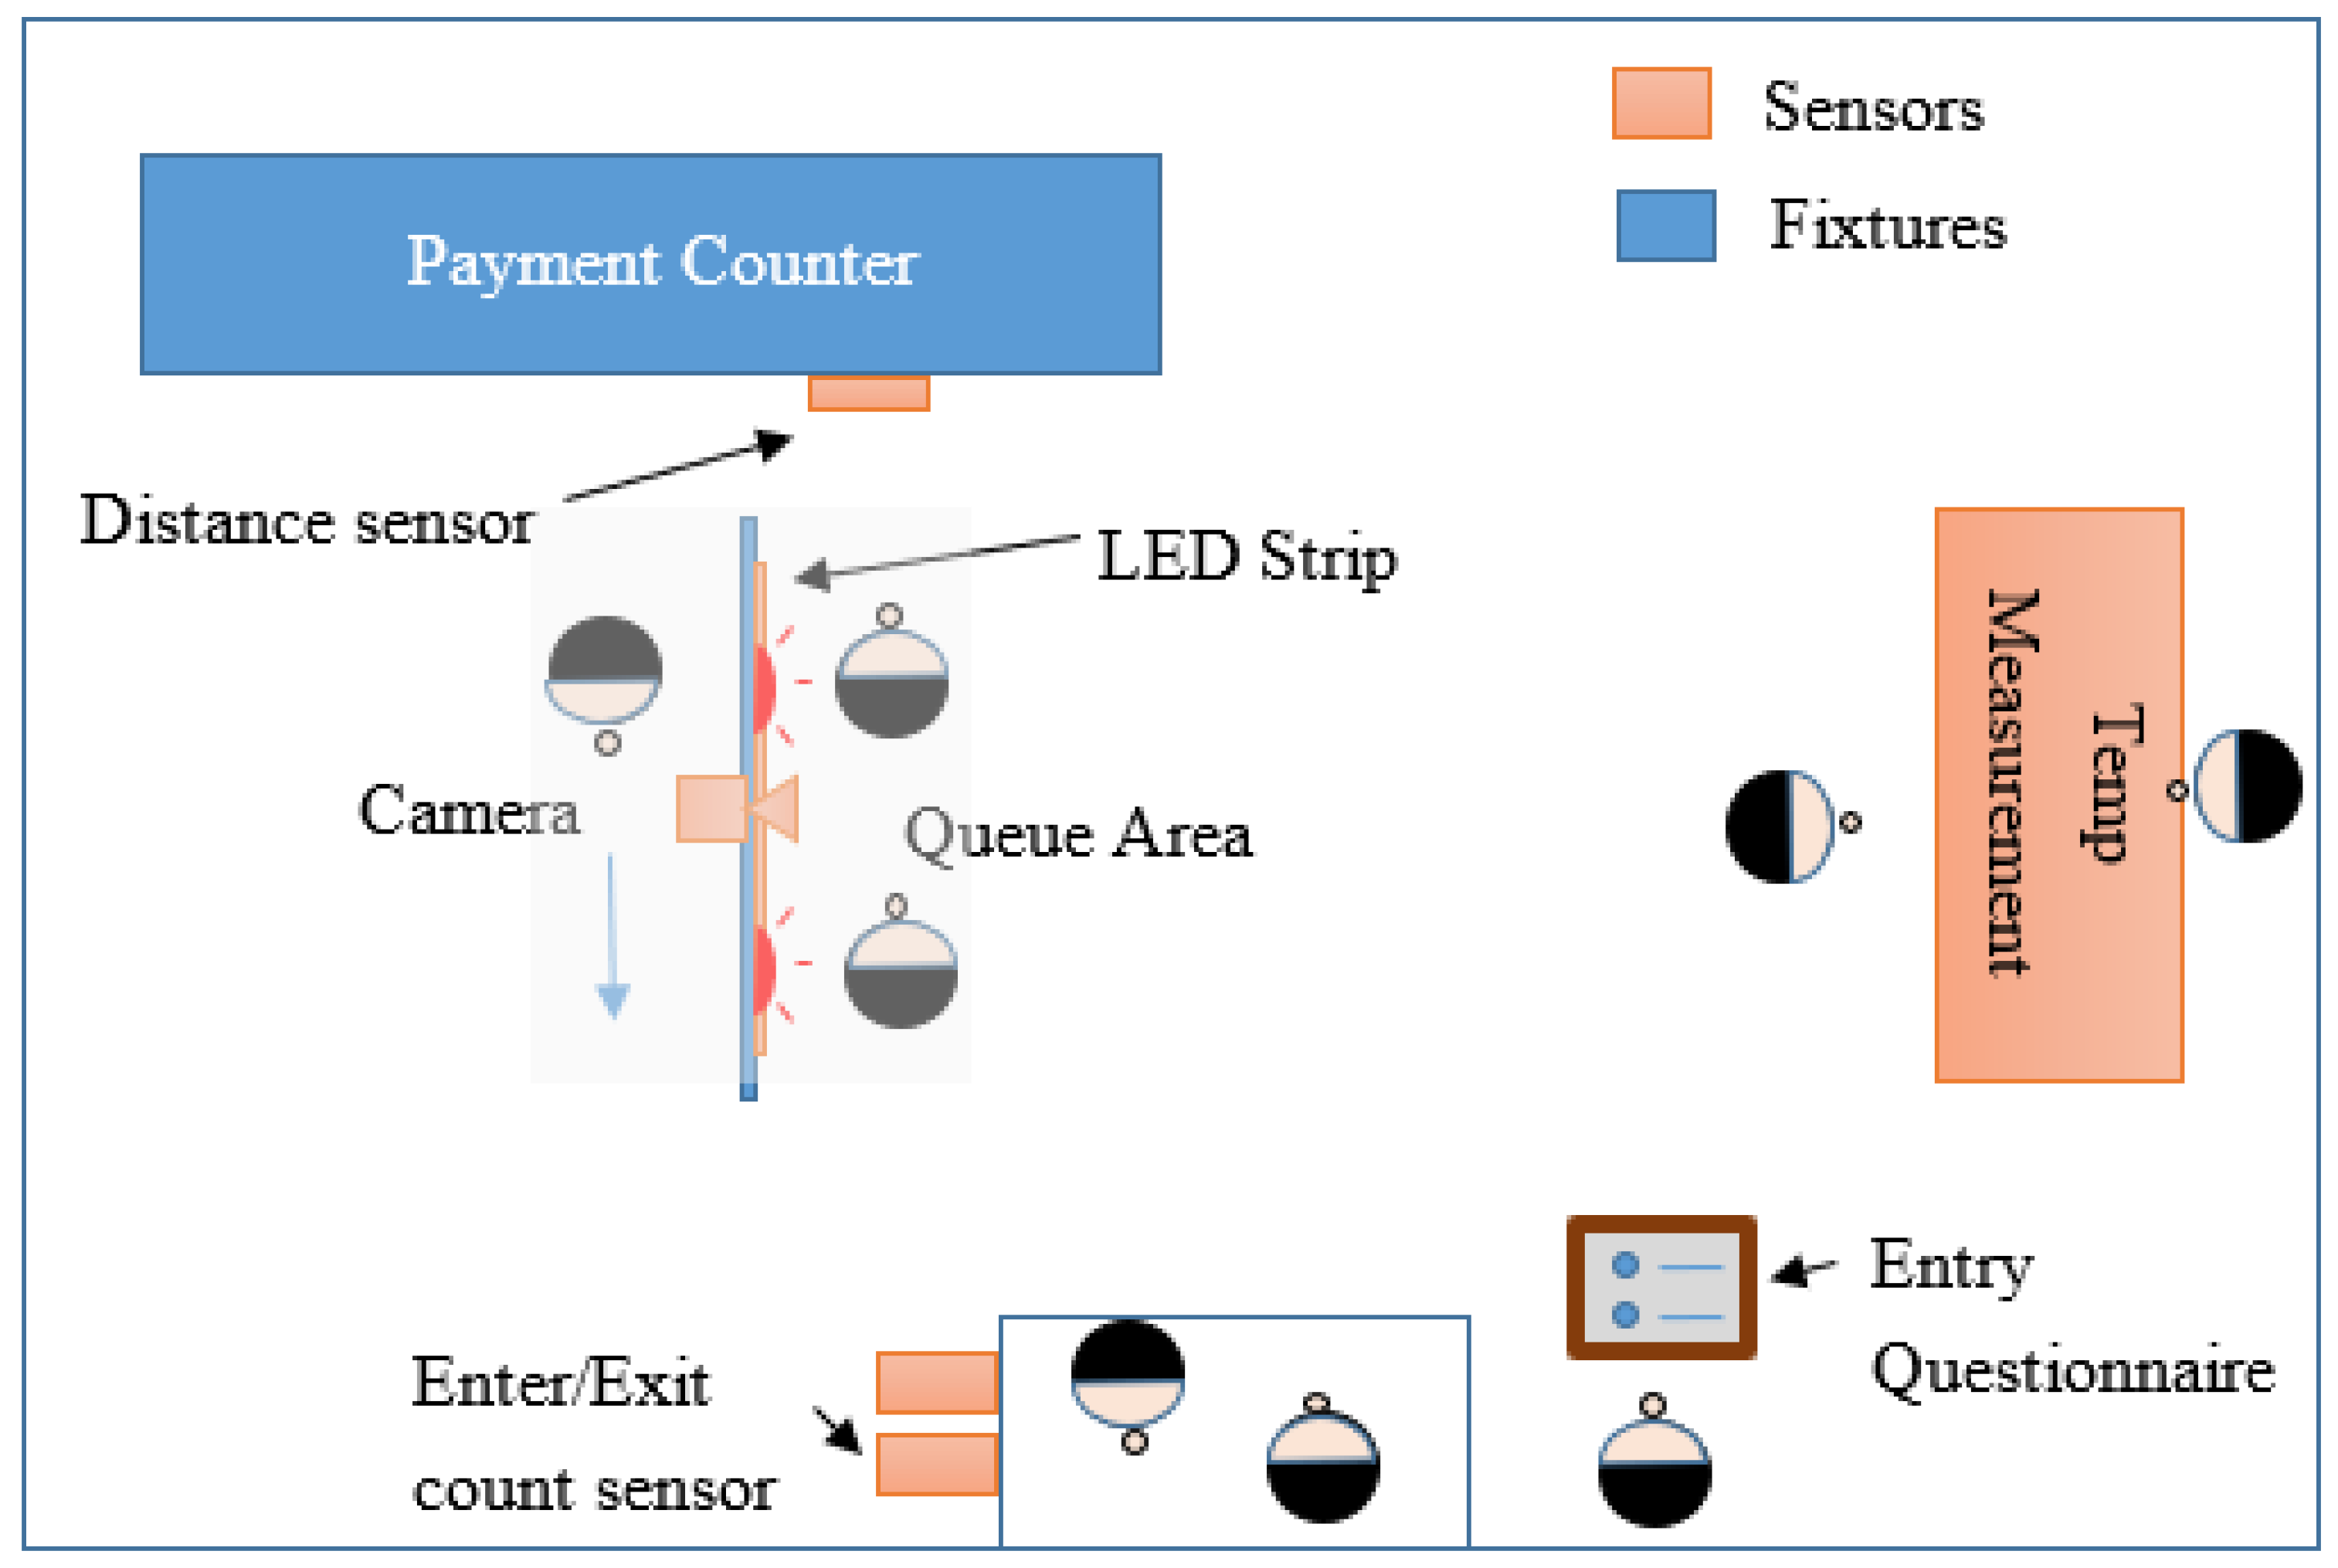
The setup assumes the floor space of small retail businesses and checks for the number of people entering or leaving the space, any COVID-19 symptoms before entering, their body temperature, the distance between the queued customers, and distance between the customer and the office counter,
Figure 1. Infrared obstacle detectors keep a count of incoming and exiting individuals at the entrance and exit points, providing a required measure of the number of people per square meter. Upon entering the premises, the individual is required to answer the COVID-19 symptom-related questionnaire which is linked to the dashboard. They then move on for the body temperature measurement using a non-contact IR temperature sensor MLX90614. When queuing at the customer service or payment counter, addressable LEDs WS2812B are used to visually display the permissible queuing locations. The locations available in a queue correlate to the number of individuals entering the business space. For instance, if only two persons enter, the queue will allocate the two furthest apart locations possible in the queue area. As more people enter, the number of available queuing locations updates whilst maintaining a minimum of 1.5 m distance between locations. A time of flight (ToF) sensor VL531x at the counter is used to measure the distance of the front-most individual in the queue and provides alerts to the individual (and the system) if minimum distance is violated.
Individuals and managers must also be alerted if the minimum distance between people is violated in the queue. A Raspberry Pi (RPi) wide-angle camera module was used to detect any violation in minimum distance between the queued individuals. The addressable LED strip used for permissible locations in the queue also acted as the calibration markers for the camera. The physical distance between the markers was translated to pixel distance between the two individuals. The system alerts if an individual strays into an impermissible area for more than 5 s. As real distance measurement is not required, this setup is sufficient to ensure social distancing compliance.
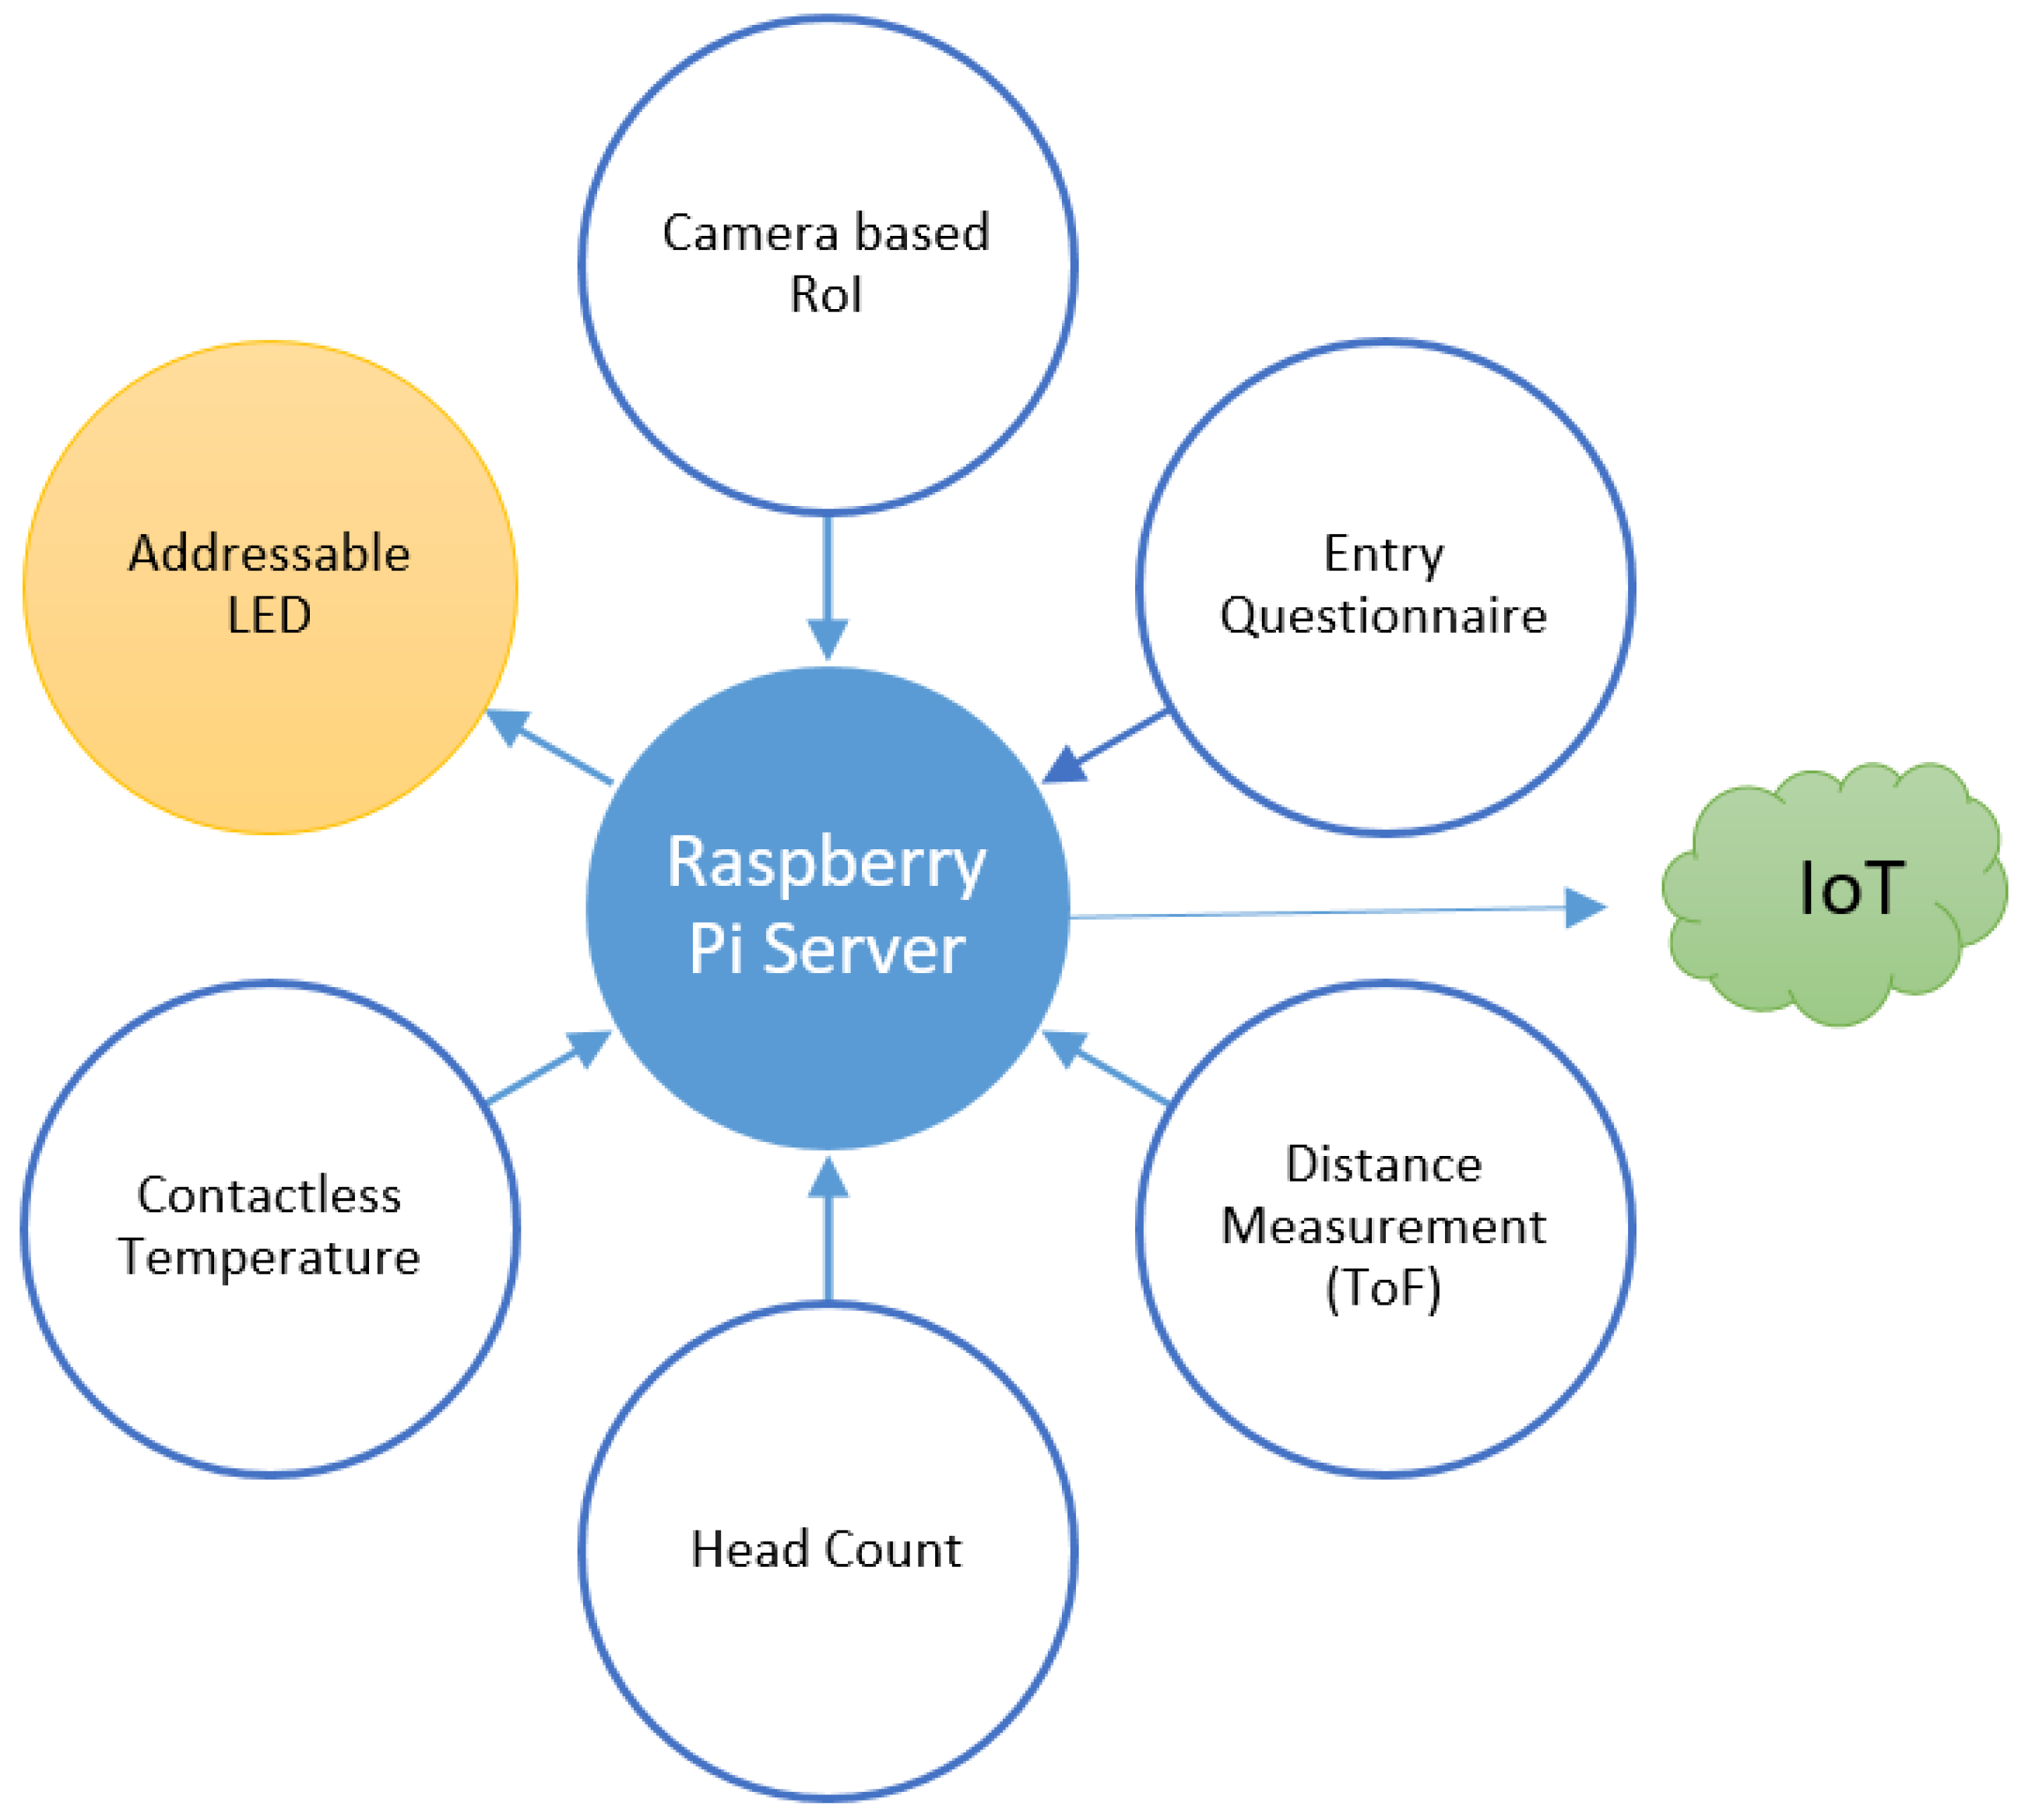
Figure 2 presents the system sensor connectivity. This setup can work in place of, or in conjunction with, any physical markers or stickers currently prevalent in the industry to ensure COVID-19 safety. Raspberry Pi 4 was set up as a server to communicate with the sensors and log data. The parameters recorded were people in, people out, current people, total people count/day, violations in the queue, and the individual temperature reading was communicated through sockets. The information collected was then uploaded on ThingSpeak [
10] daily. This information is then retrieved for auditing, monitoring, and planning purposes. The dashboard was designed to be compatible with mobile, tablet, desktop computers.
3. Implementation and Results
To test the feasibility of the proposal, lab space was used to set up sensors as per the layout. Raspberry Pi was configured to run on an Express (Node.js) webserver and Express-ws was used as a socket server. A graphical information dashboard was designed in Bootstrap 5 Alpha which displays sensor data and warns of any violations. Bootstrap provides a free and effective framework to implement websites or graphical templates for low power processors [
11]. The server was configured to upload the retrieved information to ThingSpeak [
10] on daily basis.
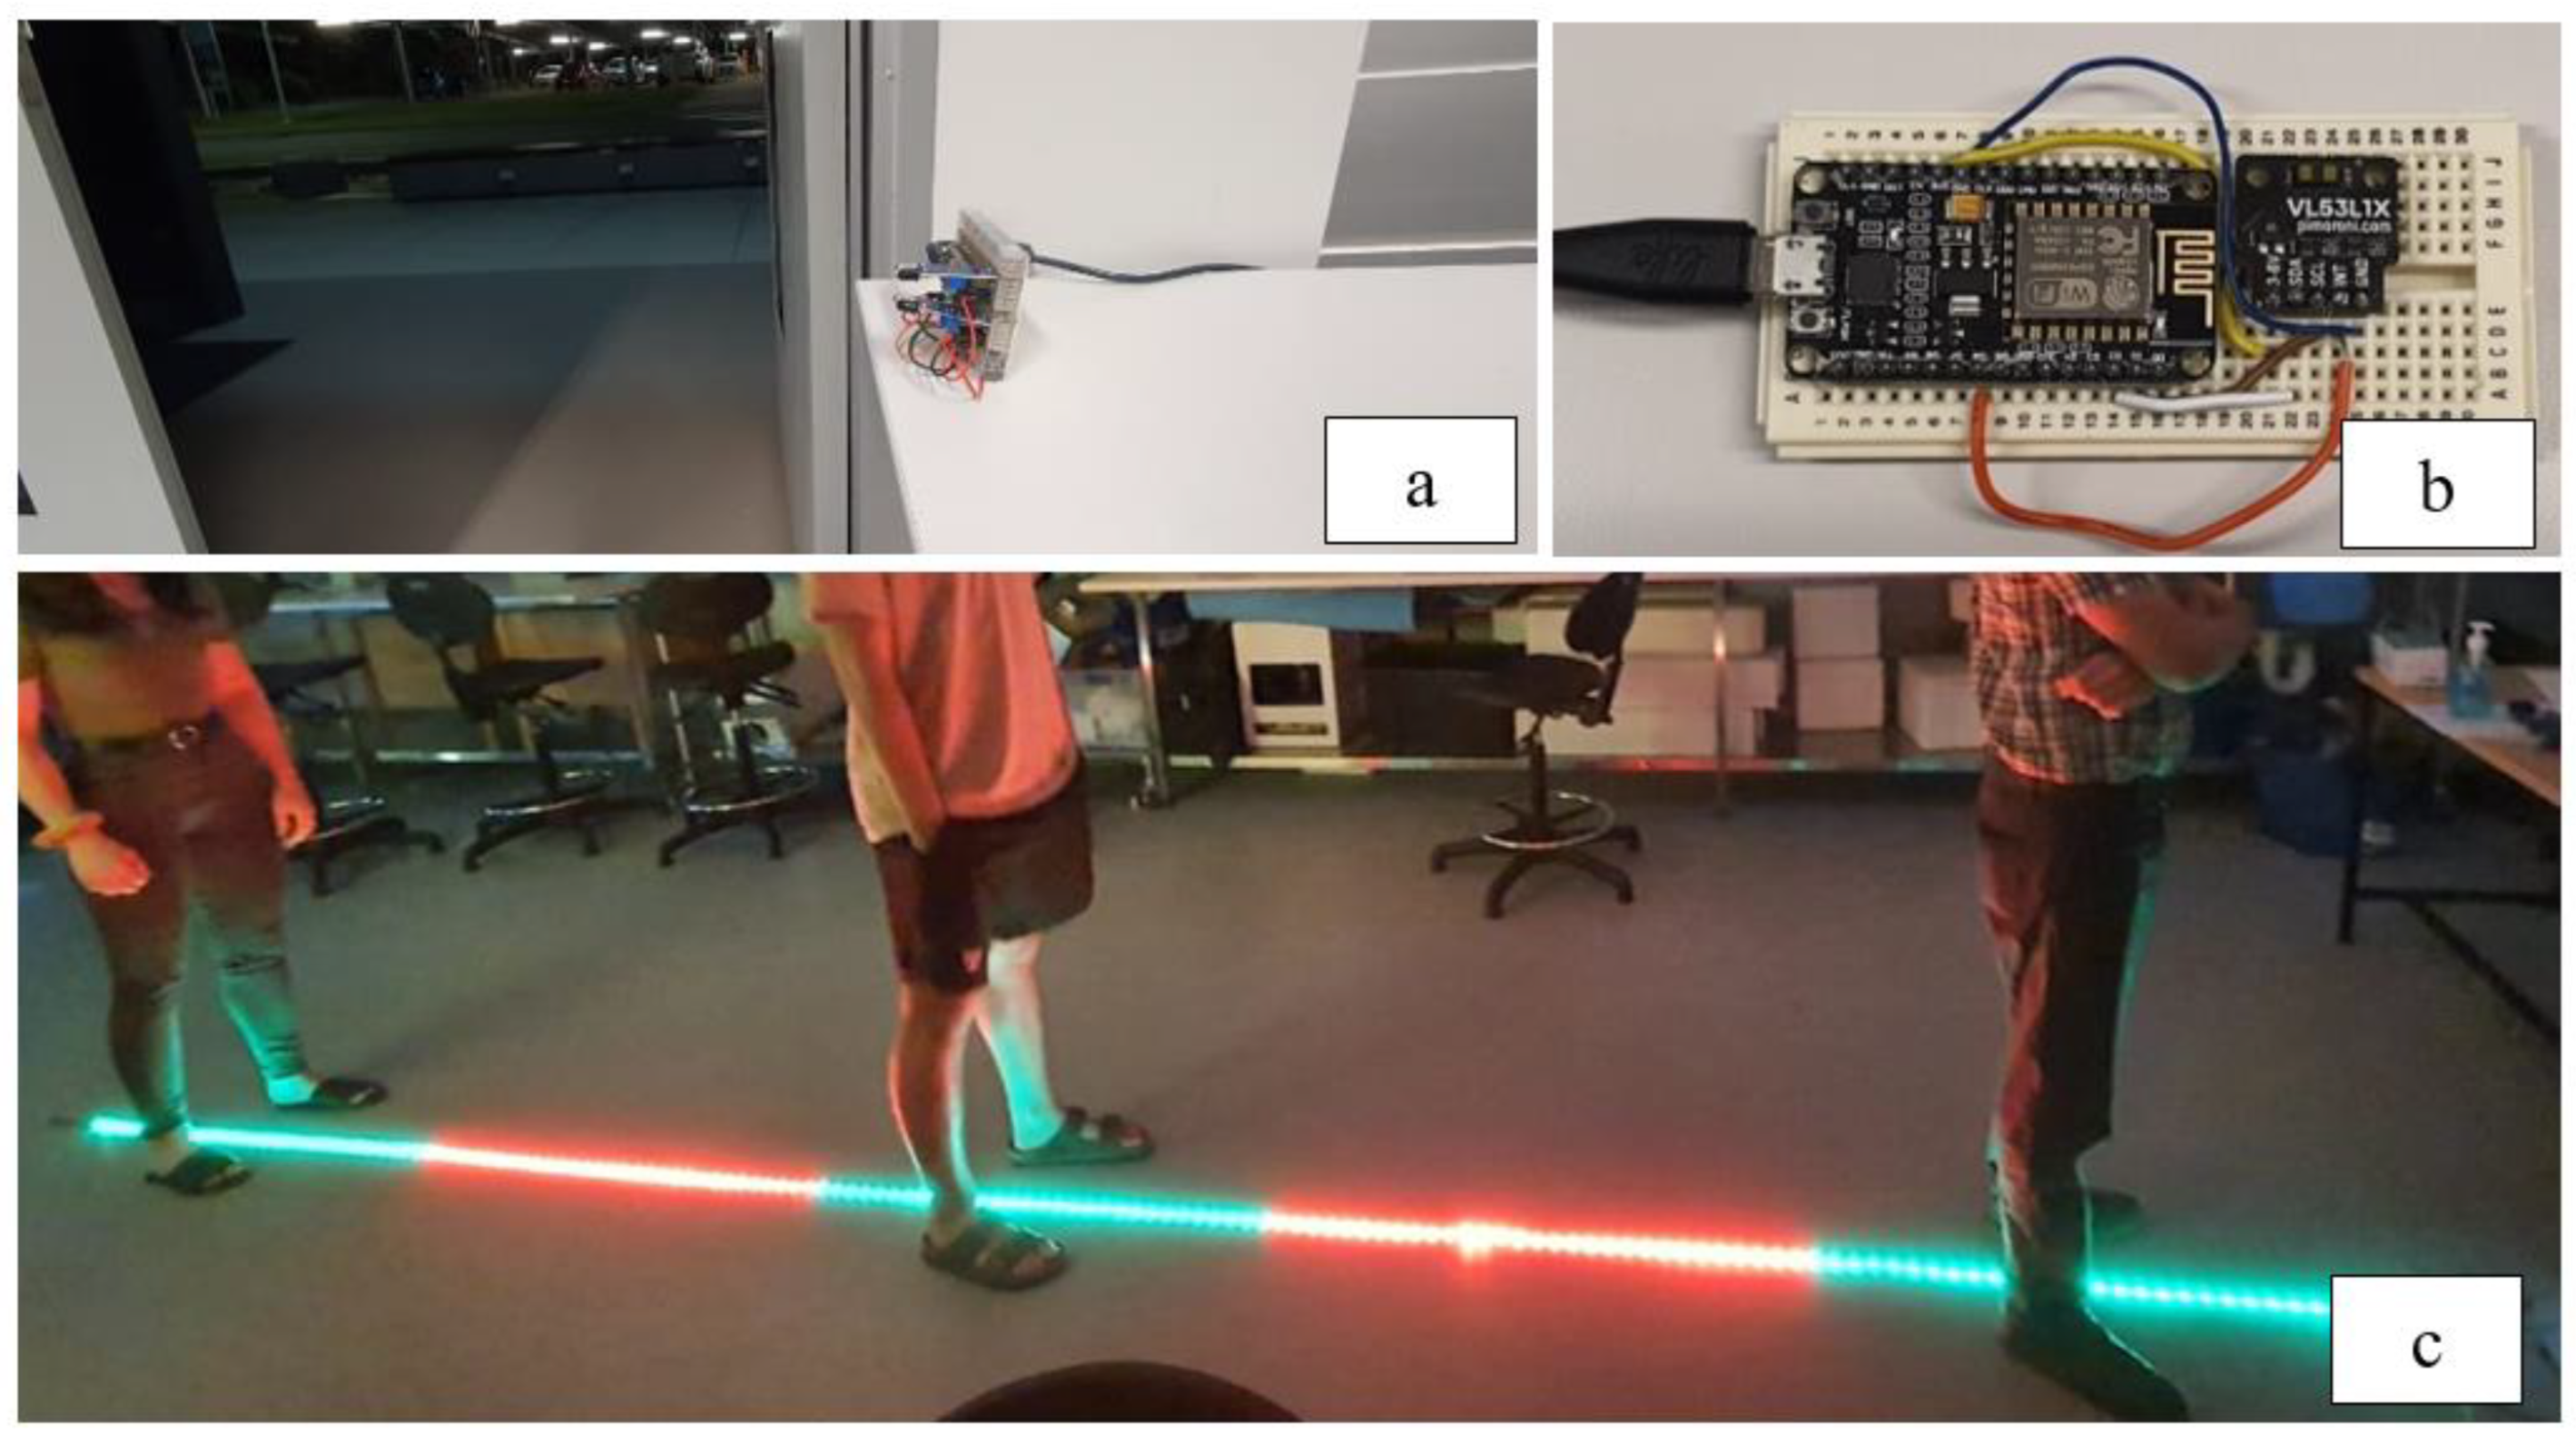
Respective sensor nodes were configured as wireless nodes using ESP8266 and transmitted data to the Pi server using WebSocket communication protocol. This protocol establishes full-duplex communication and establishes a persistent connection over transmission control protocol (TCP) between server and client. The two IR sensors were placed at the entrance at a height of 1 meter from the ground (
Figure 3a) and the individual count (in and out) was communicated to the graphical dashboard. Based on which IR sensor—outer or inner—detected the obstacle first, the counter was incremented or decremented. Based on the inputs from these sensors, parameters such as people in, people out, current people count, and total footfall per day were established.
The temperature sensor was positioned just after the entrance at a height of 1.2 m. Incoming individuals were required to place their forehead close to the sensor and the temperature reading was recorded and sent to the server. To ensure the correct distance was maintained when using the sensor, an IR obstacle detection switch was used and adjusted to work within a 2 cm–5 cm range (as specified by the IR temperature sensor datasheet). When the participant was within this range, a green light turned on indicating the correct distance. The temperature sensor used can measure contactless temperature with 0.5-degree Celsius accuracy [
12]. The threshold for the forehead measurement of the IR sensor was set at 36-degree Celsius to cater to the measurement site variation [
13].
A time of flight sensor (
Figure 3b) was placed at a 1-m height from the ground to detect min distance violation of the front of the queue. The sensor was set as a binary sensor thereby only relaying information when the distance threshold was crossed. The distance was continuously monitored and reported to the dashboard.
A 5 m long addressable (ws2812b) LED strip was used to mark the queue area (
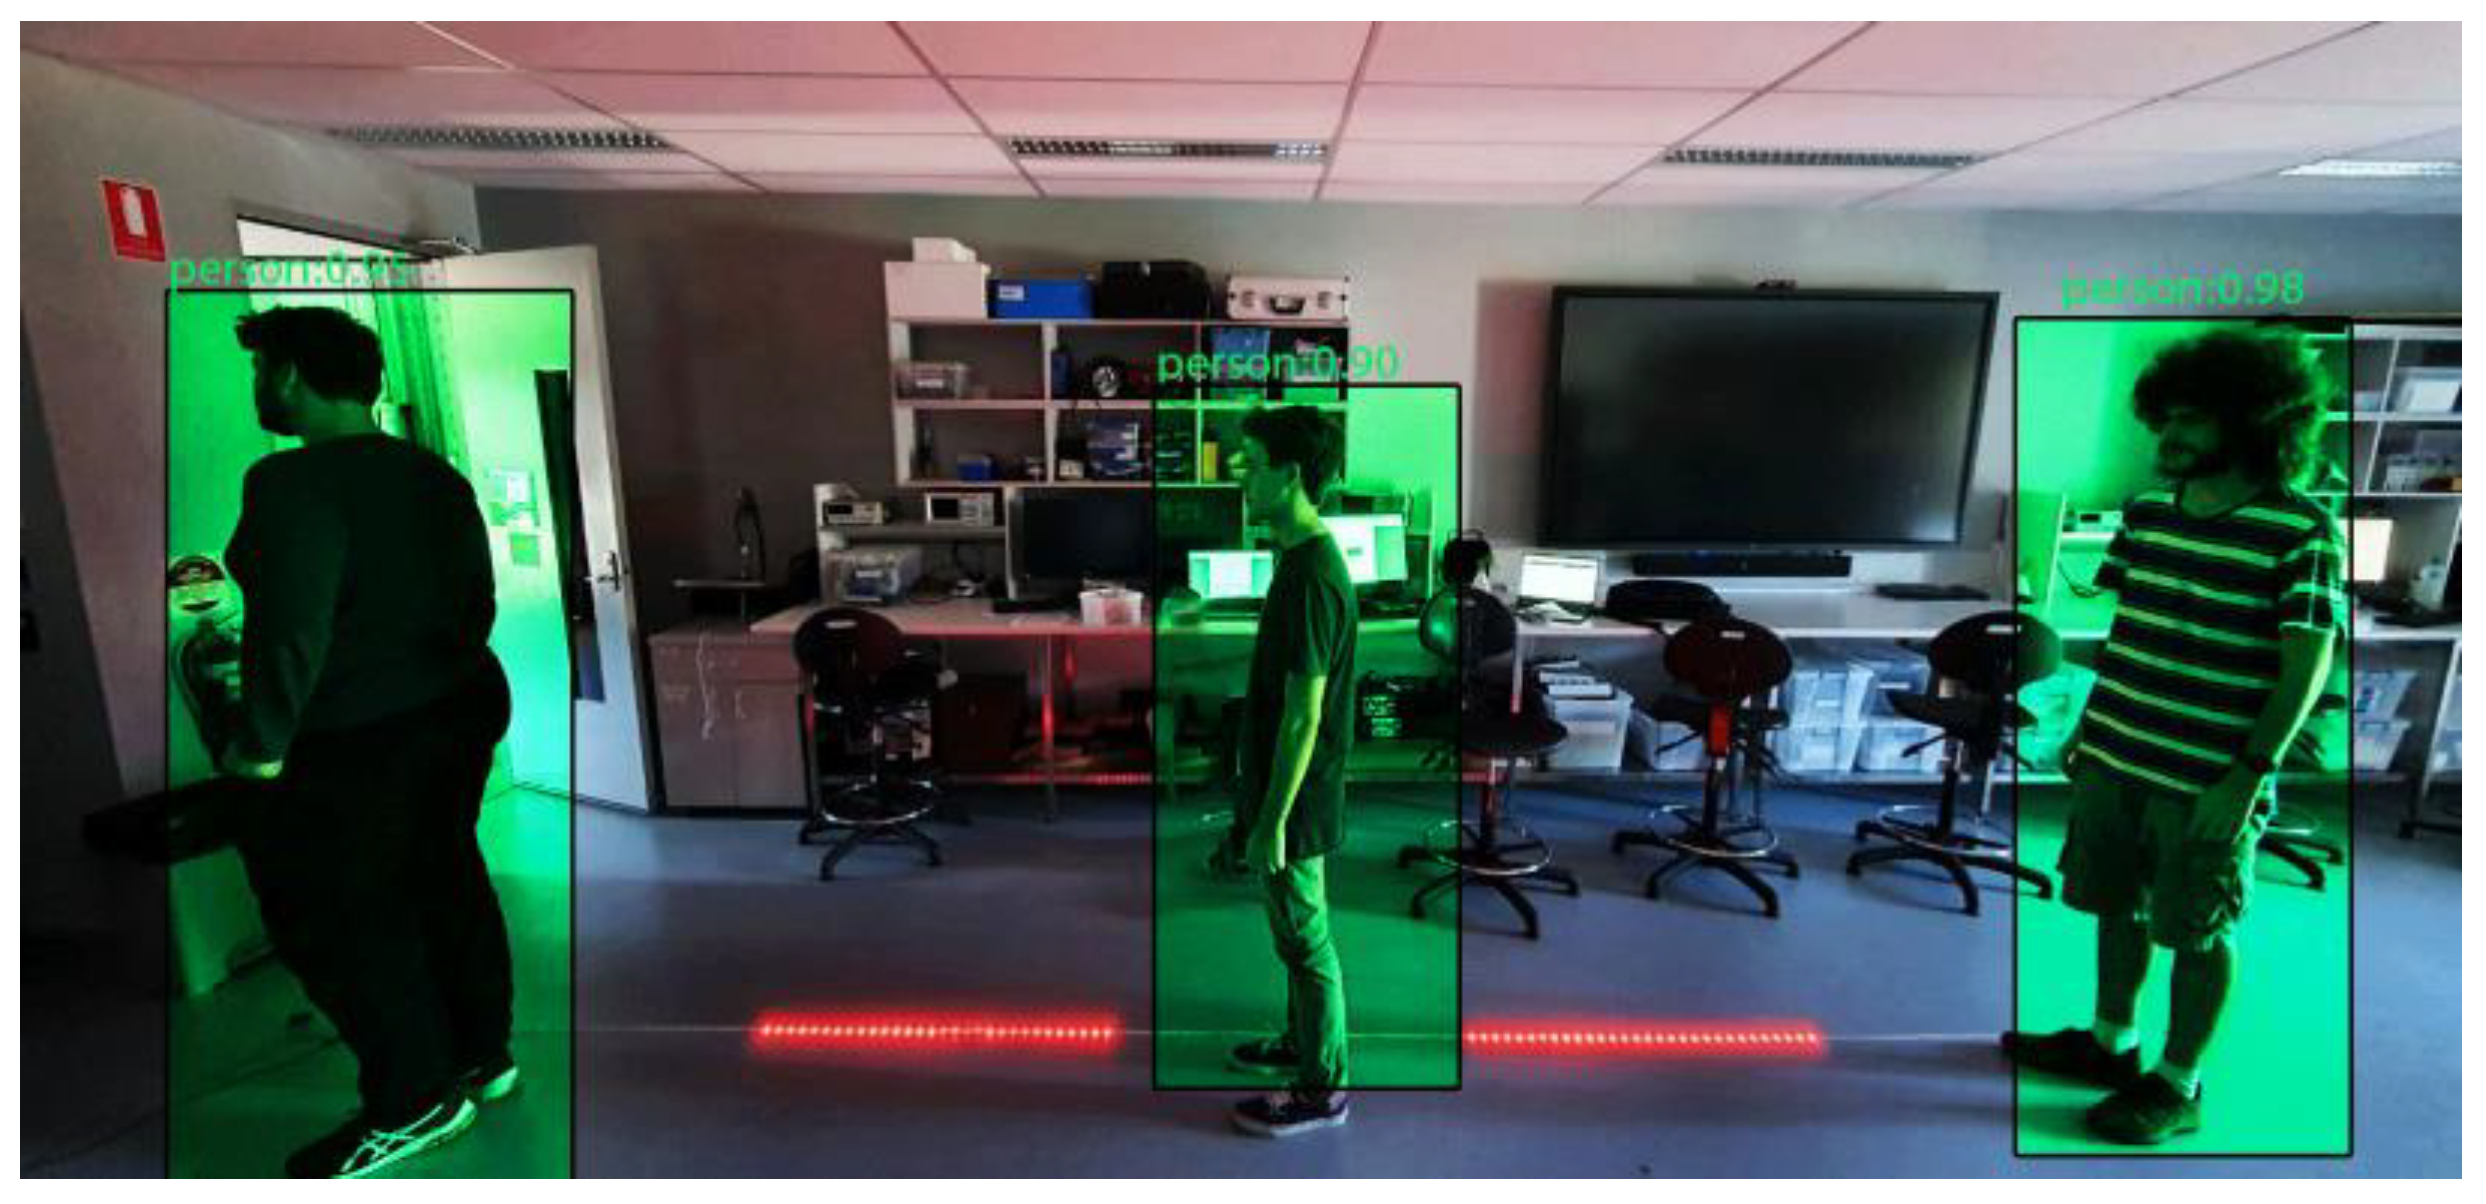
Figure 3c). Green LEDs mark the “safe” standing location. The RPi camera was set up near the queue to detect any minimum distance violation. MobileNet-SSD (single shot detector) with the Caffe model was used for detection, classification, and bounding box localization of individuals in OpenCV.
Figure 4 illustrates a screen capture of MobileNet-SSD detecting persons in the camera stream. Queue space with red LEDs was set as a region of interest (ROI) and each ROI was assessed for the presence of a person. Red LEDs of the addressable strip were used to visually warn the individual about safe distance violation by blinking, and violation was also highlighted on the dashboard.
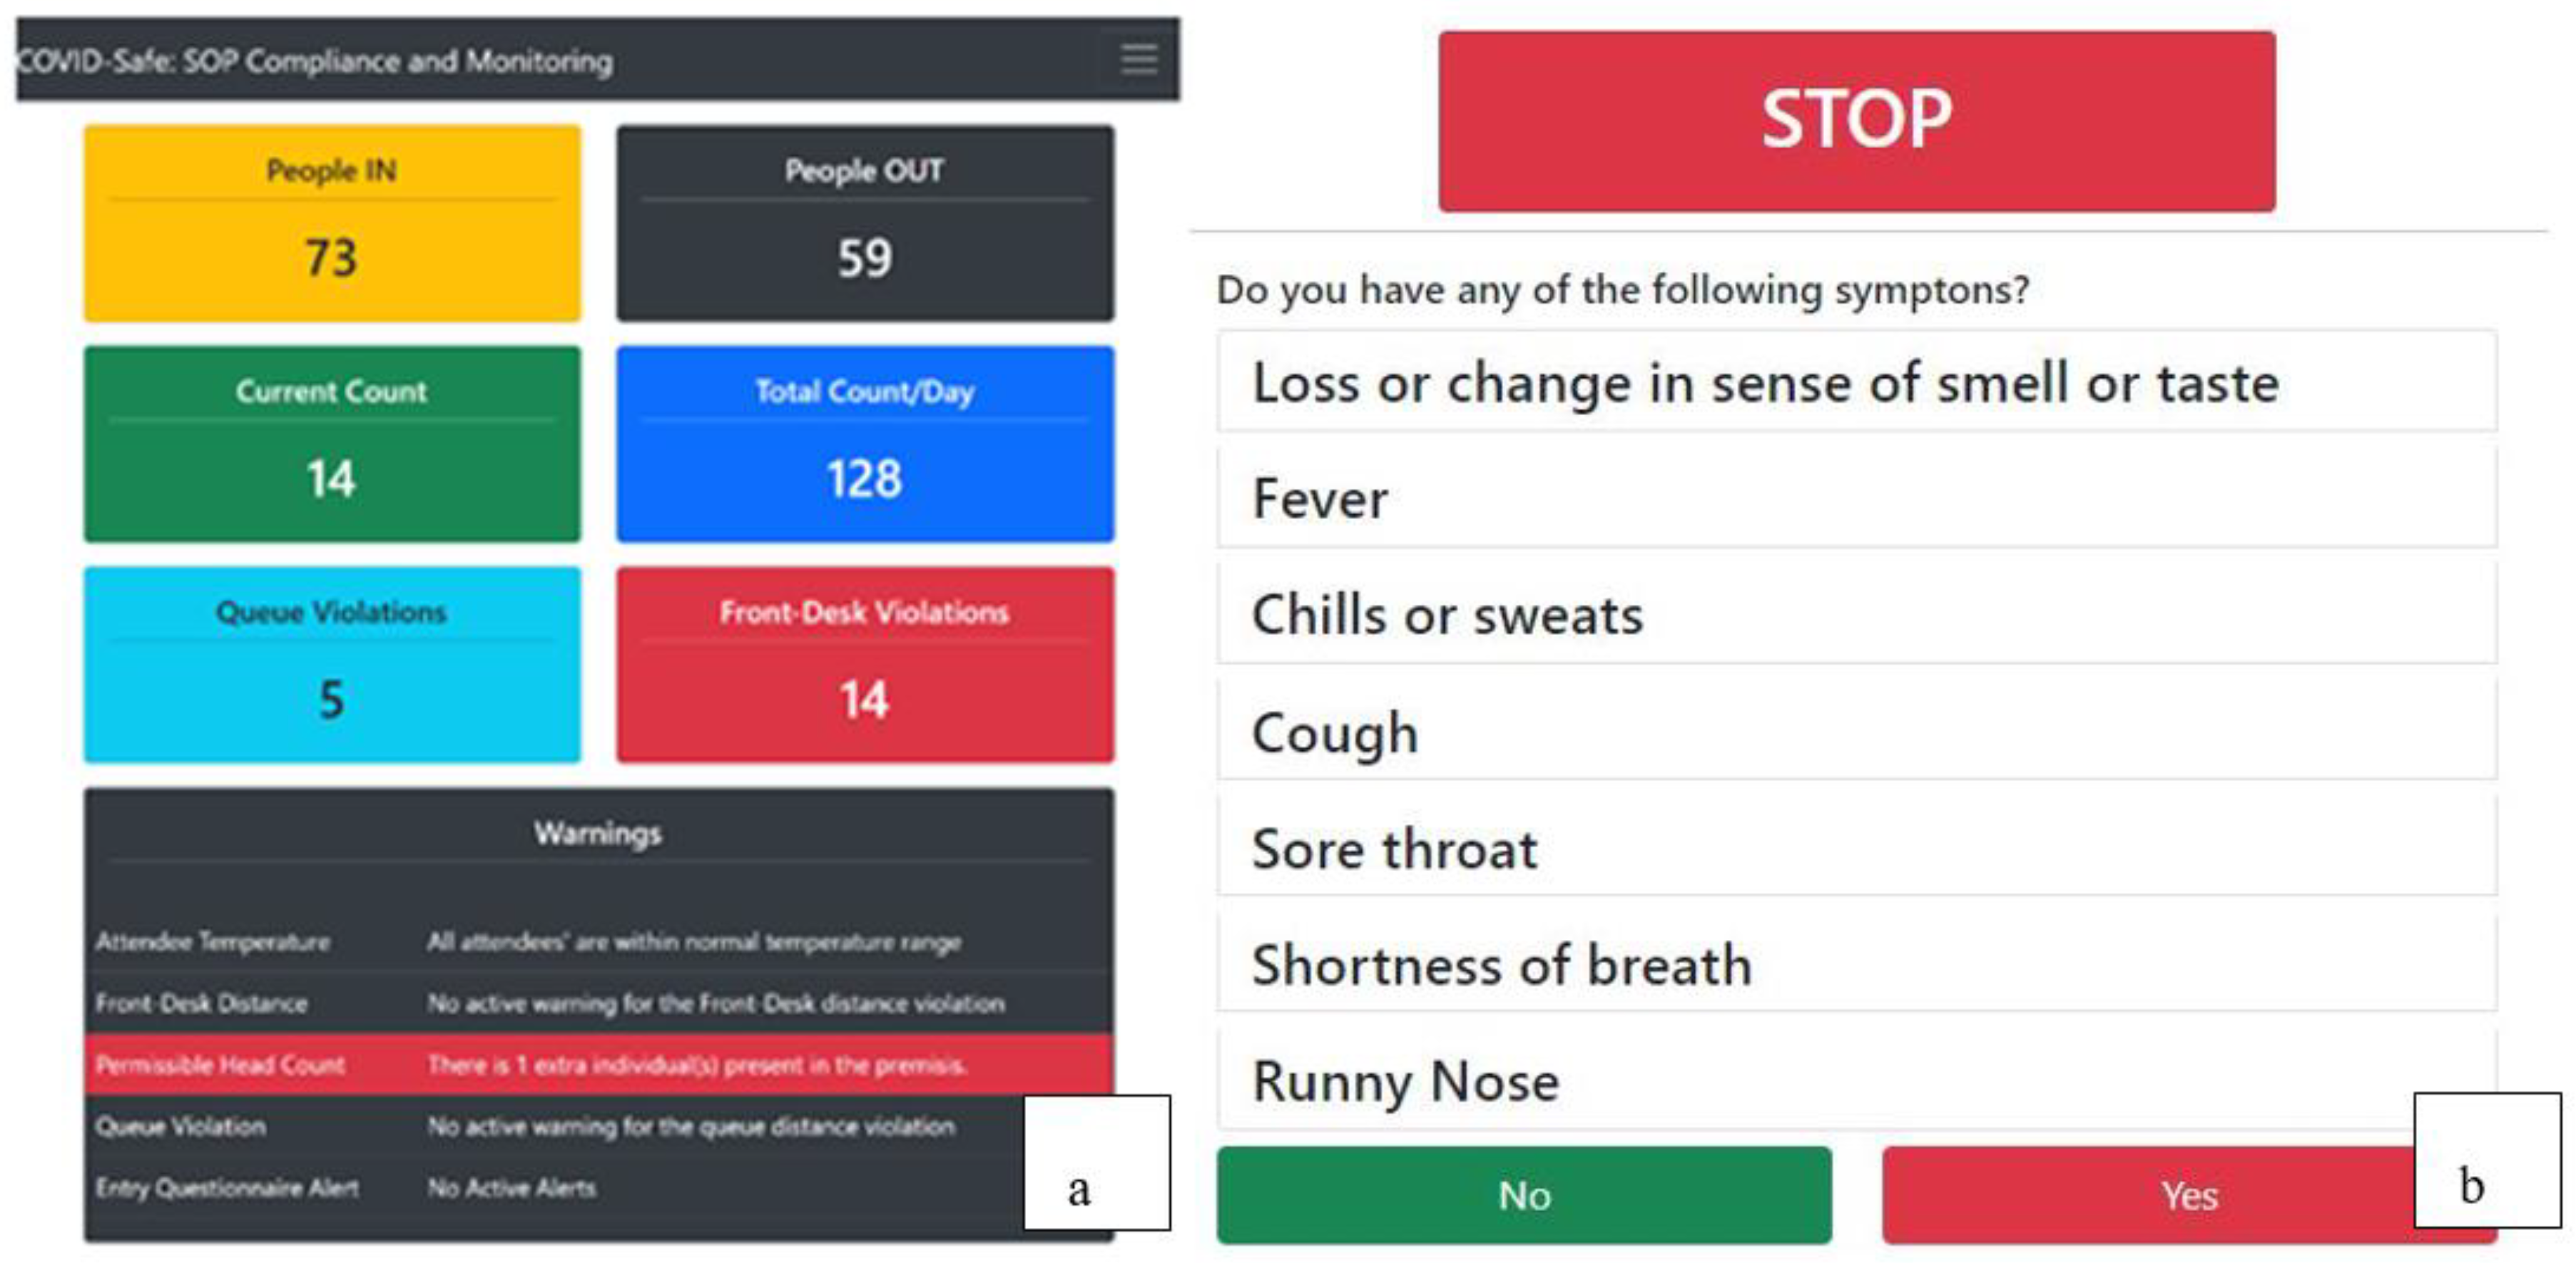
Figure 5a shows the dashboard which graphically displays relevant data received from sensors through the RPi server which was collected over single a day. Sensor data were also displayed on a smartphone. The dashboard was divided into two sections. The first section showed the numerical data regarding the footfall count and the total number of violations. The second section displays the list of any warnings active at any given time.
Figure 5b shows the questionnaire presented to individuals upon entering the premises. If the answer to the questions was “Yes”, an alert is generated on the dashboard indicating the need for assistance by a staff member at the entrance.
4. Conclusion
An effective solution to ensure COVID-19 safety compliance is presented in this work. The system relies on open source software and widely available sensors to make a low cost and easy to configure and customize set up. It relays useful real-time information wirelessly to a dashboard which can be used to monitor and assist in COVID-19 SOP. The system is currently limited to check distance violation only in the specified area (i.e., queue). Future efforts will be focused to expand the detection for the complete floor area, contact tracing, and support for additional queues. The system can be extended easily with minimal time and is quickly adaptable to different situations.


