1. Introduction
Cadmium-based QDs are one of the most widely used semiconducting QDs, as they have useful properties for biochemical sensors, biomedical imaging, photovoltaic applications, light-emitting diodes (LEDs), thin-film transistors, lasers, and solar cells [
1,
2]. A negative consequence of this widespread use is the release into the environment of such noxious material. To prevent their uncontrolled discharge, it is essential to develop simple methods to detect them in waste or even in the environment. The implementation of paper sensors for colour analysis provides fast responses, simple operation, and low cost in the detection of CdSe QDs. Here, we report new spectroscopic data about the immobilization on cellulose paper of a Schiff base containing a carboxylic acid substituent, H
2SB [
3]. In addition, we present here our progress in the study of the interaction between H
2SB and CdSe-Cys QDs. The usefulness of the H
2SB-modified paper (
Figure 1) for the detection of CdSe-Cys QDs was demonstrated by registering an absorbance decrease in the band at 270 mm, with a simultaneous increase in the CdSe-Cys QDs concentration from 100 ppb to 2 ppm [
4]. In order to help elucidate how H
2SB interacts with CdSe-Cys QDs, Cd
2(SB)
2(H
2O)
4 has been synthesized and studied by
1H NMR, ATR-FTIR, and UV-Vis spectroscopy.
2. Results and Discussion
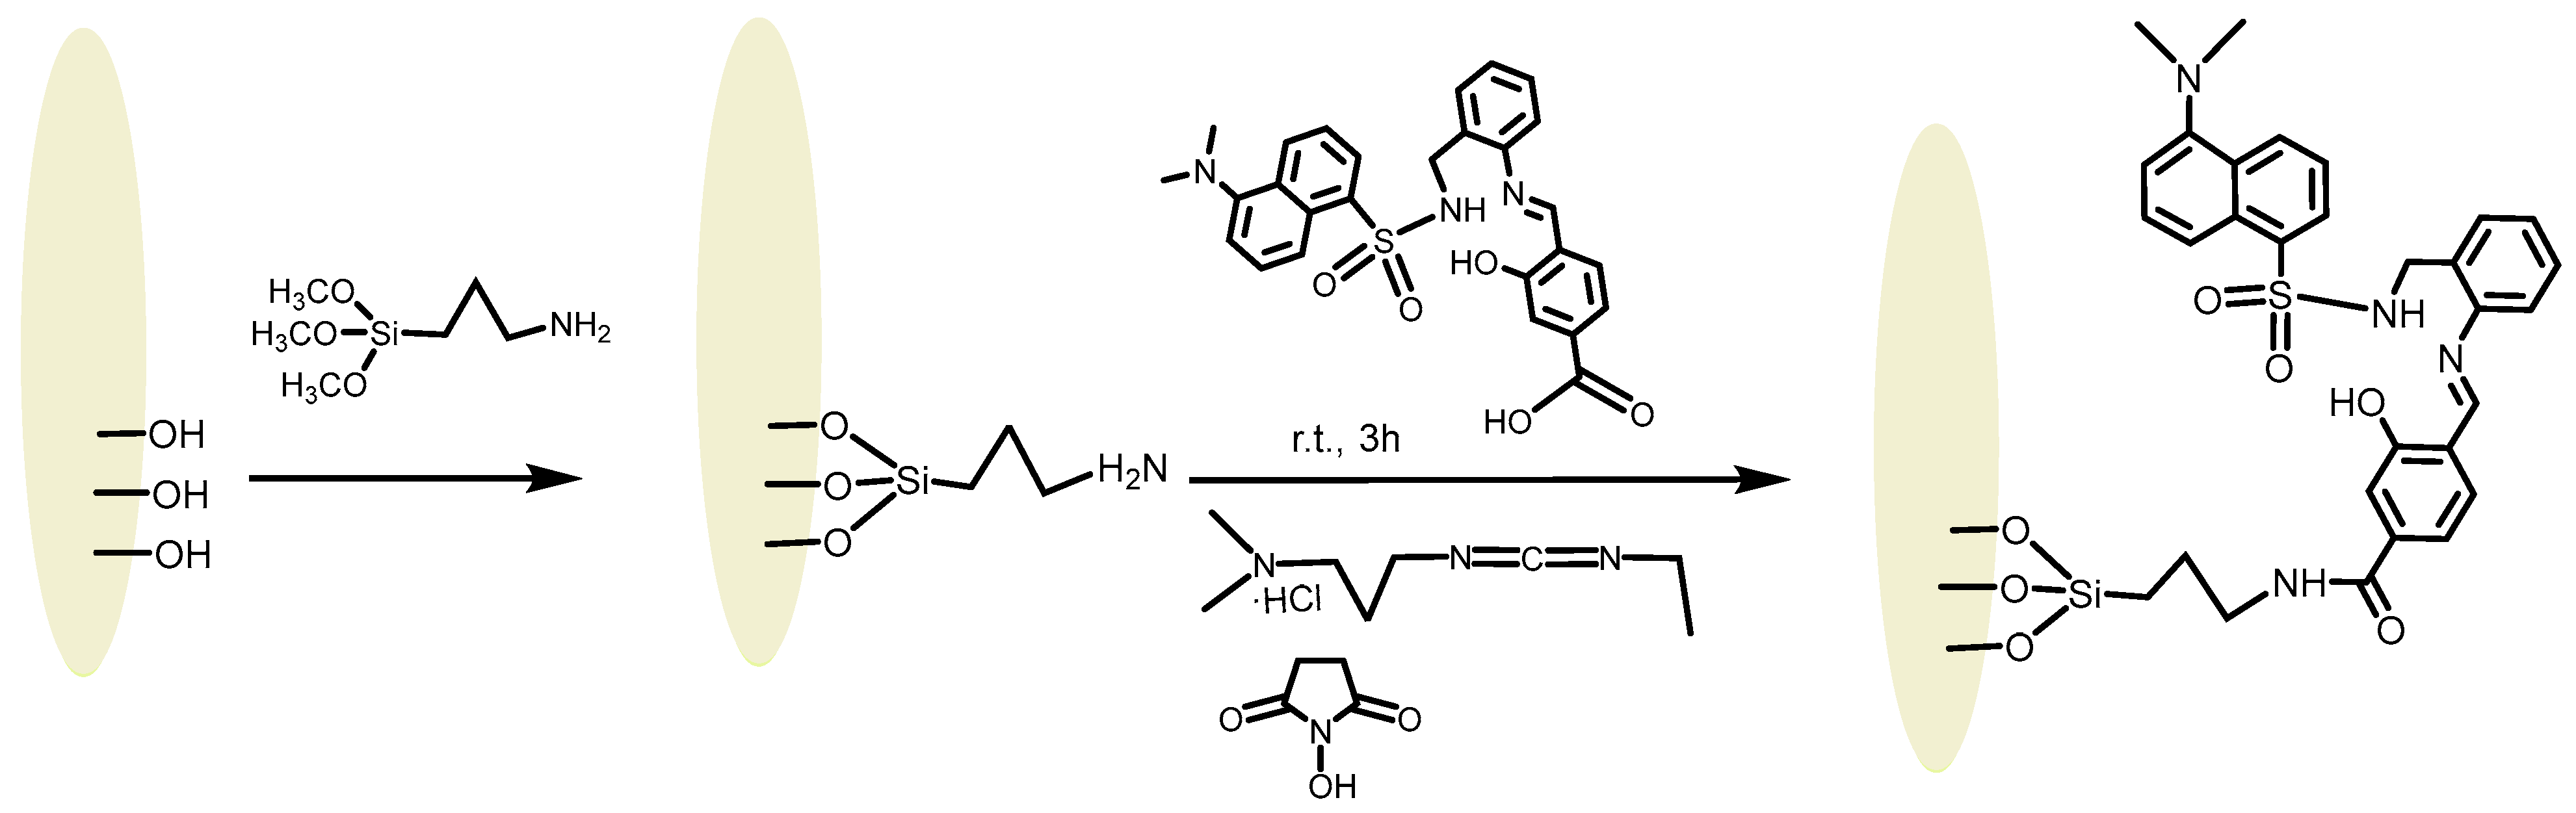
The cellulose paper was first primed with (3-aminopropyl)trimethoxysilane (APTMS) after soaking it in a DMF solution for 2 h (
Figure 1). In the second reaction step,
N-(3-dimethylaminopropyl)-
N′-ethylcarbodiimide hydrochloride (EDC·HCl),
N-hydroxysuccinimide (NHS), as well as the chemosensor H
2SB, were added together to achieve its immobilization on the amine-modified paper (by forming an amide bond) [
4].
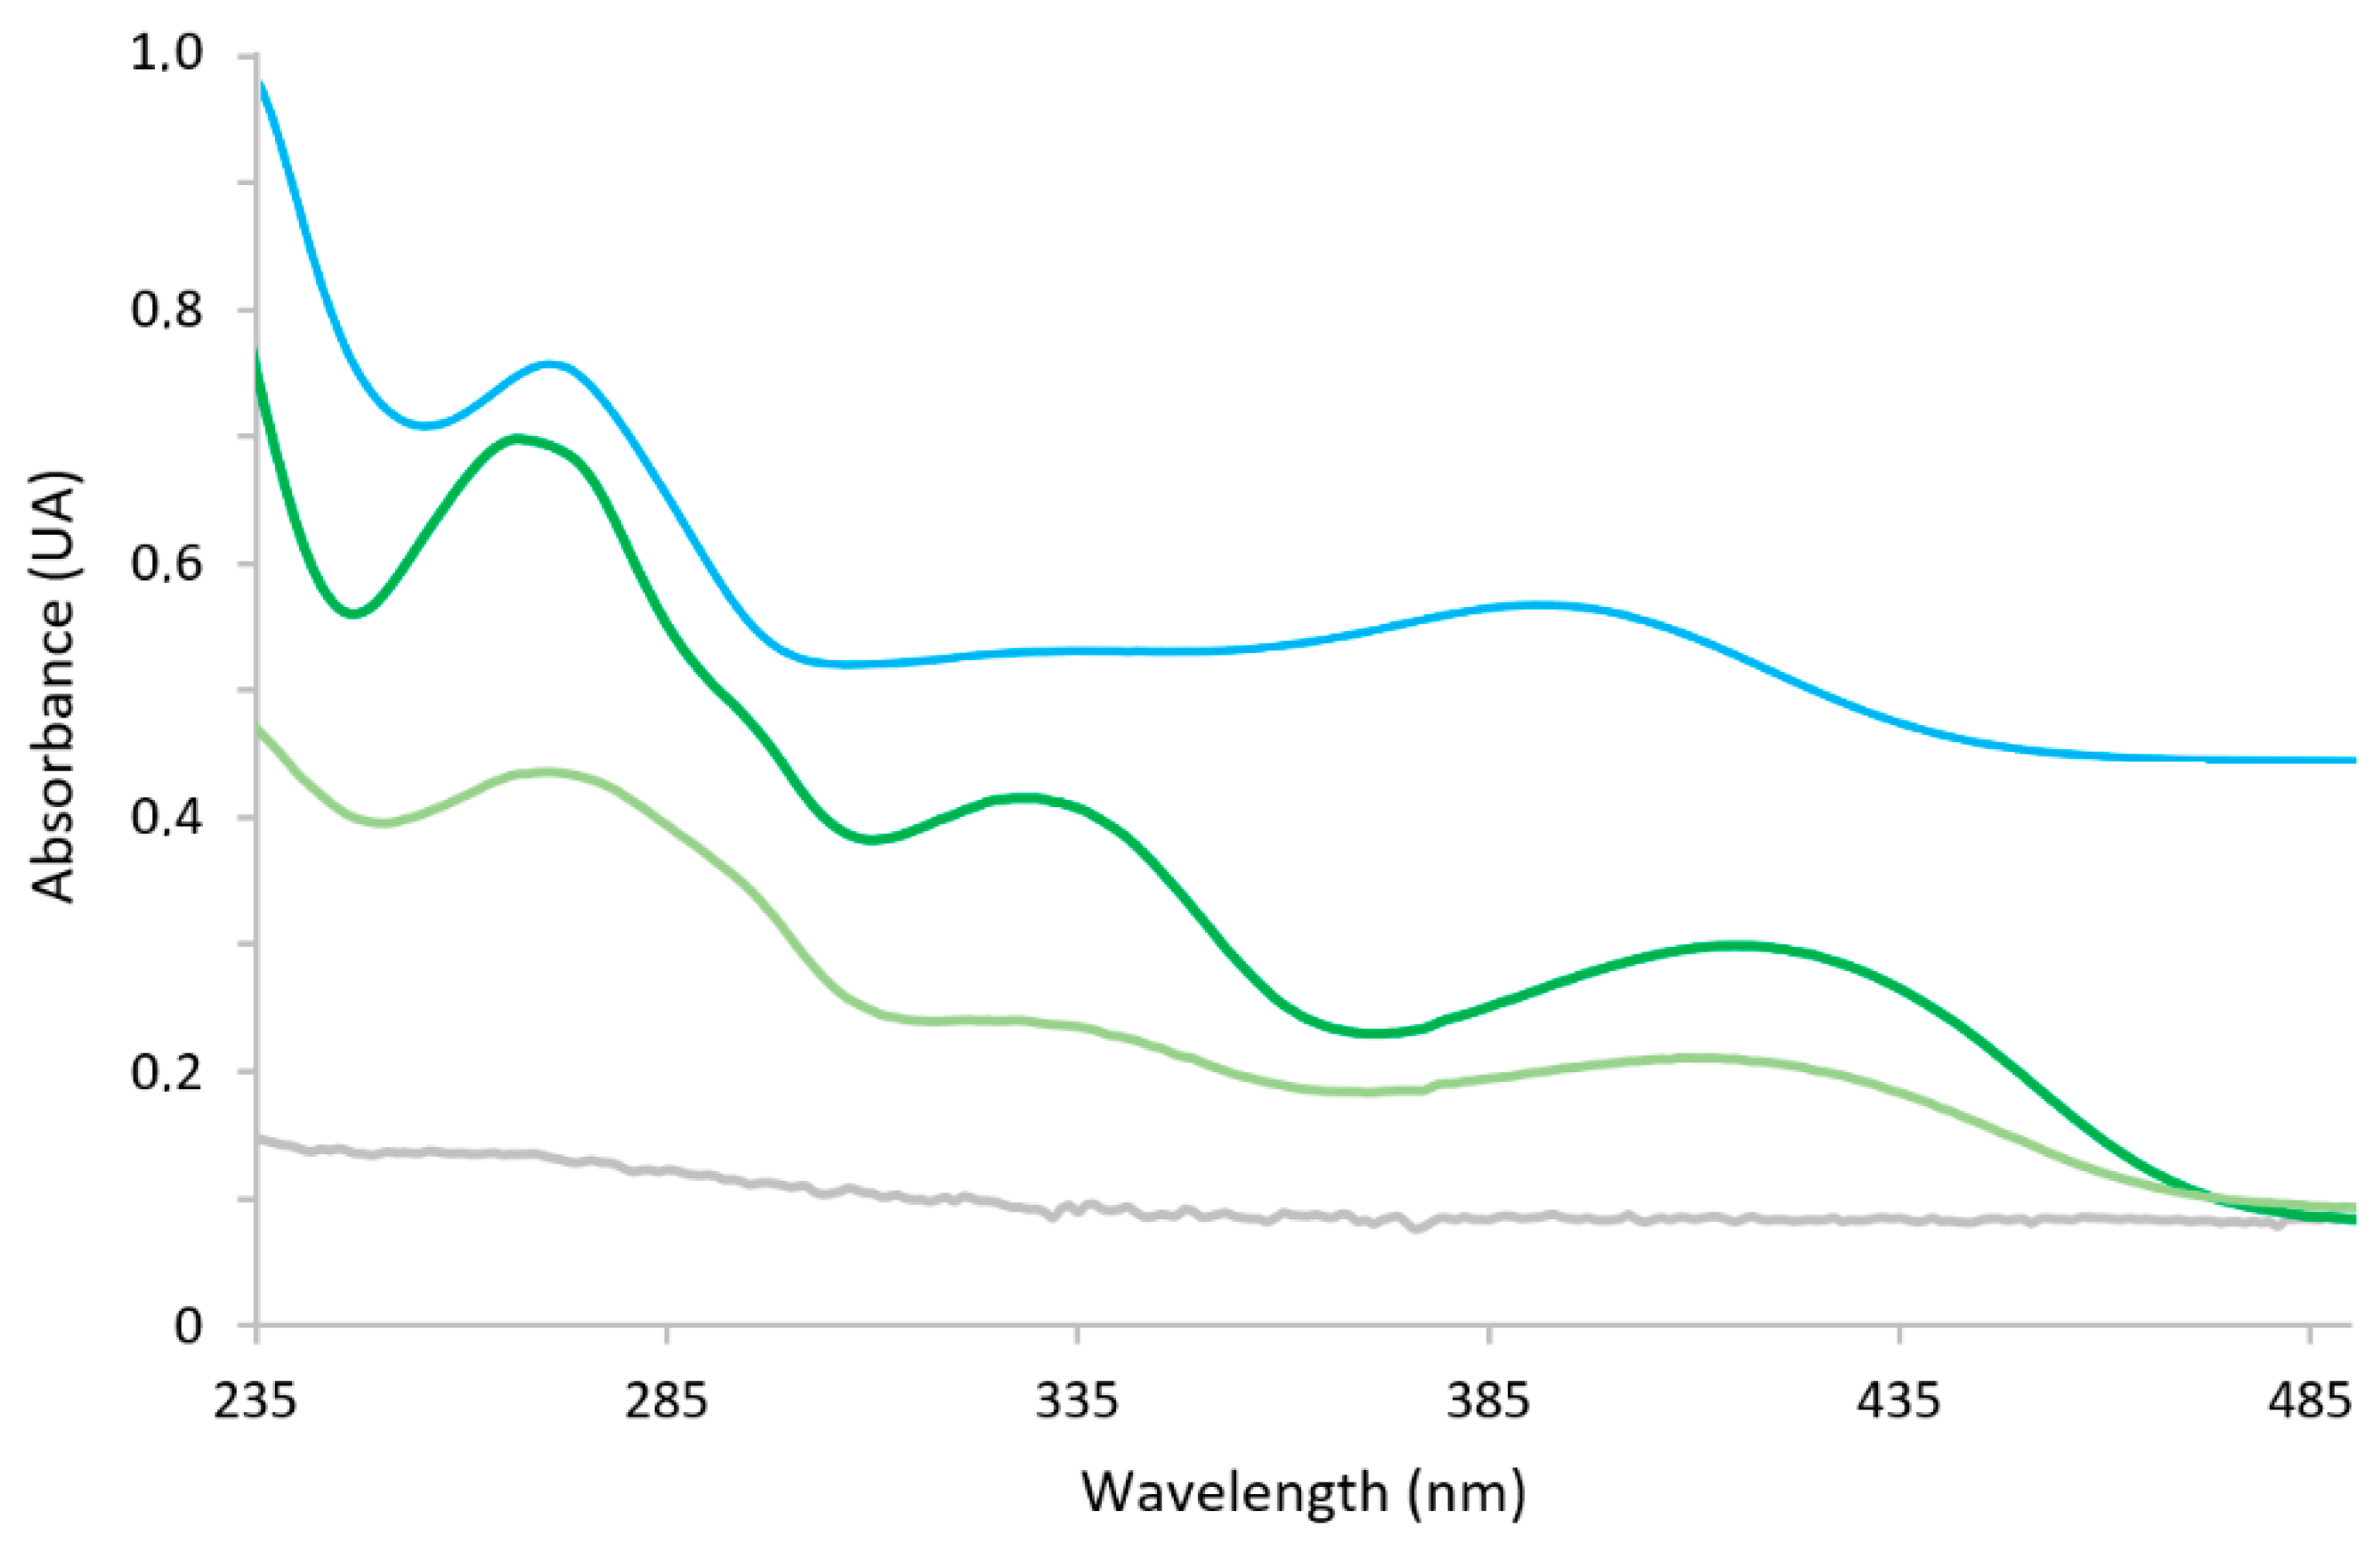
The observation of three dominant signals located around 270, 330, and 420 nm in the diffuse reflectance spectrum of the chemosensor-modified paper demonstrated its immobilization (
Figure 2). One of the dominant absorption bands appeared to red-shifted around 30 nm, with respect to the spectrum of an ethanol solution of the chemosensor (390 nm).
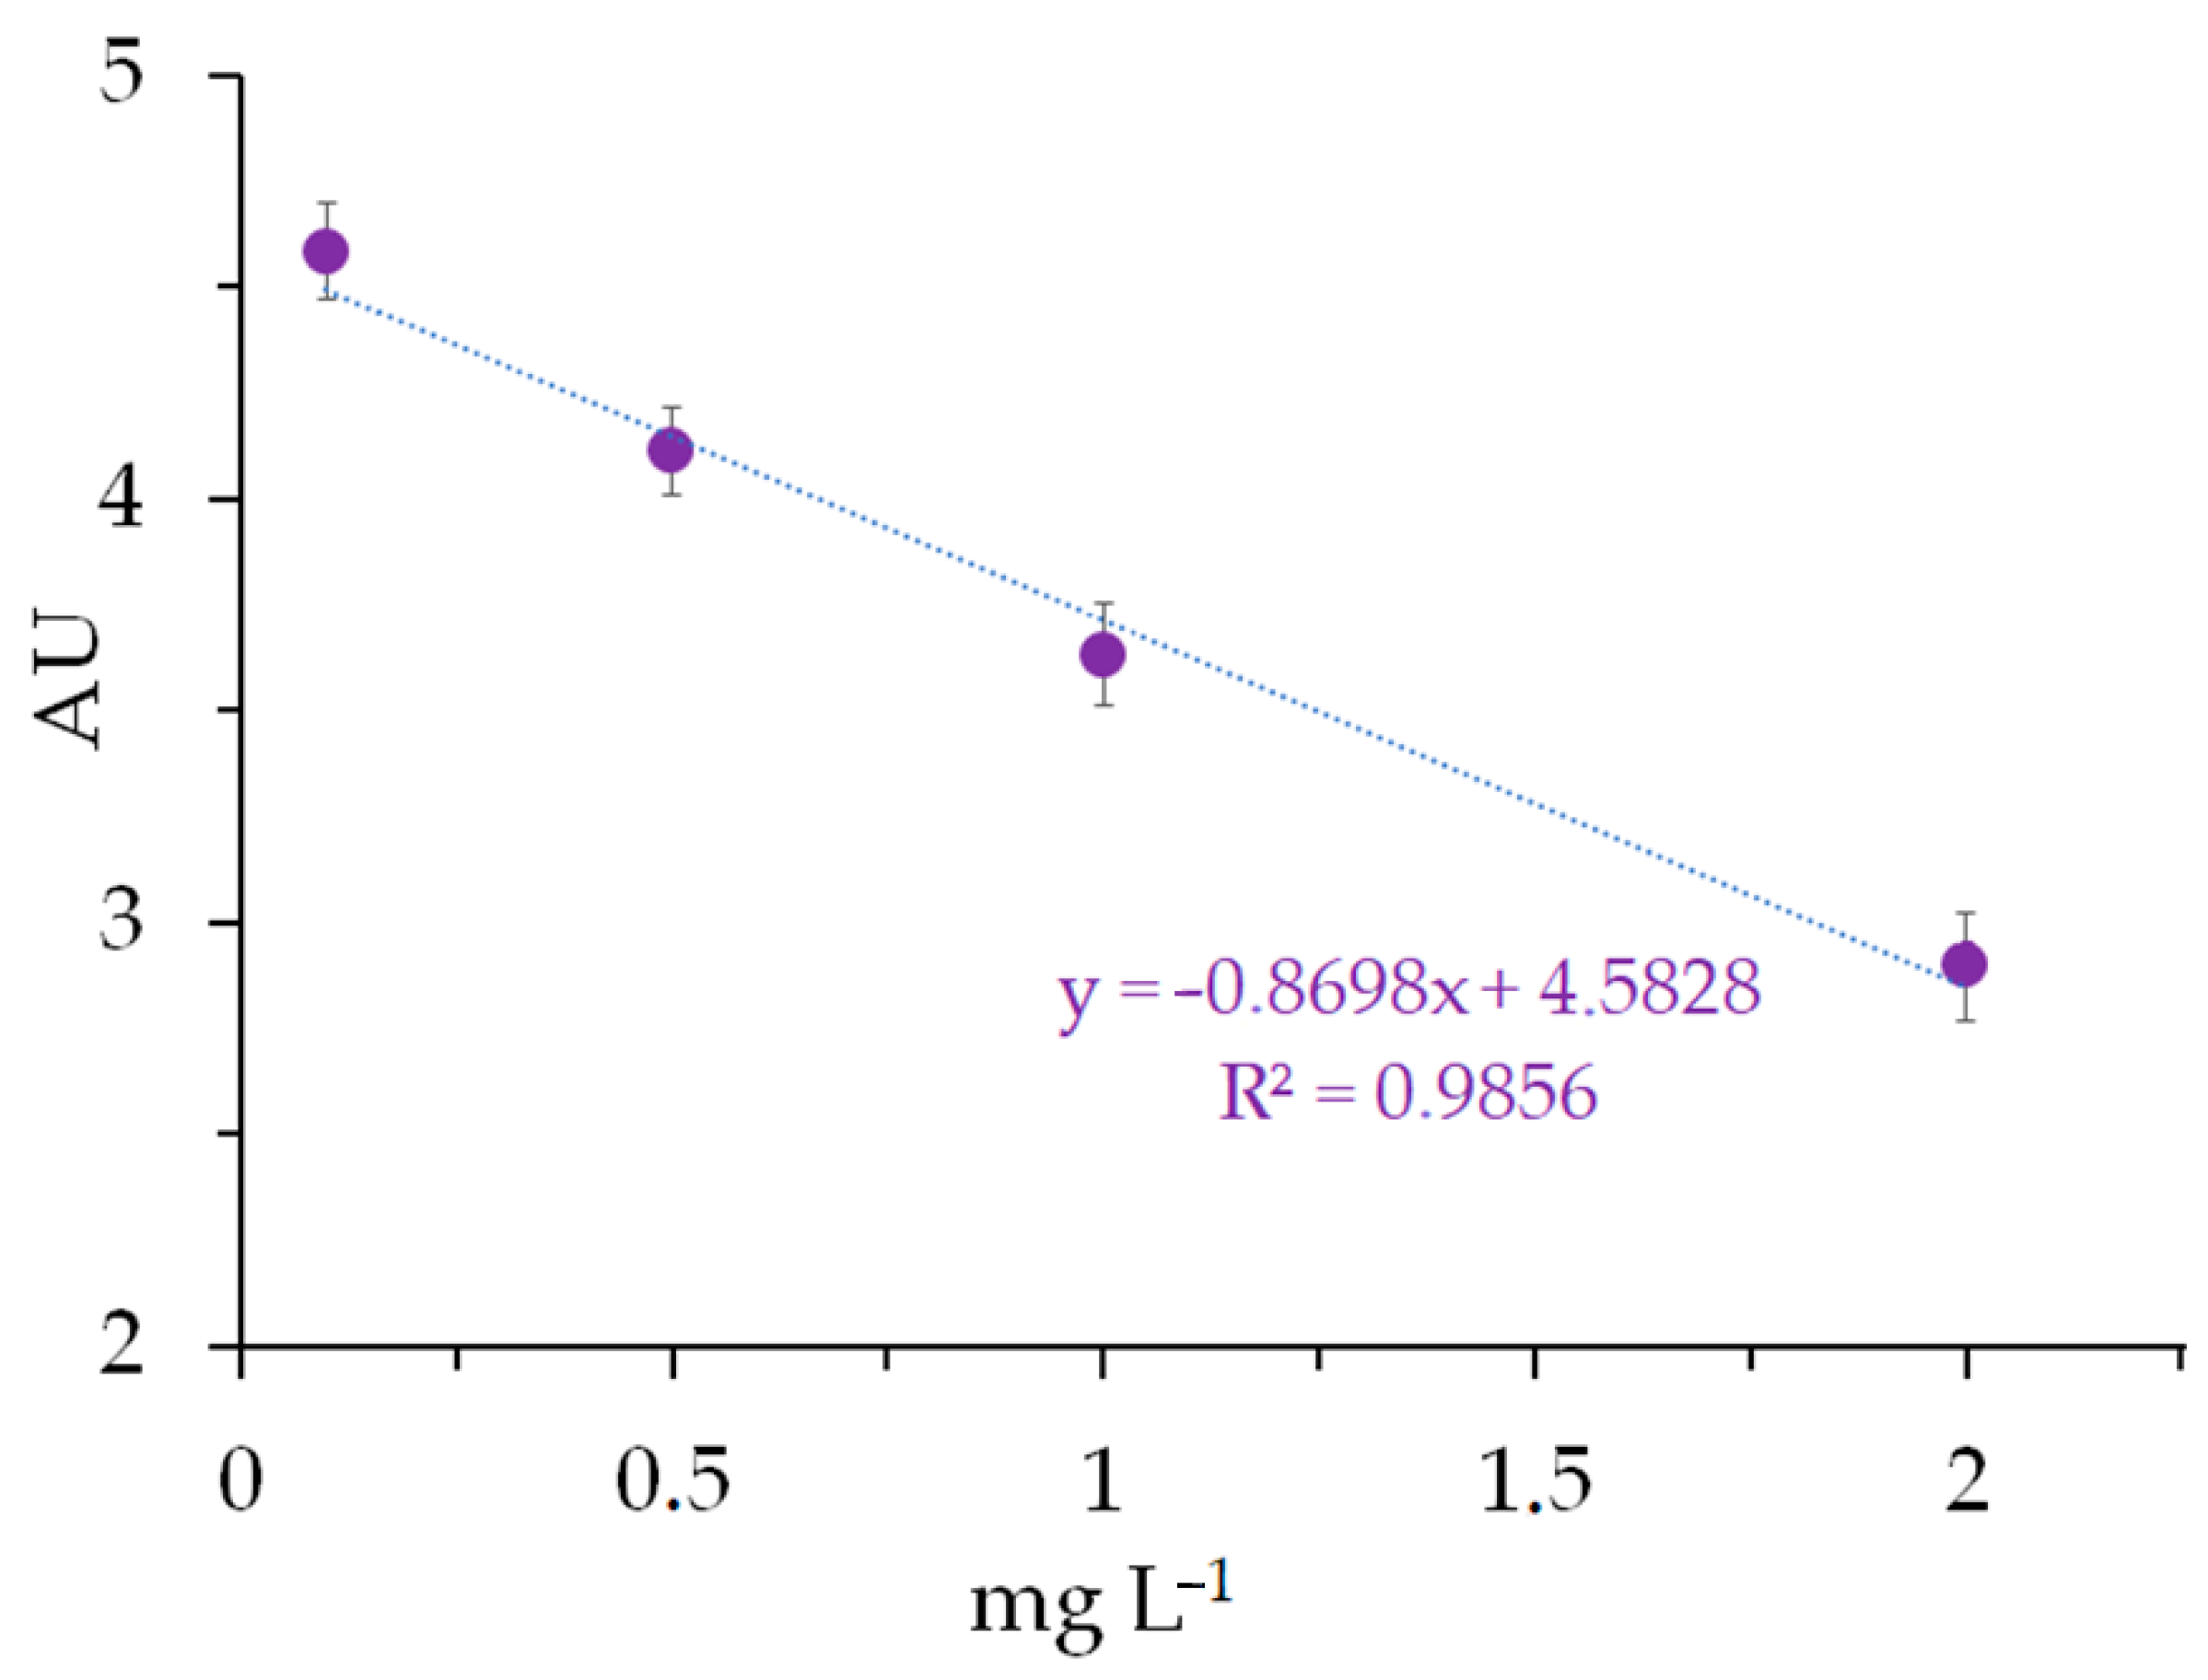
The chemosensor-modified cellulose paper after being soaked in CdSe-Cys QDs water solutions for two hours exhibited a decreased absorbance of each band of its diffuse reflectance spectrum. As the most pronounced decrease was observed for the band at 270 nm, this wavelength was chosen to carry out the measurements (
Figure 3). The limits of detection (LODs) and of quantification (LOQs) of H
2SB were expressed as LOD = 3SD/M and LOQ = 10SD/M, where SD is the standard response deviation and M is the slope of the calibration curve. The LOD and LOQ calculation results were 245 and 815 ppb, respectively.
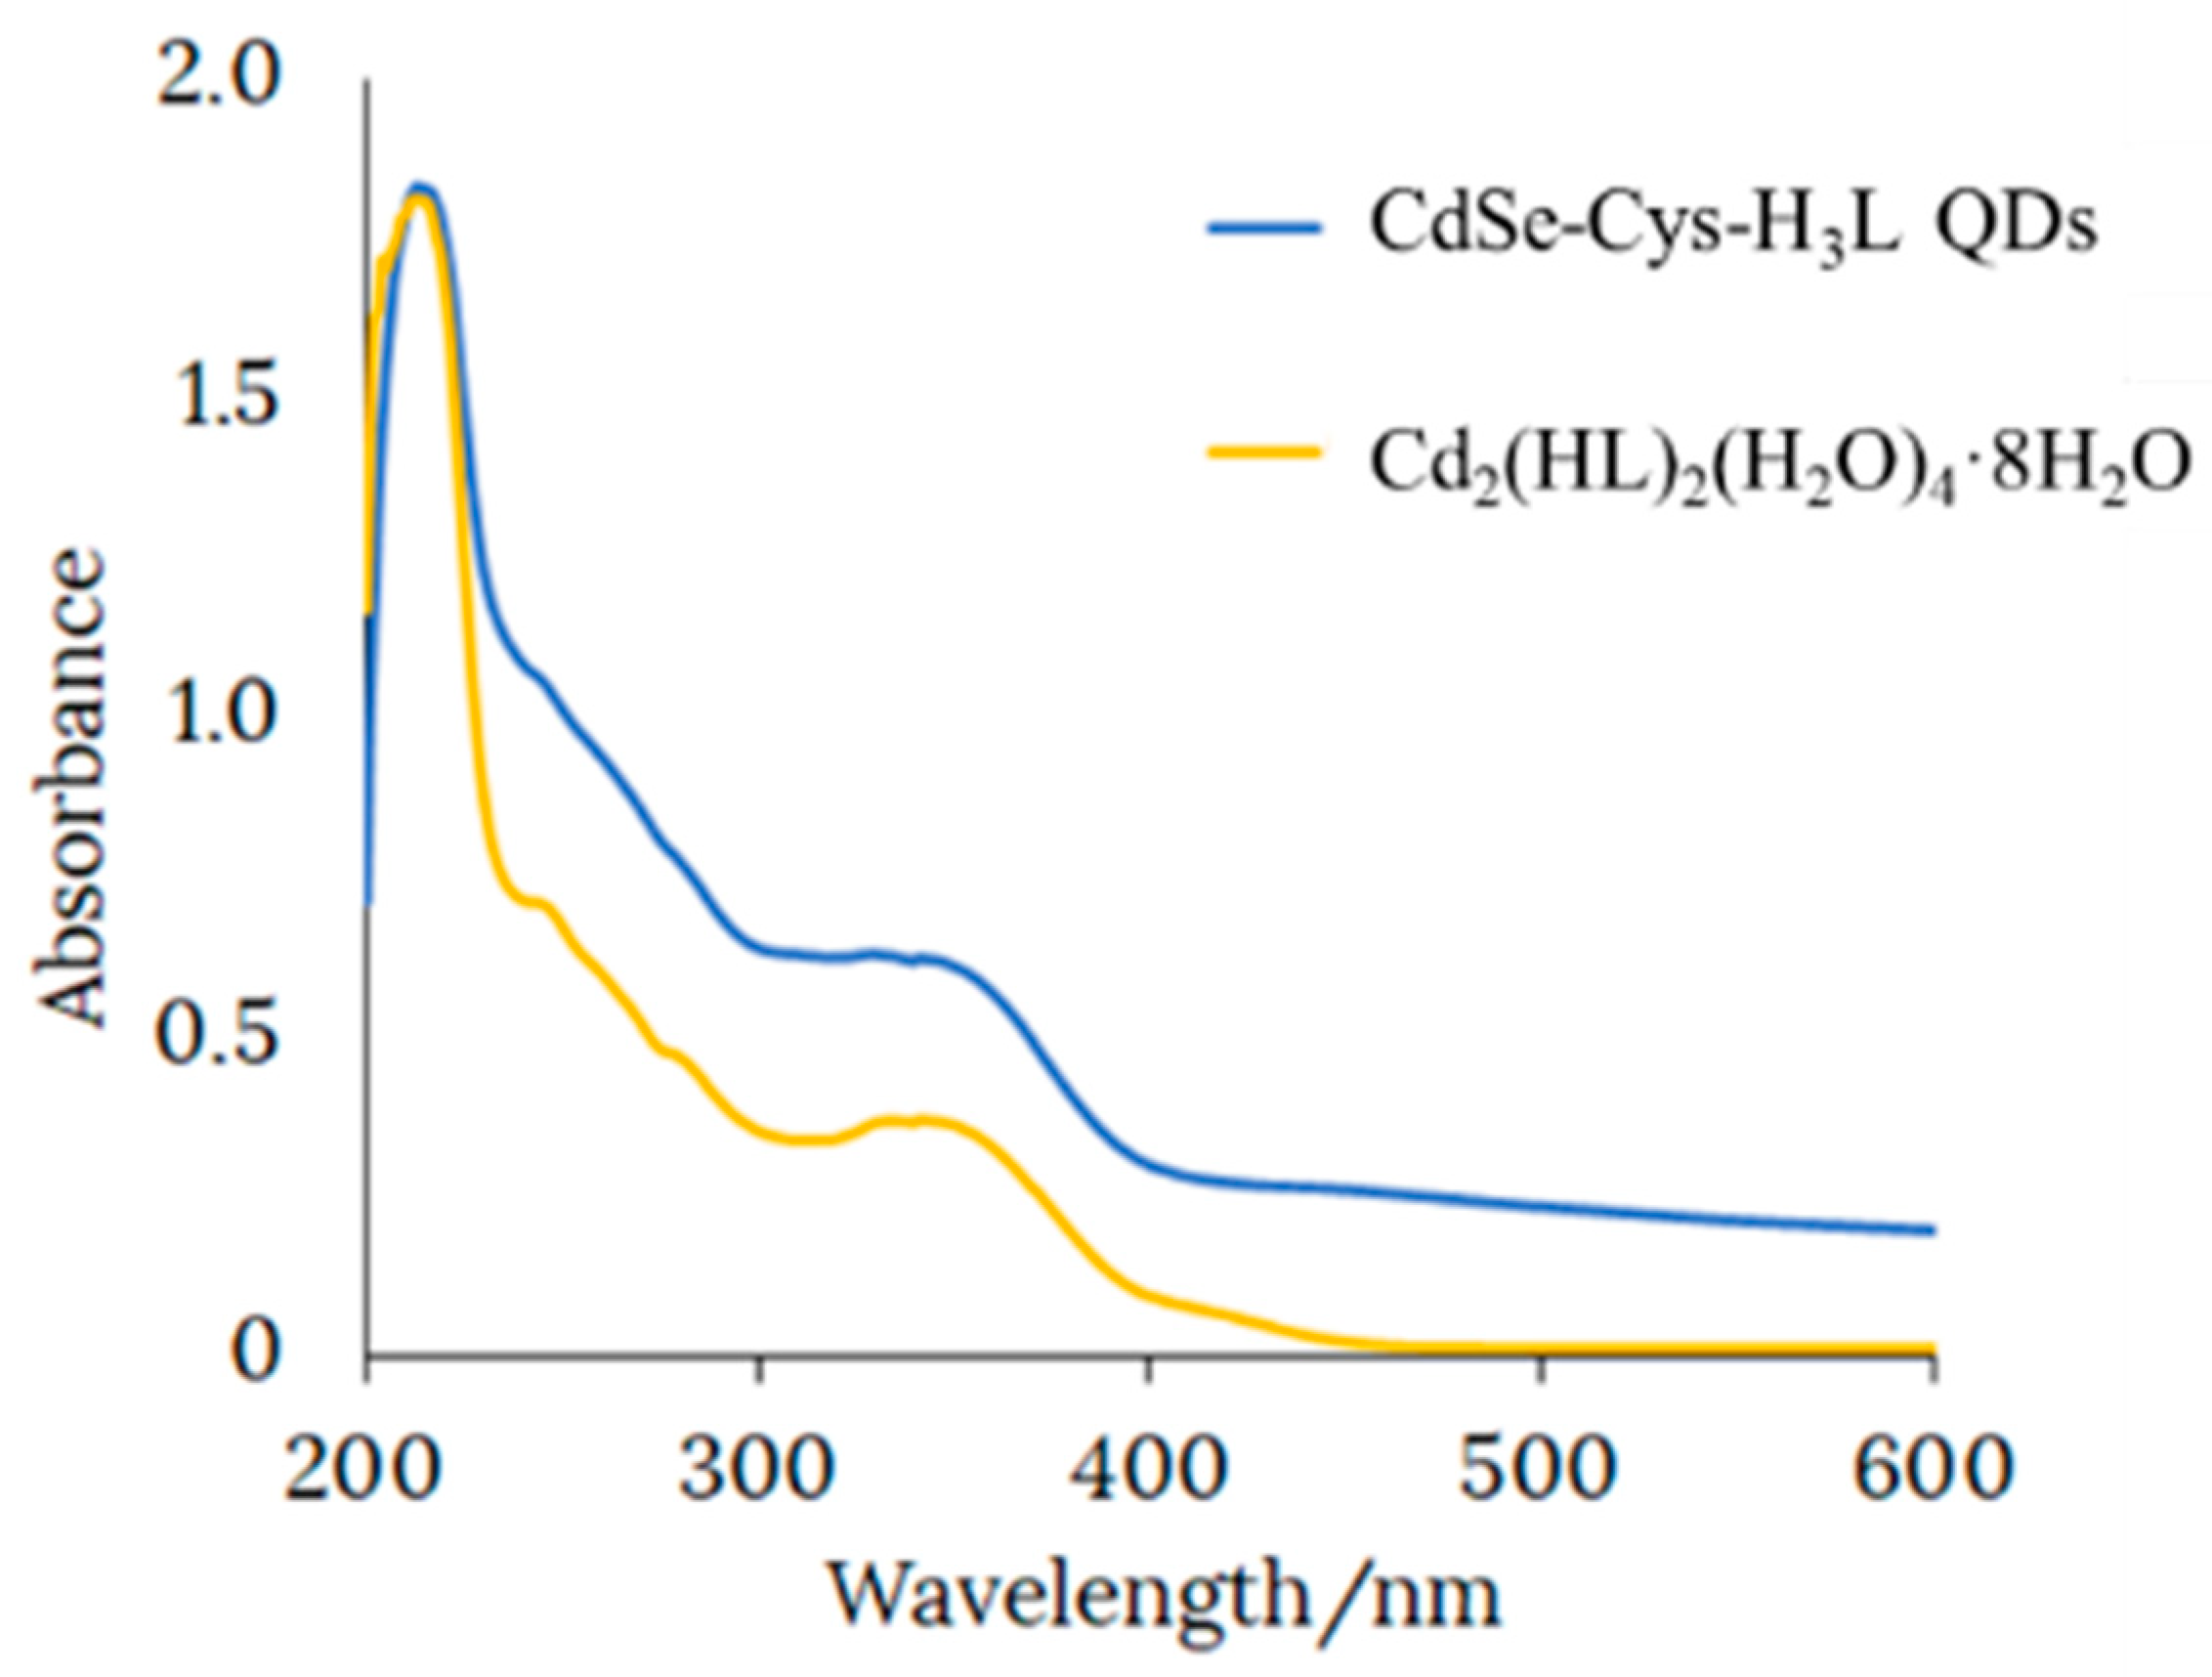
To study the type of interaction between the CdSe-Cys QDs and H
2SB, we obtained Cd
2(SB)
2(H
2O)
4·8H
2O from the reaction of Cd(OAc)
2·2H
2O and H
2SB in an ethanol solution at room temperature. The similarities between the UV-Vis spectra of Cd
2(SB)
2(H
2O)
4·8H
2O and CdSe-Cys-H
2SB QDs (
Figure 4), with three bands at about 220, 250, and 340 nm, evidenced an interaction via metal–ligand coordination between CdSe-Cys QDs and H
2SB.
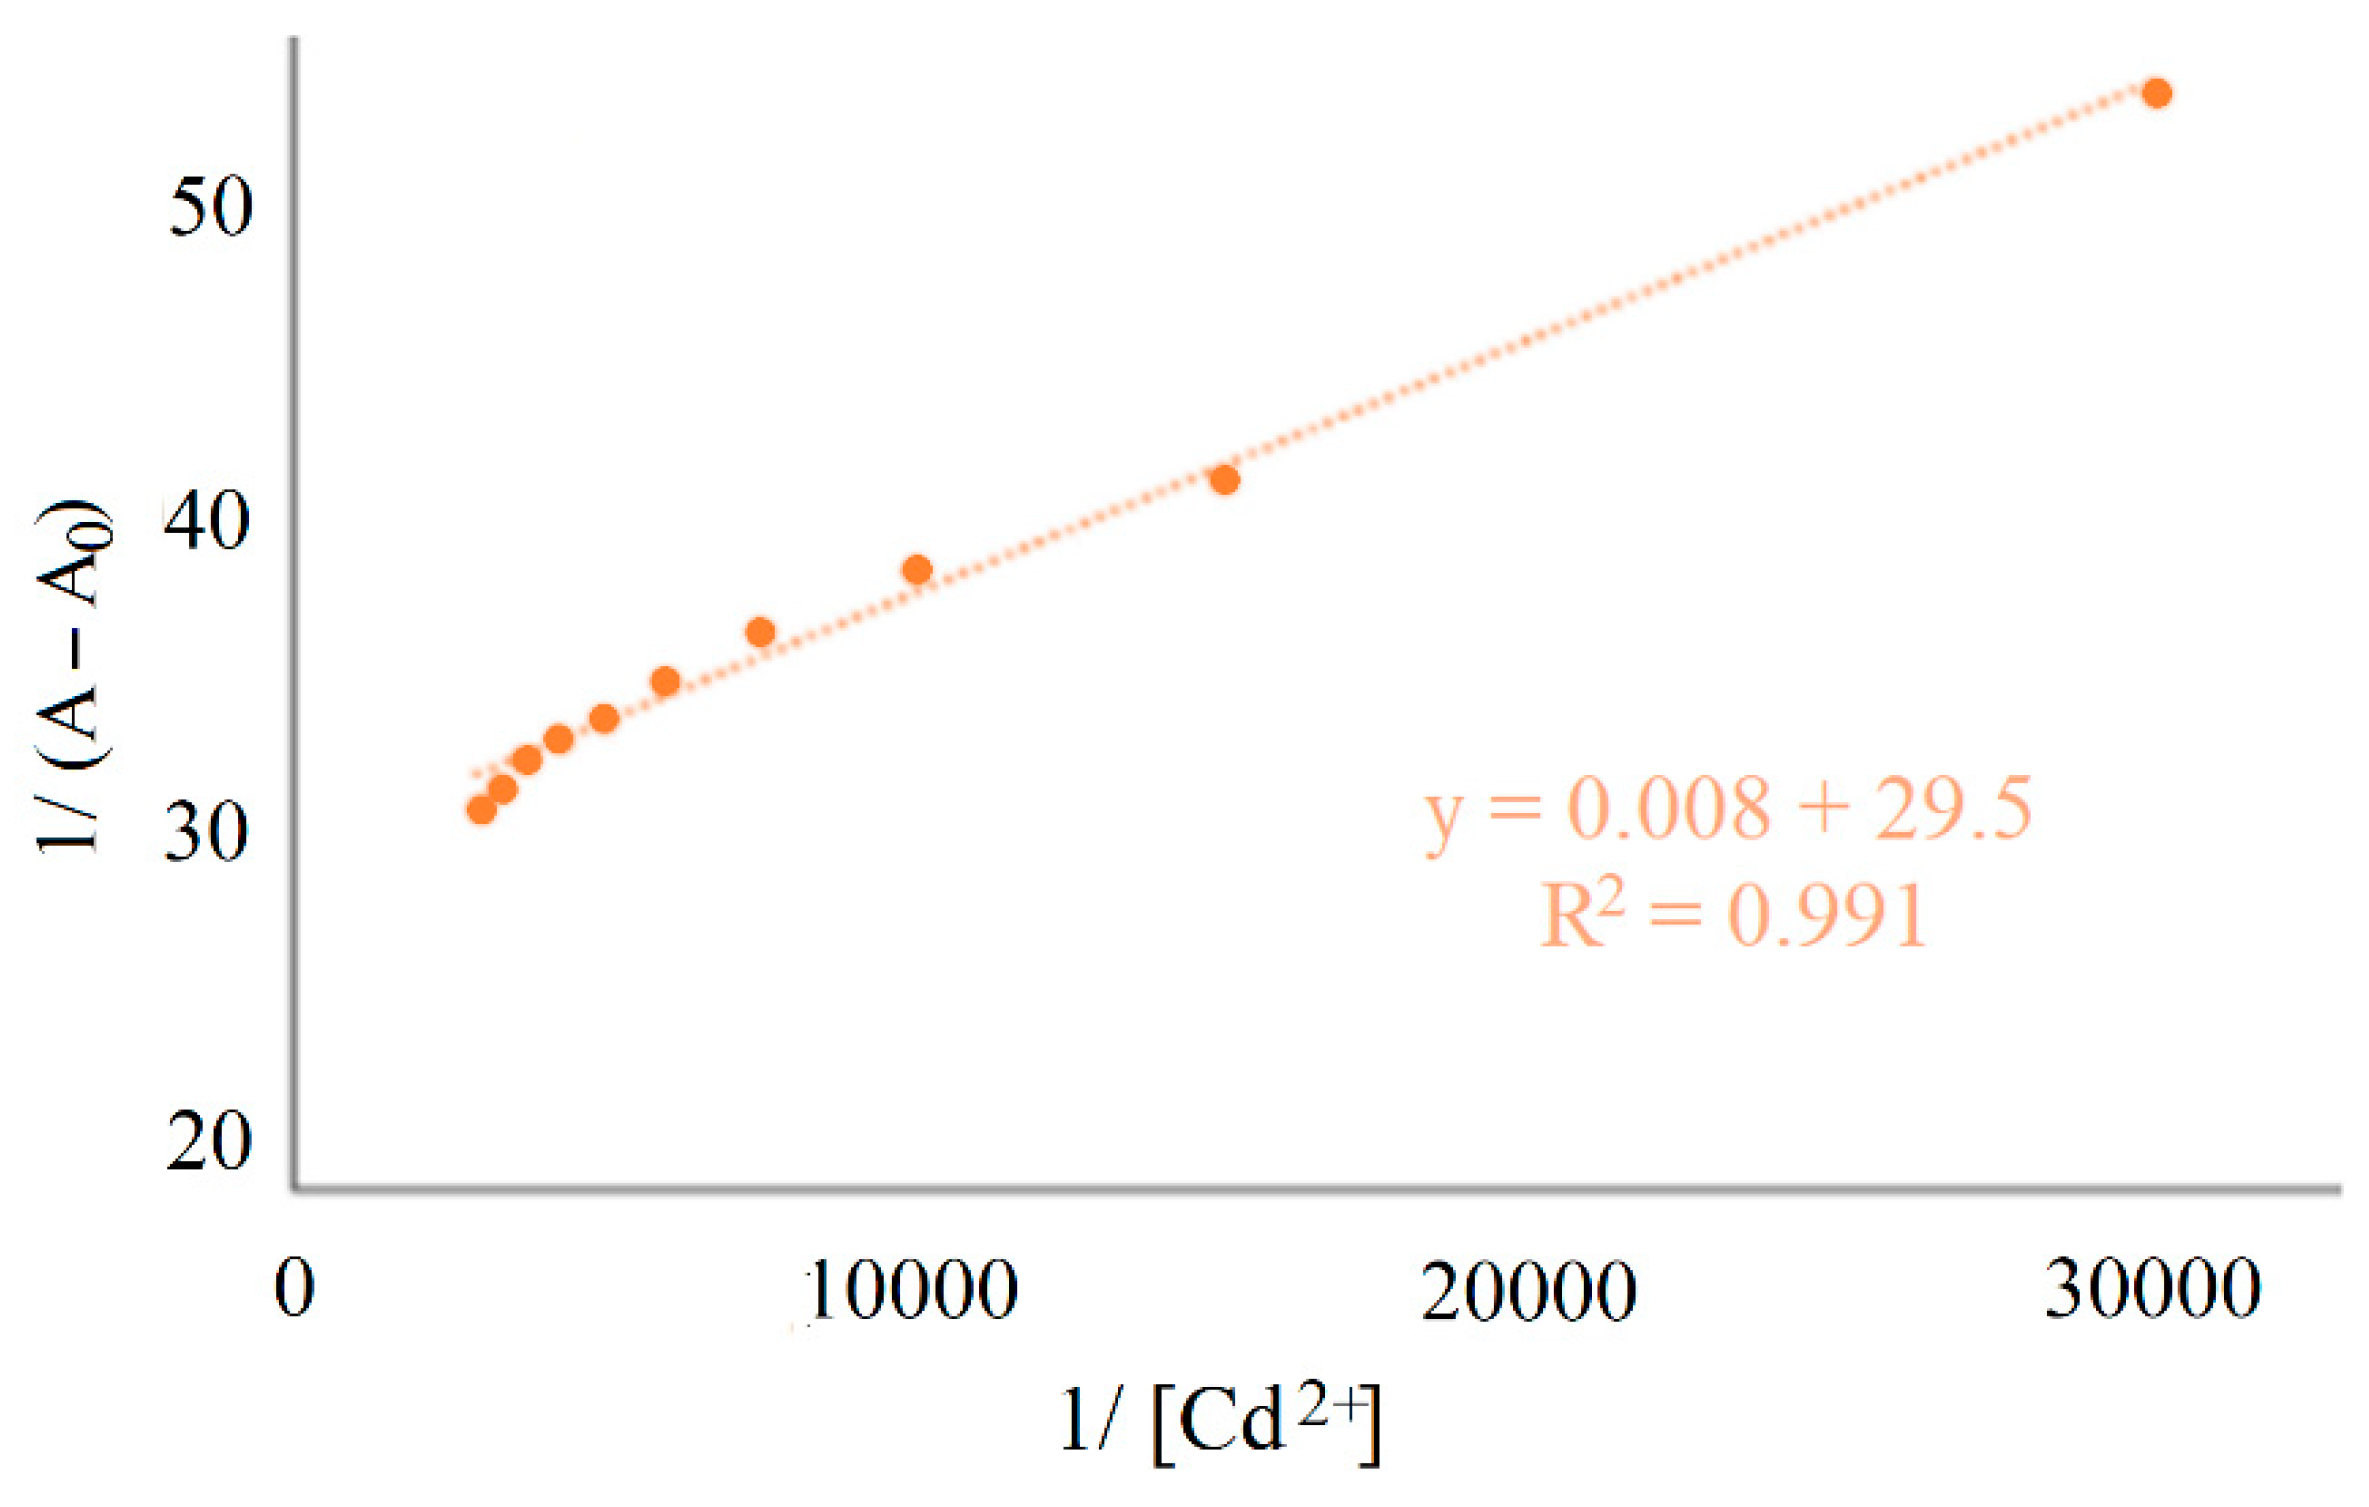
The binding constant value of H
2SB with Cd
2+, at room temperature, has been determined from UV-Vis absorption data following the Benesi–Hildebrand equation [
5] (K
b = 3.686 × 10
3 M
−1) for 1:1 (metal:ligand) complexes (
Figure 5). The binding stoichiometry used in the determination of K
b was obtained by elemental analysis.
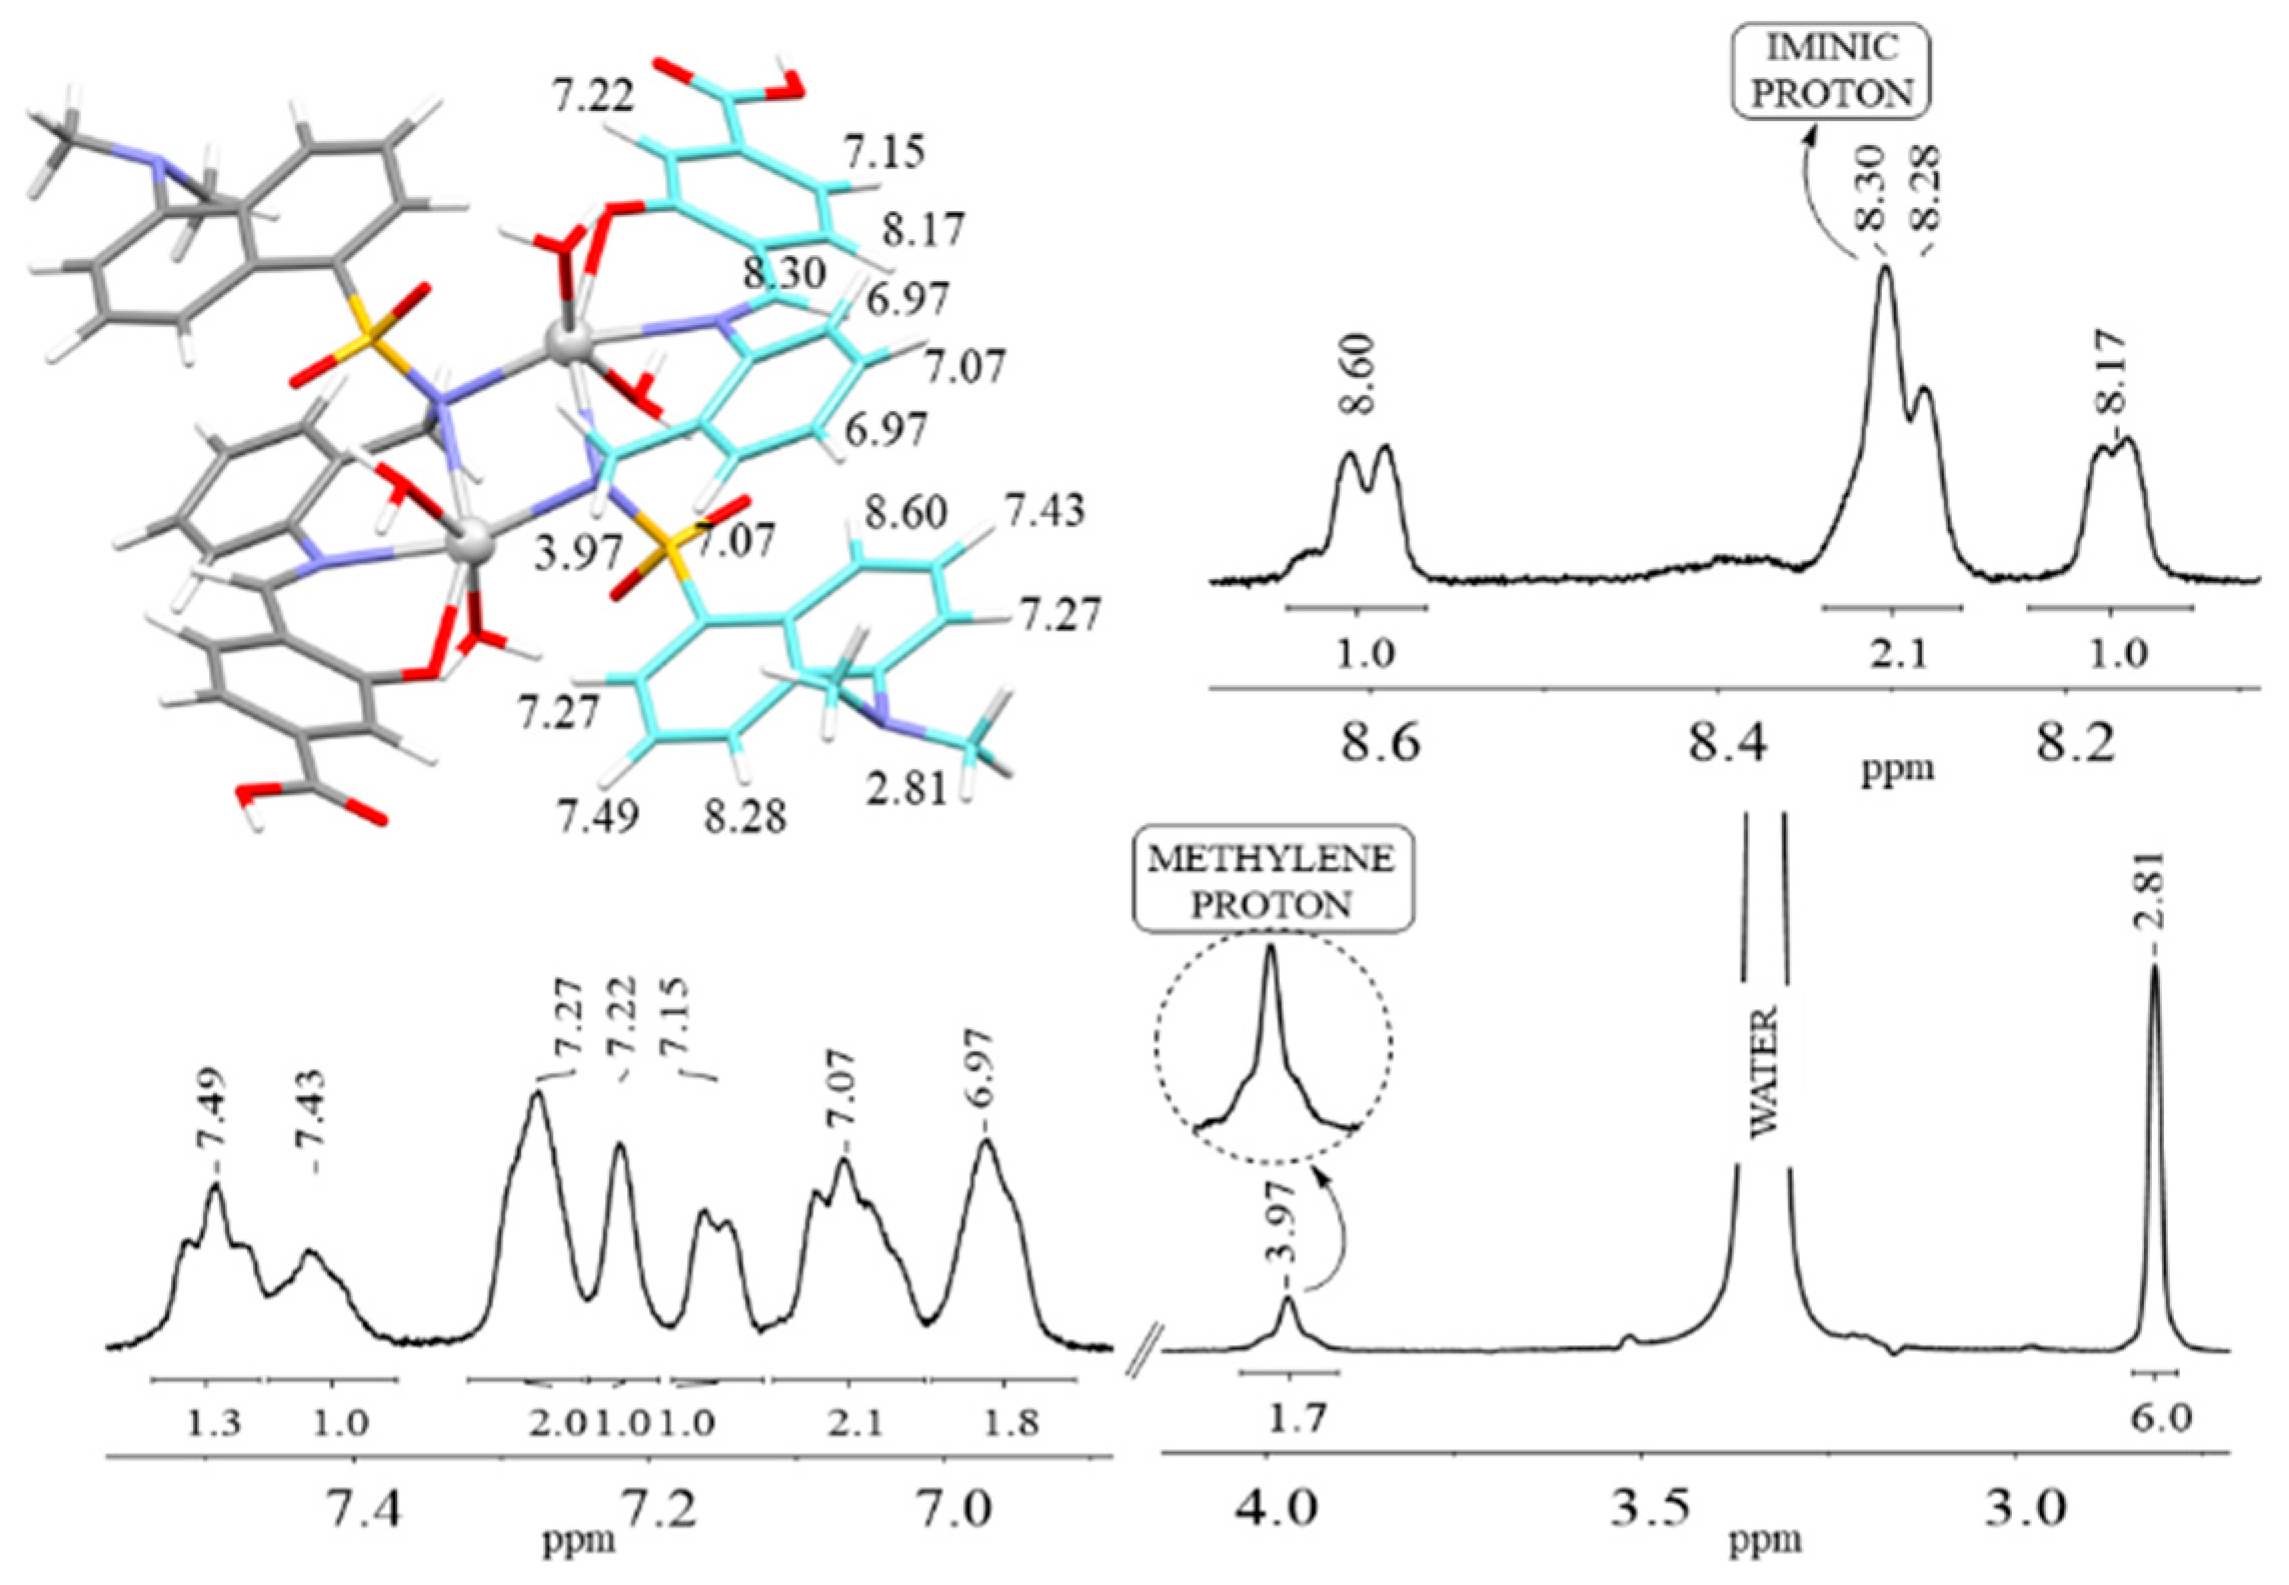
The
1H NMR spectrum of the cadmium(II) complex revealed the chelating behaviour of the ligand through the O
phenol, N
imine, and N
sulfonamide atoms.
Figure 6 shows the absence of the signal corresponding to OH
phenol (12.29 ppm) and NH
sulfonamide (8.37 ppm) as well as the upfield shift (about 0.3 ppm) of the -CH=N signal which was observed at 8.63 ppm in H
3L. This is consistent with the formation of a cadmium complex with a sulfonamide bridge, similar to those reported for complexes of similar Schiff base ligands [
6,
7]. The
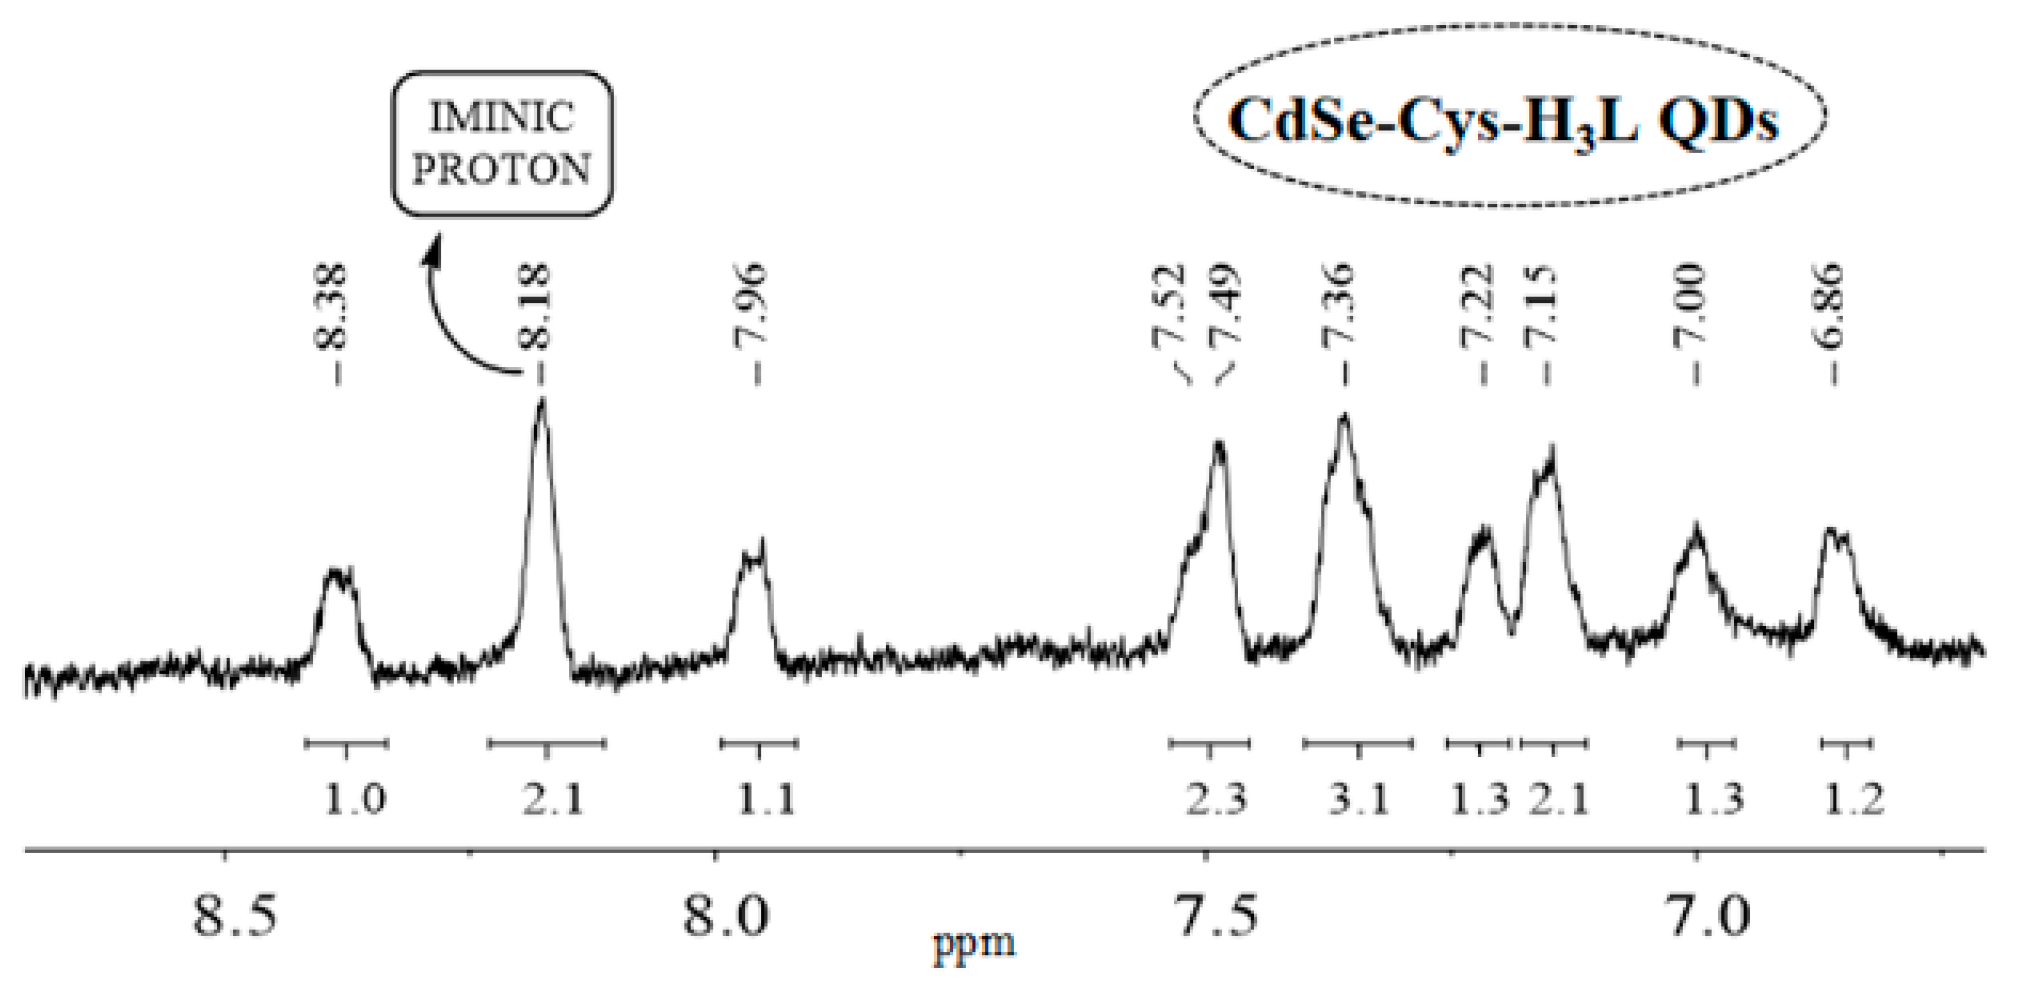
1H NMR spectrum of CdSe-Cys-H
3L QDs (
Figure 7) showed the absence of the signals corresponding to OH
phenol and NH
sulphonamide, which indicates that the interaction between the QDs and the ligand occurs through its bideprotonated form. The obvious similarities between the
1H NMR spectra of CdSe-Cys-H
2SB QDs and Cd
2(SB)
2(H
2O)
4·8H
2O (
Figure 8) support that the interaction between CdSe-Cys QDs surface and H
2SB occurred via metal–ligand coordination. It must be noted that the differences in chemical shifts of CdSe-Cys-H
2SB QDs and Cd
2(SB)
2(H
2O)
4·8H
2O are due to the solvents used in each case, methanol–d
4/D
2O and dmso-d
6, respectively. The reason for this is the very different solubility of CdSe-Cys-H
2SB QDs and Cd
2(SB)
2(H
2O)
4·8H
2O.
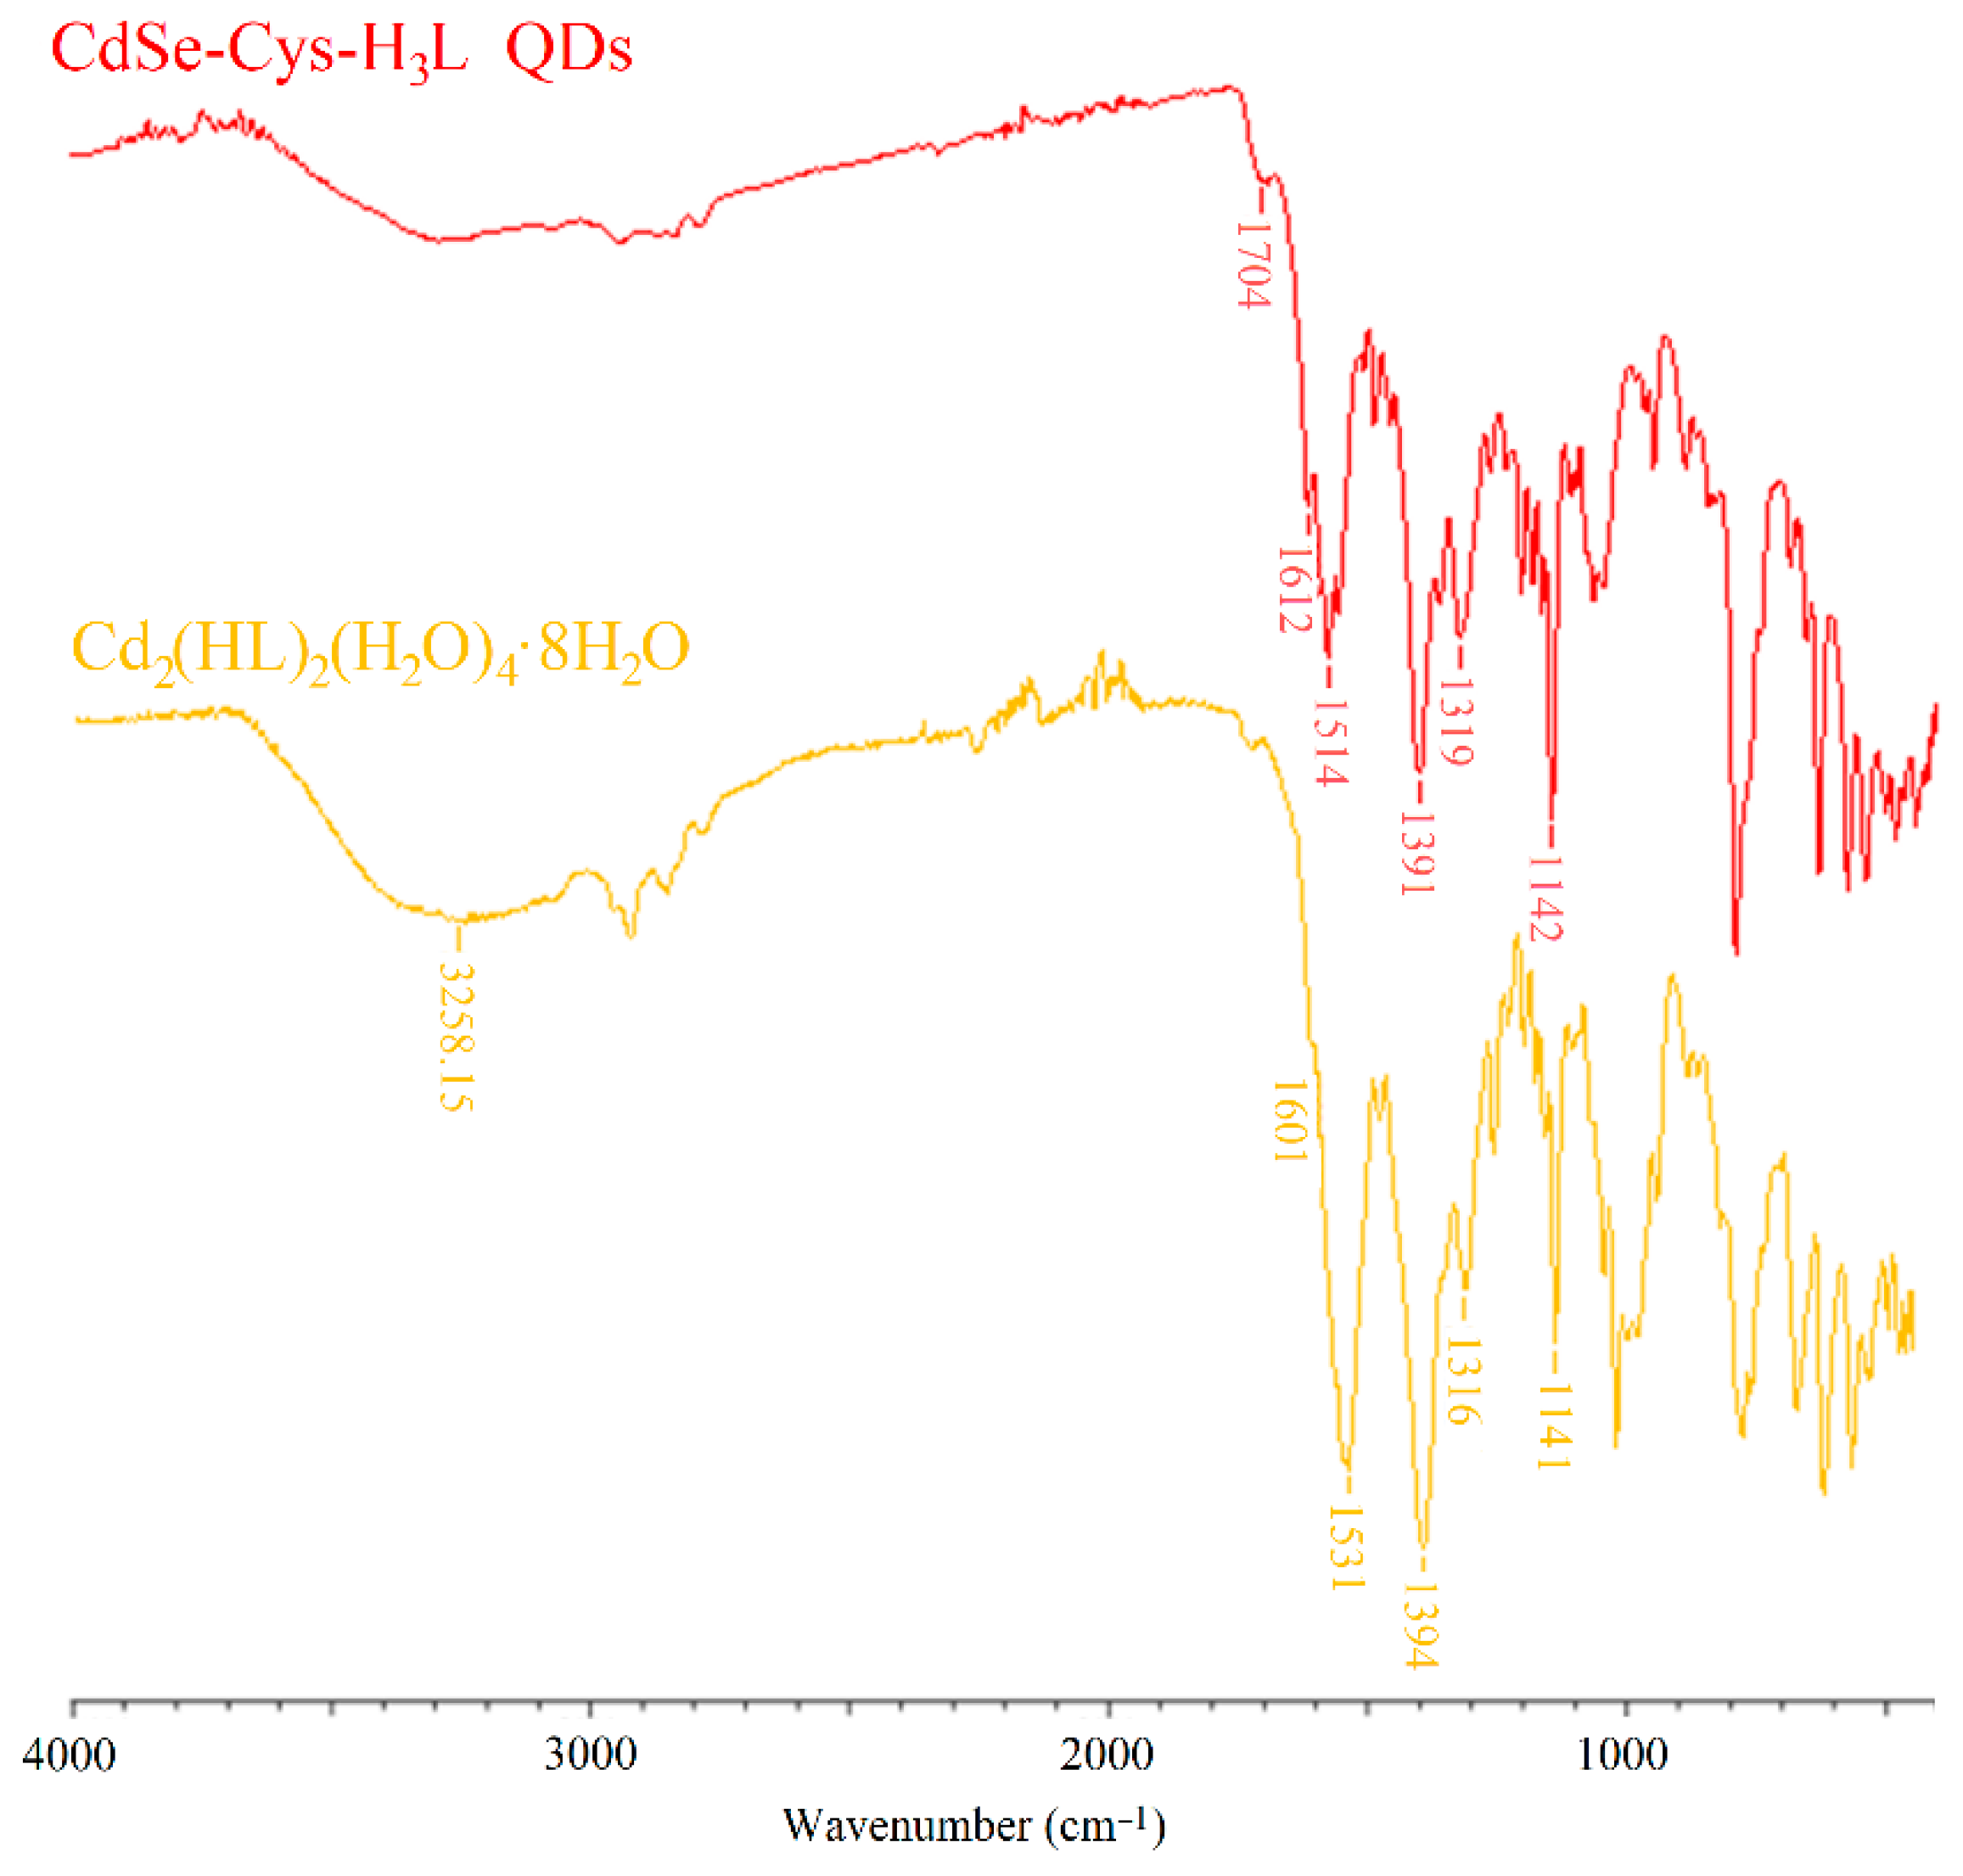
The IR spectrum of Cd
2(SB)
2(H
2O)
4·8H
2O showed a broad band centred at about 3360 cm
−1, attributable to ν(OH), which evidences the hydration of the obtained complex (
Figure 8). The observation of two bands attributable to ν
as(COO
−) and ν
s(COO
−) at ca. 1574 and 1393 cm
−1, respectively, seems to indicate the deprotonation of the carboxylic groups of the Schiff base in its complex. The neutrality of this complex is related to the zwitterionic nature adopted by the ligand units, where the carboxylic groups are deprotonated, while their amine N atoms are protonated.
The IR spectrum of CdSe-Cys-H
2SB QDs evidences the bideprotonation of the Schiff base ligand, as it showed the absence of bands attributable to ν OH/ν NH modes. Likewise, the presence of two bands attributable to ν
as(COO
−) and ν
s(COO
−), at about 1574 and 1391 cm
−1, respectively, evidences the deprotonation of the carboxyl group in the ligand, as it is indicative of the formation of the carboxylate sodium salt. In addition, the clear presence of a strong sharp band (ca. 1615 cm
−1) is attributed to the C=N group of the ligand. The similarity between the spectra of the ATR-IR spectra of CdSe-Cys-H
2SB QDs with Cd
2(SB)
2(H
2O)
4·8H
2O (
Figure 8) supports that the interaction between H
2SB and CdSe-Cys QD surfaces occurred via metal–ligand coordination through the N
sulfonamide, N
imine, and O
phenol atoms.
4. Experimental Section
4.1. Materials and Methods
The synthesis and characterisation of H
2SB and CdSe-Cys QDs have been previously reported [
3,
4]. The sample used for investigating the interaction of CdSe-Cys QDs with H
2SB was obtained by stirring, at room temperature, an ethanol solution of H
3L (pH = 9) with a suspension of CdSe-Cys QDs in 2:1 molar ratio, for about 15 min. The sample was subsequently air-dried.
1H NMR spectra (400 MHz) were measured in dmso-d6 using a Varian Inova 400 Spectrometer. J values are provided in Hertz. Diffuse reflectance spectra were measured on a PerkinElmer LAMBDA 1050+ UV/Vis/NIR spectrophotometer, equipped with an integrating sphere. The infrared spectra were measured in the 4000–400 cm−1 wavenumber range, using an FTIR spectrometer PerkinElmer Spectrum Two coupled with a Platinum Diamond ATR, consisting of a diamond disc as an internal reflection element.
4.2. Synthesis of Cd2(SB)2(H2O)4·8H2O
An ethanol solution of Cd(OAc)2·2H2O (40 mL, 0.0212 g, 0.0794 mmol) was added to of an ethanol solution (60 mL) of H2SB (0.0400 g, 0.0794 mmol). The resulting solution was refluxed for 4 h. During the reaction time, the coloured solution changed from greenish yellow to deep yellow. This solution was evaporated under vacuum to dryness. Then, the powdery solid was washed with diethyl ether, filtered, and air-dried.
Yield: 42 mg (40.6 %). 1H NMR (400 MHz, dmso-d6, δ in ppm): 8.60 (d, 1H), 8.30 (s, 1H), 8.28 (d, 1H), 8.17 (d, 1H), 7.49 (t, 1H), 7.43 (t, 1H), 7.27 (d, H), 7.27 (d, 1H), 7.22 (s, 1H), 7.15 (d, 1H), 7.07 (t, 1H), 7.07 (t, 1H), 6.97 (d, 1H), 6.97 (d, 1H), 3.97 (s, 2H), 2.81 (s, 6H). ATR-IR (ν in cm−1): 3347 br (ν OH, ν NH), 1614 m (ν CN), 1574 s (νas OCO), 1394 s (νs OCO), 1316 s (νas OSO), 1143 s (νs OSO). UV-Vis (ethanol, λ in nm) 217, 261, 349, 410 sh. Elemental analysis (found): C 45.1; H 5.0; N 5.5; S 4.4%; calc. for C54H54Cd2N6O14S2·8H2O: C 44.9; H 4.9; N 5.8; S, 4.4 (Mw: 1444.1 g·mol−1).


 ,
, 


